Article

Synthesis and Advanced Characterization of Polymer–Protein Core–Shell Nanoparticles

1
Department of Chemistry and Biochemistry, Northern Illinois University, DeKalb, IL 60115, USA
2
Argonne National Laboratory, X-ray Science Division, Lemont, IL 60439, USA
*
Author to whom correspondence should be addressed.
Catalysts 2021, 11(6), 730; https://doi.org/10.3390/catal11060730
Submission received: 2 May 2021 / Revised: 4 June 2021 / Accepted: 11 June 2021 / Published: 13 June 2021
(This article belongs to the Special Issue Towards Polymeric Biocatalysts)

Abstract

:
Enzyme immobilization techniques are widely researched due to their wide range of applications. Polymer–protein core–shell nanoparticles (CSNPs) have emerged as a promising technique for enzyme/protein immobilization via a self-assembly process. Based on the desired application, different sizes and distribution of the polymer–protein CSNPs may be required. This work systematically studies the assembly process of poly(4-vinyl pyridine) and bovine serum albumin CSNPs. Average particle size was controlled by varying the concentrations of each reagent. Particle size and size distributions were monitored by dynamic light scattering, ultra-small-angle X-ray scattering, small-angle X-ray scattering and transmission electron microscopy. Results showed a wide range of CSNPs could be assembled ranging from an average radius as small as 52.3 nm, to particles above 1 µm by adjusting reagent concentrations. In situ X-ray scattering techniques monitored particle assembly as a function of time showing the initial particle growth followed by a decrease in particle size as they reach equilibrium. The results outline a general strategy that can be applied to other CSNP systems to better control particle size and distribution for various applications.

1. Introduction

The self-assembly of functional bio-active materials is a promising field of research which has applications related multiple scientific disciplines including chemistry, medicine, bioengineering, and materials science. Self-assembled materials arise from multiple noncovalent intermolecular interactions. The often dynamic nature of these materials allow for the design of materials with self-healing, cytocompatibility, and biodegradable properties. Recent work has described the preparation of polymer–protein core–shell nanoparticles (CNSPs) [1,2,3,4,5]. These materials are prepared via a stepwise self-assembly process resulting a polymer core covered by a protein “corona” shell. The assembly process occurs via a mechanism similar to Pickering emulsions, in which proteins displace water at the interface of the polymer to reduce the interfacial energy [6,7,8,9]. The biomolecules on the surface of the polymer core are stabilized via hydrogen bonding interactions. This weak bonding interaction results in the formation of the protein corona which yields no loss in protein functionality [1,10,11,12,13]. This entropically driven, self-assembly process also allows for the size of the particles to be controlled. Synthesis can also be completed with a wide variety of biomolecules which open the door for applications related to general enzyme stabilization, drug delivery, imaging, and catalysis. Although much research has been done related to the composition and applications of the polymer protein CSNPs, there has not been a thorough study on the particle size tunability and assembly process.
Dynamic light scattering (DLS) has shown to be a powerful technique for determining the size and distribution of colloidal systems [14,15,16,17,18]. DLS is based on the Brownian motion of dispersed particles and measures fluctuations in the intensity of scattered light caused by constructive and destructive interference [19]. DLS instruments determine particle size and distribution based on a few factors including sample temperature, viscosity, and refractive index [20]. Accurate size determinations also require samples to be a clear, infinitely dilute solution, per the Stokes–Einstein equation. Overly concentrated solutions lead to multiple scattering and particle–particle interactions which produce an artificially lower particle size measurement [21]. DLS has shown to be an extremely useful technique for characterizing colloidal systems but suffers from inherent limitations. The synthesized polymer–protein CSNPs in this work were well characterized via DLS, but the technique lacks the ability to study particle formation during the assembly process as it requires a high-concentration solution.
X-ray scattering techniques such as small-angle (SAXS) and ultra-small-angle X-ray scattering (USAXS) offer distinct advantages over traditional light scattering techniques. SAXS is a technique which measures scattered X-rays as a result of variations in electron density within a sample [22,23]. The 2D detector measures scattered X-rays at low angles. The 2D detector image is integrated to yield I(Q) vs. Q, where Q = (4π/λ)(sin θ) for scattering angle 2θ (λ = wavelength of the X-ray). SAXS data can provide structural information related to size, shape, surface structure, distribution, and relative distance to other objects for features from 1 nm to up to 100 nm [22,23,24,25,26,27]. In contrast to DLS, X-ray-based techniques such as SAXS do not have limitations based on the concentration, color, fluorescence, or temperature of the sample. USAXS extends the 100 nm size limitation of SAXS by utilizing Bonse-Hart double crystal to collect discernible data at even lower scattering angles, allowing measurements of features up to 1 µm in size [28,29].
This work utilizes advanced characterization techniques such as SAXS and USAXS to investigate the assembly process of polymer–protein CSNPs. Poly(4-vinylpyridine) (P4VP) was used for the polymer while bovine serum albumin (BSA) served as the protein shell. DLS and transmission electron microscopy (TEM) were used to study the effect reagent concentration has on particle size including demonstrating the upper and lower limits for which assembly occurs. Particle size and distribution play an especially important role related to specific applications. For example, for biomedical and drug delivery applications the accepted particle size range is ≤100 nm [30,31]. While for other processes, such as use as an industrial catalyst, larger particle sizes may be more desirable for easier separation from the product stream.

2. Results and Discussion

2.1. BSA-P4VP Core–Shell Nanoparticle Synthesis

All CSNP unless noted otherwise were prepared in a 3.7 mL glass vial by adding 0.12 mL of P4VP in MeOH to 0.5 mL of BSA in an aqueous buffer solution. A series of identical reactions were completed with varied reagent concentrations. Based on the described solution volumes, reactions involving reagents of equal concentrations results in a polymer-to-protein mass ratio of 0.24. Previous work has discussed the ability to control the size of polymer–protein CSNPs by altering the polymer solution volume and, therefore, the polymer–protein mass ratio [1,2]. To further investigate the limits of the polymer–protein self-assembly method, BSA and P4VP solutions were prepared at concentrations of 0.5, 1.0, 2.0, 4.0, 6.0, 10.0, and 15.0 mg/mL. Reactions were run for all possible reagent concentration combinations. Each reaction underwent the evaporation purification process which involves letting the solution stir in open air at 25 °C for 48 h. This allows the methanol from the P4VP solution to evaporate, resulting in the CSNPs in the aqueous buffer solution. For the other purification method, dialysis, the solution is transferred to a dialysis tube after the initial thirty-minute reaction time. The dialysis tube is then suspended in a 1.0 L solution of the HEPES/NaCl buffer solution while stirring. The 1.0 L solution is replaced with a fresh solution after 2, 4, 8, and 12 h. The key difference with the dialysis method is that the porous dialysis tubing allows excess, unreacted protein to be removed from the reaction solution.

2.2. Particle Size Characterization of CSNPs

The particle size and distribution of the P4VP-BSA CSNPs was investigated with DLS and TEM. DLS measurements were collected on each of CSNP reactions. Figure 1a shows an overview of the size distribution based on the BSA and P4VP concentrations. The plot shows that the smallest particles, with a radius of 52.3 nm, are obtained when the protein concentration is the highest (15 mg/mL) and the P4VP concentration is the lowest (0.5 mg/mL). The average particle size increases as the P4VP concentration increases and vice versa decreases as the BSA concentration is lowered. This is consistent with previous work which demonstrates that particle size can be controlled as the polymer–protein mass ratio is adjusted [1,12,32]. A table containing the average particle radii can be seen in Table S1. For reactions with the standard 0.24 polymer-to-protein mass ratio, the data shows that particle size decreases as the concentration of both reagents increases. For simplification purposes, reactions will be described using a PXBY format, where “P” represents P4VP, “B” represents BSA, and “X” and “Y” signify their respective concentrations (mg/mL). When comparing the particle size as the concentration of each reagent is adjusted, it becomes evident the amount of protein available in the solution has a much larger effect on particle size than the polymer. For example, for reactions P0.5B15 and P15B15, CSNPs are formed with an average radius of 52.3 and 117.5 nm, respectively. The increase from 0.5 to 15 mg/mL P4VP results in a 224.7% increase in particle size. When comparing to reactions P0.5B1 and P15B1, the average CSNP radius increases from 309.6 to 4107.1 nm, a 1326.6% increase. This increase even more pronounced for reactions of P>2B0.5 where the resulting particle formed reached the upper limit of detection for the DLS instrument and could not be accurately measured. Figure 1b shows the DLS lognormal size distributions for three different CSNP reactions. For the three reactions plotted, P0.5B2, P2B2, and P15B2, an obvious increase in particle distribution is seen as the P4VP concentration is increased. For all BSA-P4VP reactions, an increase in average particle size is also associated with the increase in particle distribution. These results show how the average CSNP size and distribution can be controlled by varying reagent concentration and easily monitored via DLS.

2.3. In-Situ CSNP Characterization via USAXS

In situ USAXS and SAXS were used to investigate the polymer–protein CSNP assembly process. A reaction vial was setup on the synchrotron X-ray beamline with a 12 V peristaltic pump providing constant flow through a complete circuit which moved the solution to the X-ray path and back to the reaction vial. An illustration of the flow cell and beamline setup can be seen in Figure 2a. The detecting components for both SAXS and USAXS experiments are mounted on high precision, micro-stepping motors which allows them to be quickly moved in and out of the beam path without needing recalibration. This allows for sequential SAXS and USAXS scans with downtime on the order of seconds. For each in situ USAXS/SAXS experiment, reagents were combined in an open-air beaker following procedures described in the experimental section. Initially, reactions of P2B2 were measured but the relatively low concentration lacked scattering intensity and was unable to yield an acceptable signal to noise ratio. After incrementally increasing reagent concentrations, a P10B10 reaction yielded acceptable scattering intensity, as seen in the combined USAXS and SAXS scattering profiles seen in Figure 2b. The CSNP reaction was measured for 180 min, after which no structural changes could be observed. The USAXS/SAXS data was combined, processed, and fit using the Nika and Irena packages as part of the Igor Pro software [33,34]. Each scan shows to distinct features at different q ranges. The low q range (0.0003–0.002) feature is generated by the CSNPs while the high q (0.02–0.4) feature is characteristic of free, unbonded BSA in the solution [35,36]. Each of these scattering features were fit using lognormal size distribution models. Figure 2c shows a plot of the lognormal size distribution of the CSNPs as a function of time. The first scan, collected one minute after the reaction, shows particles with a lognormal mean radius of 236.1 nm. After twenty minutes the CSNPs begin to stabilize and are no longer increasing in size. Over the next 180 min the particles slowly start to reduce their average size as distribution stays the same. After 200 min, the particles stabilized resulting in a lognormal mean radius of 176.7 nm. The data shows that the bulk of CSNP assembly occurs within the first twenty minutes, however the slow reduction in particle size after the initial formation suggests that particle stabilization continues to occur for up to five hours. The average radius calculated from the USAXS data is consistent with DLS measurements, which returned an average radius of 182.2 nm for these particles.

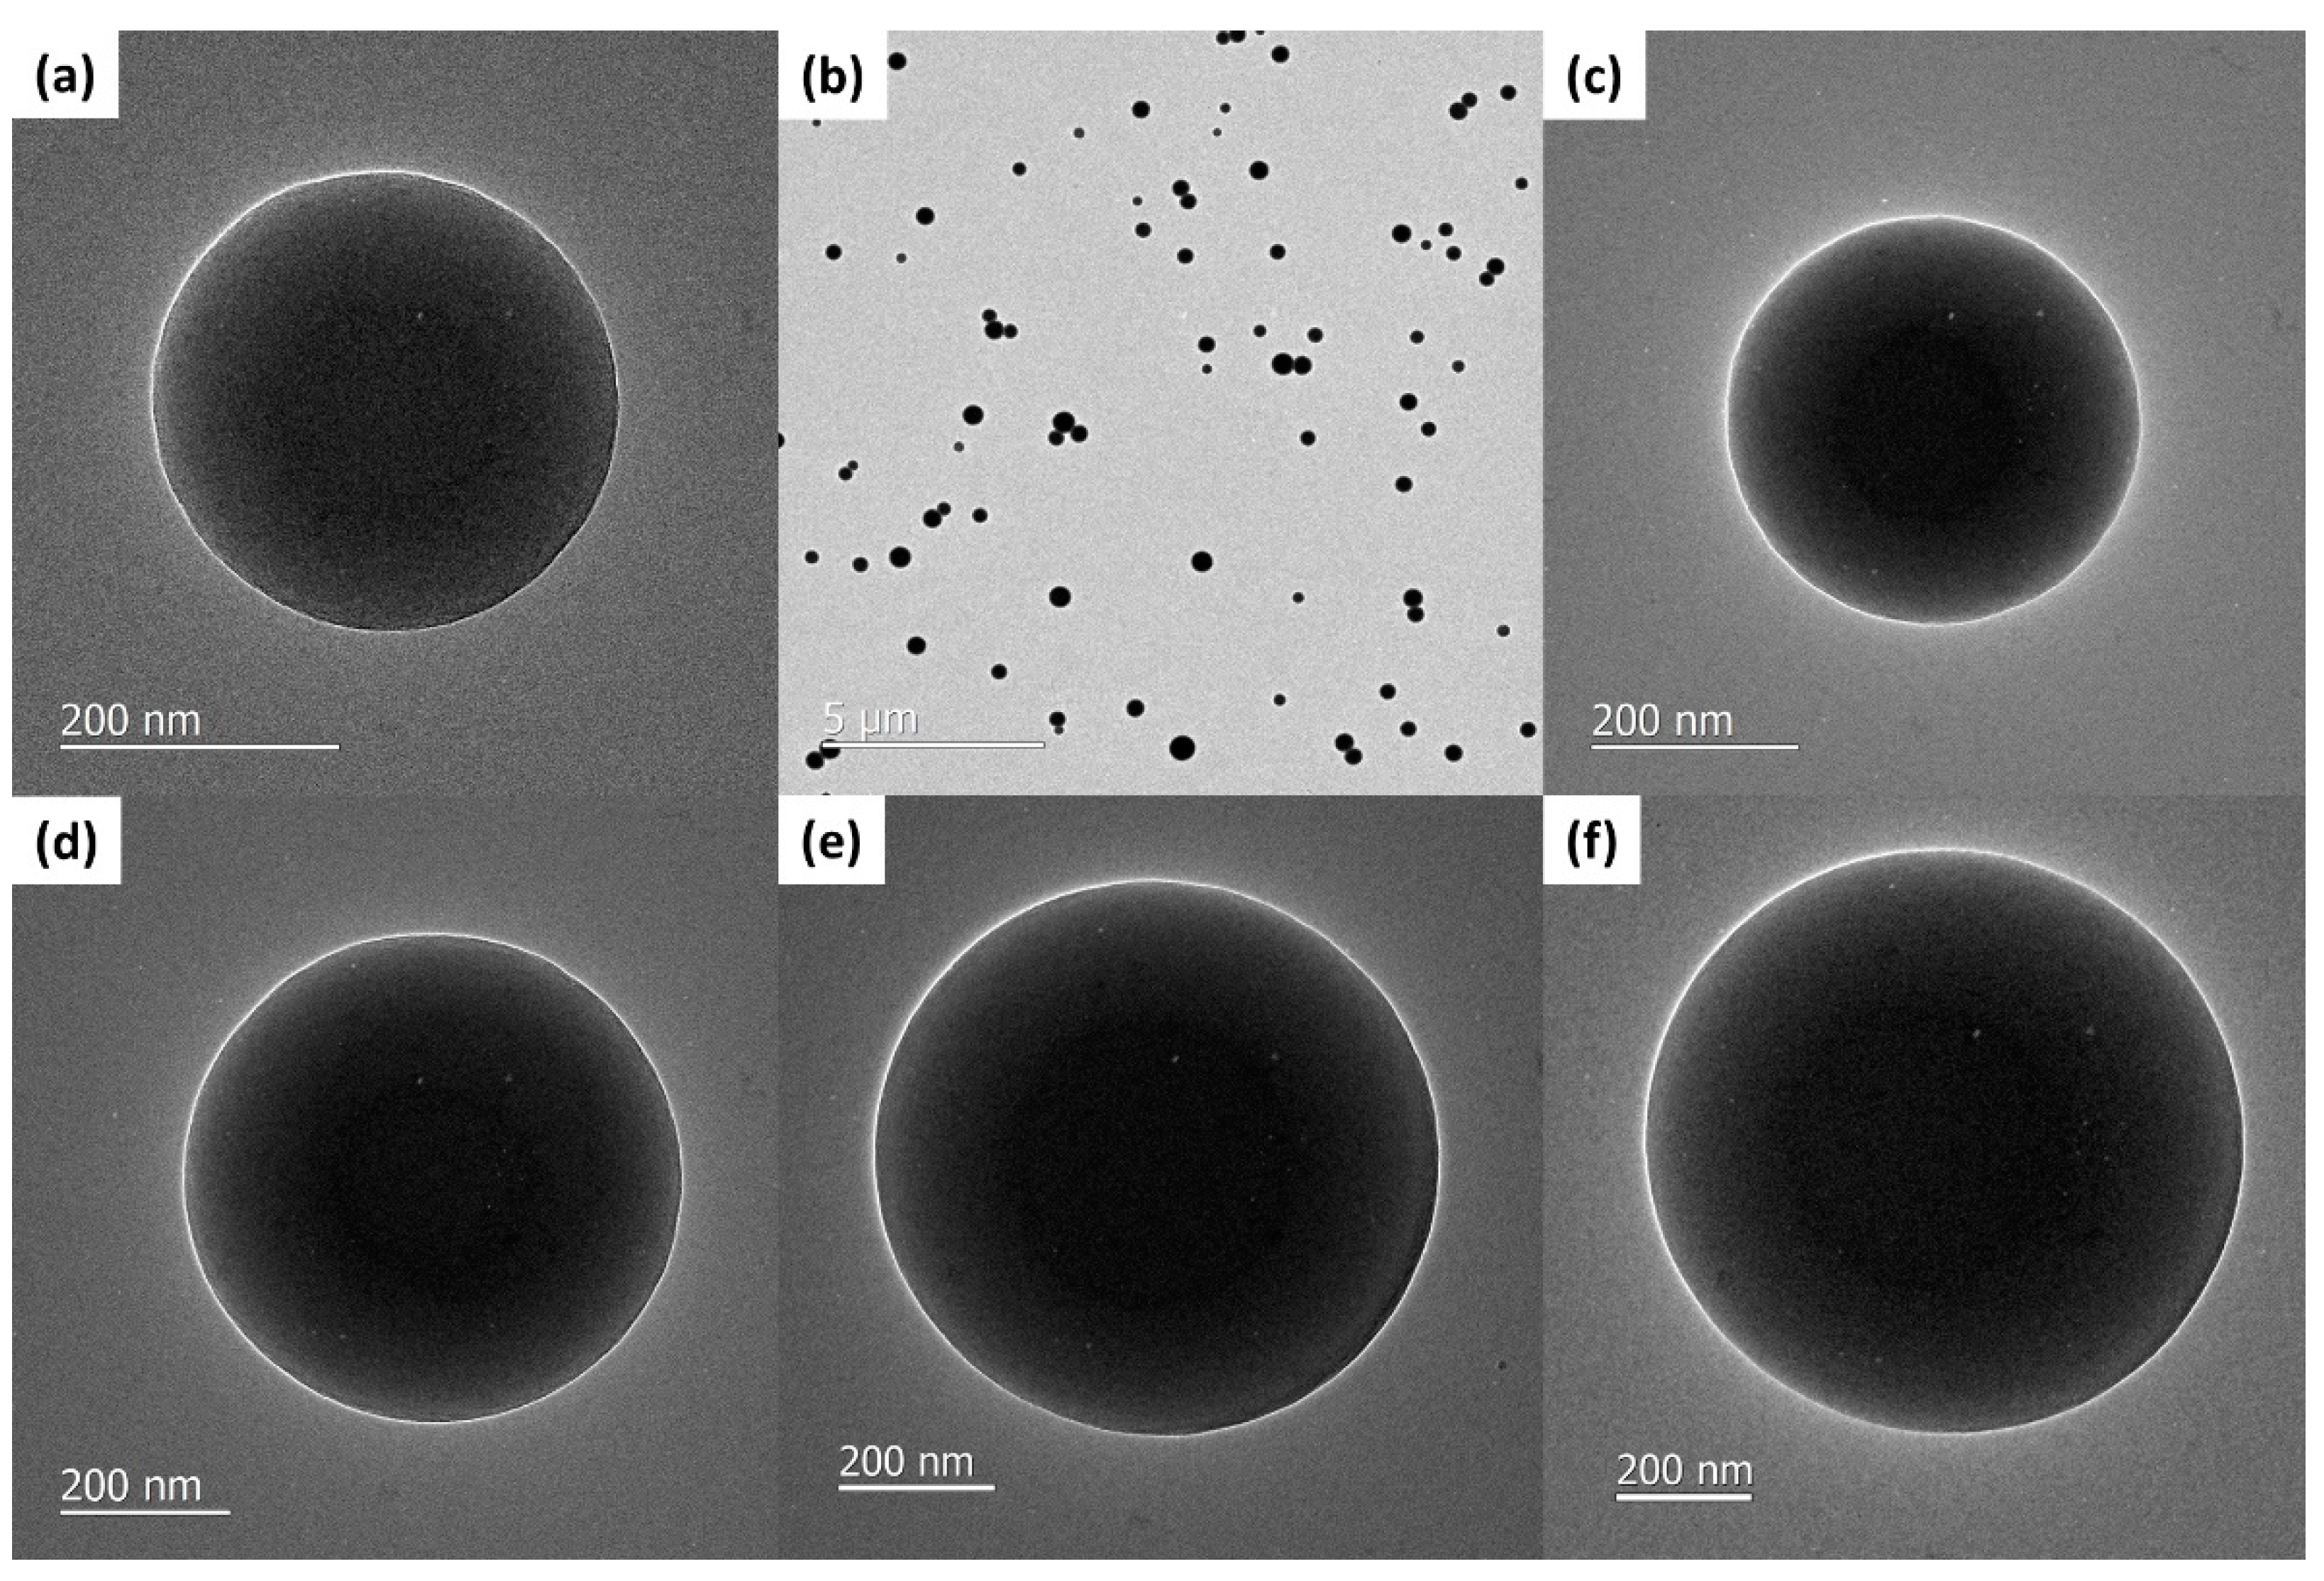
2.4. Transmission Electron Microscopy (TEM) Characterization

DLS and USAXS provided valuable information related to particle size and distribution of the CSNP systems. To further characterize the CSNPs and analyze particle features such as shape and morphology, TEM images were obtained. Figure 3 shows TEM images from a series of P4VP-BSA reactions. The particles seen in the figure show a gradual increase in diameter as the polymer–protein mass ratio is increased. The TEM measured particle size radius in Figure 3a,c–f are 168, 200, 300, 361, and 440 nm, respectively. The high-magnification images demonstrate the uniform spherical shape and smooth surface. It is worth noting that as particle size increases towards the upper limit, there is no identifiable degeneration of the spherical shape or surface smoothness. Figure 3b also shows a low magnification image of a CSNP reaction. Based on particle size distributions determined via DLS and USAXS data fitting, the range of particle sizes seen in Figure 3b are well within the expected range. The results seen in the TEM images provide useful insight that cannot be obtained by scattering techniques such as DLS and USAXS. These results also help confirm the particle sizes evaluated by these techniques.

3. Experimental Methods

Materials. BSA (≥98%) and poly(4-vinylpyridine) (P4VP, M W 60,000) were purchased from Sigma-Aldrich (St. Louis, MO, USA). 4-(2-hydroxyethyl)-1-piperazineethanesulfonic acid (HEPES; 99%) was purchased from Acros Organics (Fair Lawn, NJ, USA). Sodium chloride was purchased from Fisher Scientific (Waltham, MA, USA). Sodium hydroxide pellets were purchased from the Ricca Chemical Company (Arlington, TX, USA). All water used in this experiment was of ultrapure type I purity (18.2 MΩ · cm) obtained via an Elga Purelab Flex2 system (Elga LabWater, High Wycombe, UK). Float-A-Lyzer®G2 dialysis devices (1000 kDa) used for dialysis were purchased from Spectrum Labs (New Brunswick, NJ, USA). All dialysis devices were pre-treated via a 10% ethanol bath for ten minutes before thoroughly rinsing in DI H2O, as per manufacturer instructions.

3.1. BSA-P4VP Core-Shell Nanoparticle Synthesis

For a typical reaction, P4VP ( M W 60,000) in MeOH (2.0 mg/mL, 0.12 mL) was added in 40 µL increments to a 3.7 mL glass vial containing 0.5 mL of a BSA solution (2.0 mg/mL) in a 10 mM HEPES, 125 mM NaCl buffer. The solution was constantly stirred during the mixing of reagents. The vial was then sealed for thirty minutes before undergoing either dialysis or evaporation purification methods.

3.2. DLS Characterization

DLS measurements were performed on a Nanobrook Omni by Brookhaven Instruments (Holtsville, NY, USA) with an incident laser with a wavelength of 640 nm and a detection angle of 90°. For a typical P2B2 measurement, the CSNP solution (7.0 µL) was diluted to 2.0 mL with DI H2O. The resulting solution was then transferred to a standard plastic cuvette. Each DLS measurement is the average of five consecutive five-minute scans. Sample dilutions were adjusted accordingly as the reagent concentrations were increased or decreased to ensure the dilute limit required for DLS was met.

3.3. USAXS/SAXS Characterization

USAXS and SAXS measurements were performed at the 9-ID-C beamline at the Advanced Photon Source at Argonne National Laboratory (Lemont, IL, USA) [37]. The X-ray energy was 24 keV with exposure times of 120 s and 20 s for USAXS and SAXS measurements, respectively. The flow cell in the X-ray path was constantly cycles with the CSNP solution using a 12 V peristaltic pump with a flow rate of 3.0 mL/min. The solution was stirred at 300 RPM using a magnetic stir bar during the entirety of the experiment. Data processing and fitting was done using the Irena [33] software suite by J. Ilavsky and P. R. Jemian (Lemont, IL, USA). The Irena program operates as a module of the Igor Pro software package (Wavemetrics, Portland, OR, USA).

3.4. TEM Characterization

FE-TEM was performed using a JEOL JEM2100F microscope operated at 200 kV (JEOL, Peabody, MA, USA). Images were collected in both high and low magnification modes. Samples were prepared on 400 mesh carbon-coated copper grids (Ted Pella INC., Redding, CA, USA). For each sample, a grid was submerged in a 100 µL droplet containing a 50:50 mixture of sample solution and ultra-pure DI H2O. Grids were left in the droplet for ten minutes before being transferred to another 100 µL droplet of ultra-pure DI H2O to rinse. After ten minutes, the grids were removed and allowed to dry.

4. Conclusions

In summary, both in situ and ex situ characterization techniques were used to monitor the assembly process of polymer–protein CSNPs. To the best of our knowledge, this work describes the first ever monitoring of polymer–protein CSNP assembly via USAXS. The in situ USAXS/SAXS experimental setup was able to monitor the evolution of CSNP particle size and distribution for the entirety of the assembly process. DLS and TEM were also used to outline a series of reactions which provides the foundation for the synthesis of P4VP-BSA CSNPs ranging from ~100 nm to 1.2 µm in diameter. Going forward, the ability to control particle size by altering the polymer–protein mass ratio can be applied to research looking to utilize other polymer/protein combinations. The in situ USAXS experiment also demonstrated the gradual particle size changes as a function of time. In future work, we plan to experiment with stopping the assembly process prior to completion to investigate its effect on particle size and distribution.

Supplementary Materials

The following are available online at https://www.mdpi.com/article/10.3390/catal11060730/s1, Table S1: CSNP average radius (nm) measured by DLS.

Author Contributions

Conceptualization, T.L.; methodology, T.L. and E.S; software, E.S.; validation, T.L. and E.S.; formal analysis, T.L. and E.S.; investigation, T.L. and E.S.; resources, T.L.; data curation, E.S.; writing—original draft preparation, E.S.; writing—review and editing, T.L. and E.S.; visualization, T.L.; supervision, T.L.; project administration, T.L.; funding acquisition, T.L. All authors have read and agreed to the published version of the manuscript.

Funding

This research received no external funding.

Data Availability Statement

Data is contained within the article or supplementary material.

Acknowledgments

T. Li is thankful for the support from the NIU startup. This research used resources of the Advanced Photon Source, a U.S. Department of Energy (DOE) Office of Science User Facility, operated for the DOE Office of Science by Argonne National Laboratory under Contract No. DE-AC02-06CH11357.

Conflicts of Interest

The authors declare no conflict of interest.

References

  1. Suthiwangcharoen, N.; Li, T.; Wu, L.; Reno, H.B.; Thompson, P.; Wang, Q. Facile Co-Assembly Process to Generate Core–Shell Nanoparticles with Functional Protein Corona. Biomacromolecules 2014, 15, 948–956. [Google Scholar] [CrossRef]
  2. Sarnello, E.; Liu, Y.; Palen, B.; Sun, E.; Zuo, X.; Xu, T.; Li, T. Synthesis and Characterization of Bio-Active GFP-P4VP Core–Shell Nanoparticles. Catalysts 2020, 10, 627. [Google Scholar] [CrossRef]
  3. Zhang, X.; Zhao, X.; Luckanagul, J.A.; Yan, J.; Nie, Y.; Lee, L.A.; Wang, Q. Polymer–Protein Core–Shell Nanoparticles for Enhanced Antigen Immunogenicity. ACS Macro Lett. 2017, 6, 442–446. [Google Scholar] [CrossRef]
  4. Schroffenegger, M.; Leitner, N.S.; Morgese, G.; Ramakrishna, S.N.; Willinger, M.; Benetti, E.M.; Reimhult, E. Polymer Topology Determines the Formation of Protein Corona on Core–Shell Nanoparticles. ACS Nano 2020, 14, 12708–12718. [Google Scholar] [CrossRef]
  5. Zhou, J.; Hu, J.; Li, M.; Li, H.; Wang, W.; Liu, Y.; Winans, R.E.; Li, T.; Liu, T.; Yin, P. Hydrogen bonding directed co-assembly of polyoxometalates and polymers to core–shell nanoparticles. Mater. Chem. Front. 2018, 2, 2070–2075. [Google Scholar] [CrossRef]
  6. Russell, J.T.; Lin, Y.; Böker, A.; Su, L.; Carl, P.; Zettl, H.; He, J.; Sill, K.; Tangirala, R.; Emrick, T.; et al. Self-Assembly and Cross-Linking of Bionanoparticles at Liquid–Liquid Interfaces. Angew. Chem. Int. Ed. 2005, 44, 2420–2426. [Google Scholar] [CrossRef] [PubMed]
  7. Brown, A.A.; Azzaroni, O.; Fidalgo, L.M.; Huck, W.T.S. Polymer brush resist for responsive wettability. Soft Matter 2009, 5, 2738–2745. [Google Scholar] [CrossRef]
  8. Binks, B.P.; Lumsdon, S.O. Catastrophic Phase Inversion of Water-in-Oil Emulsions Stabilized by Hydrophobic Silica. Langmuir 2000, 16, 2539–2547. [Google Scholar] [CrossRef]
  9. Lin, Y.; Skaff, H.; Emrick, T.; Dinsmore, A.D.; Russell, T.P. Nanoparticle Assembly and Transport at Liquid-Liquid Interfaces. Science 2003, 299, 226–229. [Google Scholar] [CrossRef] [Green Version]
  10. Wu, L.; Li, T.; Blom, D.; Zhao, J.; Ghoshroy, S.; Wang, Q. Synthesis and electron microscopic analysis of the self-assembly of polymer and ferritin core-shell structures. Microsc. Res. Tech. 2011, 74, 636–641. [Google Scholar] [CrossRef]
  11. Li, T.; Ye, B.; Niu, Z.; Thompson, P.; Seifert, S.; Lee, B.; Wang, Q. Closed-Packed Colloidal Assemblies from Icosahedral Plant Virus and Polymer. Chem. Mater. 2009, 21, 1046–1050. [Google Scholar] [CrossRef]
  12. Li, T.; Wu, L.; Suthiwangcharoen, N.; Bruckman, M.A.; Cash, D.; Hudson, J.S.; Ghoshroy, S.; Wang, Q. Controlled assembly of rodlike viruses with polymers. Chem. Commun. 2009, 20, 2869–2871. [Google Scholar] [CrossRef] [Green Version]
  13. Suthiwangcharoen, N.; Li, T.; Li, K.; Thompson, P.; You, S.; Wang, Q. M13 bacteriophage-polymer nanoassemblies as drug delivery vehicles. Nano Res. 2011, 4, 483–493. [Google Scholar] [CrossRef]
  14. Wagner, J.; Härtl, W.; Hempelmann, R. Characterization of Monodisperse Colloidal Particles:  Comparison between SAXS and DLS. Langmuir 2000, 16, 4080–4085. [Google Scholar] [CrossRef]
  15. Castro, E.; Taboada, P.; Barbosa, S.; Mosquera, V. Size Control of Styrene Oxide−Ethylene Oxide Diblock Copolymer Aggregates with Classical Surfactants:  DLS, TEM, and ITC Study. Biomacromolecules 2005, 6, 1438–1447. [Google Scholar] [CrossRef] [PubMed]
  16. Lehmann, M.; Tabaka, W.; Möller, T.; Oppermann, A.; Wöll, D.; Volodkin, D.; Wellert, S.; Klitzing, R.v. DLS Setup for in Situ Measurements of Photoinduced Size Changes of Microgel-Based Hybrid Particles. Langmuir 2018, 34, 3597–3603. [Google Scholar] [CrossRef] [PubMed]
  17. Martin, J.R.S.; Bihannic, I.; Santos, C.; Farinha, J.P.S.; Demé, B.; Leermakers, F.A.M.; Pinheiro, J.P.; Rotureau, E.; Duval, J.F.L. Structure of Multiresponsive Brush-Decorated Nanoparticles: A Combined Electrokinetic, DLS, and SANS Study. Langmuir 2015, 31, 4779–4790. [Google Scholar] [CrossRef] [PubMed]
  18. Chen, Z.H.; Kim, C.; Zeng, X.-b.; Hwang, S.H.; Jang, J.; Ungar, G. Characterizing Size and Porosity of Hollow Nanoparticles: SAXS, SANS, TEM, DLS, and Adsorption Isotherms Compared. Langmuir 2012, 28, 15350–15361. [Google Scholar] [CrossRef]
  19. Aragón, S.R.; Pecora, R. Theory of dynamic light scattering from polydisperse systems. J. Chem. Phys. 1976, 64, 2395–2404. [Google Scholar] [CrossRef]
  20. Lorber, B.; Fischer, F.; Bailly, M.; Roy, H.; Kern, D. Protein analysis by dynamic light scattering: Methods and techniques for students. Biochem. Mol. Biol. Educ. 2012, 40, 372–382. [Google Scholar] [CrossRef]
  21. Goldburg, W.I. Dynamic light scattering. Am. J. Phys. 1999, 67, 1152–1160. [Google Scholar] [CrossRef] [Green Version]
  22. Turkevich, J.; Hubbell, H.H. Low Angle X-Ray Diffraction of Colloidal Gold and Carbon Black1a. J. Am. Chem. Soc. 1951, 73, 1–7. [Google Scholar] [CrossRef]
  23. Rieker, T.P.; Hubbard, P.F. The University of New Mexico/Sandia National Laboratories small-angle scattering laboratory. Rev. Sci. Instrum. 1998, 69, 3504–3509. [Google Scholar] [CrossRef]
  24. Jemian, P.R.; Weertman, J.R.; Long, G.G.; Spal, R.D. Characterization of 9Cr-1MoVNb steel by anomalous small-angle X-ray scattering. Acta Metall. Mater. 1991, 39, 2477–2487. [Google Scholar] [CrossRef]
  25. Li, T.; Senesi, A.J.; Lee, B. Small Angle X-ray Scattering for Nanoparticle Research. Chem. Rev. 2016, 116, 11128–11180. [Google Scholar] [CrossRef]
  26. Ilavsky, J.; Jemian, P.R.; Allen, A.J.; Zhang, F.; Levine, L.E.; Long, G.G. Ultra-small-angle X-ray scattering at the Advanced Photon Source. J. Appl. Crystallogr. 2009, 42, 469–479. [Google Scholar] [CrossRef]
  27. Thiele, E. Equation of State for Hard Spheres. J. Chem. Phys. 1963, 39, 474–479. [Google Scholar] [CrossRef]
  28. Bonse, U.; Hart, M. Tailless X-ray Single-crystal Reflection Curves Obtained by Multiple Reflection. Appl. Phys. Lett. 1965, 7, 238–240. [Google Scholar] [CrossRef]
  29. Ilavsky, J.; Allen, A.J.; Long, G.G.; Jemian, P.R. Effective pinhole-collimated ultrasmall-angle x-ray scattering instrument for measuring anisotropic microstructures. Rev. Sci. Instrum. 2002, 73, 1660–1662. [Google Scholar] [CrossRef]
  30. Cascone, M.G.; Lazzeri, L.; Carmignani, C.; Zhu, Z. Gelatin nanoparticles produced by a simple W/O emulsion as delivery system for methotrexate. J. Mater. Sci. Mater. Med. 2002, 13, 523–526. [Google Scholar] [CrossRef] [PubMed]
  31. De Jong, W.H.; Borm, P.J.A. Drug delivery and nanoparticles:applications and hazards. Int. J. Nanomed. 2008, 3, 133–149. [Google Scholar] [CrossRef] [Green Version]
  32. Li, T.; Zan, X.; Sun, Y.; Zuo, X.; Li, X.; Senesi, A.; Winans, R.E.; Wang, Q.; Lee, B. Self-Assembly of Rodlike Virus to Superlattices. Langmuir 2013, 29, 12777–12784. [Google Scholar] [CrossRef] [PubMed]
  33. Ilavsky, J.; Jemian, P.R. Irena: Tool Suite for Modeling and Analysis of Small Angle Scattering. J. Appl. Crystallogr. 2009, 42, 347–353. [Google Scholar] [CrossRef]
  34. Ilavsky, J. Nika: Software for two-dimensional data reduction. J. Appl. Crystallogr. 2012, 45, 324–328. [Google Scholar] [CrossRef]
  35. Zhang, F.; Skoda, M.W.A.; Jacobs, R.M.J.; Martin, R.A.; Martin, C.M.; Schreiber, F. Protein Interactions Studied by SAXS:  Effect of Ionic Strength and Protein Concentration for BSA in Aqueous Solutions. J. Phys. Chem. B 2007, 111, 251–259. [Google Scholar] [CrossRef] [PubMed]
  36. Santos, S.F.; Zanette, D.; Fischer, H.; Itri, R. A systematic study of bovine serum albumin (BSA) and sodium dodecyl sulfate (SDS) interactions by surface tension and small angle X-ray scattering. J. Colloid Interface Sci. 2003, 262, 400–408. [Google Scholar] [CrossRef]
  37. Ilavsky, J.; Zhang, F.; Allen, A.J.; Levine, L.E.; Jemian, P.R.; Long, G.G. Ultra-Small-Angle X-ray Scattering Instrument at the Advanced Photon Source: History, Recent Development, and Current Status. Metall. Mater. Trans. A 2013, 44, 68–76. [Google Scholar] [CrossRef]
Figure 1. (a) Plot of the DLS mean particle size for reactions with each of the varying P4VP and BSA concentrations. (b) DLS lognormal distribution for three reactions increasing in P4VP concentration.
Catalysts 11 00730 g001
Figure 2. (a) Representation of the in situ experimental setup for the flow cell. The red arrows indicate the vertical motion path of the SAXS vacuum chamber and detectors. Blue vertical lines represent beam slits as part of the beamline optics. Black arrows indicate the two crystal stages used for the Bonse-Hart X-ray optics configuration. (b) Combined USAXS/SAXS CSNP data as a function of time. (c) Lognormal size distribution data from fitting the data in the USAXS range.
Catalysts 11 00730 g002
Figure 3. (a) TEM image of a CSNP from a P0.5B2 reaction. (b) low magnification TEM image from the P0.5B1 reaction. (cf) CSNP images from P1B2, P2B2, P4B2, and P6B2 reactions, respectively.
Catalysts 11 00730 g003
Publisher’s Note: MDPI stays neutral with regard to jurisdictional claims in published maps and institutional affiliations.

