Article

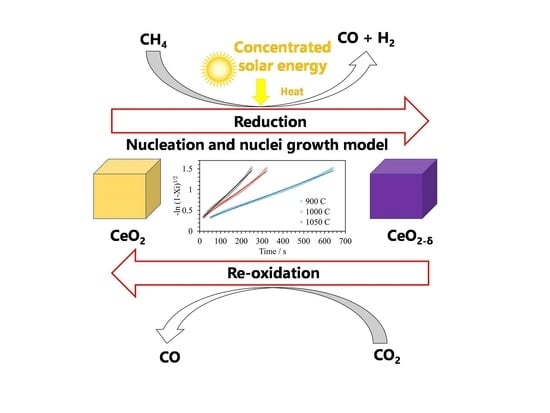
Solid-State Redox Kinetics of CeO2 in Two-Step Solar CH4 Partial Oxidation and Thermochemical CO2 Conversion

by
Mahesh Muraleedharan Nair
and
Stéphane Abanades
*
Processes, Materials and Solar Energy Laboratory, PROMES-CNRS (UPR 8521), 7 Rue du Four Solaire, 66120 Font-Romeu Odeillo, France
*
Author to whom correspondence should be addressed.
Catalysts 2021, 11(6), 723; https://doi.org/10.3390/catal11060723
Submission received: 10 May 2021 / Revised: 8 June 2021 / Accepted: 9 June 2021 / Published: 10 June 2021
(This article belongs to the Special Issue Catalysts in Production of Clean Gasification Gas)

Abstract

:
The CeO2/CeO2−δ redox system occupies a unique position as an oxygen carrier in chemical looping processes for producing solar fuels, using concentrated solar energy. The two-step thermochemical ceria-based cycle for the production of synthesis gas from methane and solar energy, followed by CO2 splitting, was considered in this work. This topic concerns one of the emerging and most promising processes for the recycling and valorization of anthropogenic greenhouse gas emissions. The development of redox-active catalysts with enhanced efficiency for solar thermochemical fuel production and CO2 conversion is a highly demanding and challenging topic. The determination of redox reaction kinetics is crucial for process design and optimization. In this study, the solid-state redox kinetics of CeO2 in the two-step process with CH4 as the reducing agent and CO2 as the oxidizing agent was investigated in an original prototype solar thermogravimetric reactor equipped with a parabolic dish solar concentrator. In particular, the ceria reduction and re-oxidation reactions were carried out under isothermal conditions. Several solid-state kinetic models based on reaction order, nucleation, shrinking core, and diffusion were utilized for deducing the reaction mechanisms. It was observed that both ceria reduction with CH4 and re-oxidation with CO2 were best represented by a 2D nucleation and nuclei growth model under the applied conditions. The kinetic models exhibiting the best agreement with the experimental reaction data were used to estimate the kinetic parameters. The values of apparent activation energies (~80 kJ·mol−1 for reduction and ~10 kJ·mol−1 for re-oxidation) and pre-exponential factors (~2–9 s−1 for reduction and ~123–253 s−1 for re-oxidation) were obtained from the Arrhenius plots.

Graphical Abstract

1. Introduction

Oxygen carriers based on nonstoichiometric metal oxides play prominent roles in the development of chemical looping processes, the two-step thermochemical splitting of H2O/CO2, air separation, thermochemical energy storage, and the chemical looping combustion (CLC) of hydrocarbon fuels [1,2,3,4,5,6,7,8,9,10,11,12,13,14,15,16]. Carrying out these reactions using concentrated solar energy (CSE) can be considered an effective strategy to utilize the entire solar energy spectrum, while avoiding the use of expensive precious metal catalysts. In general, thermochemical redox cycles involve a reduction of the oxygen carrier at high temperature in the first step. Here, the evolution of lattice oxygen takes place, resulting in the formation of a partially reduced phase of the oxygen carrier. Re-oxidation of the partially reduced metal oxide is then achieved using an oxidant (e.g., air, CO2, and H2O) at comparatively lower temperatures in the second step [17]. CeO2/CeO2−δ is the most widely investigated nonstoichiometric redox system and oxygen carrier used for solar-driven thermochemical fuel production so far. Enhanced oxygen release and storage capacities, crystallographic structure stability during the Ce4+ to Ce3+ reversible reduction, and rapid reaction kinetics during thermochemical redox cycles make it attractive from a commercial perspective [1,2,3]. Muhich et al. recently reported that isothermal redox cycles are more efficient than temperature-swing cycles for carrying out this process [18]. Indeed, isothermal redox cycles can be more attractive in processing time and energy conversion efficiency aspects [17,18]. Such isothermal or near-isothermal reaction conditions can be achieved by incorporating a hydrocarbon-based reducing agent (such as methane) in the first step of the redox cycle to lower the reduction temperature [2,19,20,21,22,23,24,25]. The entire reaction sequence can thus be conducted at the same temperature by coupling the partial oxidation of CH4 with the ceria redox cycle. Moreover, this leads to a decrease in the operating temperature of the whole cycle, as both CH4-induced reduction of the oxygen carrier and subsequent re-oxidation with CO2 can proceed at a similar temperature, while producing additional CO and H2 (syngas) during the ceria reduction step with methane.
CeO2 + δCH4→ CeO2-δ + δCO + 2δH2
CeO2−δ + δCO2→ CeO2 + δCO
Most of the previous studies so far have focused on using either pure or doped ceria to study the performance of these materials, and these studies clearly indicated that the active material synthesis method, surface microstructure, morphology, porosity, and presence of inert promotional agents can crucially influence the redox chemistry (including reaction selectivity and thermochemical stability) of such materials [1,2,3,19,20,21,22,23,24,25].
In parallel, information regarding reaction kinetics has also been obtained [26,27,28,29,30,31]. An appropriate kinetic model for the redox reactions incorporating nonstoichiometric oxygen carriers is strongly desired for rational reactor design purposes. In contrast to the general complexity in gas–solid reactions, the redox kinetic description of CeO2 is comparatively simpler. This is because during the first reduction step, apart from producing oxygen vacancies in the solid oxygen carrier, a phase change is generally not involved. Different models have been used to describe the conversion profiles of such noncatalytic gas–solid thermochemical reactions [32,33,34,35,36,37]. The mechanism of solid-state reduction kinetics of CeO2-Fe2O3 systems was found to vary depending on the amount of Fe2O3 [28]. LaFeO3 and NiO oxygen carriers were found to follow a 2D nucleation and nuclei growth model for solid-state reduction in the presence of CH4 [33,37]. Similar studies incorporating perovskites indicated that the solid-state mechanism for reduction and re-oxidation relied on the composition, temperature, and extent of conversion [31,34]. It has to be noted that the material compositions and the experimental conditions used by various authors may vary significantly. In addition, many of these studies were carried out using conventional thermogravimetric analyzers. Therefore, it is relevant to compare the applicability of different models in thermochemical redox reactions separately for individual oxygen carriers, to correlate the representative reactivity information obtained using an original solar reactor.
In this study, the solid-state kinetics and reaction mechanism of thermochemical reduction and re-oxidation reactions taking place over CeO2 oxygen carriers were carefully monitored. Classical kinetic models, including the power law model (PLM), the shrinking core model (SCM), and the nucleation and nuclei growth model (NGM), were compared on the basis of their ability to accurately describe the experimental data [32,33,34,35,36,37]. Thermochemical reduction and re-oxidation cycles were carried out in the presence of CH4 and CO2, respectively. The amounts of oxygen being released and absorbed by the material during redox reactions were measured continuously, over commercial CeO2 powder. The reactions were performed and investigated using a customized solar thermogravimetric reactor developed previously at PROMES-CNRS. The solar thermal reactor was installed at the focus of a parabolic dish concentrator to investigate the kinetics of solid–gas reactions at high temperatures [29]. The solid-state reduction and re-oxidation kinetics of CeO2 oxygen carriers with CH4 and CO2 followed a 2D nucleation and nuclei growth model (R2), based on the kinetic data obtained in the developed solar thermogravimetric reactor.

2. Results and Discussion

Structural and morphological materials characterizations were performed. Powder X-ray diffraction (XRD) patterns were obtained for the commercial CeO2 oxygen carrier. The observed reflections in the wide-angle region were in good agreement with the well-crystallized and phase-pure cubic CeO2 with a fluorite structure. The obtained diffraction patterns are shown in Figure 1a. In the case of the material recovered after the reduction step, reflections corresponding to Ce2O3 and CeO2 phases were found to co-exist, indicating the partial reduction of CeO2 to CeO2−δ. Furthermore, the peaks corresponding to Ce2O3 disappeared in the material recovered after the re-oxidation step (presence of CeO2 phase only), indicating that complete re-oxidation was achieved for this material under the conditions investigated in the present study. Average crystallite sizes were determined for the materials before and after redox cycling experiments by applying the Scherrer equation over the most intense reflection (111) peak of the XRD patterns (2θ = 28.5°). A moderate variation in size was observed for CeO2 after pre-treatment at 1000 °C (54.55 nm) in comparison with the material powder as received (40.4 nm). However, a further enhancement of the crystallite size was not observed for the materials recovered after one complete redox cycle (50.38 nm), indicating that the effect of sintering was negligible and structure stabilization was reached after the thermal pre-treatment. In conjugation, the information regarding surface microstructure and morphology were obtained from the scanning electron microscopy (SEM) images. Nano-sized primary particles with irregular morphologies and a nearly homogeneous size distribution were observed. These particles were found to be randomly agglomerated to form a dense network structure with domain sizes in the micrometer range. Representative images are provided in Figure 1b,c.
Thermochemical redox cycles, using concentrated solar energy, were then carried over these oxygen carriers in a solar thermochemical reactor (see Section 3 for experimental details on materials cycling). A significant amount of oxygen release was observed above 800 °C. Isothermal redox experiments were performed at selected temperatures (900, 1000, and 1050/1070 °C) and the corresponding O and CO evolution profiles (representing δ in CeO2−δ, according to Equations (1) and (2), and determined from the sample mass variation) are shown in Figure 2. This temperature range was selected to obtain noteworthy redox activity without compromising the thermal stability [21,22,23,24,25]. Moreover, higher temperatures would favor the direct thermal methane decomposition to hydrogen and solid carbon [38,39,40]. The CeO2 sample was placed in the reaction chamber of the solar reactor under a flow of inert Ar (0.5 L·min−1) during the heating step, and concentrated solar energy was used to provide process heat and reach the necessary reaction temperature.
A continuous flow of CH4 (0.2 L·min−1, with an Ar flow rate of 0.3 L·min−1 corresponding to 40% CH4 in Ar) was injected at constant temperature and was maintained until the oxygen-releasing step from ceria was completed. Partial oxidation of CH4 took place from the released oxygen in this first step, leading to the formation of reduced ceria (CeO2−δ), along with syngas (CO + H2). Previous studies clearly demonstrated that CeO2 is highly selective toward the partial oxidation of CH4, producing syngas [19,20,21,22,23,24,25]. In the second step, the entire amount of CH4 remaining inside the reactor was first removed using a vacuum pump, and CO2 was subsequently injected (0.2 L·min−1, with an Ar flow rate of 0.3 L·min−1 corresponding to 40% CO2 in Ar), while maintaining the same temperature in order to re-oxidize the partially reduced ceria (CeO2−δ), thus completing the cycle. In this second step, the parent CeO2 was regenerated by consuming oxygen from CO2, along with the production of additional CO. The reaction rates values were obtained from the slopes of O and CO evolution profiles by performing linear regression.
The observed variations in reaction rates as a function of temperature and partial pressure are given in Figure 3. The rate of reduction was found to be influenced by the temperature (Figure 3a). On the contrary, the effect of temperature on the CO2-induced re-oxidation rate was found to be much lower. In addition, the effect of partial pressure (concentration) of the gaseous reactant (CH4 for reduction and CO2 for oxidation) on the conversion was monitored (Figure 3b). In this case, both the rates of reduction and re-oxidation were found to be influenced by the partial pressures of CH4 and CO2, respectively. The logarithm plot of these rates variations (assuming r = k.(pCH4 or CO2)n, where p denotes the partial pressure of CH4 or CO2) against inverse temperature and reactant gas concentration allowed for the determination of the activation energies and reaction orders (Ea = 109 kJ·mol−1 for CH4-induced reduction and 36 kJ·mol−1 for CO2-induced re-oxidation, and reaction orders n = 0.62 and 0.53 with respect to CH4 and CO2, respectively) [21].
In solid-state kinetics, mechanistic interpretations usually involve the identification of a reasonable reaction model, because accurate information about individual reaction steps is often difficult to obtain. A model, in general, is a mathematical representation of experimental observations. Mechanistic considerations enable kinetic models to be categorized as reaction order, nucleation, shrinking core, or diffusion-controlled models. Solid-state conversion profiles for CeO2 oxygen carriers were obtained from the experimental mass variations using Equation (10) and are displayed as a function of time in Figure 4. Preliminary information regarding the reaction mechanism can be obtained from the graphical method developed by Hancock and Sharp [41].
Accordingly, the relationship between solid-state conversion and time can be expressed as:
ln(−ln(1−Xi)) = m ln(t) + ln(α)
where m is a constant representing the reaction mechanism and dimensionality, and α is a constant representing the growth rate. If the solid conversion range is limited to values ranging from 0.15 to 0.5, the kinetics is not affected by the experimental uncertainties and errors during the initial and final phases of the reaction. Depending on the values of m, an approximate reaction mechanism may be assigned.
As shown in Figure 5, representing a plot of ln(−ln(1−Xi)) vs. ln(t), a linear relationship was clearly observed at each studied temperature for CeO2 reduction, with m values close to 1 (0.91 to 1) regardless of temperatures. For CO2-induced re-oxidation, a linear relationship was also observed with m values ranging between 1.49 and 1.57. Specific m values were previously assigned by various authors to determine appropriate models indicating whether the reaction is diffusion-controlled or phase boundary-controlled [42,43,44]. For instance, when the m values are below 1, the mechanism is diffusion-controlled. In general, diffusion models of varying order exhibit m values between 0.5 and 0.6. When the m values are higher than unity, a phase boundary-controlled mechanism is expected. However, it should be noted that identifying a reaction mechanism solely on the basis of Hancock and Sharp plots can be erroneous, as reported previously [45,46]. Besides, different models of varying orders exist for similar m values. Thus, a more realistic model fitting approach was used in this study by comparing several classic kinetic models to fit the experimental data obtained using the solar reactor. All these models were screened for CH4-induced reduction and CO2-induced re-oxidation of CeO2−δ. The experimental values of solid-state conversions ranging from Xi = 0.1 to 0.9 were used in order to incorporate significant values of conversion in the considered data range and, at the same time, to avoid experimental artefacts and errors [34,41].
Initially, the first-order model (F1) was used to fit the experimentally obtained solid-state conversion data for CH4-induced reduction. In this case, it is assumed that the reaction occurs in the oxygen carrier throughout the particles and the mass of the oxygen carrier grain due to oxygen release/uptake varies linearly during the reactions [47,48]. However, from the values of regression coefficient (R2), sufficient correlations were not observed between the experimental and model data, as reported in the Supplementary Materials (Figure S1). In a similar manner, extremely poor correlations were observed for the experimental conversion data in the case of the power law model (PLM) and 3D Janders (D3) and Ginstling (D4) diffusion models [32,33,34,35,36,37]. The obtained regression plots are reported in the Supplementary Materials (Figures S2–S4, respectively). In contrast, both the shrinking core model (SCM) and nucleation and nuclei growth model (NGM) were found to exhibit superior agreement with the experimental conversion data. Therefore, 2D and 3D variants of SCM designated as R2 and R3, as well as 2D and 3D variants of NGM designated as AE2 and AE3, were explored to further elucidate the redox kinetic information.
In SCM, a spherical particle is gradually modified as a result of the reaction occurring on the external surface during the course of the reaction [32,33,34,35,36,37]. In this case, the surface chemical reaction can be considered as rate-limiting, and can be expressed in 2D (R2) as:
gXi = [1−(1−Xi)1/2] = kt
For the 3D SCM (R3) reaction, Equation (4) transforms into:
gXi = [1−(1−Xi)1/3] = kt
Two-dimensional SCM (R2), assuming a contracting cylinder mechanism, exhibited excellent correlation with the experimental conversion data obtained at different temperatures (900, 1000, and 1050 °C) for the reduction of CeO2 in the presence of CH4 with R2 values greater than 0.99. The values of R2 decreased slightly (~0.98) for the plots obtained in the case of re-oxidation under CO2 and for the plots obtained by varying the partial pressures of gaseous reactants. The obtained reaction profiles are shown in Figure 6. In the case of 3D SCM (R3), assuming a contracting sphere mechanism, R2 values in some cases decreased to ~0.97, and the corresponding figures are shown in the Supplementary Materials (Figure S5).
For NGM, the gas–solid reaction proceeds via the formation of nuclei followed by subsequent growth [32,33,34,35,36,37]. Activation of the first nuclei takes place during the induction period, and the reaction rate increases with the number of nuclei during this period. The gXi function is then expressed as:
gXi = [−ln(1−Xi)](n−1)/n = kt
where n is the Avrami exponent, indicative of the reaction mechanism and growth dimension. Thus, the random nucleation model (RNM) resulting from a value of n = 1 simplifies into the first-order model (F1), in which an induction period is not present. The obtained results are summarized above and are shown in the Supplementary Materials (Figure S1). Two-dimensional or three-dimensional nuclei growth is assumed for n = 2 or 3, respectively, and the corresponding gXi functions can be represented by the following equations.
gXi = [−ln(1−Xi)]1/2= kt
gXi = [−ln(1−Xi)]2/3= kt
Two-dimensional NGM (AE2) exhibited an excellent correlation with the experimental conversion data obtained at different temperatures (900, 1000, and 1050/1070 °C) and gaseous reactant partial pressures for CeO2 reduction and re-oxidation. The values of the correlation coefficient (R2) remained greater than 0.99 in all these cases. The corresponding plots are shown in Figure 7. The R2 values decreased slightly to ~0.98, when 3D NGM (AE3) was used, and the obtained plots are shown in the Supplementary Materials (Figure S6). As variants (2D and 3D) of SCM and NGM were found to exhibit the best correlations with the experimental reduction and re-oxidation data of CeO2 oxygen carriers, the values of kinetic rates (k) in each case were obtained from the slopes of the plots by performing linear regression. The corresponding values obtained at different temperatures during reduction and re-oxidation were used for determining the pre-exponential factor (A) and activation energy (Ea), from the Arrhenius plot (Figure 8).
The obtained values of Ea and A are compiled in Table 1. Significant differences were not observed in the values of activation energies obtained using the different kinetic models. However, the activation energy for the CH4-induced reduction of CeO2 remained much higher than that observed for CO2-induced re-oxidation. In comparison with previous results for thermal reduction, the present values were found to be lower. It is to be noted that because of the variations in material composition, experimental parameters, and kinetic models used in different studies, a comparison with previously reported values will not be precise.
In general, the values of Ea for the CH4-induced reduction obtained in this study are consistently lower than those obtained for the purely thermal reduction of CeO2 [21]. This can be due to the fact that the presence of CH4 as a reducing agent better facilitates the reduction reaction. In addition, the values of activation energies of reduction are in close agreement with previous results, using similar composition and reaction conditions. However, the Ea values obtained in the present study for CO2-induced re-oxidation seem to be lower [21,28]. In contrast, pre-exponential factors (A) were found to follow the opposite trend, exhibiting higher values for the re-oxidation reaction. Moreover, the values of pre-exponential factors were found to vary significantly from the reported ones and to be influenced by the model used. Considering the better-quality fits observed for the entire range of temperatures and gaseous reactant concentrations, the 2D NGM (R2) most suitably represents the redox reactions of CeO2 oxygen carriers under the conditions considered in this study. In general, the nucleation and nuclei growth model assumes that the formation of a new reactive phase is crucial for the progress of the reaction. The reaction rate will depend on the number of this new reactive product nuclei (CeO2−δ in the present study) distributed randomly across the solid CeO2 material. Growth of the nuclei in a 2D scheme will take place, followed by the simultaneous formation of new nuclei until they overlap, causing nucleation. Further, the growth of grains throughout the parent CeO2 surface will take place until the transformation is completed. Equation (7) describes the process of nucleation and crystal growth on a phase boundary surface formed between the parent oxide and a uniform distribution of the newly formed product nuclei. A thicker product layer is formed gradually on the parent CeO2 surface. Consumption of the released oxygen from the CeO2 oxygen carrier to form the partially reduced state (CeO2−δ) during the course of the reaction and the associated structural changes may probably result in the formation of some extent of porosity, which can enhance the reaction between the oxygen carrier and CH4, by promoting the diffusion of gaseous components. The termination of nuclei growth can take place by the overlap of grain boundaries. As re-oxidation data also agree well with 2D NGM (R2) in this study, the reverse formation of CeO2 from CeO2−δ will proceed during CO2-induced re-oxidation in the same manner as explained above.

3. Experimental

3.1. Material Preparation

Commercial CeO2 was used as received from Aldrich (<5 μm, 99.9% purity) without any further chemical treatments. To warrant their structural stability, an appropriate amount of the material was calcined for 2 h under air at 1000 °C before performing the solar experiments. This thermal pre-treatment also ensures the removal of undesired impurities, including moisture that was adsorbed on the surface of the oxygen carrier. The material after pre-treatment was cooled down to ambient temperature and was immediately used for redox cycling experiments.

3.2. Characterization of Materials

Structural and morphological characterizations of CeO2 before and after redox cycles were carried out. X-ray diffraction (XRD) patterns were obtained with the Cu Kα radiation (0.15418 nm, angular range 20–80 2θ, steps 0.02 2θ, recording time of 2 s) using a Philips PW 1820 diffractometer (Amsterdam, The Netherlands). The identification of the crystalline phase was performed by comparing the diffractograms with standard diffraction patterns of reference compounds (powder diffraction file PDF-2, International Centre for Diffraction Data, ICDD). The materials recovered after cycling experiments were mixed in a mortar before XRD analysis. The particle morphology and surface microstructure characterizations were performed by high-resolution field emission scanning electron microscopy (FE-SEM, Hitachi S4800, Tokyo, Japan).

3.3. Redox Experiments

Thermochemical redox reactions were carried out on an experimental setup previously developed in PROMES-CNRS (France), for investigating thermochemical solid–gas reactions under controlled reaction atmospheres [29]. A schematic representation of the tubular solar thermogravimetric reactor is provided in Figure 9. Concentrated solar energy is used to provide the process energy for both reduction and re-oxidation reactions. The process heat at high temperature is supplied to the reactor by using a horizontal-axis solar furnace. It consists of a sun-tracking heliostat that reflects the incident solar irradiation towards a 2 m-diameter parabolic dish concentrator (delivering a Gaussian concentrated solar flux distribution at the focal plane with a maximum peak flux density of 16 MW/m2 for a direct normal irradiation DNI of 1 kW/m2). The solar thermogravimetric reactor includes a cavity-type receiver. At the cavity front, the 15 mm-diameter aperture is positioned at the focal point of the solar concentrator (0.85 m ahead from the concentrator) for favoring the optimum access and the absorption of concentrated solar radiation within the cavity-receiver, while alleviating re-radiation losses toward the cavity outside. The cavity is made of high-temperature-resistant graphite walls, and the surroundings of the walls are lined with a ceramic insulation layer. The inside of the reactor (cavity) is separated from the outside atmosphere by a transparent Pyrex glass window at the front. Regarding the solar-driven thermogravimetric measurements, an appropriate amount (~1 g) of the oxygen carrier to be analyzed was placed as a loose packed-bed in an alumina crucible (12 mm i.d., 15 mm o.d., 10 mm height) that was connected to a micro-balance (Mettler Toledo, Columbus, OH, USA, weighting module, 0.01 mg readability) thanks to a vertical alumina rod. The sample and holder were settled inside a cylindrical lining tube made of alumina (25 mm o.d., 20 mm i.d.), and were in stable equilibrium at the center of the tube. The reactive gas flow was injected in the upward direction and reacted with the oxide bed sample when reaching the crucible. The temperature during redox cycles was measured just above the reacting sample by using a B-type thermocouple placed inside the alumina tube. This measurement corresponds to the reaction temperature because a homogeneous temperature distribution is provided in the reacting zone thanks to the cavity-type solar reactor configuration. Thus, the zone where the sample holder is placed inside the absorber tube can be considered isothermal. The heating of the sample mainly occurs via radiative heat transfer from the nearby surrounding hot walls of the alumina tube. Prevailing heat transfer is mainly radiative due to the high temperatures in this zone, and a thermal radiative equilibrium is established inside the black-body cavity. Moreover, the extremely limited size of the crucible and its position at the center of the heated zone warrant the absence of a temperature gradient in the crucible and inside the reacting powder bed. The flow-rates of purge carrier gas (Ar, 99.999% purity, with O2 volume content < 2 ppm(v)), methane (CH4, 99.95% purity), and carbon dioxide (CO2, 99.995% purity) were controlled and regulated by using electronic mass-flow controllers (Brooks, Hatfield, PA, USA). The total gas flow-rate was kept constant (at 0.5 L·min−1) to maintain constant the gas/solid contact time in the tube.
The CeO2 oxygen carrier was placed in the solar reactor under a constant flow of Ar (0.5 L·min−1). After reaching the desired temperature (900, 1000, and 1050/1070 °C), a continuous flow of CH4 (for reduction) or CO2 (for re-oxidation) was introduced to attain a reactant mole fraction of 20, 40, or 60%, until the oxygen release/uptake from the CeO2 oxygen carrier was complete. The amount of oxygen evolved (δ) was calculated according to the equation,
δ = (Δm/m) × (MCeO2/Mo)
where Δm is the total mass loss during reduction (or mass gain during re-oxidation), m is the initial amount of the material used for redox experiments, MCeO2 is the molar mass of CeO2, and Mo is the molar mass of an oxygen atom. The same equation (Equation (9)) was used for calculating the evolved CO amount by just replacing the mass loss with the mass gain during re-oxidation. δ thus quantifies the amount of either O or CO evolved (in mol·mol−1).

3.4. Kinetic Data Processing

Reduction and re-oxidation kinetics of CeO2 oxygen carriers are strongly desired for the rational design and optimization of solar thermochemical reactors. Predicting intrinsic reaction parameters that reflect the overall reaction mechanism is challenging. Indeed, detailed mechanisms and steps involved in the oxygen release (reduction) and uptake (oxidation) of CeO2 are often difficult to obtain experimentally. On the other hand, a systematic screening of a series of reaction models to select the most appropriate one based on the available experimental data can be a promising avenue to unravel the reaction kinetics. Reduction and re-oxidation isothermal reactions were carried out at selected temperatures (900, 1000, and 1050/1070 °C) to obtain the O2 evolution (release or uptake) profiles against time. The solid material conversion fractions were then obtained from Equation (10), where Xi denotes the extent of conversion during reduction or re-oxidation, as appropriate.
Xi = (Δmt/Δm)
where Δmt is the mass loss during reduction (or gain during re-oxidation) at a specific time and Δm is the total mass variation during the reaction. This metric was further used to determine the reaction kinetics for the fresh particles. The intrinsic kinetics of the gas–solid reaction can be formulated considering an overall reaction rate being a function of the extent of reduction/re-oxidation of solid material (f(Xi)) and the gas-phase composition (fG), as represented by the following equation.
dXi/dt = k × fXi × fG
where k is the temperature-dependent overall rate constant of the reaction. The fG function in Equation (11) can be considered as a single pseudo-constant provided the reactions were carried out at the same feed flow-rate and reactant partial pressure [36]. Thus, Equation (11) can be simplified to:
dXi/dt = k × fXi
By integrating Equation (12) under isothermal conditions, the integral form (gXi) of the reaction model is obtained and can be expressed as:
gXi   = 0 x dXi fXi
In the present study, solid-state kinetic models exhibiting the best correlation with the experimental data were utilized for identifying the kinetic parameters and reaction mechanism. The rate constants (k) thus calculated from the slope for different temperatures were then expressed as a function of temperature via the following Arrhenius equation.
k = A. exp(−Ea/RT)
where Ea is the activation energy (in kJ·mol−1) and A is the pre-exponential factor (in s−1). The method for model fitting to the experimental data is based on the determination of gXi linearity with time. The linear fit provides a slope that represents the reaction rate constant (k). The evaluation of the kinetic parameters, including the pre-exponential factor (A) and apparent activation energy (Ea), can be achieved by determining the reaction rate constant at different temperatures. Then, both the Ea and A values can be calculated based on the resultant logarithm plot of the Arrhenius expression (Equation (14)) from the slope and intercept, respectively.

4. Conclusions

Fluorite-structured nonstoichiometric CeO2 represents the most promising and benchmark oxygen carrier for solar-driven thermochemical fuel production. In this study, the solid-state redox kinetics of CeO2 during both isothermal CH4-induced reduction and CO2-induced re-oxidation were investigated. Such a coupling of CH4 partial oxidation with CO2 splitting can produce syngas, which is an important feedstock for various industrial processes. The reactions were carried out using concentrated solar energy in a customized solar thermogravimetric reactor designed for carrying out thermochemical reactions under controlled atmospheres. Different classical solid-state kinetic models were utilized to derive the mechanism for CeO2 redox reactions in the solar thermal reactor. Both 2D and 3D variants of the shrinking core model (SCM) and nucleation and nuclei growth model (NGM) were found to exhibit the best correlation between the experimental data and model predictions. The values of apparent activation energies (~80 kJ·mol−1 for reduction and ~10 kJ·mol−1 for re-oxidation) and pre-exponential factors (~2–9 s−1 for reduction and ~123–253 s−1 for re-oxidation) were obtained. The observed disparities in the kinetic parameters in comparison with those available in the literature can be attributed to the variations in reaction conditions, solar reactor configuration, and kinetic models used. As superior correlations were observed for 2D NGM (R2) throughout the conditions used in this study, this model most appropriately depicts the redox reaction mechanism of CeO2 oxygen carrier in the solar thermal reactor.

Supplementary Materials

The following are available online at https://www.mdpi.com/article/10.3390/catal11060723/s1, Figures S1–S6 include additional information regarding the comparison between experimental conversion data with solid-state reaction models.

Author Contributions

Conceptualization, M.M.N. and S.A.; data curation, M.M.N. and S.A.; formal analysis, M.M.N. and S.A.; investigation, M.M.N. and S.A.; methodology, M.M.N. and S.A.; project administration, S.A.; supervision, S.A.; validation, M.M.N. and S.A.; visualization, M.M.N.; writing—original draft, M.M.N.; writing—review and editing, S.A. The work described in this manuscript was carried out and written with contribution from both authors. All authors have read and agreed to the published version of the manuscript.

Funding

This research received no external funding.

Data Availability Statement

The data presented in this study are available in this article and supplementary materials.

Acknowledgments

The authors thank O. Prevost for technical support during solar reactor design and manufacturing.

Conflicts of Interest

The authors declare no conflict of interest.

Nomenclature

δAmount of O or CO evolved during reduction or oxidation (mol·mol−1)
APre-exponential factor (s−1)
EaActivation energy (kJ·mol−1)
kTemperature-dependent overall rate constant of the reaction (s−1)
MCeO2Molar mass of CeO2 (kg·mol−1)
MoMolar mass of oxygen atom (kg·mol−1)
mInitial amount of the material (kg)
ΔmtMass loss during reduction (or gain during re-oxidation) at a specific time (kg)
ΔmTotal mass variation during the reaction (kg)
nAvrami exponent indicative of the reaction mechanism and growth dimension
ttime (s)
XiExtent of conversion

References

  1. Furler, P.; Scheffe, J.R.; Steinfeld, A. Syngas production by simultaneous splitting of H2O and CO2 via ceria redox reactions in a high-temperature solar reactor. Energy Environ. Sci. 2012, 5, 6098–6103. [Google Scholar] [CrossRef]
  2. Scheffe, J.R.; Steinfeld, A. Thermodynamic analysis of cerium-based oxides for solar thermochemical fuel production. Energy Fuels 2012, 26, 1928–1936. [Google Scholar] [CrossRef]
  3. Chueh, W.C.; Falter, C.; Abbott, M.; Scipio, D.; Furler, P.; Haile, S.M.; Steinfeld, A. High-flux solar-driven thermochemical dissociation of CO2 and H2O using nonstoichiometric ceria. Science 2010, 330, 1797–1801. [Google Scholar] [CrossRef] [Green Version]
  4. Haeussler, A.; Abanades, S.; Jouannaux, J.; Julbe, A. Non-stoichiometric redox active perovskite materials for solar thermochemical fuel production: A review. Catalysts 2018, 8, 611. [Google Scholar] [CrossRef] [Green Version]
  5. Abanades, S. Metal oxides applied to thermochemical water-splitting for hydrogen production using concentrated solar energy. ChemEngineering 2019, 3, 63. [Google Scholar] [CrossRef] [Green Version]
  6. Charvin, P.; Abanades, S.; Bêche, E.; Lemont, F.; Flamant, G. Hydrogen production from mixed cerium oxides via three-step water-splitting cycles. Solid State Ionics 2009, 180, 1003–1010. [Google Scholar] [CrossRef]
  7. Haeussler, A.; Abanades, S.; Jouannaux, J.; Drobek, M.; Ayral, A.; Julbe, A. Recent progress on ceria doping and shaping strategies for solar thermochemical water and CO2 splitting cycles. AIMS Mater. Sci. 2019, 6, 657–684. [Google Scholar] [CrossRef]
  8. Nair, M.M.; Abanades, S. Insights into the Redox Performance of non-stoichiometric lanthanum manganite perovskites for solar thermochemical CO2 splitting. ChemistrySelect 2016, 1, 4449–4457. [Google Scholar] [CrossRef]
  9. Nair, M.M.; Abanades, S. Experimental screening of perovskite oxides as efficient redox materials for solar thermochemical CO2 conversion. Sustain. Energy Fuels 2018, 2, 843–854. [Google Scholar] [CrossRef]
  10. Haeussler, A.; Abanades, S.; Julbe, A.; Jouannaux, J.; Cartoixa, B. Solar thermochemical fuel production from H2O and CO2 splitting via two-step redox cycling of reticulated porous ceria structures integrated in a monolithic cavity-type reactor. Energy 2020, 201, 117649. [Google Scholar] [CrossRef]
  11. Haeussler, A.; Abanades, S.; Julbe, A.; Jouannaux, J.; Cartoixa, B. Two-step CO2 and H2O splitting using perovskite-coated ceria foam for enhanced green fuel production in a porous volumetric solar reactor. J. CO2 Util. 2020, 41, 101257. [Google Scholar] [CrossRef]
  12. Chuayboon, S.; Abanades, S. Solar-driven chemical looping methane reforming using ZnO oxygen carrier for syngas and Zn production in a cavity-type solar reactor. Catalysts 2020, 10, 1356. [Google Scholar] [CrossRef]
  13. Zhang, Z.; André, L.; Abanades, S. Experimental assessment of oxygen exchange capacity and thermochemical redox cycle behavior of Ba and Sr series perovskites for solar energy storage. Sol. Energy 2016, 134, 494–502. [Google Scholar] [CrossRef]
  14. Vieten, J.; Bulfin, B.; Huck, P.; Horton, M.; Guban, D.; Zhu, L.; Lu, Y.; Persson, K.A.; Roeb, M.; Sattler, C. Materials design of perovskite solid solutions for thermochemical applications. Energy Environ. Sci. 2019, 12, 1369–1384. [Google Scholar] [CrossRef]
  15. Vieten, J.; Bulfin, B.; Call, F.; Lange, M.; Schmucker, M.; Francke, A.; Roeb, M.; Sattler, C. Perovskite oxides for application in thermochemical air separation and oxygen storage. J. Mater. Chem. A 2016, 4, 13652–13659. [Google Scholar] [CrossRef]
  16. Sarshar, Z.; Kleitz, F.; Kaliaguine, S. Novel oxygen carriers for chemical looping combustion: La1-xCexBO3(B = Co, Mn) perovskites synthesized by reactive grinding and nanocasting. Energy Environ. Sci. 2011, 4, 4258–4269. [Google Scholar] [CrossRef]
  17. Zeng, L.; Cheng, Z.; Fan, J.A.; Fan, L.; Gong, J. Metal oxide redox chemistry for chemical looping processes. Nat. Rev. Chem. 2018, 2, 349–364. [Google Scholar] [CrossRef]
  18. Muhich, C.L.; Evanko, B.W.; Weston, K.C.; Lichty, P.; Liang, X.; Martinek, J.; Musgrave, C.B.; Weimer, A.W. Efficient generation of H2 by splitting water with an isothermal redox cycle. Science 2013, 341, 540–542. [Google Scholar] [CrossRef]
  19. Krenzke, P.T.; Davidson, J.H. Thermodynamic analysis of syngas production via the solar thermochemical cerium oxide redox cycle with methane-driven reduction. Energy Fuels 2014, 28, 4088–4095. [Google Scholar] [CrossRef]
  20. Krenzke, P.T.; Fosheim, J.R.; Davidson, J.H. Solar fuels via chemical-looping reforming. Sol. Energy 2017, 156, 48–72. [Google Scholar] [CrossRef]
  21. Nair, M.M.; Abanades, S. Tailoring hybrid nonstoichiometric ceria redox cycle for combined solar methane reforming and thermochemical conversion of CO2/H2O. Energy Fuels 2016, 30, 6050–6058. [Google Scholar] [CrossRef]
  22. Chuayboon, S.; Abanades, S.; Rodat, S. Solar chemical looping reforming of methane combined with isothermal H2O/CO2 splitting using ceria oxygen carrier for syngas production. J. Energy Chem. 2020, 41, 60–72. [Google Scholar] [CrossRef] [Green Version]
  23. Chuayboon, S.; Abanades, S.; Rodat, S. Syngas production via solar-driven chemical looping methane reforming from redox cycling of porous foam in a volumetric solar reactor. Chem. Eng. J. 2019, 356, 756–770. [Google Scholar] [CrossRef]
  24. Chuayboon, S.; Abanades, S.; Rodat, S. Stepwise solar methane reforming and water-splitting via lattice oxygen transfer in iron and cerium oxides. Energy Technol. 2020, 8, 1900415. [Google Scholar] [CrossRef]
  25. Chuayboon, S.; Abanades, S.; Rodat, S. High-purity and clean syngas and hydrogen production from two-step CH4 reforming and H2O splitting through isothermal ceria redox cycle using concentrated sunlight. Front. Energy Res. 2020, 8, 128. [Google Scholar] [CrossRef]
  26. Bulfin, B.; Lowe, A.J.; Keogh, K.A.; Murphy, B.E.; Lubben, O.; Krasnikov, S.A.; Shvets, I.V. Analytical model of CeO2 oxidation and reduction. J. Phys.Chem. C 2013, 117, 24129–24137. [Google Scholar] [CrossRef]
  27. Zhao, Z.; Uddi, M.; Tsvetkov, N.; Yildiz, B.; Ghoniem, A.F. Redox kinetics study of fuel reduced ceria for chemical-looping water splitting. J. Phys. Chem. C 2016, 120, 16271–16289. [Google Scholar] [CrossRef] [Green Version]
  28. Hosseini, S.Y.; Khosravi-Nikou, M.R.; Shariati, A. Kinetic study of the reduction step for chemical looping steam methane reforming by CeO2-Fe2O3 oxygen carriers. Chem. Eng. Technol. 2020, 43, 540–552. [Google Scholar] [CrossRef]
  29. Leveque, G.; Abanades, S. Design and operation of a solar-driven thermogravimeter for high temperature kinetic analysis of solid-gas thermochemical reactions in controlled atmosphere. Sol. Energy 2014, 105, 225–235. [Google Scholar] [CrossRef]
  30. Ackermann, S.; Sauvin, L.; Castiglioni, R.; Rupp, J.L.M.; Scheffe, J.R.; Steinfeld, A. Kinetics of CO2 reduction over nonstoichiometric ceria. J. Phys. Chem. C 2015, 119, 16452–16461. [Google Scholar] [CrossRef] [Green Version]
  31. Nair, M.M.; Abanades, S. Solid-state reoxidation kinetics of A/B-site substituted LaMnO3 during solar thermochemical CO2 conversion. Energy Technol. 2021, 9, 2000885. [Google Scholar] [CrossRef]
  32. Monazam, E.R.; Breault, R.W.; Siriwardane, R. Kinetics of hematite to wustite by hydrogen for chemical looping combustion. Energy Fuels 2014, 28, 5406–5414. [Google Scholar] [CrossRef]
  33. Kharatyan, S.L.; Chatilyan, H.A.; Manukyan, K.V. Kinetics and mechanism of nickel oxide reduction by methane. J. Phys. Chem. C 2019, 123, 21513–21521. [Google Scholar] [CrossRef]
  34. Dudek, R.B.; Tian, Y.; Jin, G.; Blivin, M.; Li, F. Reduction kinetics of perovskite oxides for selective hydrogen combustion in the context of olefin production. Energy Technol. 2020, 8, 1900738. [Google Scholar] [CrossRef]
  35. Dubey, A.K.; Samanta, A.; Sarkar, P.; Dey, R.; Saxena, C.K. Performance and kinetic evaluation of synthesized CuO/SBA-15 oxygen carrier for chemical looping with oxygen uncoupling. Energy Technol. 2019, 7, 1900407. [Google Scholar] [CrossRef]
  36. Hossain, M.M.; de Lasa, H.I. Reduction and oxidation kinetics of Co-Ni/Al2O3 oxygen carrier involved in a chemical-looping combustion cycles. Chem. Eng. Sci. 2010, 65, 98–106. [Google Scholar] [CrossRef]
  37. Dai, X.; Cheng, J.; Li, Z.; Liu, M.; Ma, Y.; Zhang, X. Reduction kinetics of lanthanum ferrite perovskite for the production of synthesis gas by chemical looping methane reforming. Chem. Eng. Sci. 2016, 153, 236–245. [Google Scholar] [CrossRef]
  38. Abanades, S.; Flamant, G. Hydrogen production from solar thermal dissociation of methane in a high-temperature fluid-wall chemical reactor. Chem. Eng. Process. Process Intensif. 2008, 47, 490–498. [Google Scholar] [CrossRef]
  39. Abanades, S.; Kimura, H.; Otsuka, H. Hydrogen production from CO2-free thermal decomposition of methane: Design and on-sun testing of a tube-type solar thermochemical reactor. Fuel Process. Technol. 2014, 122, 153–162. [Google Scholar] [CrossRef]
  40. Rodat, S.; Abanades, S.; Flamant, G. High temperature solar methane dissociation in a multi-tubular cavity-type reactor in the temperature range 1823–2073 K. Energy Fuels 2009, 23, 2666–2674. [Google Scholar] [CrossRef]
  41. Hancock, J.D.; Sharp, J.H. Method of comparing solid-state kinetic data and its application to the decomposition of Kaolinite, Brucite, and BaCO3. J. Am. Ceram. Soc. 1972, 55, 74. [Google Scholar] [CrossRef]
  42. Zhou, Z.; Han, L.; Bollas, G.M. Kinetics of NiO reduction by H2 and Ni oxidation at conditions relevant to chemical-looping combustion and reforming. Int. J. Hydrog. Energy 2014, 39, 8535–8556. [Google Scholar] [CrossRef]
  43. Plascencia, G.; Utigard, T.A. The reduction of Tokyo and Sinter 75 nickel oxides with hydrogen. Chem. Eng. Sci. 2009, 64, 3879–3888. [Google Scholar] [CrossRef]
  44. Utigard, T.A.; Wu, M.; Plascencia, G.; Martin, T. Reduction kinetics of Goro nickel oxide using hydrogen. Chem. Eng. Sci. 2005, 60, 2061–2068. [Google Scholar] [CrossRef]
  45. Abad, A.; Garcia-Labiano, F.; de Diego, L.F.; Gayan, P.; Adanez, J. Reduction kinetics of Cu-, Ni-, and Fe-based oxygen carriers using syngas (CO+H2) for chemical-looping combustion. Energy Fuels 2007, 21, 1843–1853. [Google Scholar] [CrossRef] [Green Version]
  46. Abad, A.; Adanez, J.; Garcia-Labiano, F.; de Diego, L.F.; Gayan, P.; Celaya, J. Mapping of the range of operational conditions for Cu-, Fe-, and Ni-based oxygen carriers in chemical-looping combustion. Chem. Eng. Sci. 2007, 62, 533–549. [Google Scholar] [CrossRef] [Green Version]
  47. Ksepko, E.; Sciazko, M.; Babinski, P. Studies on the redox reaction kinetics of Fe2O3-CuO/Al2O3 and Fe2O3/TiO2 oxygen carriers. Appl. Energy 2014, 115, 374–383. [Google Scholar] [CrossRef]
  48. Ksepko, E.; Babinski, P.; Evdou, A.; Nalbandian, L. Studies on the redox reaction kinetics of selected, naturally occurring oxygen carrier. J. Therm. Anal. Calorim. 2016, 124, 137. [Google Scholar] [CrossRef] [Green Version]
Figure 1. Characterization of ceria materials used in this study: (a) Powder X-ray diffraction (XRD) patterns of as-received fresh CeO2 oxygen carriers (C-F), ceria after pre-treatment (C-P), ceria after reduction (C-R), and ceria used after one complete cycle (C-U), (*) denotes Ce2O3 phase; (b,c) SEM images of fresh CeO2 oxygen carriers.
Catalysts 11 00723 g001
Figure 2. Experimental O (a) and CO (b) evolution profiles as a function of time at selected temperatures and reactant partial pressures over CeO2 oxygen carriers performed in a solar reactor using concentrated solar energy.
Catalysts 11 00723 g002
Figure 3. Variation in reaction rates as a function of (a) temperature and (b) reactant concentration.
Catalysts 11 00723 g003
Figure 4. Experimental solid-state conversion profiles as a function of time (a) at selected temperatures during reduction and (b) at selected temperatures during re-oxidation, (c) effect of CH4 partial pressure during reduction, and (d) effect of CO2 partial pressure during re-oxidation. The partial pressure of the reactant gases was kept at 40% in (a,b). Experiments with varying partial pressures in (c,d) were carried out at 1000 °C.
Catalysts 11 00723 g004
Figure 5. Hancock and Sharp plots for experimental solid-state conversion data at selected temperatures during (a) reduction and (b) re-oxidation.
Catalysts 11 00723 g005
Figure 6. Comparison of experimental conversion data with 2D SCM (R2) predictions for CeO2 during (a) CH4-induced reduction at selected temperatures, (b) CO2-induced re-oxidation at selected temperatures, (c) varying CH4 partial pressure during reduction, and (d) varying CO2 partial pressure during re-oxidation. The partial pressure of the reactant gases was kept at 40% in (a,b). Experiments with varying partial pressures in (c,d) were carried out at 1000 °C.
Catalysts 11 00723 g006
Figure 7. Comparison of experimental conversion data with 2D NGM (AE2) predictions for CeO2 during (a) CH4-induced reduction at selected temperatures, (b) CO2-induced re-oxidation at selected temperatures, (c) varying CH4 partial pressure during reduction, and (d) varying CO2 partial pressure during re-oxidation. The partial pressure of the reactant gases was kept at 40% in (a,b). Experiments with varying partial pressures in (c,d) were carried out at 1000 °C.
Catalysts 11 00723 g007
Figure 8. Arrhenius plots for (a) CH4-induced reduction and (b) CO2-induced re-oxidation over CeO2 oxygen carrier performed in solar thermogravimetric reactor using concentrated solar energy.
Catalysts 11 00723 g008
Figure 9. Schematic representation of the solar thermogravimetric reactor equipped with a parabolic dish concentrator, used for carrying out the thermochemical redox cycles over CeO2 oxygen carrier.
Catalysts 11 00723 g009
Table 1. Kinetic parameters obtained from various mechanistic functions for CH4-induced reduction and CO2-induced re-oxidation over CeO2 oxygen carrier in a solar thermal reactor.
Reaction ModelT (°C)Rate Constant (s−1)Ea (kJ·mol−1) aA (s−1) b
ReductionRe-OxidationReductionRe-OxidationReductionRe-Oxidation
2D NGM9001.9 × 10−32.7 × 10−379.6110.56.69127.0
10003.6 × 10−32.9 × 10⁻³
1050/10704.8 × 10−33.1 × 10⁻³
3D NGM9002.4 × 10−33.5 × 10−380.288.29.07123.6
10004.6 × 10−33.7 × 10⁻³
1050/10706.1 × 10−33.9 × 10⁻³
2D SCM9001.1 × 10−31.5 × 10−376.689.52.86252.9
10002.0 × 10−31.6 × 10⁻³
1050/10702.7 × 10−31.7 × 10⁻³
3D SCM9008.0 × 10−41.2 × 10−383.4911.74.21252.3
10001.6 × 10−31.3 × 10⁻³
1050/10702.1 × 10−31.4 × 10⁻³
a Activation energy; b Pre-exponential factor.
Publisher’s Note: MDPI stays neutral with regard to jurisdictional claims in published maps and institutional affiliations.

