Article

ZnO Nanospheres Fabricated by Mechanochemical Method with Photocatalytic Properties

1
Department of Electronic and Display Engineering, Hoseo University, Asan 31499, Korea
2
Department of Materials Science and Engineering, Anhui University of Science and Technology, Huainan 232001, China
*
Authors to whom correspondence should be addressed.
Catalysts 2021, 11(5), 572; https://doi.org/10.3390/catal11050572
Submission received: 28 February 2021 / Revised: 23 April 2021 / Accepted: 26 April 2021 / Published: 29 April 2021
(This article belongs to the Special Issue 10th Anniversary of Catalysts—Feature Papers in Photocatalysis)

Abstract

:
The preparation of high specific area (86.5 m2/g) ZnO nanospheres with good photocatalytic efficiency via a simple, green and efficient mechanochemical method was reported in this work. The products were characterized by XRD, SEM, TEM, BET and UV–Vis. The ball milling parameters were improved to reduce the agglomeration hazard during the ball milling process, and the specific surface area, band gap and photocatalytic efficiency were investigated in relation to ball milling time. Our study developed the opportunity for the low-cost and facile synthesis of a high specific surface area photocatalyst on a large scale for future industrial applications.

1. Introduction

The development of industry has led to the discharge of large quantities of components containing organic dyes to the aqueous environment, posing a serious threat to the environment and human health [1,2]. Therefore, there is an urgent need for technology to solve the problem of organic pollution. Photocatalytic technology is an advanced organic degradation technology with unparalleled advantages over traditional flocculation, precipitation, and adsorption in organic purification [3,4,5,6,7,8,9,10]. Among them, the core of photocatalytic technology is an efficient photocatalyst [11,12,13,14].
Compared to other common photocatalysts, ZnO has a high valence band oxidation potential, chemical stability, environmental friendliness, and crystal morphology. In today’s society, semiconductor photocatalyst research has focused on easy regulation and low cost [15,16,17,18]. ZnO is a direct bandgap n-type metal oxide semiconductor with a high forbidden bandwidth (3.37 eV) and a large exciton binding energy (60 meV). On the other hand, ZnO has several drawbacks that limit its photocatalytic activity, including the easy recombination of photogenerated electron–hole pairs, lower interfacial charge-carrier transfer rate, and poor organic adsorption capacity [15,16,17].
The specific surface area can have a significant impact on the photocatalytic performance. First of all, the surface itself is a kind of face defect, and it is well known that defects have an important influence on the photocatalytic performance. In addition, the high surface area increases the adsorption capacity for organic compounds, allowing more organic compounds to react. Finally, high surface area can provide sufficient reaction sites to increase the rate of organic reactions [18,19,20,21]. In recent years, several methods for the preparation of ZnO have been developed to increase the specific surface area of ZnO, such as the solvent thermal method, hydrothermal method, sol–gel method, homogeneous precipitation method, microemulsion method, and mechanical force chemical method [22,23,24,25,26,27,28]. Table 1 lists some reports on the relationship between the specific surface area and photocatalytic efficiency [21,29,30,31].
Mechanochemistry is an important method for preparing small-sized nanomaterials [32]. High-energy ball milling is one of the most effective, relatively inexpensive, straightforward, and environmentally friendly techniques for producing ZnO nanostructures. Moreover, nanostructures with a range of specific surface areas can be synthesized by ball milling by varying parameters, such as the frequency, number and size of milling balls, milling time, the material used for milling balls, and beakers [33,34,35]. The product prepared by mechanochemical method usually has a sufficiently small particle size, but the specific surface area of the product was usually not very high. The reason for this was that these reports did not mention addressing agglomeration hazards, which was one of the most important harmful effects of mechano–chemical methods. A lot of papers have been reported on the mechanochemical synthesis of ZnO nanoparticles for photocatalysis or other applications [28,36,37,38,39,40,41,42]. Some reports have used ZnCl2 and Na2CO3 as reaction precursors and have successfully prepared nano-sized ZnO particles by this method using NaCl as the controlling agent for the ball milling process [28,36,37,38,39,40,41,42,43,44]. However, the nano-sized ZnO particles in these reports were not small enough (above 18 nm). Just one paper has reported ZnO particles with a particle size of around 10 nm [45]. Additionally, the specific surface area of all these ZnO nanoparticles prepared using mechanochemical methods was not sufficiently large (below 47.3 m2/g) due to the natural limitations of the ball milling method (agglomeration hazard) [28,36,37,38,39,40,41,42], which is an important pointer to the photocatalytic ability of the photocatalysts. Obviously, innovations in this method were needed to address the agglomeration hazard of the products, and thus increased the specific surface area and allowed the full photocatalytic potential of the small-sized ZnO nanoparticles to be released. To date, there have been few papers on mechanical force chemistry methods that reasonably address this agglomeration hazard by varying the experimental parameters to maximize the dispersion, resulting in well-dispersed ZnO particles with a large specific surface area, and subsequently enhancing the photocatalytic performance of ZnO nanoparticles.
In this article, we therefore focused on how to solve these existing problems in a simple and practical way. Firstly, NaCl was usually added as a process control agent during normal ball milling to prevent particle agglomeration [28,36,37,38,39,40,41,42,43,44]. Solid control agents usually only have a limited effect on reducing agglomeration hazards. In this work, anhydrous ethanol was chosen as the controlling agent for the ball milling process and the mass ratio of control agent to basic zinc carbonate is 1:2 (or molar ratio to Zn ions of 1.2:1). In theory, this will significantly reduce the agglomeration hazard associated with prolonged ball milling. Here, we list Table 2 to summarize some published literature on the mechanochemical synthesis efforts in terms of the control agent used, average particle sizes, and specific surface areas [28,36,37,38,40,45,46]. In addition, when collecting the product after ball milling, we first placed the removed product in an ethanol solution, stirred it well to make a suspension, and then placed the suspension in an ultrasonic disperser for 15 min and the suspension was dried in an oven at a low temperature of just 10 °C above room temperature. Finally, we calcined the collected product (basic zinc carbonate) at a very low calcination temperature (300 °C) to obtain the final ZnO product. All these efforts were aimed at minimizing the agglomeration hazard during the ball milling process. The product was analyzed for photocatalytic properties and tested routinely, successfully obtaining superior results to those obtained previously. In Table 3, we also list previous works on the degradation of RhB solutions by ZnO in simulated light sources light [44,47,48,49,50,51,52]. The ball milling parameters were improved to reduce the agglomeration hazard during ball milling process, and the specific surface area, band gap and photocatalytic efficiency were investigated in relation to ball milling time.

2. Results and Discussion

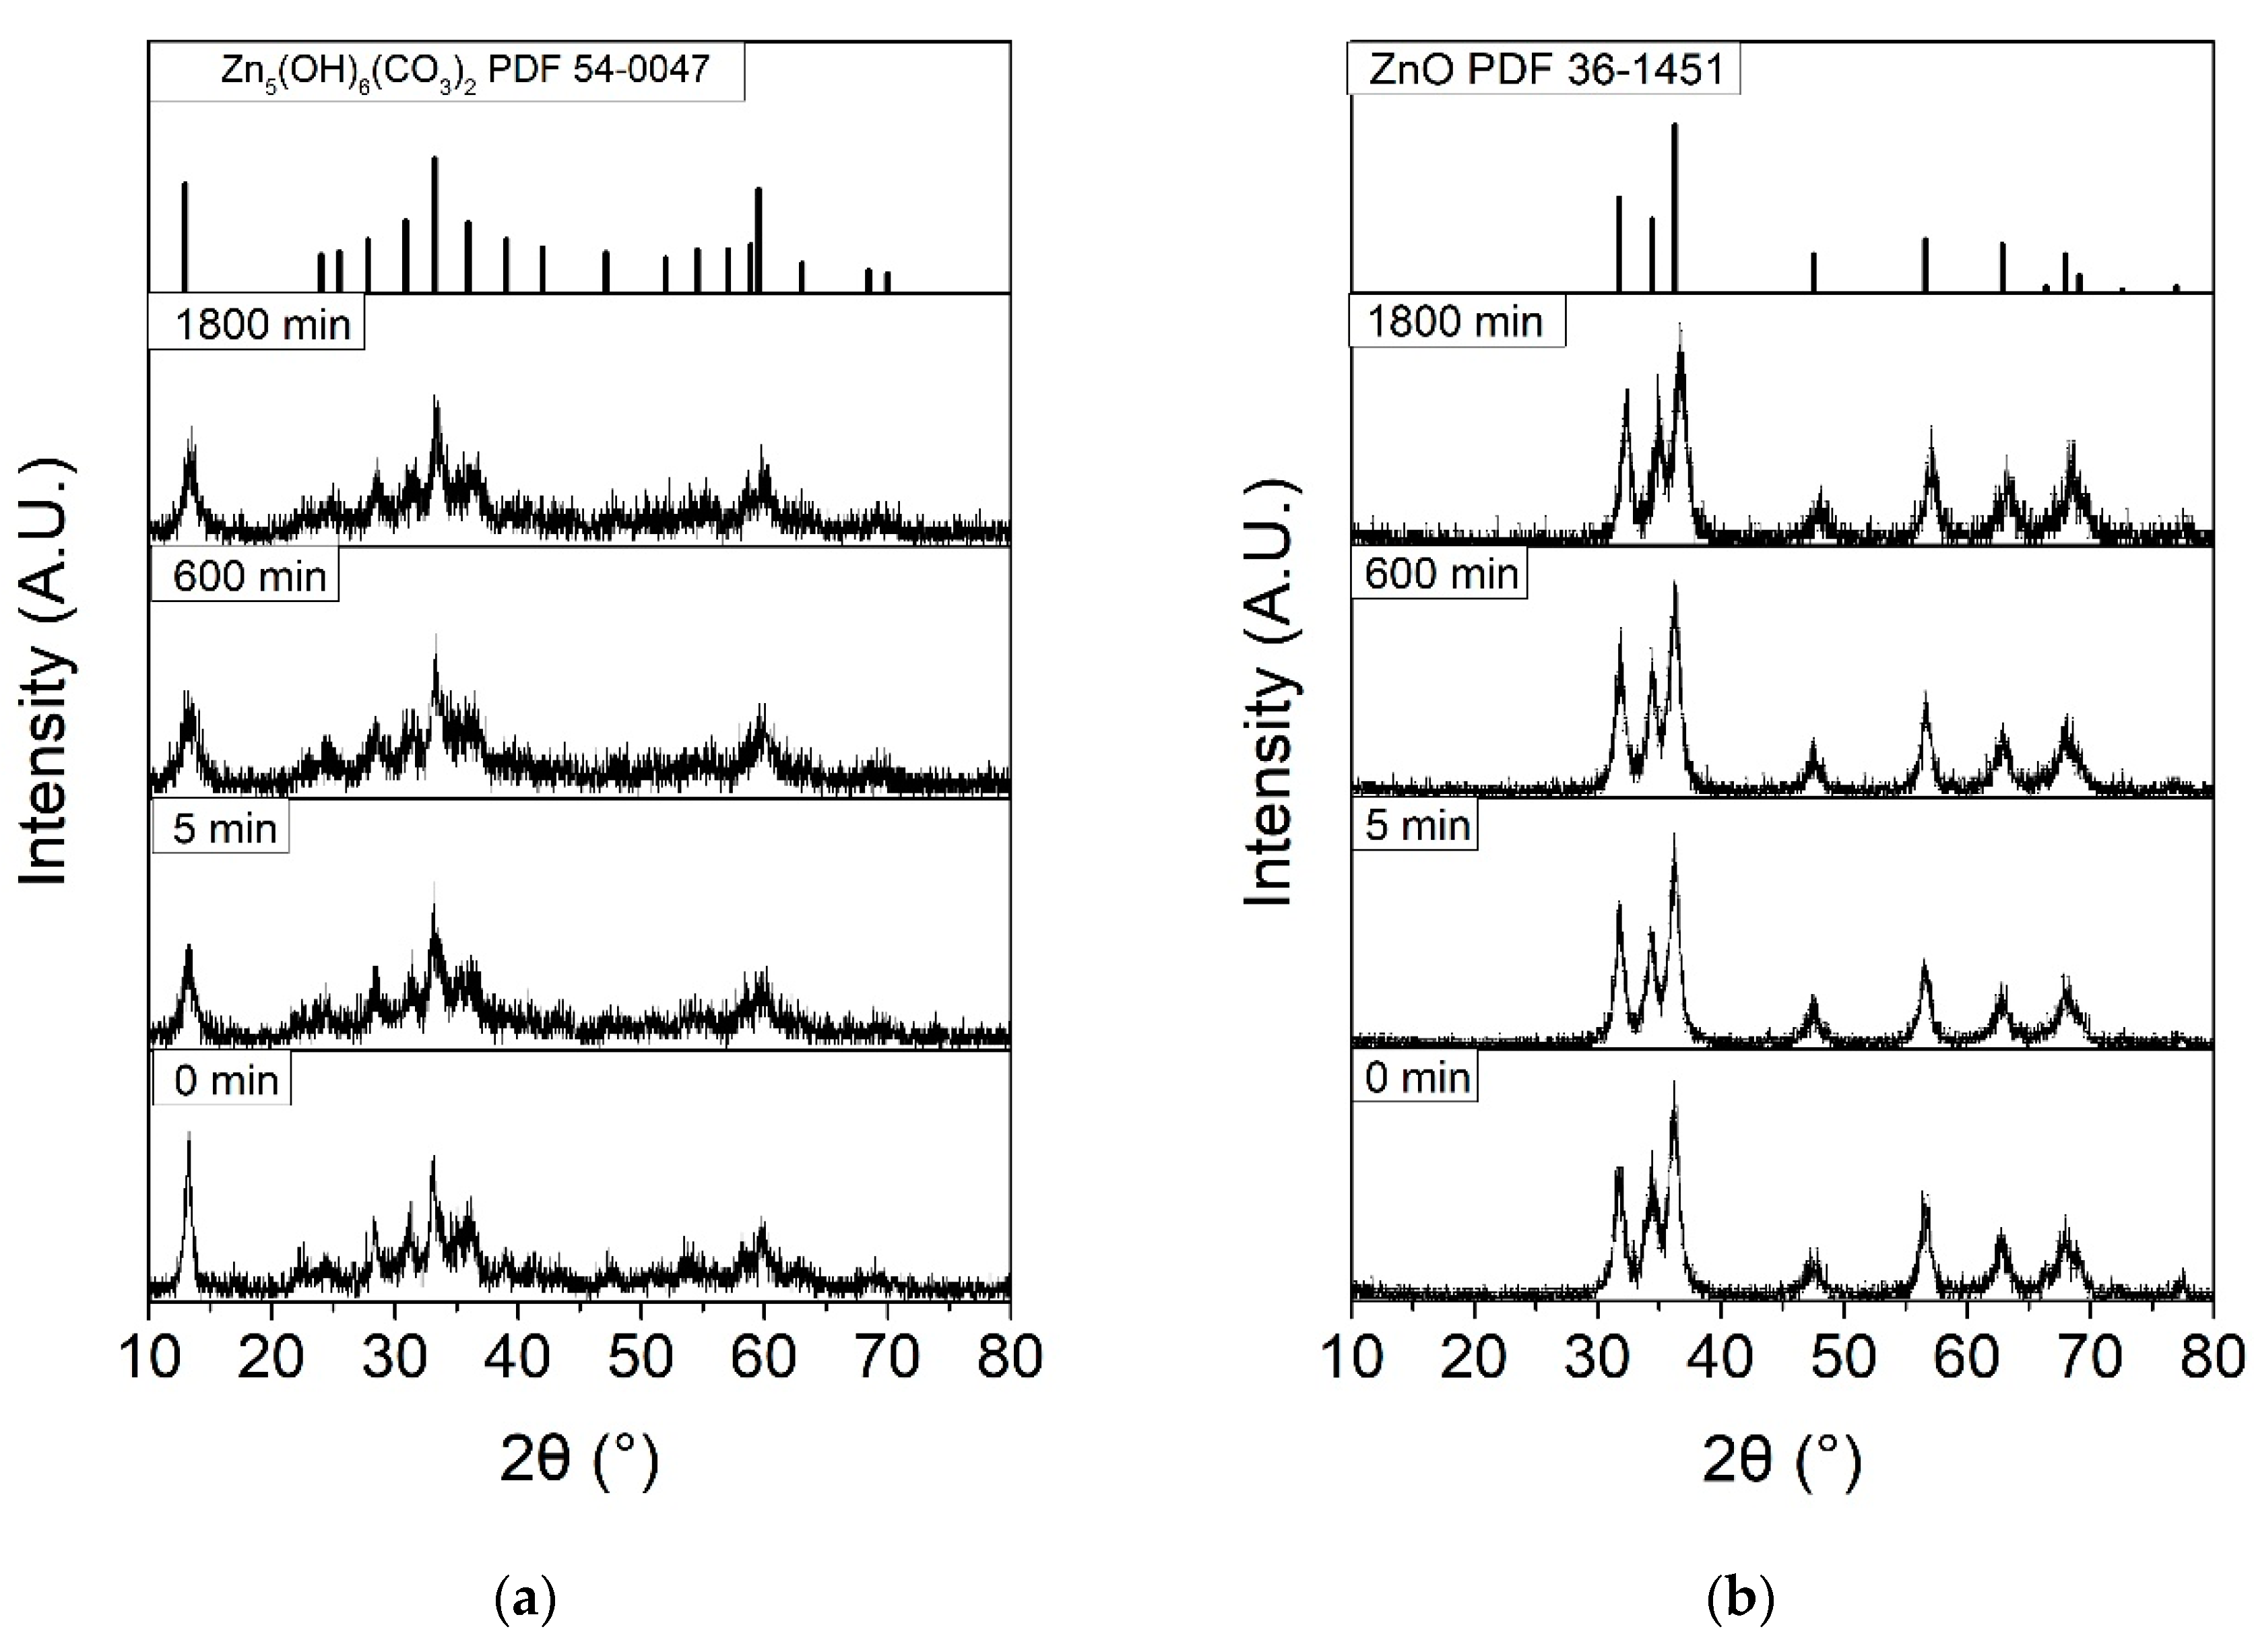
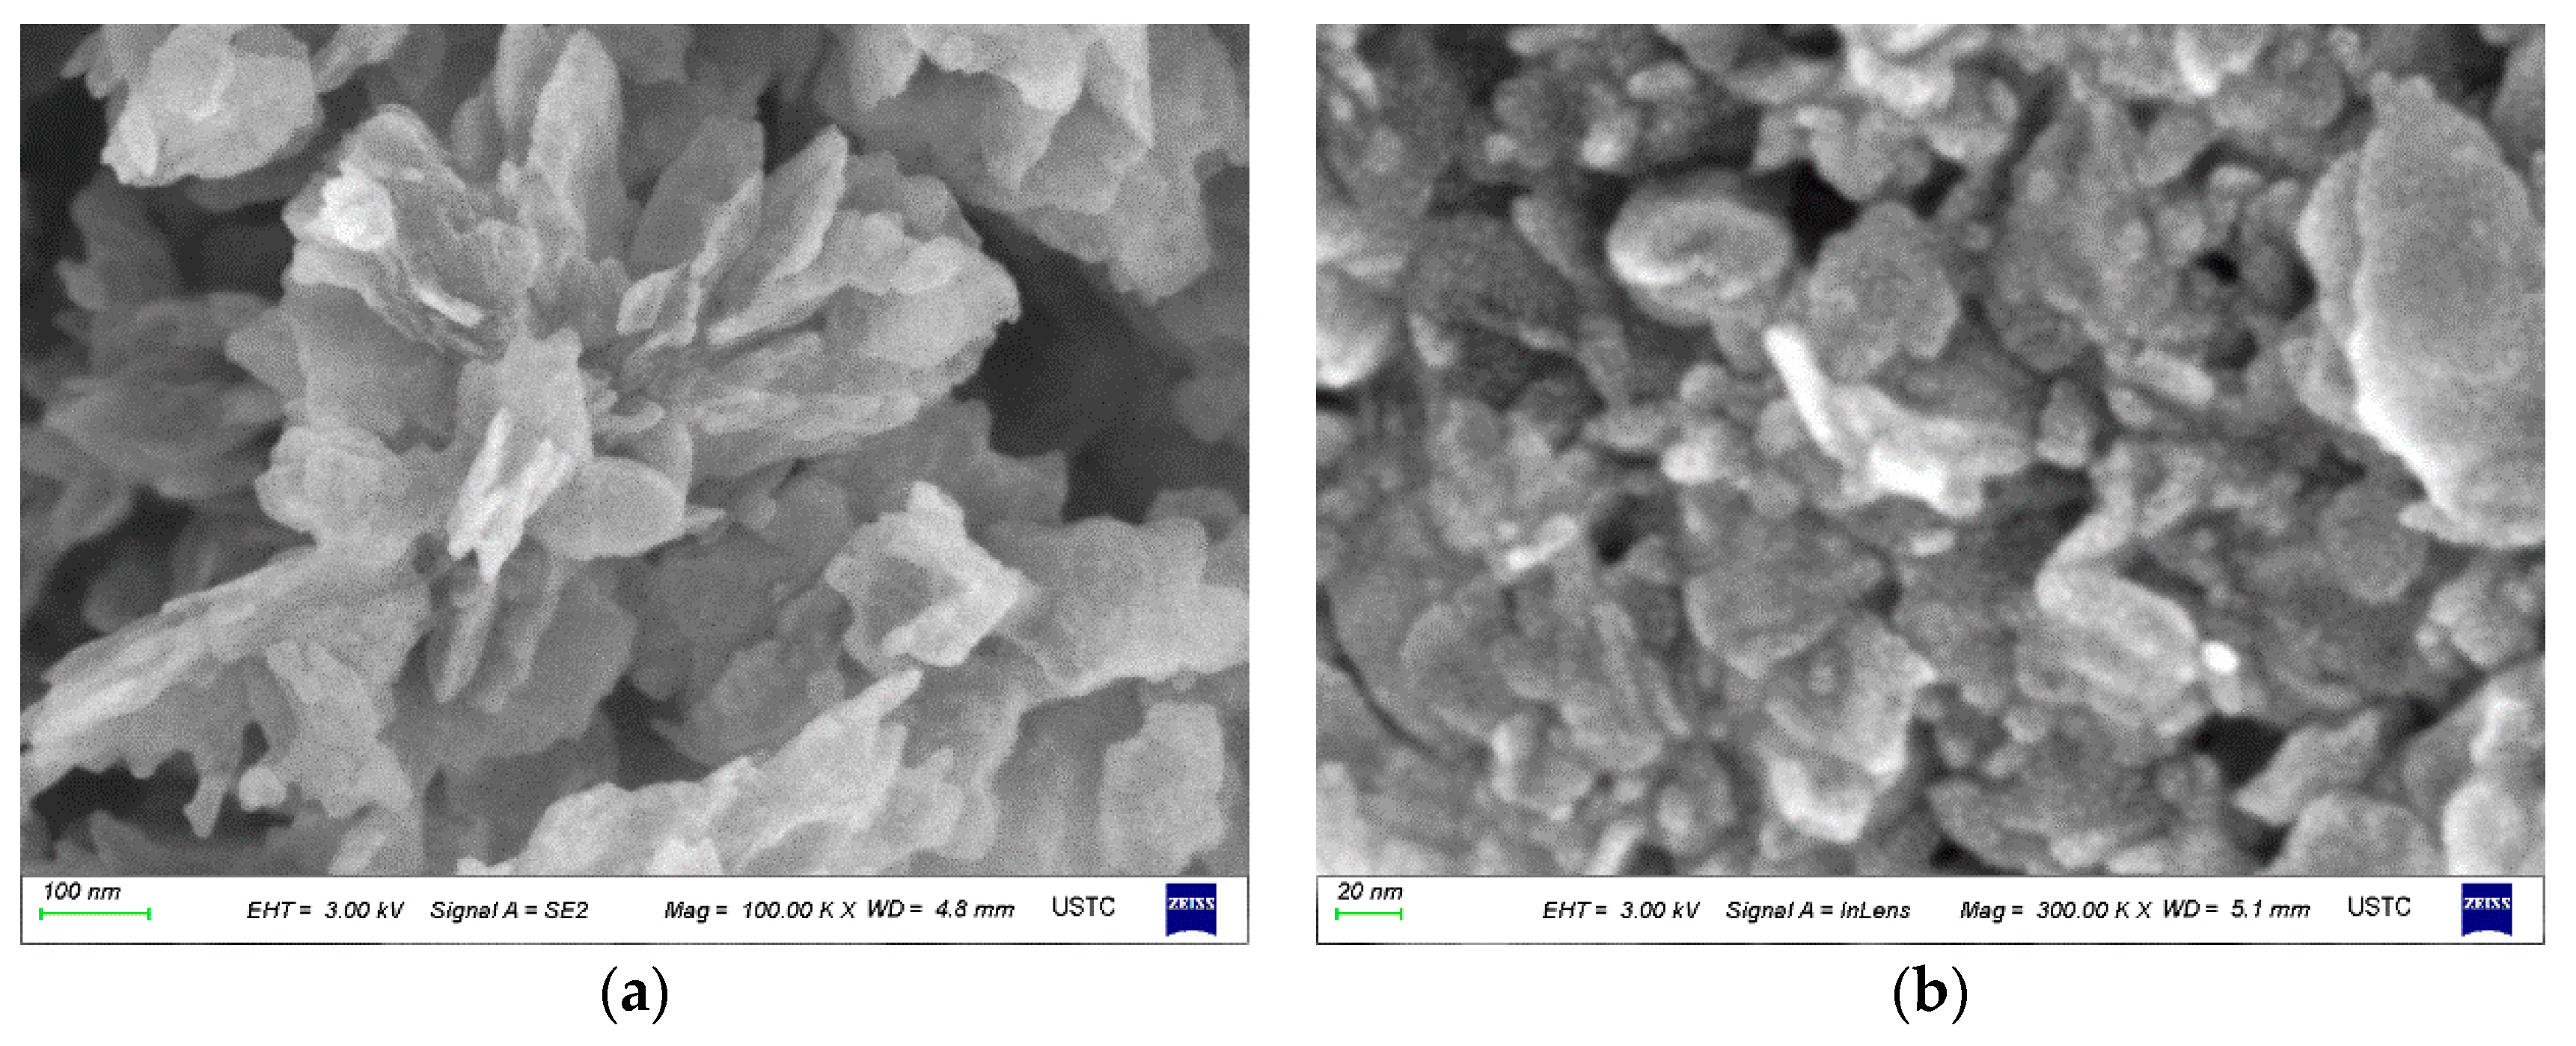
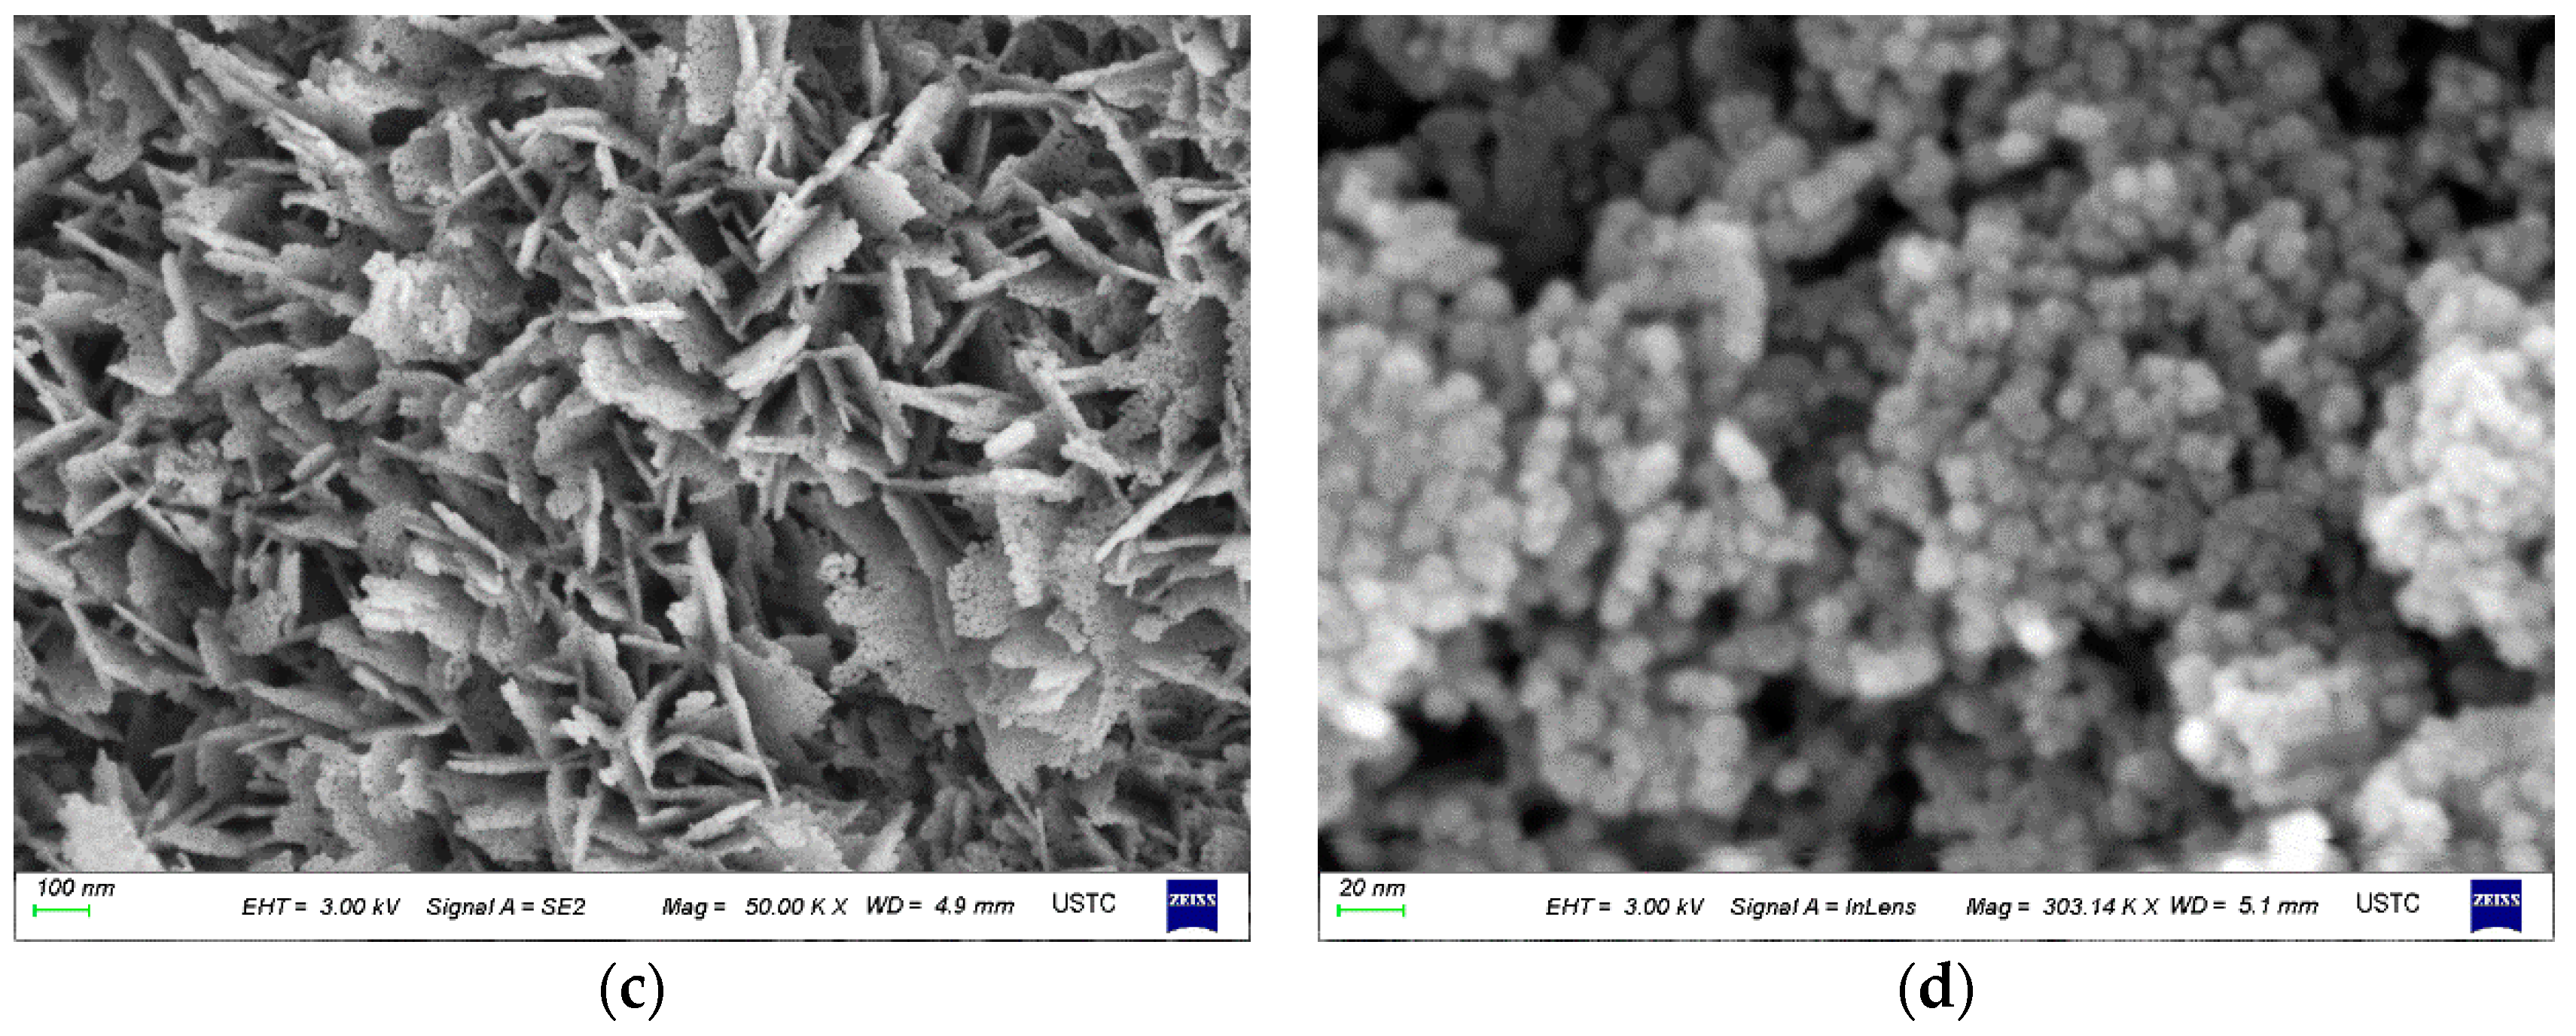
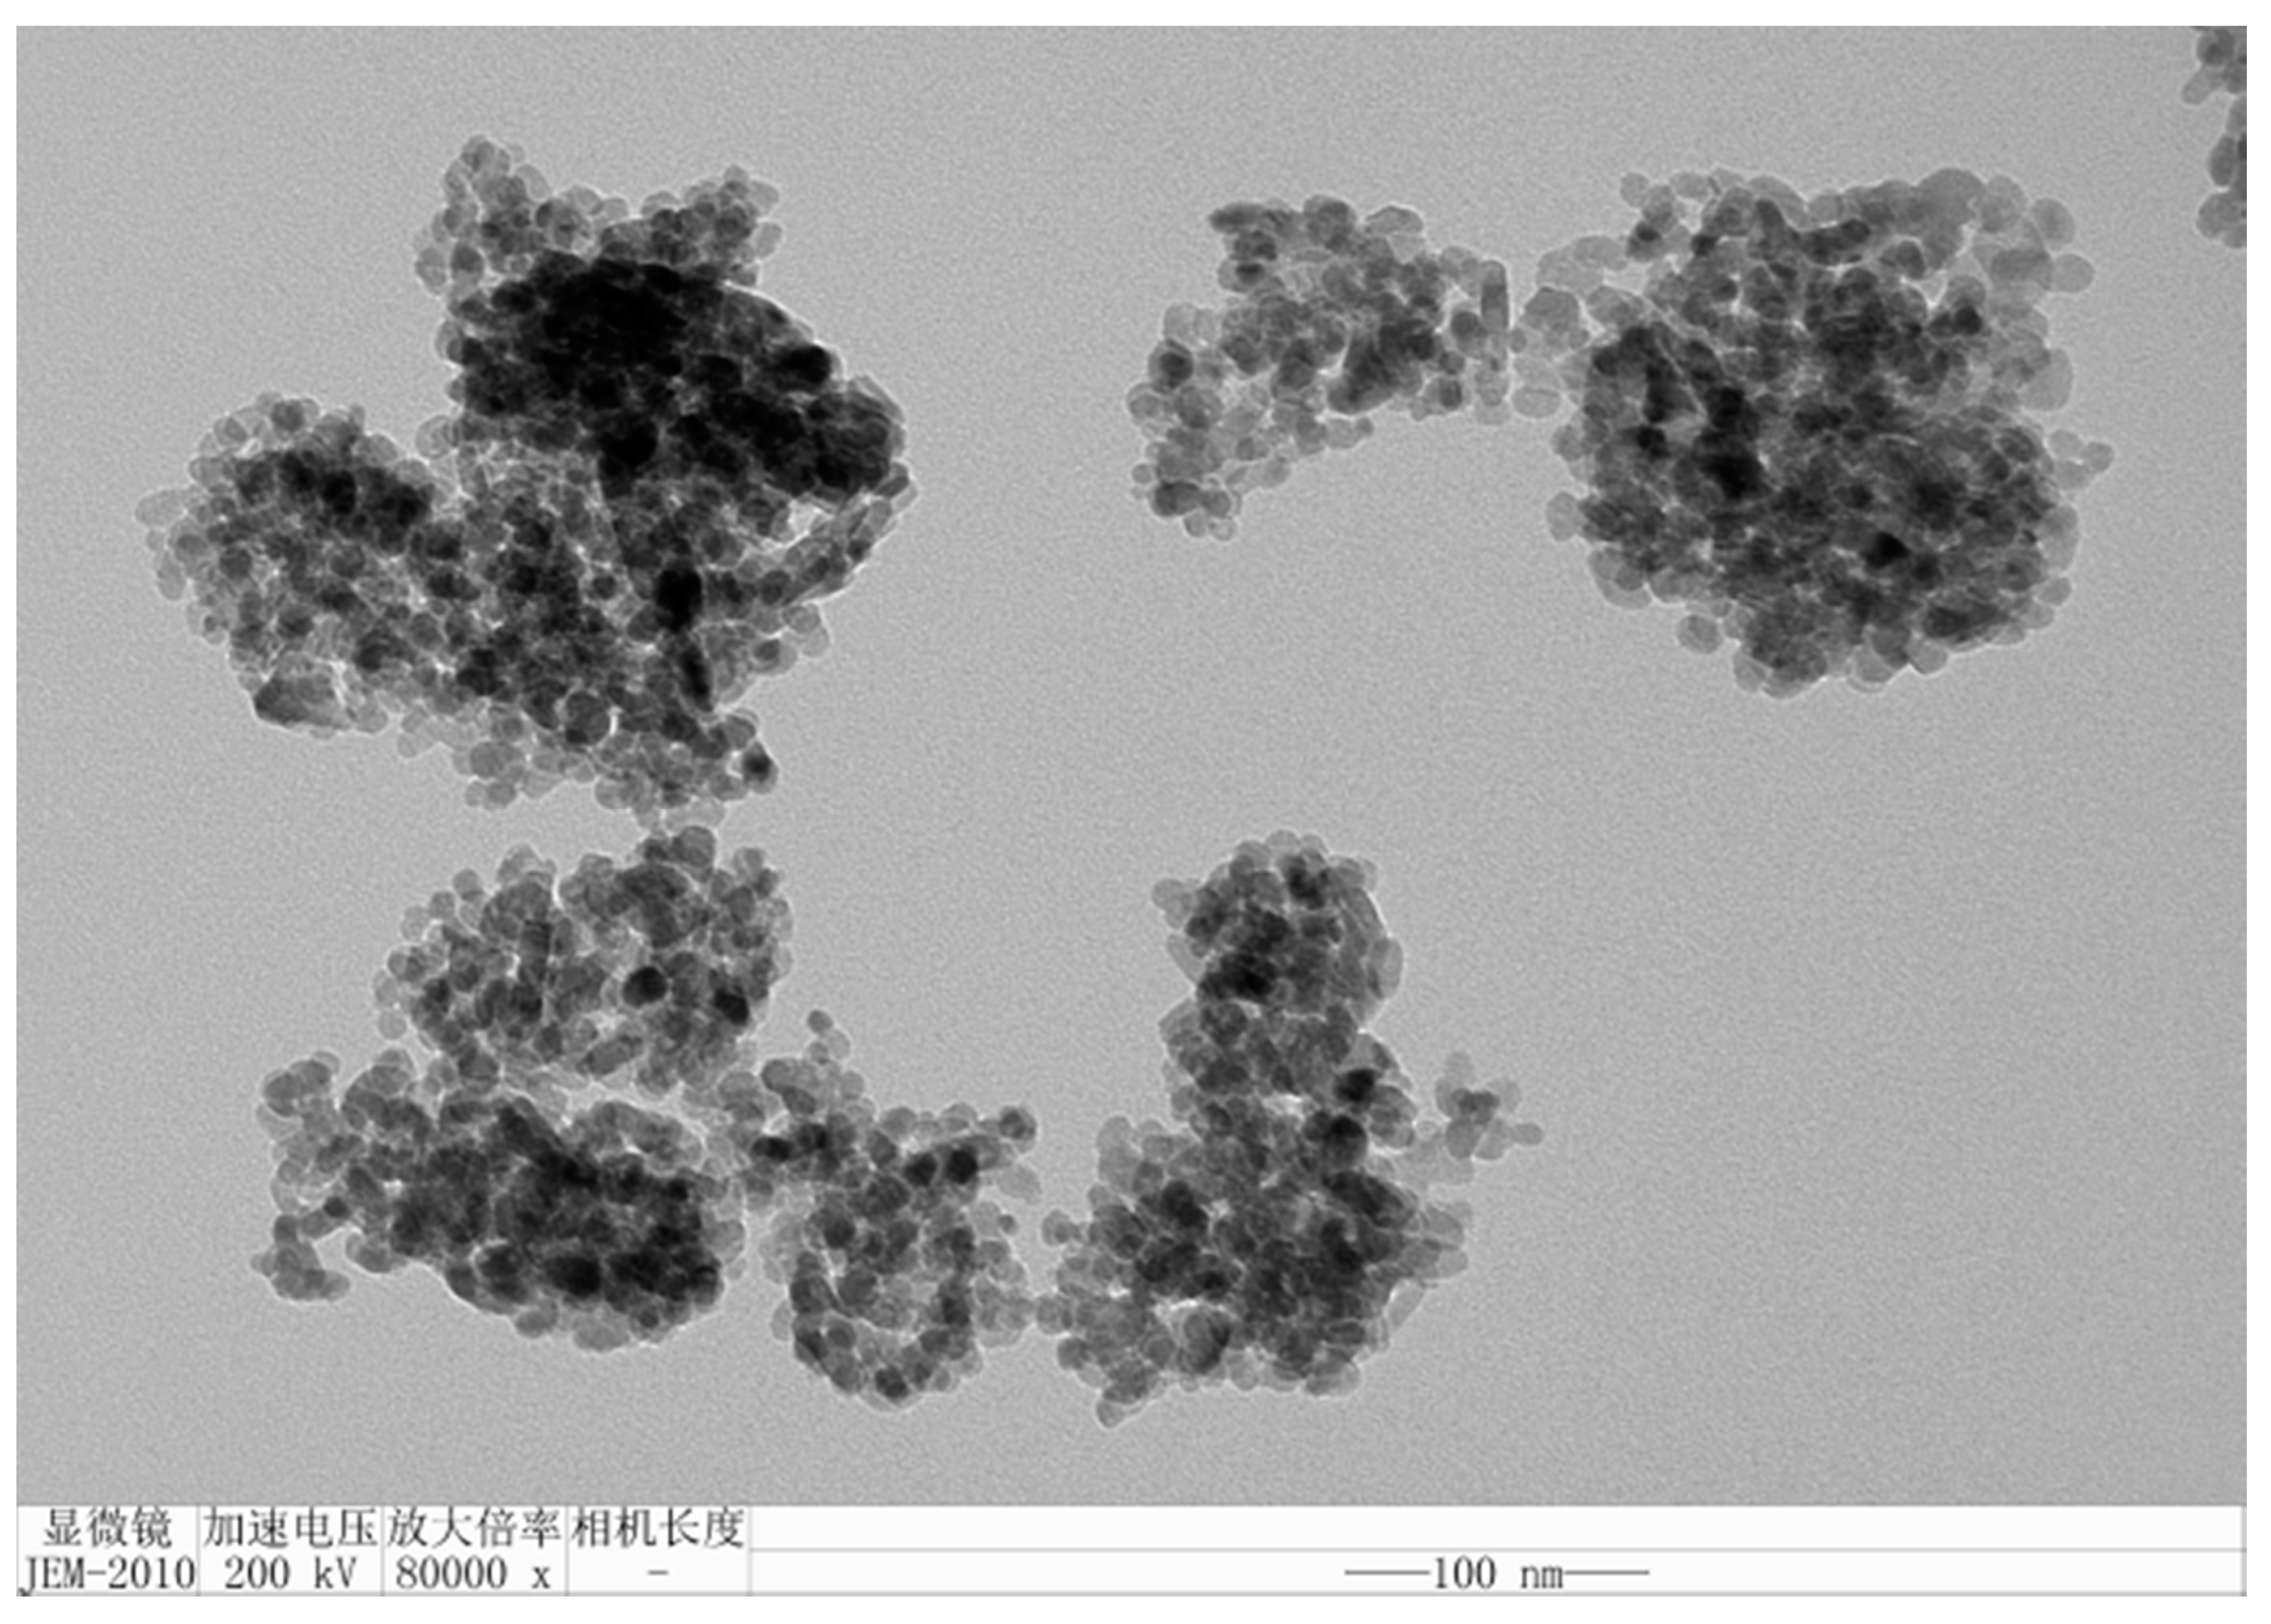
2.1. Structure and Morphology of ZnO Nanospheres

Figure 1 shows the XRD patterns of the precursors and ZnO products at different ball milling times. The XRD peak positions of Zn5(OH)6(CO3)2 was the same after the three different milling times and were consistent with the standard PDF 54-0047 for Zn5(OH)6(CO3)2 (Figure 1a). No obvious changes in the chemical composition and no phase transition were observed after the ball milling process. Here, crystallite size was carried out for Zn5(OH)6(CO3)2 and ZnO by selecting diffraction peaks near 13° and 36°, respectively (see Table 4), according to the Scherrer formula:
D = K γ B cos θ
where K is the Scherrer constant, D is the average thickness of the grain perpendicular to the grain plane, B is the half-height or integral width of the diffraction peak of the measured sample, θ is the Bragg angle and γ is the X-ray wavelength of 1.54056 Å. With time, the peaks for Zn5(OH)6(CO3)2 broadened gradually, indicating a decrease in crystallite size. This was caused by the continuous refinement of the powder during the ball milling process.
The XRD peaks of all samples in Figure 1b correspond to the ZnO standard card (PDF36-1451), and there were no peaks for other ZnO phases and Zn5(OH)6(CO3)2. The results showed that all ball milling precursors had decomposed completely at this temperature, and the decomposition products were hexagonal wurtzite ZnO. The XRD peaks of all samples also showed an obvious broadening phenomenon; the degree of broadening was more obvious than that of the precursor. After the calcination and decomposition of the precursor, the hydrogen and carbonate ions in the lattice gain energy at the calcination temperature. The pyrolysis reaction results in H2O and CO2 escaping from the lattice. The remaining zinc and oxygen in the crystal were converted to zinc oxide. The bonding mode of the bond changes to hexagonal wurtzite ZnO crystal, which leads to a decrease in the solid particle volume.
The crystallite size of the A3 product calculated using the Scherrer equation was 12.47 nm, which is consistent with the FESEM images.
Figure 2 shows FESEM images of the morphology and particle size of the precursor Zn5(OH)6(CO3)2 under different processing conditions. Figure 2a shows a FESEM image of the original Zn5(OH)6(CO3)2. The morphology was lamellar, and the size was approximately 200 nm. Figure 2b shows a FESEM image of Zn5(OH)6(CO3)2 milled for 600 min. At this time, the Zn5(OH)6(CO3)2 particle size changed to an equiaxed shape with the size ranging from 10 nm to 100 nm. The changes in powder form and size were caused by the impact, friction, shear and compression between the powder and the grinding ball.
Figure 2c shows an FESEM image of ZnO obtained after calcining the precursor at 300 °C. The chemical composition of the Zn5(OH)6(CO3)2 powder changed to wurtzite type ZnO without a change in micromorphology and size. Figure 2d presents a FESEM image of ZnO produced by the high-energy ball milling of Zn5(OH)6(CO3)2 for 600 min and calcination at 300 °C. ZnO showed a spherical morphology with a very uniform particle size distribution and a very small size.
FETEM was performed to observe the particle size of the product. As shown in Figure 3, after ball milling for 600 min and calcination at 300 °C, the ZnO product was almost spherical with a particle size of approximately 10 nm and a uniform particle size distribution. At this time, ZnO still maintained the wurtzite type phase.

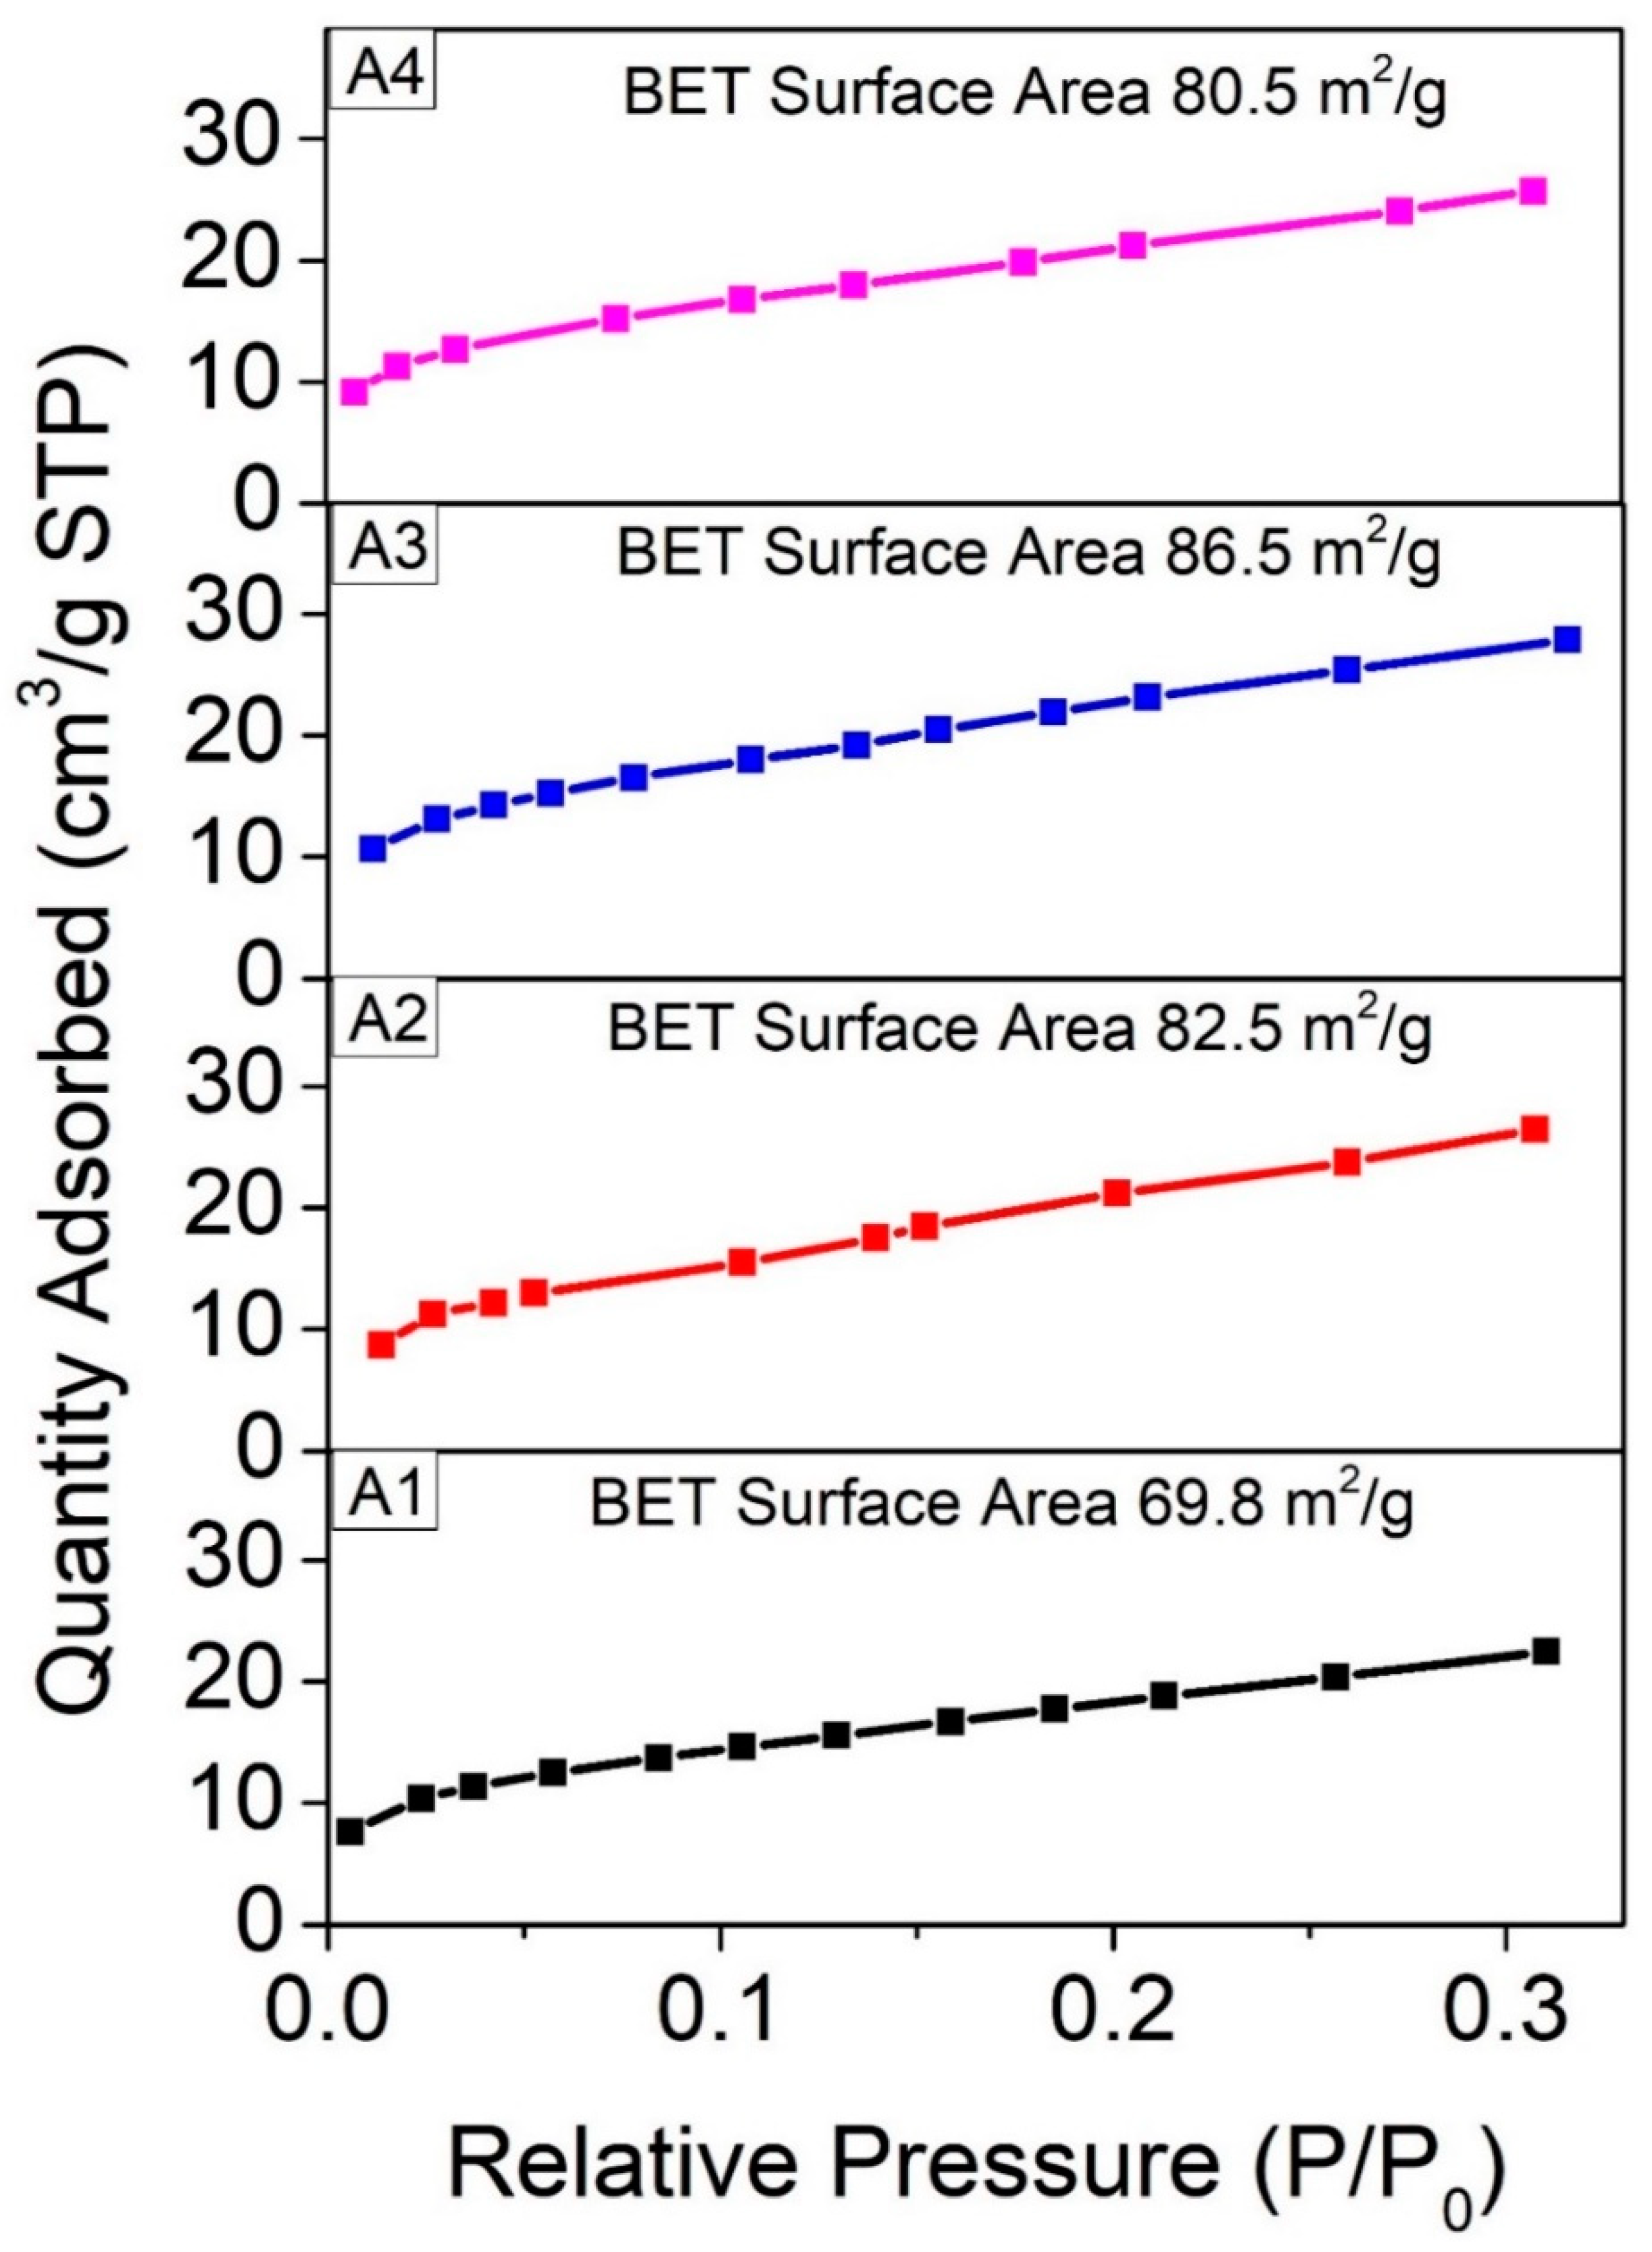
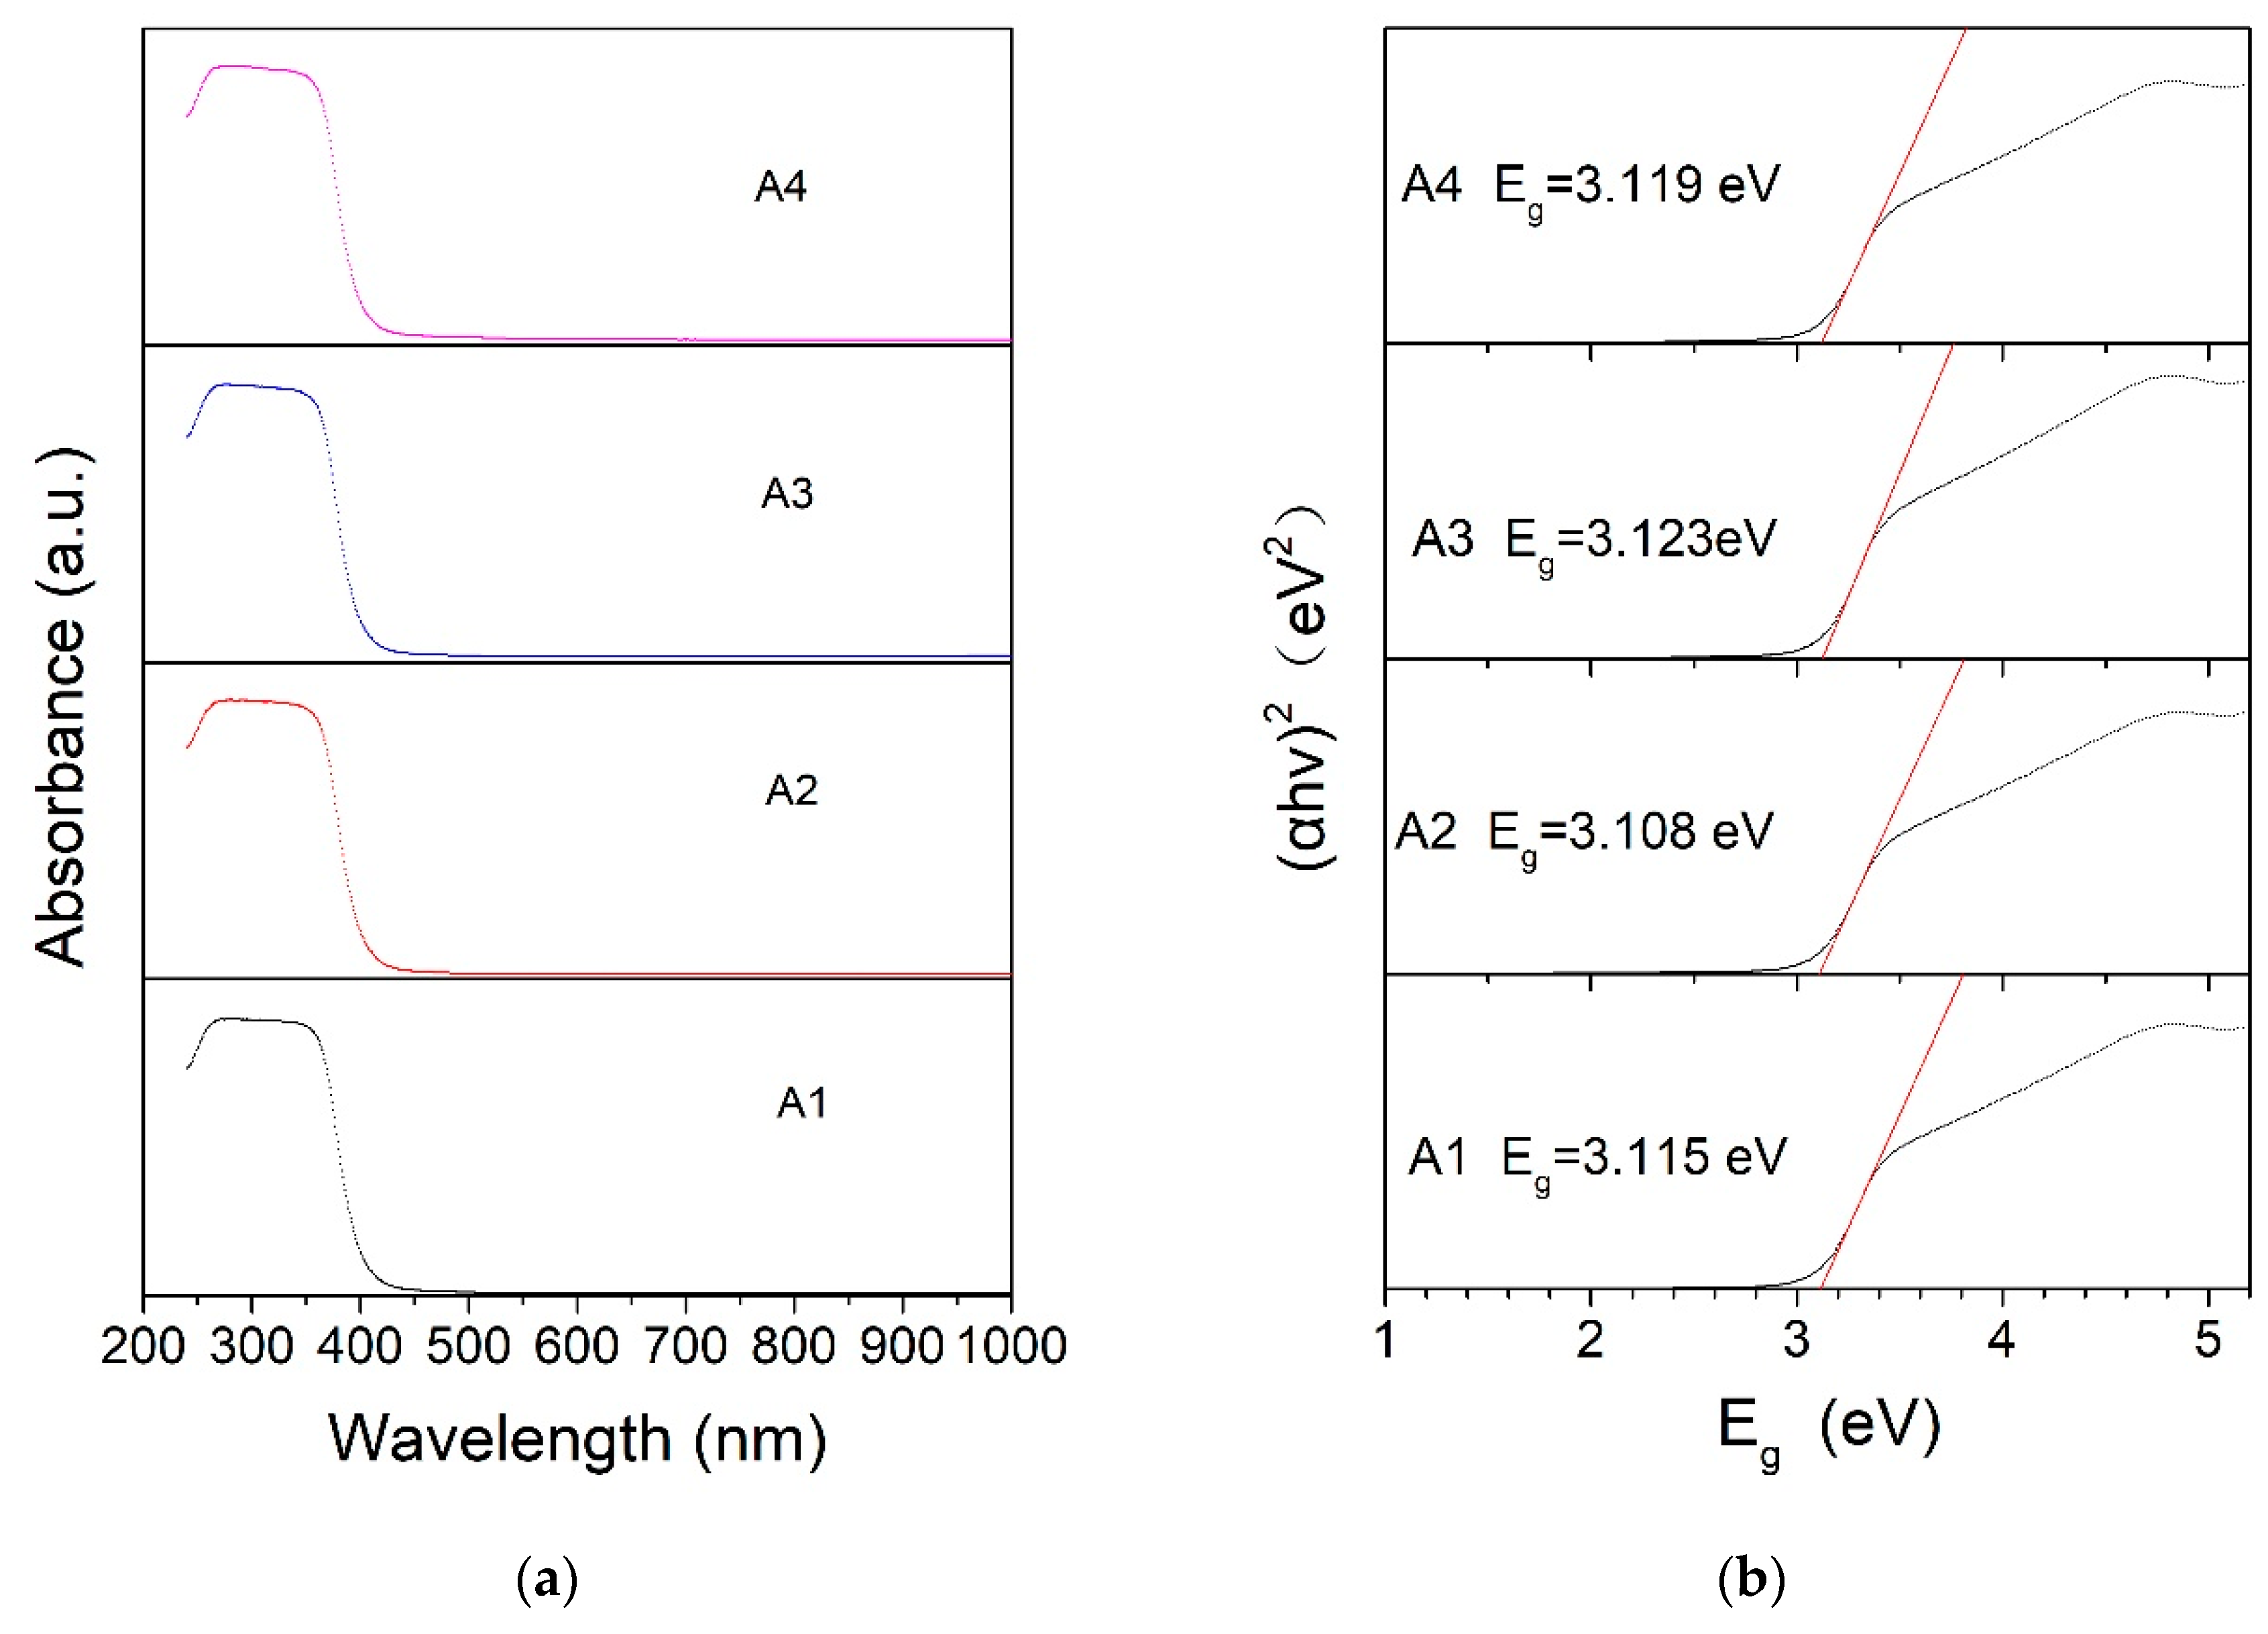
2.2. BET Surface Areas and Bandgap of ZnO Nanospheres

Figure 4 shows the BET surface areas of the four products. Anhydrous ethanol comprising 50% of the mass of the material was used as a control agent for the grinding–milling process to allow the sample to be ground sufficiently and reduce agglomeration. The BET isotherms showed that the specific surface area of the material during the entire grinding process was consistent with the conventional ball milling experiments. This means that in the early stages of the grinding process, the specific surface area of the product increases rapidly from 69.8 m2/g of A1 to 82.5 m2/g of A2. In the intermediate stages of the grinding process, the specific surface area increased slowly from 82.5 m2/g of A2 to 86.5 m2/g of A3. At the latter stages of the grinding process (when the crushing limit was reached), the specific surface area decreased slightly from 86.5 m2/g for A3 to 80.5 m2/g for A4. The BET specific surface area of the three ball-milled products reached or exceeded 80 m2/g. Specifically, the specific surface area of A3 reached 86.5 m2/g. According to the physical density of wurtzite type ZnO (5.606 g/cm3) and the FESEM images (spherical with a smooth surface and uniform size), the geometric diameter was 12.37 nm, which is consistent with the particle size in the FETEM image (10 nm) and the grain size calculated using the Scherrer equation (12.47 nm) from the XRD data. Therefore, the particles are single-crystal ZnO particles. Table 5 lists the specific surface area, bandgap, photocatalytic degradation efficiency, and the first-order rate constants for each sample.
The absorption spectrum is closely related to the energy band structure, which is a key factor in determining the photocatalytic efficiency. For ZnO, the optical absorption bandgap was estimated using the following formula:
( α h v ) 2 = A ( h v E g ) / 2
where α , h , v , E g , and A are the absorption coefficient, Planck constant, frequency, forbidden bandwidth, and a constant, respectively. A linear extension of a plot of ( α h v ) 2 vs. E ( E = h v ) to the x axis gives the E g value.
Figure 5a shows that all the products absorb only in the ultraviolet region within 400 nm. The absorption value in the visible light region beyond 400 nm decreased sharply to zero after 420 nm, which is similar to ordinary ZnO. The bandgaps E g of each ZnO product were between 3.108 and 3.123 eV (Figure 5b). The differences in the bandgaps of these samples were all within 0.015 eV, indicating a similar bandgap. Therefore, the large gap in photocatalytic performance was not due to a change in bandgap. High-energy ball milling can cause a certain degree of redshift in the bandgap, which may be caused by a large number of crystal defects inside the crystal. Using the equation, the calculated E g values of all the ZnO samples from UV–Vis DRS were less than the real optical bandgap of bulk ZnO, which is approximately 3.37 eV at room temperature. This might be related to oxygen vacancies and the concentration of defects in the ZnO samples [21]. At the same time, this test also demonstrated the difficulty of changing the E g of the material using long-time mechanical ball milling.

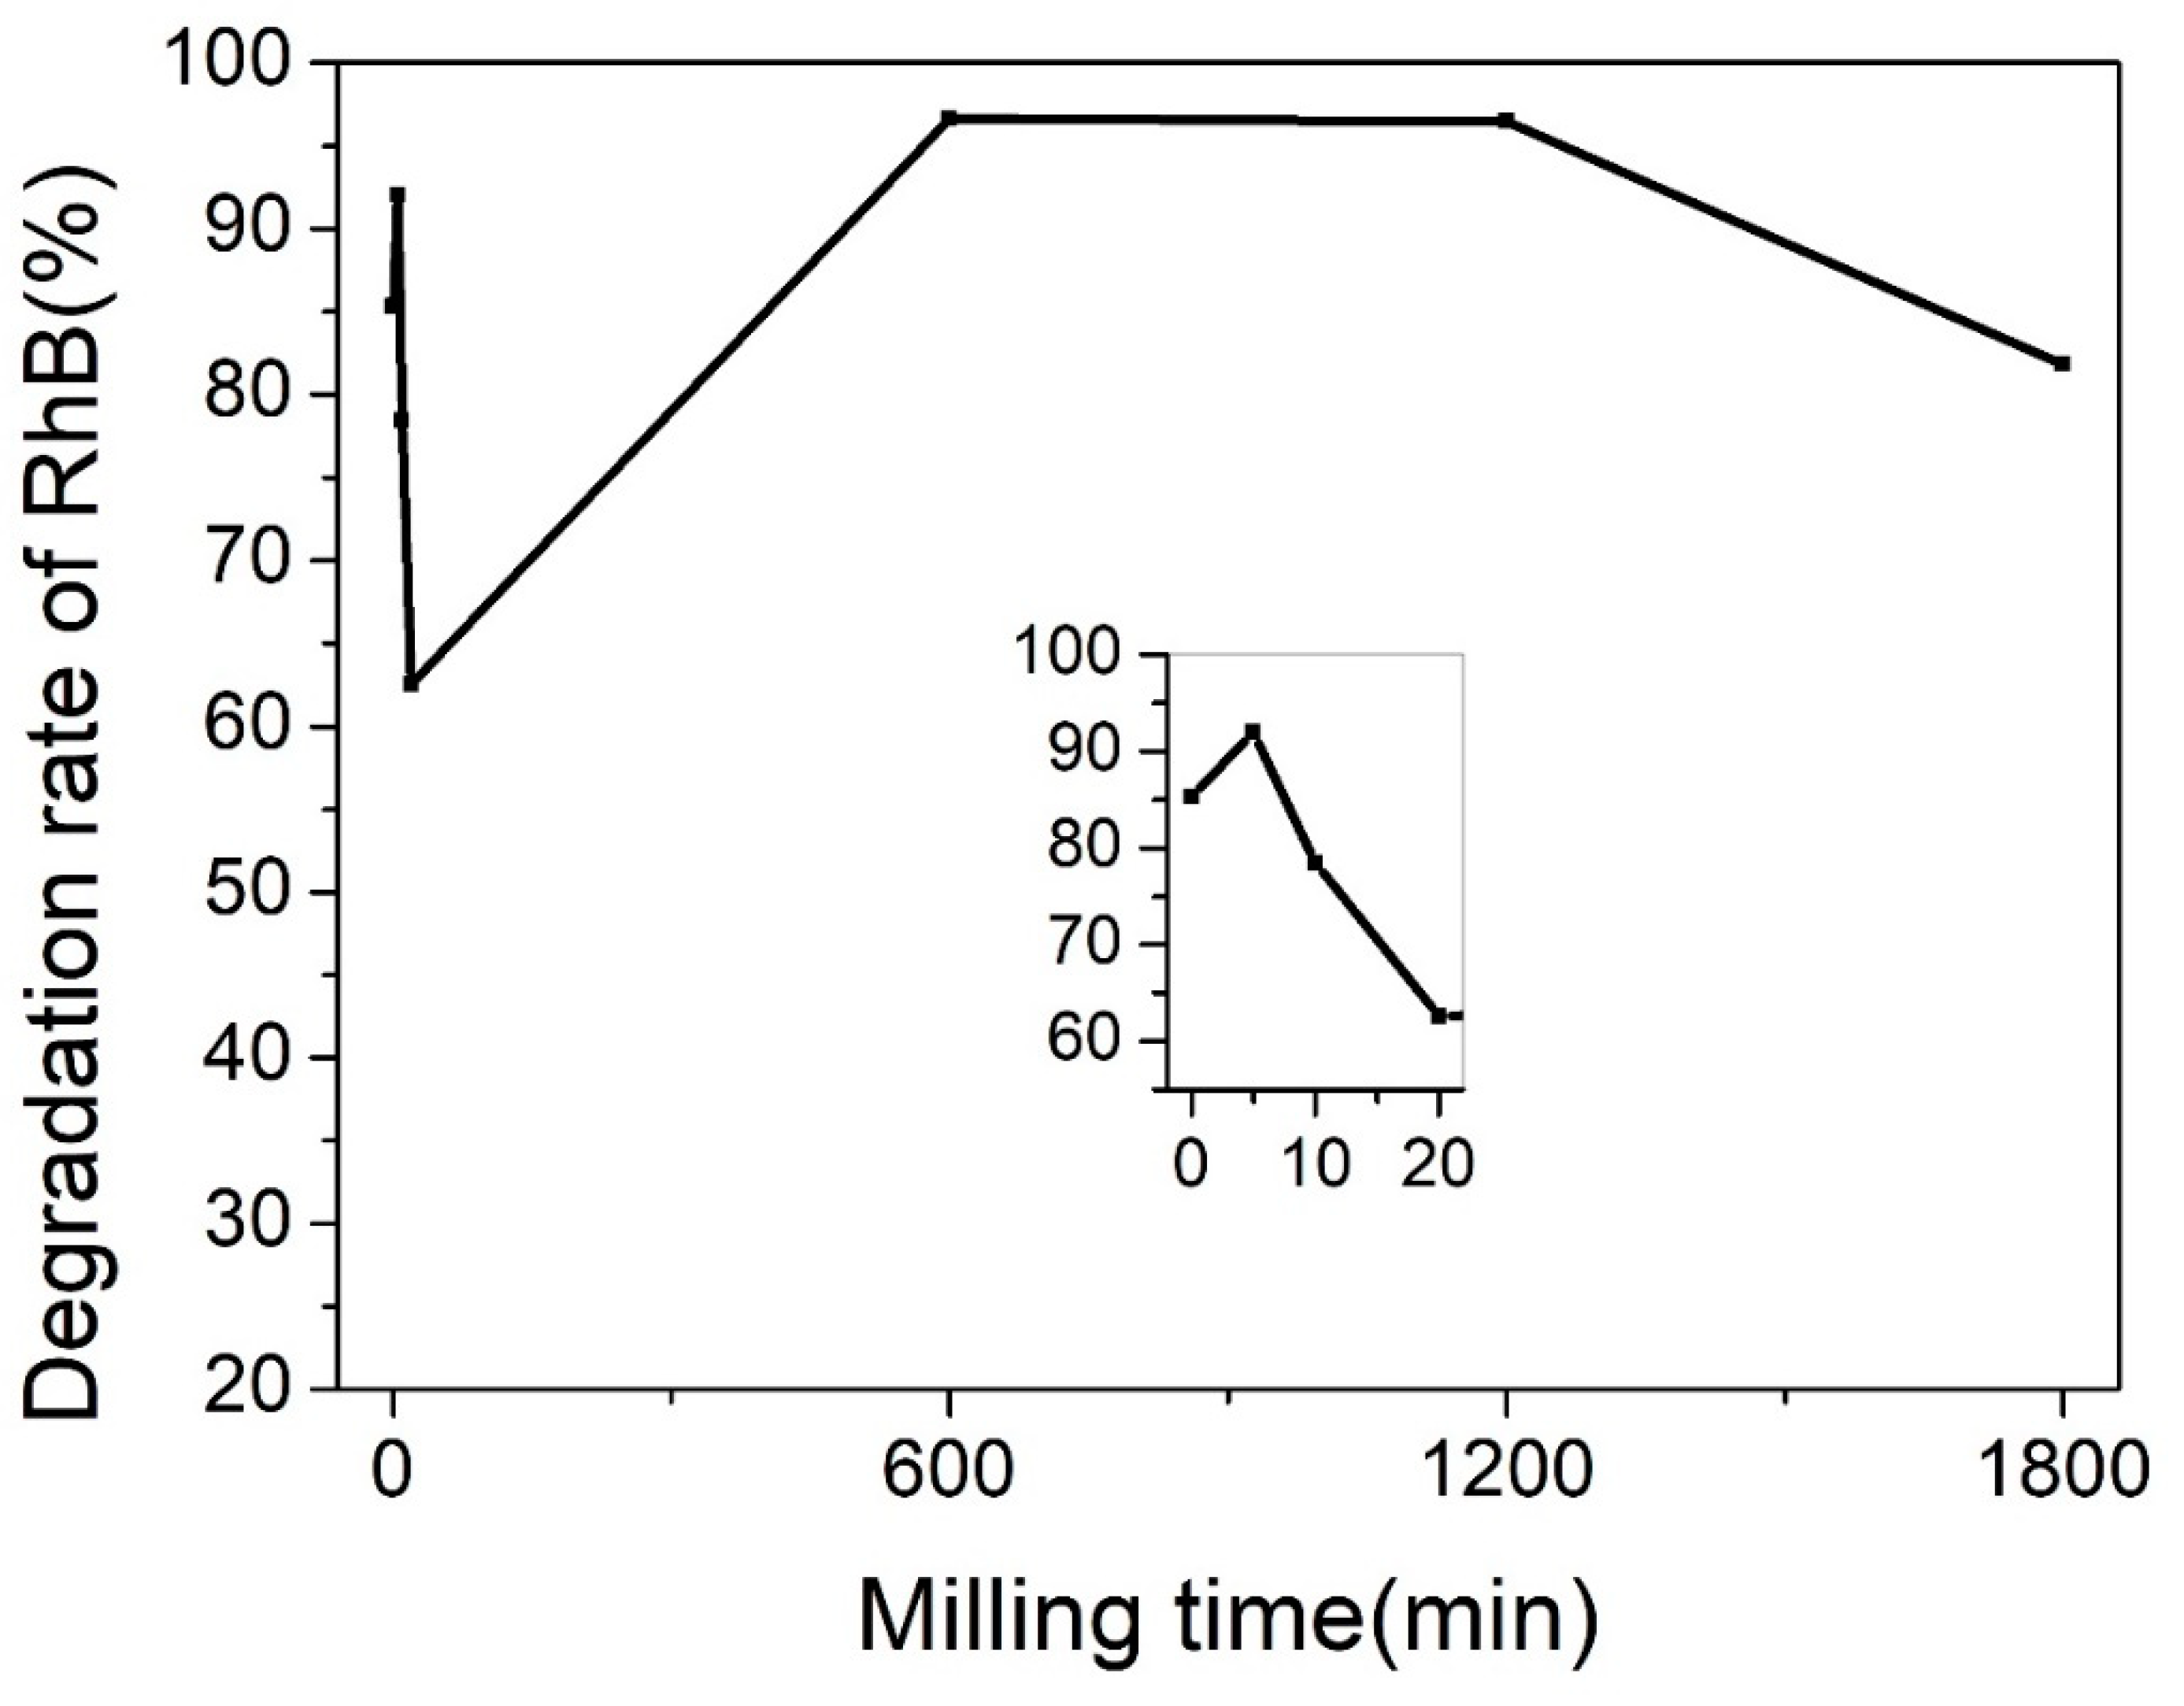
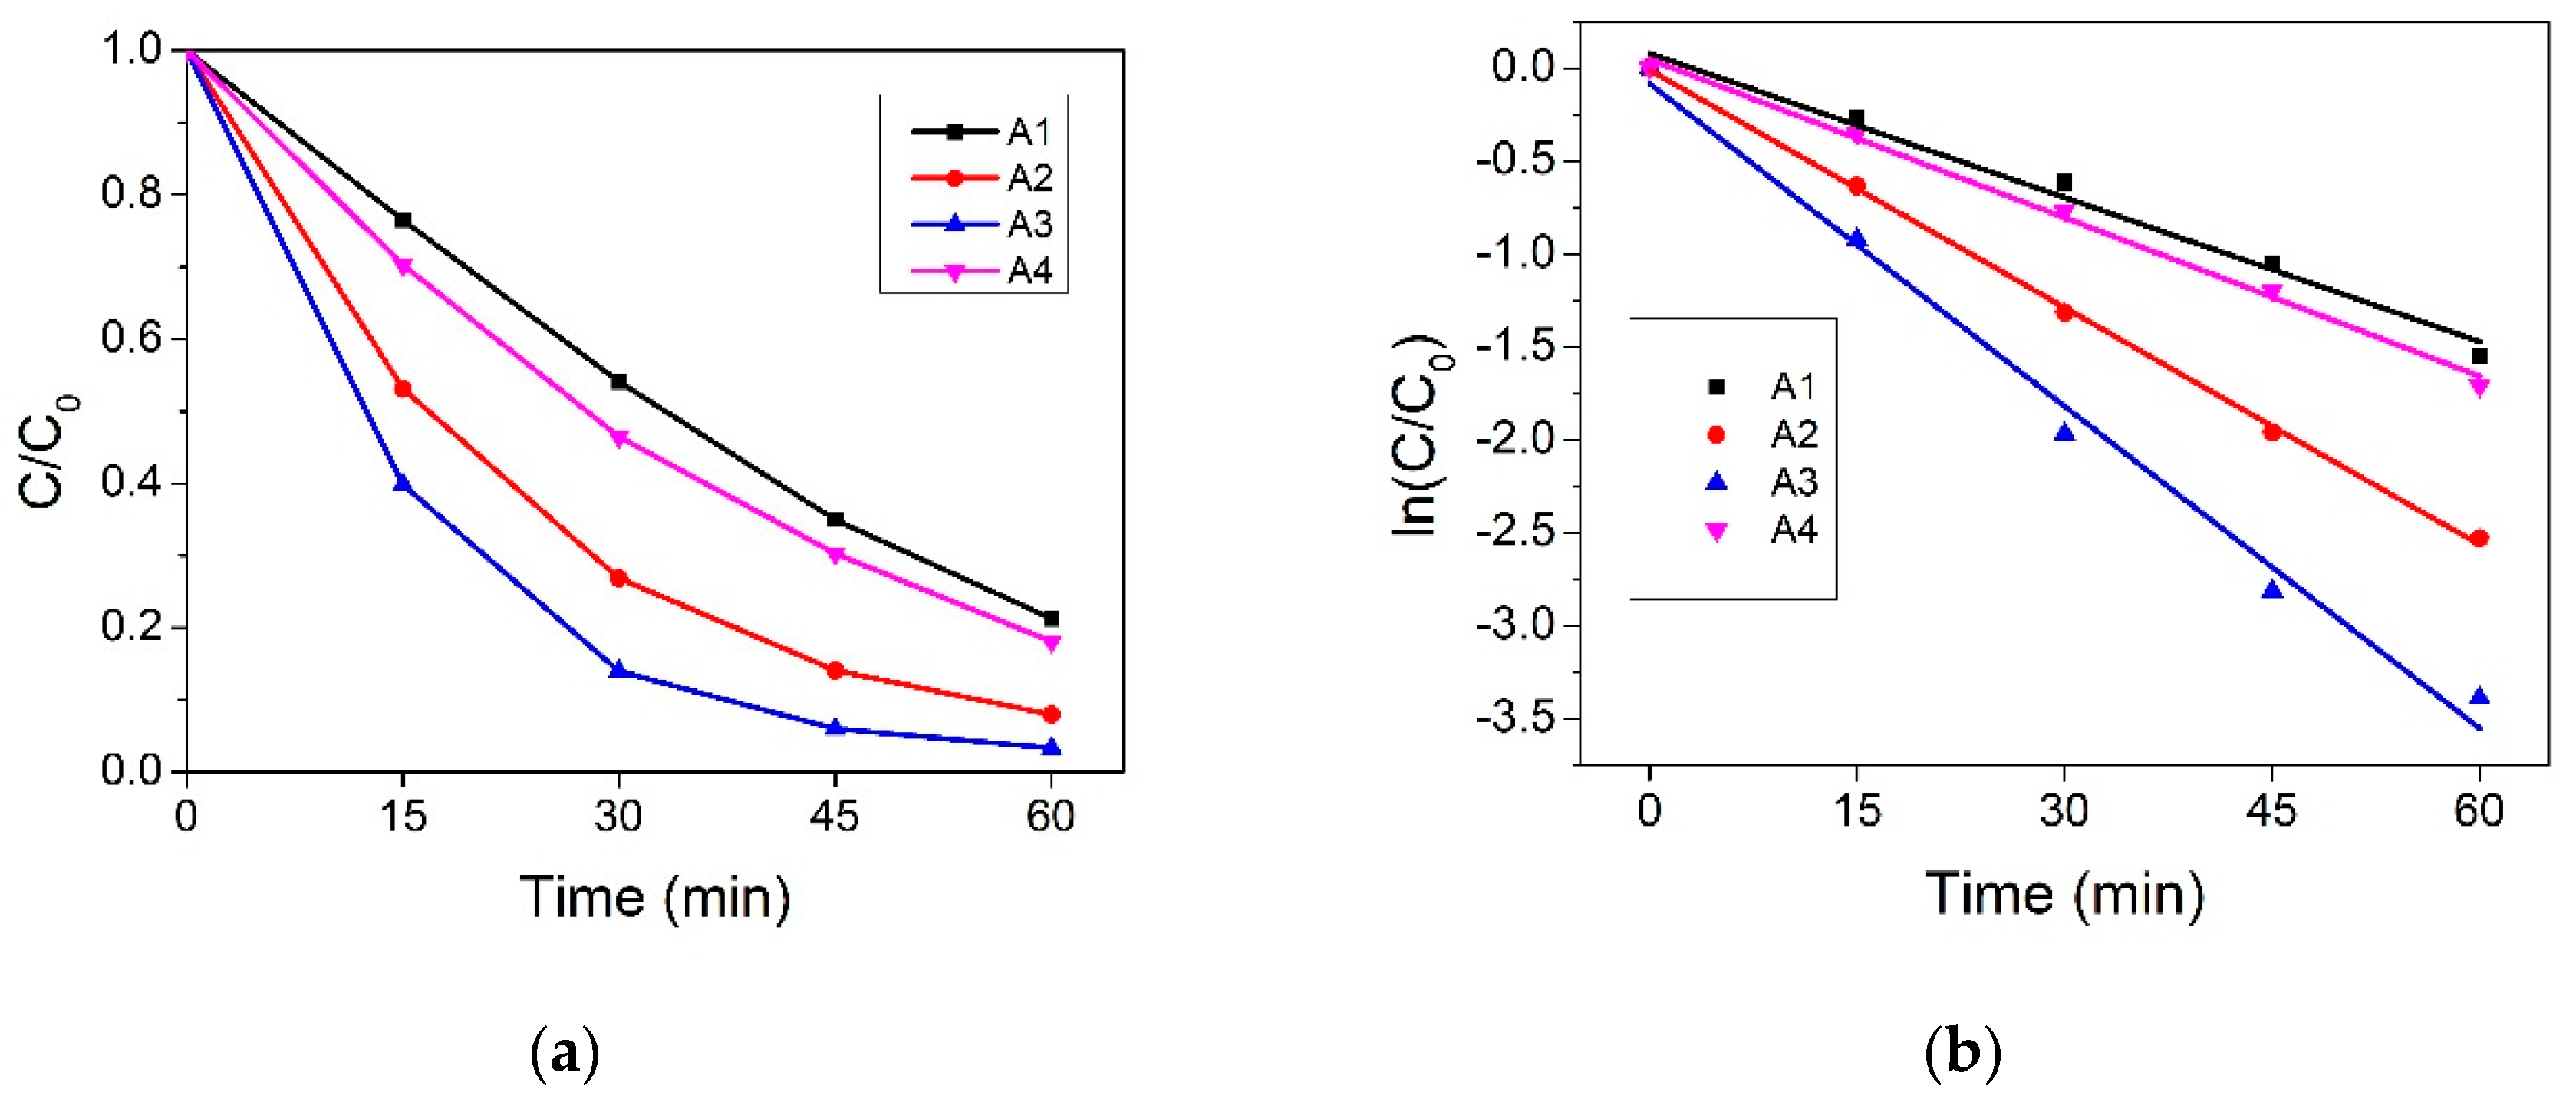
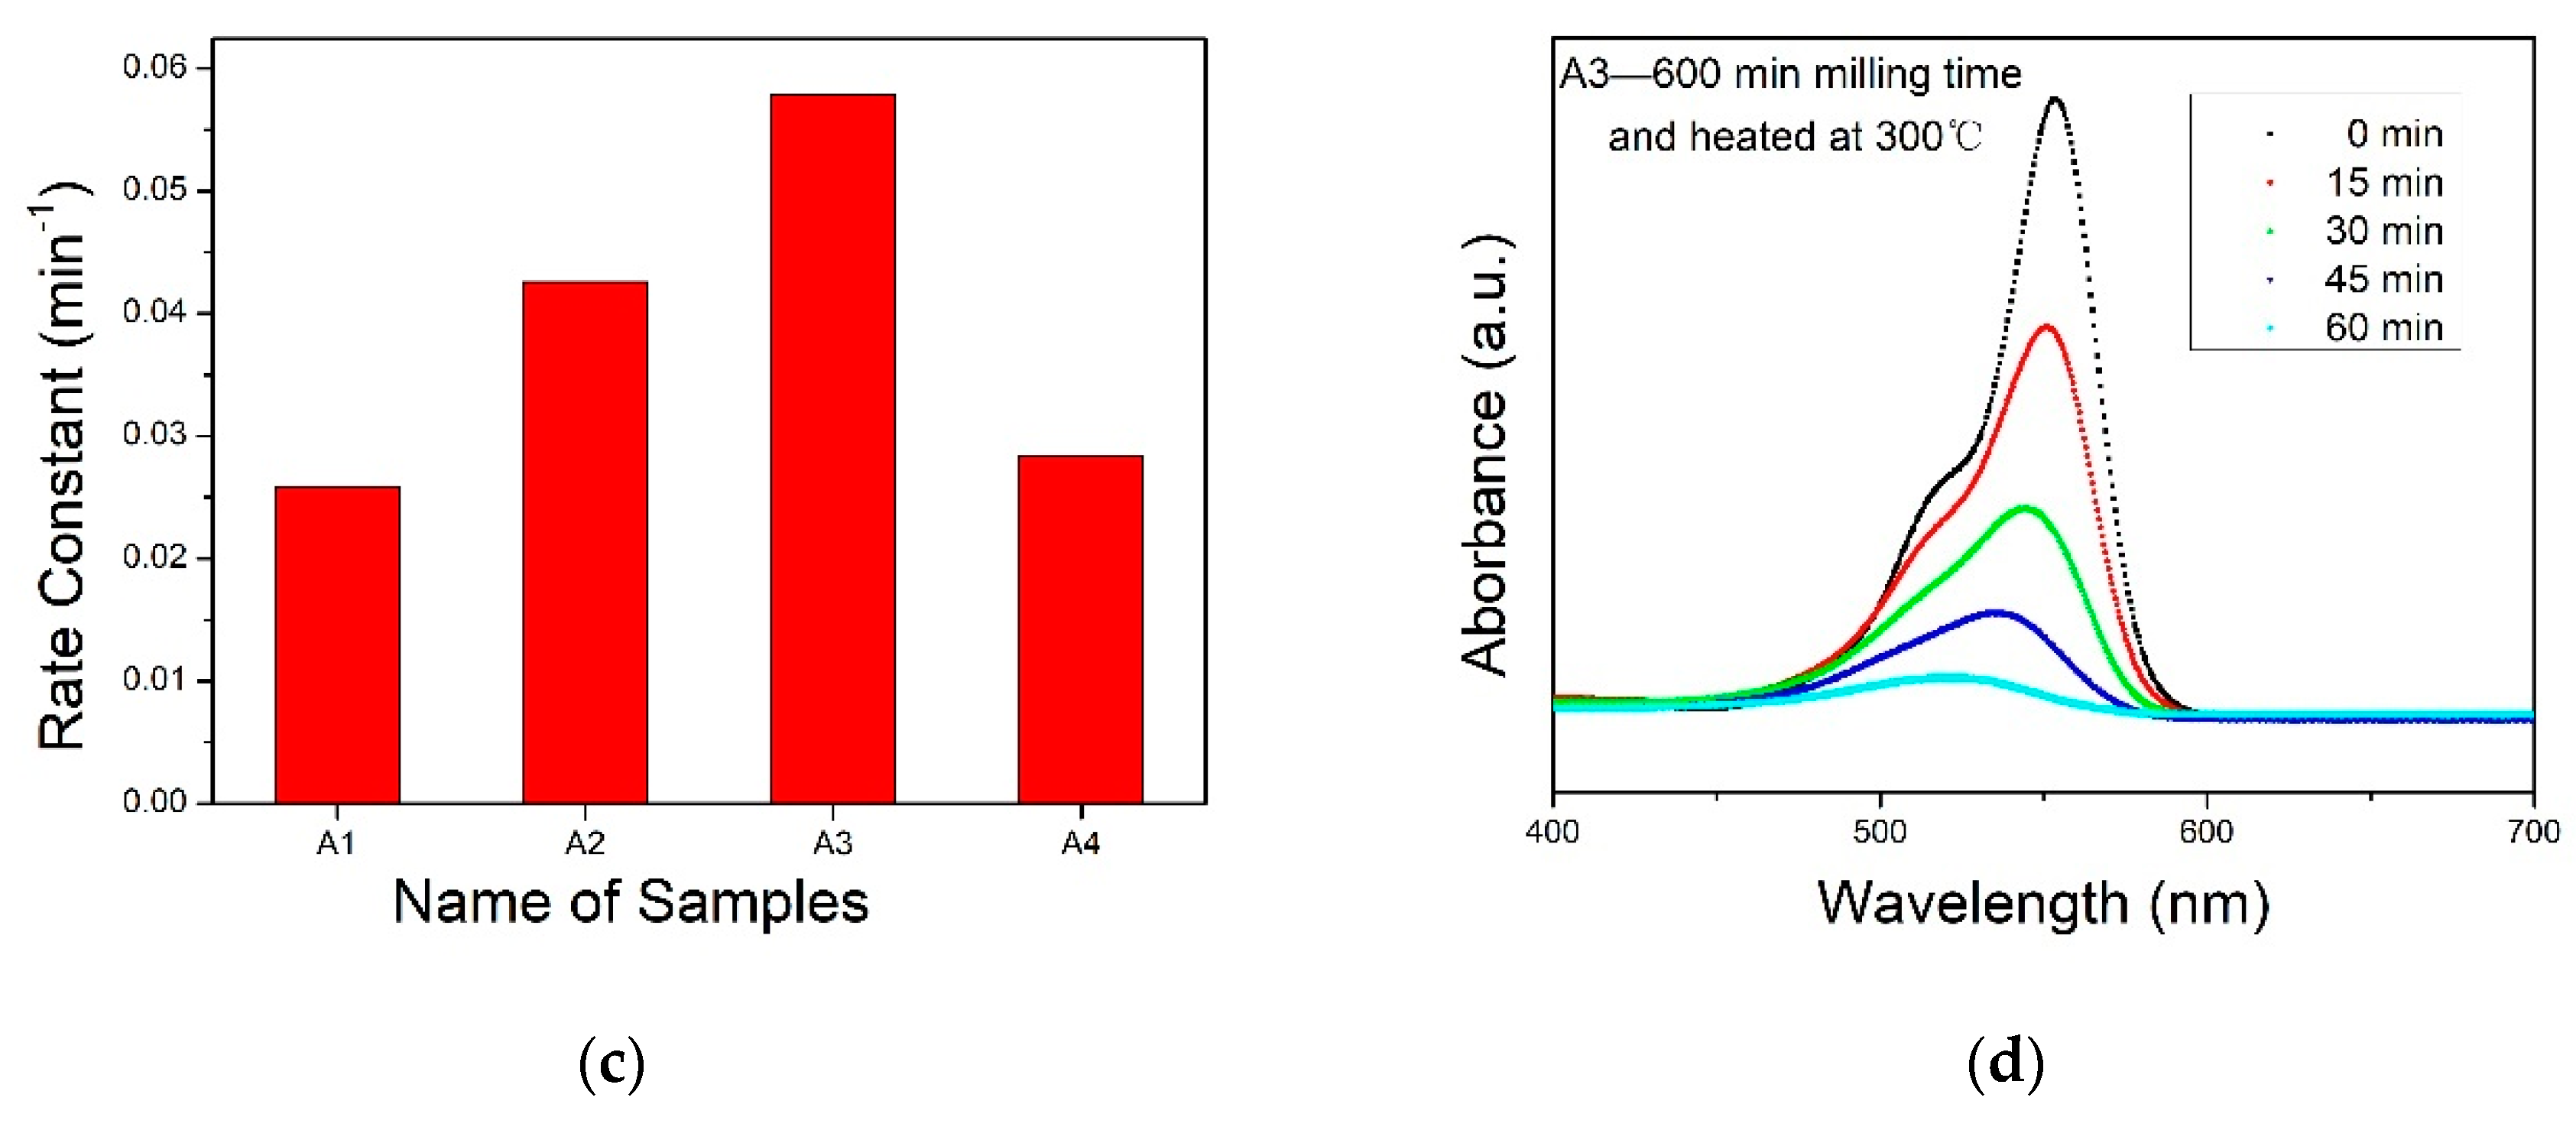
2.3. Photocatalytic Properties of ZnO Nanospheres

The effects of the milling time on the photocatalytic properties of the ZnO products were investigated using the milling times of 0 min, 5 min, 10 min, 20 min, 600 min, 1200 min, and 1800 min, keeping the other preparation conditions the same. Figure 6 shows the effect of RhB degradation in one hour for the seven samples at different times.
The performance of the sample improved rapidly in the first few minutes of ball milling, followed by a rapid decrease with large fluctuations. The photocatalytic performance was highest in the sample ball milled for 600 min, with a degradation efficiency of 96.63%. XRD and SEM showed that calcination at low temperatures could retain the spherical morphology and size (10 nm) of the precursor after high-energy ball milling. Therefore, the photocatalytic properties of the product can be attributed to spherical ZnO with a 10 nm particle size. The small particle size will have a large specific surface area, which will increase the adsorption of an organic compound to the photocatalyst and provide a large number of reaction sites. In addition, the morphology of hexagonal wurtzite ZnO, which should have a hexagonal shape, was spherical after high-energy ball milling and low-temperature calcination. Since the interplanar spacing of wurtzite ZnO ranges from 0.109 nm to 0.282 nm (XRD PDF36-1451), in the case of such a small grain diameter, the surface curvature was too large relative to the interplanar spacing. Therefore, the exposed surface was no longer some traditional crystal faces, but should be all crystal faces, allowing the full use of the photocatalytic effect of the dominant crystal face with good photocatalytic performance.
The rate of RhB degradation treated with the A2, A3, and A4 photocatalysts for different high-energy ball milling times was faster than that using the samples calcined directly without high-energy ball milling, as shown in Figure 7a. Among them, the degradation rate of the A3 photocatalyst was highest, up to 96.63% in 60 min under a simulated light source. On the other hand, the A1 photocatalyst without high-energy ball milling could only degrade 78.70% of RhB under the same conditions. The bandgap of all ZnO products was between 3.108 and 3.123 eV. High-energy ball milling promotes the photocatalytic modification of ZnO because the entropy and particle size of the A3 sample reached the limits of high-energy ball milling. Moreover, defects can become a trap of photogenerated electrons, inhibiting the composite of photogenerated charges of materials, promoting their separation, and enhancing the photocatalytic performance. The extremely small particle size and various crystal surfaces exposed also provide a large number of reaction sites for the photocatalytic reaction.
Figure 7b,c show the degradation rate constants calculated using the degradation rate formula, ln ( C / C 0 ) = k t . The first order rate constants (k) for the degradation of RhB using the A3 photocatalyst was 0.05781 min−1.

3. Experimental

3.1. Materials and Instruments

Table 6 and Table 7 list the materials and instruments used in the experiment, respectively.

3.2. Synthesis of ZnO Nanospheres

3.2.1. Ball Milling Process

The Zn5(OH)6(CO3)2 to grinding ball (stainless steel) material ratio by mass was 1:10; the diameter of the grinding balls was 4.7 mm, and the filling coefficient was 0.1. Anhydrous ethanol was used as the control agent (50% of the material by mass) in the ball milling process, and the rotation speed of the ball mill was 240 rpm. Overheating was prevented by ball milling for 20 min with a 3 min rest in a single cycle. The samples were taken at a milling time of 5 min, 600 min, and 1800 min and dried at a low temperature of just 10 °C above room temperature (30~35 °C).

3.2.2. Calcination Process

The calcination temperature was set to 300 °C because the precursor Zn5(OH)6(CO3)2 can be decomposed completely only at temperatures higher than 200 °C [53]. To obtain pure ZnO products, the calcination temperature must be higher than 200 °C. On the other hand, the calcination temperature should be as low as possible to maintain the original morphology and particle size of the precursor to the maximum extent. The low temperature prevents the particle size growth, resulting in a small particle size scale and a high specific surface area. In addition, a low temperature can prevent the decrease in the high entropy state caused by high-energy ball milling at high temperatures so that the product can retain the high entropy state of the precursor. Table 8 lists the names and preparation conditions of the ZnO samples.

3.3. Characterizations

The product was characterized by X-ray powder diffraction (XRD, XRD-6000, Shimadzu, Japan) using Cu Kα radiation ( λ = 0.15406 nm) with a voltage and current of 40 kV and 30 mA, respectively. The morphology of the product was characterized by field emission scanning electron microscopy (FESEM, Supra 55, Zeiss, Germany) and an accelerating voltage of 20 kV. The morphology and size of the particles were characterized by field emission transmission electron microscopy (FETEM, Jeol-2010 (JEOL, Japan). The Brunauer–Emmett–Teller (BET) surface area was tested using a V-sorb 2008p specific surface and pore size analyzer (Beijing Jinaipu Science and Technology, China). The BET surface area was measured from the adsorption of N2 gas at −196 °C after a drying temperature of 60 °C and a drying time of two hours. The assay amount was 20–60 mg per sample and the ambient temperature for the test was 20 °C. The UV–Vis absorption spectrum of the product was measured using a Duv-3700 UV–Vis spectrophotometer (Shimadzu, Japan). The wavelength range was 240–1200 nm.

3.4. Photocatalysis Measurements

The photocatalytic activity of the product was evaluated by the degradation of an RhB aqueous solution under simulated sunlight. The simulation light source was a 300W Xe lamp (PLS-SXE 300, Beijing Perfectlight Technology, Beijing, China), and the light source current was 15A. The height between the lamp mouth and the solution was 10 cm. A magnetic stirrer was placed underneath the solution for each test, and the volume of the solution and the height of the solution level from the lamp opening were strictly controlled. A stirring magnet was added to the solution and the stirring magnet was used to stir the RhB solution at a constant speed throughout the irradiation process. The concentration of RhB was 15 mg/L (15 ppm), the solution volume was 30 mL, and the catalyst dose was 0.5 mg/mL. Before irradiating the light source, the reaction system was dispersed by ultrasound for 15 min and stirred in the dark for 45 min to achieve adsorption–desorption equilibrium. The simulated light duration was 60 min. The absorbance of the RhB solution at 664 nm was measured using a UV–Vis spectrophotometer (UV 5500pc, Shanghai Metash Instruments, Shanghai, China). The degradation rate was determined using the following formula:
Degradation   rate = C 0 C C 0 100 %
where C 0 is the initial absorbance of the RhB solution, and C is the absorbance of the RhB solution after irradiation for 60 min.

4. Conclusions

In summary, pure ZnO nanospheres with a high specific surface area and small size were prepared by ball milling with subsequent calcination was reported. The change in the specific surface area of the ZnO is in line with that of conventional ball-milling experiments with time, and the time of the ball-milling plays an important role in the formation of ZnO with a high specific surface area but had little effect on the bandgap. The photocatalytic performance was positively correlated with the specific surface area. A higher photocatalytic efficiency (96.63%@60min) of ZnO was achieved at both a high RhB concentration (15 ppm) and low catalyst loading (0.5 mg/mL) compared to other reports [44,47,48,49,50,51,52]. This paper reports an improved photocatalytic efficiency of undoped ZnO using only planetary ball milling at 240 rpm, followed by calcination at 300 °C. With the low equipment requirements, low energy consumption, and high efficiency, this work provides a simple and practical approach that can effectively mitigate the agglomeration hazards associated with mechanical force chemistry and release the full potential of the catalytic performance of nanoparticles, resulting in photocatalysts with high size homogeneity, high dispersion and high specific surface area, which provides a new idea for expanding the industrial mass production of small-size, high-specific-surface-area powders and high-performance photocatalysts.

Author Contributions

Conceptualization, Z.Z.; methodology, Z.Z.; software, Z.Z.; validation, Z.Z.; formal analysis, Z.Z.; investigation, Z.Z.; resources, J.W.; data curation, Z.Z.; writing—original draft preparation, Z.Z.; writing—review and editing, Z.Z. and C.G.J.; visualization, Z.Z.; supervision, C.G.J.; project administration, C.G.J.; funding acquisition, C.G.J. All authors have read and agreed to the published version of the manuscript.

Funding

This research was funded by Competency Development Program for Industry Specialists of the Korean Ministry of Trade, Industry and Energy (MOTIE), operated by the Korea Institute for Advancement of Technology (KIAT), grant number P0012453.

Conflicts of Interest

The authors declare no conflict of interest. The funders had role in the decision to publish the results.

References

  1. Nejib, A.; Joelle, D.; Fadhila, A.; Sophie, G.; Malika, T.-A. Adsorption of anionic dye on natural and organophilic clays: Effect of textile dyeing additives. Desalination Water Treat. 2014, 54, 1–16. [Google Scholar] [CrossRef]
  2. He, J.; Wang, J.; Liu, Y.; Mirza, Z.A.; Zhao, C.; Xiao, W. Microwave-assisted synthesis of BiOCl and its adsorption and photocatalytic activity. Ceram. Int. 2015, 41, 8028–8033. [Google Scholar] [CrossRef]
  3. Faisal, M.; Abu Tariq, M.; Muneer, M. Photocatalysed degradation of two selected dyes in UV-irradiated aqueous suspensions of titania. Dye. Pigment. 2007, 72, 233–239. [Google Scholar] [CrossRef]
  4. Rahman, M.M.; Jamal, A.; Khan, S.B.; Faisal, M. Characterization and applications of as-grown β-Fe2O3 nanoparticles prepared by hydrothermal method. J. Nanoparticle Res. 2011, 13, 3789–3799. [Google Scholar] [CrossRef]
  5. Ravelli, D.; Dondi, D.; Fagnoni, M.; Albini, A. Photocatalysis. A multi-faceted concept for green chemistry. Chem. Soc. Rev. 2009, 38, 1999–2011. [Google Scholar] [CrossRef]
  6. Malato, S.; Fernández-Ibáñez, P.; Maldonado, M.; Blanco, J.; Gernjak, W. Decontamination and disinfection of water by solar photocatalysis: Recent overview and trends. Catal. Today 2009, 147, 1–59. [Google Scholar] [CrossRef]
  7. Yang, L.-Y.; Dong, S.-Y.; Sun, J.-H.; Feng, J.-L.; Wu, Q.-H.; Sun, S.-P. Microwave-assisted preparation, characterization and photocatalytic properties of a dumbbell-shaped ZnO photocatalyst. J. Hazard. Mater. 2010, 179, 438–443. [Google Scholar] [CrossRef] [PubMed]
  8. Song, X.C.; Zheng, Y.F.; Yang, E.; Liu, G.; Zhang, Y.; Chen, H.F.; Zhang, Y.Y. Photocatalytic activities of Cd-doped ZnWO4 nanorods prepared by a hydrothermal process. J. Hazard. Mater. 2010, 179, 1122–1127. [Google Scholar] [CrossRef] [PubMed]
  9. Anandan, S.; Vinu, A.; Venkatachalam, N.; Arabindoo, B.; Murugesan, V. Photocatalytic activity of ZnO impregnated Hβ and mechanical mix of ZnO/Hβ in the degradation of monocrotophos in aqueous solution. J. Mol. Catal. A Chem. 2006, 256, 312–320. [Google Scholar] [CrossRef]
  10. Sun, J.-H.; Dong, S.-Y.; Wang, Y.-K.; Sun, S.-P. Preparation and photocatalytic property of a novel dumbbell-shaped ZnO microcrystal photocatalyst. J. Hazard. Mater. 2009, 172, 1520–1526. [Google Scholar] [CrossRef]
  11. Sun, S.; Wang, W. Advanced chemical compositions and nanoarchitectures of bismuth based complex oxides for solar photocatalytic application. RSC Adv. 2014, 4, 47136–47152. [Google Scholar] [CrossRef]
  12. Das, S.; Daud, W.M.A.W. A review on advances in photocatalysts towards CO2 conversion. RSC Adv. 2014, 4, 20856–20893. [Google Scholar] [CrossRef]
  13. Wu, M.-C.; Chih, J.-S.; Huang, W.-K. Bismuth doping effect on TiO2 nanofibres for morphological change and photocatalytic performance. CrystEngComm 2014, 16, 10692–10699. [Google Scholar] [CrossRef]
  14. Dong, F.; Bian, J.; Sun, Y.; Xiong, T.; Zhang, W. The rapid synthesis of photocatalytic (BiO)2CO3 single-crystal nanosheets via an eco-friendly approach. CrystEngComm 2014, 16, 3592–3604. [Google Scholar] [CrossRef]
  15. Lin, C.-C.; Chiang, Y.-J. Feasibility of using a rotating packed bed in preparing coupled ZnO/SnO2 photocatalysts. J. Ind. Eng. Chem. 2012, 18, 1233–1236. [Google Scholar] [CrossRef]
  16. Yu, C.; Yang, K.; Xie, Y.; Fan, Q.; Yu, J.C.; Shu, Q.; Wang, C. Novel hollow Pt-ZnO nanocomposite microspheres with hierarchical structure and enhanced photocatalytic activity and stability. Nanoscale 2013, 5, 2142–2151. [Google Scholar] [CrossRef] [PubMed]
  17. Kong, D.-M.; Wang, J.; Zhu, L.-N.; Jin, Y.-W.; Li, X.-Z.; Shen, H.-X.; Mi, H.-F. Oxidative DNA cleavage by Schiff base tetraazamacrocyclic oxamido nickel(II) complexes. J. Inorg. Biochem. 2008, 102, 824–832. [Google Scholar] [CrossRef]
  18. Mclaren, A.; Valdes-Solis, T.; Li, G.; Tsang, S.C. Shape and Size Effects of ZnO Nanocrystals on Photocatalytic Activity. J. Am. Chem. Soc. 2009, 131, 12540–12541. [Google Scholar] [CrossRef] [PubMed]
  19. Jang, E.S.; Won, J.-H.; Hwang, S.-J.; Choy, J.-H. Fine Tuning of the Face Orientation of ZnO Crystals to Optimize Their Photocatalytic Activity. Adv. Mater. 2006, 18, 3309–3312. [Google Scholar] [CrossRef]
  20. Chen, X.; Mao, S.S. Titanium dioxide nanomaterials: Synthesis, properties, modifications, and applications. Chem. Rev. 2007, 107, 2891–2959. [Google Scholar] [CrossRef] [PubMed]
  21. Flores, N.M.; Pal, U.; Galeazzi, R.; Sandoval, A. Effects of morphology, surface area, and defect content on the photocatalytic dye degradation performance of ZnO nanostructures. RSC Adv. 2014, 4, 41099–41110. [Google Scholar] [CrossRef]
  22. Byrappa, K.; Subramani, A.K.; Ananda, S.; Rai, K.M.L.; Dinesh, R.; Yoshimura, M. Photocatalytic degradation of rhodamine B dye using hydrothermally synthesized ZnO. Bull. Mater. Sci. 2006, 29, 433–438. [Google Scholar] [CrossRef] [Green Version]
  23. Becker, J.; Raghupathi, K.R.; Pierre, J.S.; Zhao, D.; Koodali, R.T. Tuning of the Crystallite and Particle Sizes of ZnO Nanocrystalline Materials in Solvothermal Synthesis and Their Photocatalytic Activity for Dye Degradation. J. Phys. Chem. C 2011, 115, 13844–13850. [Google Scholar] [CrossRef]
  24. Ye, C.; Bando, Y.; Shen, G.; Golberg, D. Thickness-Dependent Photocatalytic Performance of ZnO Nanoplatelets. J. Phys. Chem. B 2006, 110, 15146–15151. [Google Scholar] [CrossRef] [PubMed]
  25. Zhang, L.; Yin, L.; Wang, C.; Lun, N.; Qi, Y. Sol−Gel Growth of Hexagonal Faceted ZnO Prism Quantum Dots with Polar Surfaces for Enhanced Photocatalytic Activity. ACS Appl. Mater. Interfaces 2010, 2, 1769–1773. [Google Scholar] [CrossRef] [PubMed]
  26. Kołodziejczak-Radzimska, A.; Jesionowski, T. Zinc Oxide—From Synthesis to Application: A Review. Materials 2014, 7, 2833–2881. [Google Scholar] [CrossRef] [PubMed] [Green Version]
  27. Atayde, C.D.M.; Doi, I. Highly stable hydrophilic surfaces of PDMS thin layer obtained by UV radiation and oxygen plasma treatments. Phys. Status Solidi (C) 2010, 7, 189–192. [Google Scholar] [CrossRef]
  28. Aghababazadeh, R.; Mazinani, B.; Mirhabibi, A.; Tamizifar, M. ZnO Nanoparticles Synthesised by mechanochemical processing. J. Phys. Conf. Ser. 2006, 26, 312–314. [Google Scholar] [CrossRef] [Green Version]
  29. Lu, F.; Cai, W.; Zhang, Y. ZnO Hierarchical Micro/Nanoarchitectures: Solvothermal Synthesis and Structurally Enhanced Photocatalytic Performance. Adv. Funct. Mater. 2008, 18, 1047–1056. [Google Scholar] [CrossRef]
  30. Peter, I.J.; Praveen, E.; Vignesh, G.; Nithiananthi, P. ZnO nanostructures with different morphology for enhanced photocatalytic activity. Mater. Res. Express. 2017, 4, 124003. [Google Scholar] [CrossRef]
  31. Saravanan, R.; Gupta, V.K.; Narayanan, V.; Stephen, A. Comparative study on photocatalytic activity of ZnO prepared by different methods. J. Mol. Liq. 2013, 181, 133–141. [Google Scholar] [CrossRef]
  32. Stolle, A.; Ranu, B. (Eds.) Ball Milling towards Green Synthesis: Applications, Projects, Challenges; Royal Society of Chemistry (RSC): London, UK, 2014. [Google Scholar]
  33. Xing, T.; Sunarso, J.; Yang, W.; Yin, Y.; Glushenkov, A.M.; Li, L.H.; Howlett, P.C.; Chen, Y. Ball milling: A green mechanochemical approach for synthesis of nitrogen doped carbon nanoparticles. Nanoscale 2013, 5, 7970–7976. [Google Scholar] [CrossRef] [Green Version]
  34. Amirkhanlou, S.; Ketabchi, M.; Parvin, N. Nanocrystalline/nanoparticle ZnO synthesized by high energy ball milling process. Mater. Lett. 2012, 86, 122–124. [Google Scholar] [CrossRef]
  35. Peng, W.X.; Wang, K.J.; Hu, J.; Wang, Y.T. Preparation of Acicular-Like ZnO Nanostructured Powder Using Ball Mill Zinc Powder by Hydrothermal Method. Adv. Mater. Res. 2013, 833, 80–83. [Google Scholar] [CrossRef]
  36. Tsuzuki, T.; McCormick, P.G. ZnO nanoparticles synthesized by mechanochemical processing. Scr. Mater. 2001, 44, 1731–1734. [Google Scholar] [CrossRef]
  37. Ao, W.; Li, J.; Yang, H.; Zeng, X.; Ma, X. Mechanochemical synthesis of zinc oxide nanocrystalline. Powder Technol. 2006, 168, 148–151. [Google Scholar] [CrossRef]
  38. Moballegh, A.; Shahverdi, H.; Aghababazadeh, R.; Mirhabibi, A. ZnO nanoparticles obtained by mechanochemical technique and the optical properties. Surf. Sci. 2007, 601, 2850–2854. [Google Scholar] [CrossRef] [Green Version]
  39. Dodd, A.; McKinley, A.; Saudres, M.; Tsuzuki, T. Effect of particle size on the photocatalytic activity of nanoparticlate zinc oxide. J. Nanopart. Res. 2006, 8, 43–51. [Google Scholar] [CrossRef]
  40. Dodd, A.; McKinley, A.; Tsuzuki, T.; Saunders, M. A comparative evaluation of the photocatalytic and optical properties of nanoparticulate ZnO synthesised by mechanochemical processing. J. Nanoparticle Res. 2008, 10, 243–248. [Google Scholar] [CrossRef]
  41. Gancheva, M.; Uzunov, I.; Iordanova, R.; Papazova, K. Influence of the preparation method on the structure, optical and photocatalytic prop-erties of nanosized ZnO. Mater. Chem. Phys. 2015, 164, 36–45. [Google Scholar] [CrossRef]
  42. Mendoza-Mendoza, E.; Nuñez-Briones, A.; García-Cerda, L.; Peralta-Rodríguez, R.; Montes-Luna, A. One-step synthesis of ZnO and Ag/ZnO heterostructures and their photocatalytic activity. Ceram. Int. 2018, 44, 6176–6180. [Google Scholar] [CrossRef]
  43. Kostova, N.G.; Fabian, M.; Dutkova, E. Mechanochemically synthesized N-doped ZnO for photodegradation of ciprofloxacin. Bulg. Chem. Commun. 2019, 51, 433–438. [Google Scholar]
  44. Ahmed, A.Z.; Islam, M.M.; Islam, M.M.U.; Masum, S.M.; Islam, R.; Molla, M.A.I. Fabrication and characterization of B/Sn-doped ZnO nanoparticles via mechanochemical method for photocatalytic degra-dation of rhodamine B. Inorg. Nano-Met. Chem. 2020, 1–10. [Google Scholar] [CrossRef]
  45. Gancheva, M.N.; Iordanova, R.S.; Dimitriev, Y.B.; Avdeev, G.V.; Iliev, T.C. Effects of mechanical activation on structure and photocatalytic properties of ZnO powders. Open Chem. 2013, 11, 1780–1785. [Google Scholar] [CrossRef]
  46. Nguyen, T.A.; Mai, T.Y.; Nguyen, T.X.M.; Huynh, K.P.H.; Le, M.V. Mechanochemical Synthesis of Zinc Oxide Nanoparticles and their Antibacterial Activity against Escherichia Coli. Mater. Sci. Forum 2020, 1007, 59–64. [Google Scholar] [CrossRef]
  47. Nguyen, T.D.; La, P.P.H.; Cao, M.T. A comparison study of the photocatalytic activity of ZnO nanoparticles for organic contaminants degrada-tion under low-power UV-A lamp. Adv. Nat. Sci. Nanosci. Nanotechnol. 2020, 11, 015005. [Google Scholar] [CrossRef]
  48. Phongarthit, K.; Amornpitoksuk, P.; Suwanboon, S. Synthesis, characterization, and photocatalytic properties of ZnO nanoparticles prepared by a precipitation-calcination method using a natural alkaline solution. Mater. Res. Express 2018, 6, 045501. [Google Scholar] [CrossRef]
  49. Bhunia, A.K.; Saha, S. Characterization of zinc oxide nanocrystals with different morphology for application in ultraviolet-light photocatalytic performances on rhodamine B. Luminescence 2021, 36, 149–162. [Google Scholar] [CrossRef]
  50. Zhou, Y.; Xu, L.; Wu, Z.; Li, P.; He, J. Optical and photocatalytic properties of nanocrystalline ZnO powders synthesized by a low-temperature hydrothermal method. Optik 2017, 130, 673–680. [Google Scholar] [CrossRef]
  51. Dodoo-Arhin, D.; Asiedu, T.; Agyei-Tuffour, B.; Nyankson, E.; Obada, D.; Mwabora, J. Photocatalytic degradation of Rhodamine dyes using zinc oxide nanoparticles. Mater. Today Proc. 2021, 38, 809–815. [Google Scholar] [CrossRef]
  52. Jayaprakash, N.; Suresh, R.; Rajalakshmi, S.; Raja, S.; Sundaravadivel, E.; Gayathri, M.; Sridharan, M. One-step synthesis, characterisation, photocatalytic and bio-medical applications of ZnO nanoplates. Mater. Technol. 2020, 35, 112–124. [Google Scholar] [CrossRef]
  53. Zhou, Z.; Sheng, S.D.; Pan, C.L. Effect of high energy ball milling on thermal decomposition activated energy of basic zinc carbonate. China Powder Sci. Technol. 2019, 25, 71–75. [Google Scholar] [CrossRef]
Figure 1. (a) XRD patterns of the precursors after different ball milling times; and (b) XRD of the products calcined at 300 °C.
Catalysts 11 00572 g001
Figure 2. (a) Untreated basic zinc carbonate (precursor); (b) after ball milling the precursor for 600 min; (c) after calcination of the precursor at 300 °C; and (d) after ball milling the precursor for 600 min, followed by 300 °C calcination.
Catalysts 11 00572 g002aCatalysts 11 00572 g002b
Figure 3. FETEM of ZnO after ball milling the precursor for 600 min followed by calcination at 300 °C.
Catalysts 11 00572 g003
Figure 4. BET analysis of each product.
Catalysts 11 00572 g004
Figure 5. (a) Ultraviolet–visible absorption spectra of each sample; (b) forbidden bandgap of each sample.
Catalysts 11 00572 g005
Figure 6. Photocatalytic activity of ZnO samples with different milling time.
Catalysts 11 00572 g006
Figure 7. (a) RhB concentration with each ZnO photocatalyst as a function of the irradiation time; (b) first-order test of the photocatalytic reaction using the different photocatalyst; (c) photodegradation reaction rate constant histogram; and (d) UV-Vis spectrum of the RhB solution containing the A3 photocatalyst at different times.
Catalysts 11 00572 g007aCatalysts 11 00572 g007b
Table 1. Some reports on the relationship between the specific surface area and photocatalytic efficiency.
MethodBET (m2/g)Organic Dye Types and Concentrations (ppm and M)ZnO Load (mg/mL)PhotodegradationK (10−2/min)Ref.
Sonochemical technique6.43
3.83
18.88
MB (10 ppm)191.6% @ 300 min
73.4% @ 300 min
100% @ 300 min
0.83
0.44
1.59
[21]
Solvothermal185
50
30.6
MeOr (5.0 × 10⁻⁵ M)0.5100% @ 80 min
86% @ 80 min
39% @ 80 min
-[29]
Hydrothermal and wet Chemical46.50
27.42
24.30
Floral dye
(Clitoria ternatea)
(-)
130% @ 40 min
14% @ 40 min
10% @ 40 min
-[30]
Sol–gel
Precipitation
Thermal decomposition
10.5
9.4
8.2
MB (3 × 10⁻⁵ M)199% @ 120 min
98% @ 120 min
85% @ 120 min
-[31]
10.5
9.4
8.2
MO (3 × 10⁻⁵ M)163% @ 120 min
61% @ 120 min
58% @ 120 min
-
Table 2. Some published literature on the mechanochemical synthesis efforts in terms of the control agent used, average particle sizes, and specific surface areas.
Preparation ProcessControl Agent (Molar Ratio to Zn Ions)Rotational Speed (rpm)Average Particle Size (nm)Specific Surface Area (m2/g)Ref.
ZnCl2 + Na2CO3 + 8NaCl m i l l i n g ZnCO3 + 10NaCl
ZnCO3 400   ° C ZnO + CO2
NaCl (8)25028.523.28[28]
ZnCl2 + Na2CO3 + 8.6NaCl m i l l i n g ZnCO3 + 10.6NaCl
ZnCO3 400   ° C ZnO + CO2
NaCl (8.6)-2747.3[36]
ZnCl2 + Na2CO3 + 8NaCl m i l l i n g ZnCO3 + 10NaCl
ZnCO3 400   ° C ZnO + CO2
NaCl (8)60021-[37]
ZnCl2 + Na2CO3 + 8.6NaCl m i l l i n g ZnCO3 + 10.6NaCl
ZnCO3 300   ° C ZnO + CO2
NaCl (8.6)25027.7-[38]
ZnCl2 + Na2CO3 + 4NaCl m i l l i n g ZnCO3 + 6NaCl
ZnCO3 400   ° C ZnO + CO2
NaCl (4)-17.244.6[40]
ZnO m i l l i n g ZnO-10001036[45]
Zn(CH3COO)2 + NaOH m i l l i n g 2CH3COONa + Zn(OH)2
Zn(OH)2  400   ° C ZnO + H2O
Cetyl trimethylammonium bromide (CTAB) (4)-32.7-[46]
Zn5(OH)6(CO3)2   m i l l i n g Zn5(OH)6(CO3)2
Zn5(OH)6(CO3)2 300   ° C 5ZnO + 3H2O + 2CO2
Anhydrous ethanol (1.2)2401086.5This work
Table 3. Previous work on the degradation of RhB solutions by ZnO in simulated sources light.
MethodMorphologySpecific Surface Area (m2/g)Concentration of RhB (ppm and M)ZnO Load (mg/mL)PhotodegradationK (10−2/min)Ref.
Simple mechano-chemicalRods, 5 μ m 8.4510 ppm0.66751.8% @ 60 min-[44]
Sol–gelSpheres, 21 nm-10 ppm0.333-0.05[47]
Precipitation-calcinationQuasi-spheres, 30–70 nm11.351 × 10−5 M
(4.8 ppm)
0.667-1.00[48]
Chemical precipitationSheets, 200 nm
tubes, 150 nm
rods, 150 nm
-0.02 ppm0.73379.05% @ 120 min;
74.41% @ 120 min;
69.80% @ 120 min
-
-
[49]
Low-temperature hydrothermalQuasi-Spheres, 28 nm-6 ppm0.884% @ 100 min-[50]
Sol–gelRods, 16 nm-10 ppm195.41% @ 160 min-[51]
Precursor calcinationRods, hexagonal plates, 100 nm-5 ppm0.575.2% @ 60 min-[52]
Mechanochemical-calcined precursorQuasi-spheres, 10 nm86.515 ppm0.596.63% @ 60 min5.78This work
Table 4. Relationship between the crystallite size and milling time of the Zn5(OH)6(CO3)2 and ZnO samples.
Name of SamplesBall Milling Time
(min)
XRD Peak Intensity ValuesAngle Values (°)Half-Peak ValuesHalf-Peak Width (°)Crystallite Size by Scherrer
(nm)
Zn5(OH)6(CO3)206813.3340.6412.61
Zn5(OH)6(CO3)255813.18290.7210.87
Zn5(OH)6(CO3)26003413.2171.087.47
Zn5(OH)6(CO3)218003813.44191.067.62
ZnO015436.7770.616.33
ZnO518836.14940.6415.20
ZnO60015236.14760.7812.47
ZnO180015636.24780.7612.82
Table 5. Specific surface area, bandgap width, and photocatalytic degradation efficiency, and the reaction-level kinetic constants for each sample.
SamplesBall Milling Time (min)BET (m2/g)Eg (eV)Photodegradationk(10−2/min)
A1069.83.11578.70% @ 60min2.583
A2582.53.10892.00% @ 60min4.257
A360086.53.12396.63% @ 60min5.781
A4180080.53.11981.90% @ 60min2.840
Table 6. Materials used in the experiment.
ReagentChemical FormulaPurityManufacturer
Basic zinc carbonateZn5(OH)6(CO3)2ARShanghai Aladdin Biochemical Technology Co., Ltd., Shanghai, China
Rhodamine B (RhB)C28H31N2O3ClARShanghai Aladdin Biochemical Technology Co., Ltd., Shanghai, China
Anhydrous ethanolC2H5OHARYangzhou Hubao Chemical Reagent Co., Ltd., Yangzhou, China
Table 7. Experimental instruments.
InstrumentsModelManufacturer
Planetary ball millXM-2Xiangtan Sanxing Instrument Co., Ltd., Xiangtan, China
Xenon lampPLS-SXE300Beijing Perfectlight Technology Co., Ltd., Beijing, China
Box muffle furnaceKSL-1200X (UL)Hefei Kejing Material Technology Co., Ltd., Hefei, China
Ultraviolet–visible spectrophotometerUV 5500PCShanghai Metash Instruments Co., Ltd., Shanghai, China
Table 8. Names and preparation conditions of the ZnO samples.
Name of ZnO SamplesBall Milling Time
(min)
Calcination Temperature (°C)Calcination Time
(min)
A10300120
A25300120
A3600300120
A41800300120
Publisher’s Note: MDPI stays neutral with regard to jurisdictional claims in published maps and institutional affiliations.

