Article

Oxidation of Aqueous Toluene by Gas-Phase Pulsed Corona Discharge in Air-Water Mixtures Followed by Photocatalytic Exhaust Air Cleaning

Department of Materials and Environmental Technology, Tallinn University of Technology, Ehitajate Tee 5, 19086 Tallinn, Estonia
*
Authors to whom correspondence should be addressed.
Catalysts 2021, 11(5), 549; https://doi.org/10.3390/catal11050549
Submission received: 30 March 2021 / Revised: 15 April 2021 / Accepted: 21 April 2021 / Published: 27 April 2021

Abstract

:
The treatment of wastewaters containing hazardous volatile organic compounds (VOCs) requires the simultaneous treatment of both water and air. Refractory toluene, extensively studied for its removal, provides a basis for the comparison of its abatement methods. The oxidation of aqueous toluene by gas-phase pulsed corona discharge (PCD) in combination with the subsequent photocatalytic treatment of exhaust air was studied. The PCD treatment showed unequalled energy efficiencies in aqueous and gaseous toluene oxidation, reaching, respectively, up to 10.5 and 29.6 g·kW−1·h−1. The PCD exhaust air contained toluene residues and ozone in concentrations not exceeding 0.1 and 0.6 mg·L−1, respectively. As a result of the subsequent photocatalytic treatment, both airborne residues were eliminated within a contact time with TiO2 as short as 12 s. The results contribute to the possible application of the studied approach in closed-loop energy-saving ventilation systems.

Graphical Abstract

1. Introduction

Volatile organic compounds (VOCs) in industrial wastewaters present a challenge in their removal if stripping to the atmosphere is avoided. Toluene is a hydrophobic aromatic hydrocarbon of moderate toxicity occurring in wastewaters with concentrations recorded within the interval of 0.2–12,900 μg·L−1 in several industries, such as paint and coating production, oil refinery, and gas processing [1,2,3]. Wastewaters subjected to the appropriate treatment may still contain residual toluene [3] that can be released to the ambient air, thereby having a detrimental impact on ecosystems. In urban air, toluene concentrations range from 5 to 150 μg·m−3, and in places with high traffic density they can reach 1310 μg·m−3 [4,5]. Human exposure to toluene has been reported to affect the central nervous and respiratory systems, also causing eye irritation [6,7,8]. Toluene is a refractory compound that is known due to extensive studies of its oxidation in air [7], thus providing a reasonable basis for the comparison of its abatement with various methods.
Advanced oxidation processes (AOPs) have proven their ability to degrade organic pollutants in various matrices [9,10,11]. The present research explores an alternative to conventional AOPs in the form of low-temperature plasma of pulsed corona discharge (PCD) as a source of active short-living oxidants. The abatement of aqueous and gaseous toluene using non-thermal plasma of electric discharges has been studied previously [12,13,14,15]. These studies only report the results obtained in either the aqueous or the gaseous phase, without considering the necessity to control pollutant removal in both phases. The pulsed corona discharge used in the study has shown an energy-efficient degradation of various aqueous pollutants [16,17,18], although the volatile acetone demonstrated its refractory character [19]. Therefore, the PCD not only faces the problem of ozone (O3) present in the discharge, but also of residual VOCs in the air exhaust, requiring their elimination. Ozone is formed in plasma reactions together with HO-radicals (HO), hydrogen peroxide (H2O2), and atomic oxygen [17,20,21,22]. Photocatalytic oxidation successfully degrades low concentrations of airborne VOCs, converting them into harmless products, often H2O and CO2 [7]. The successful photocatalytic abatement of O3 and VOCs, including toluene, was reported earlier [11]: toluene at a concentration of 60 ppm (0.23 mg·L−1), in the presence of ozone, was degraded at the energy efficiency of 12.1 g·kW−1·h−1. The efficiency was calculated for 40% toluene removal at a photocatalyst irradiance of 3.5 mW·cm−2 (365 nm).
A composite approach simultaneously removing toluene from polluted aqueous media and air is applied in the present study, combining gas-phase electric discharge with the subsequent photocatalytic oxidation of exhaust air.

2. Results and Discussion

2.1. PCD Oxidation of Aqueous and Gaseous Toluene

A second-order kinetic law (Equation (1)) was used for the characterization of PCD oxidation [20]:
d C d t = k 2 · C · P V ,
where k2 is the second-order reaction rate constant for PCD, m3·J−1; C is the concentration of toluene, mol·m−3; P is the power of pulsed corona discharge, W; and V is the volume of plasma zone, m3.
Aqueous toluene oxidation at its initial equilibrium concentration (C0) of 6.3 mg·L−1 at pulse repetition frequencies of 50, 200, and 800 pulses per second (pps) is depicted in Figure 1. It can be observed that the oxidation rates grow with the pulse repetition frequency (Figure 1a, Table 1a–c), whereas only modest variations were observed in energy efficiencies (Figure 1b) comprising 10.5, 8.6, and 7.5 g·kW−1·h−1 at 50, 200, and 880 pps, respectively. At lower frequencies, the long-living ozone promotes, although quite moderately, toluene oxidation due to the longer periods of time between pulses and, thus, a longer overall treatment time. This indicates that ozone plays a minor role in toluene oxidation.
Further studies were carried out at a pulse repetition frequency of 200 pps, thus providing a treatment time long enough for accurate sampling at lower initial concentrations of toluene. The degradation of toluene in time of treatment in both the aqueous and air phases is shown in Figure 2, also illustrating the difference in oxidation rates depending on the initial aqueous toluene concentration. Gas-phase toluene degradation follows the pattern of the one in the aqueous phase, since the sampling method applied in the study (see Experimental Section) provided an equilibrium between phases that was achieved before sampling.
The dependence of toluene oxidation energy efficiency on its initial concentration is seen in Table 1b,d,e: the values of 6.4, 7.5, and 8.6 g·kW−1·h−1 correspond to the initial equilibrium aqueous toluene contents of 1.0, 3.7, and 6.3 mg·L−1, respectively. These values exceed the ones reported by Jose et al. by an order of magnitude [23], comprising 0.543 g·kW−1·h−1 in the needle-plate corona above water reactor at toluene concentrations as high as 200 mg·L−1.
Most of the earlier studies on airborne toluene oxidation reviewed by Preis et al. [24] were conducted using higher initial toluene concentrations, providing higher oxidation efficiency numbers as opposed to those presented here. Dou et al. [25] studied toluene oxidized in a 50-Hz AC dielectric barrier discharge (DBD) reactor with a starting concentration of 1200 ppm (4.6 mg·L−1), showing that the energy yield averaged around 5 g·kW−1·h−1, which is in accordance with the span given in the review by van Durme et al. [26], of 1 to 11 g·kW−1·h−1 for DBD combined with in situ or post-discharge catalysis. Schiorlin et al. [27] observed toluene degradation in pulsed DBD at a removal efficiency of about 7.2 g·kW−1·h−1 at a starting concentration in dry air as high as 500 ppm (1.9 mg·L−1). The air humidity rose to 40% at 20 °C, which resulted in the toluene oxidation efficiency increasing to about 8.4 g·kW−1·h−1. The energy efficiency of such treatment is inferior to the ones observed in this study for the air phase, taking into account that starting toluene concentrations are higher for an order of magnitude. Such an observation is expected for DBD, showing lower efficiencies [24]. The application of PCD, however, showed a dramatic growth in the oxidation energy yield: Malik et al. [28] reported a toluene oxidation efficiency as high as 30.1 g·kW−1·h−1 at the starting concentration of 300 ppm (1.1 mg·L−1) in dry air at a pulse repetition frequency of 2 pps, which is close to the numbers observed in the present study. We failed to find publications concerning the electric discharge application towards combined treatment of water and air polluted with VOCs.
The efficiency of airborne toluene oxidation also shown in Table 1 logically exceeds the ones of aqueous toluene by about three times in most of the cases, which is explained by the interface-borne HO-radicals at the gas-phase side shown earlier [19]. At higher temperatures, the difference increased by about five times, which is also consistent with, on the one hand, the higher gas-phase equilibrium concentration and, on the other hand, lower oxidation rate of aqueous admixtures at elevated temperatures [29].
The measurement of gaseous ozone concentration showed its definitive involvement in the oxidation of toluene: the higher the toluene concentration, the slower the ozone concentration growth (Figure 3). The values of concentrations also indicate the ozone consumption by oxidation reactions being an order of magnitude lower than the ones observed in the reactor working with distilled water [20].
The impacts of the pH and of the temperature were studied at a toluene initial equilibrium concentration of 3.7 mg·L−1. The pH of acidic and alkaline solutions remained unchanged throughout the treatment, while in neutral solutions the pH decreased from 7.0 ± 0.1 to 4.5 ± 0.2 within 12.5 min due to the formation of carboxylic acids [30] and nitrate [31]. Variations in pH had no effect on the aqueous toluene degradation Table 1d,f,g, regardless of the fact that basic pH conditions promote aqueous ozone decomposition, producing additional HO radicals [32]. The minor role of this reaction is explained by the low concentration of gaseous ozone. For example, within the first 5 min of treatment 0.22 mg·L−1 of gaseous ozone in the reactor (Figure 3) may provide 0.07 mg·L−1 of equilibrium aqueous ozone according to Henry’s law [33]. This circumstance confirms the smaller role of ozone in toluene oxidation observed in experiments with various pulse repetition rates. Clearly, variations in pH from 3.0 to 12.0 did not alter the non-dissociating toluene molecule reactivity with discharge-generated HO-radicals in the PCD reactor.
The treated solution containing 3.7 mg·L−1 of aqueous toluene in equilibrium with air in the reactor was adiabatically heated from 20 ± 2 °C to 30 ± 2 °C, providing a toluene aqueous concentration of 2.5 mg·L−1. The increased temperature resulted in a noticeably lower energy efficiency of 5.9 g·kW−1·h−1 in toluene oxidation at a slightly lower reaction rate constant, as shown in Table 1d,h. This observation indirectly points to toluene oxidation at the gas–liquid interface [19], since the increased airborne toluene concentration resulted in a higher rate of oxidation at the gas-phase side.
The FTIR analysis of air outlet from the PCD reactor showed, in addition to toluene and ozone, the minor presence of the product of incomplete oxidation, carbon monoxide (CO). Compositions of gaseous exhaust originating from PCD at the end of the treatment are shown in Table 2.
Earlier, the authors noticed ozone increasing the yield of carbon monoxide in the photocatalytic oxidation of toluene [11]. In PCD experiments, both ozone and CO concentrations were found to be descending, with declining pulse repetition frequencies at low residual aqueous toluene concentrations being close to each other at the end of treatment, as shown in Table 2a–c. This observation might point to the potential similarity in the roles of ozone in both photocatalytic and PCD oxidation: less ozone in the gas phase results in a lower yield of carbon monoxide. In addition, a smaller initial content of toluene also results in a smaller CO yield at approximately equal ozone concentrations, as shown in Table 2b,d,e. The reduced CO yield at lower ozone concentrations observed at elevated temperatures also fits into the association between CO production and gaseous ozone concentration, as shown in Table 2b,h. However, the PCD oxidation experiments at various pHs, as shown in Table 2d,f,g, show practically identical CO yields at ozone concentrations expectedly being an order of magnitude lower in alkaline medium as a result of fast decomposition and, thus, the chemisorption of ozone. From this, one can unequivocally conclude that CO is a product of toluene oxidation without a particular role of ozone, i.e., along the predominant mechanism with discharge-generated HO-radicals.
As shown in Table 2b,d,e, the trace concentrations of toluene remain at about 0.06–0.10 mg·L−1 after PCD treatment, regardless of its initial concentration. The complete PCD oxidation of toluene may prove to be a time-and energy-consuming task. Besides this, residual ozone is also considered an air pollutant. Under these circumstances, gaseous exhausts containing trace amounts of toluene and residual ozone treated photocatalytically present a reasonable approach.

2.2. Photocatalytic Treatment of Toluene and Ozone Residues in the PCD Exhaust

Residual toluene, O3, and CO exiting the PCD reactor enter the photocatalytic reactor at the concentrations shown in Table 3.
Rather low inlet concentrations of toluene (Table 3) became undetectable over a TiO2-coated area of 120 cm2 within all tested residence times of 4, 8, and 16 s—i.e., at SRTs of 0.033, 0.065, and 0.13 s·cm−2, respectively (Figure 4).
The fast degradation of residual toluene is explained by the role of residual plentiful ozone: Pichat et al. [34] reported easier capture of electrons photolytically promoted to the TiO2 conduction band by ozone, either directly (Equation (2)) or indirectly (Equation (3)). The radical-anion O3•− may react with water adsorbed on a TiO2 surface, promoting the generation of HO (Equation (4)). Additionally, the scavenging of photoproduced electrons with ozone obstructs the hole-electron recombination magnifying HO formation from hydroxyl-anions at the photocatalyst surface (Equation (5)).
e + O3 → O•− + O2 (k = 1.8 × 10⁹ L mol−1·s−1),
e + O2 → O2•− and O2•− + O3 → O3•− + O2 (k = 2.1 × 10¹¹ L mol−1·s−1),
O3•− + H2O → HO + HO + O3,
HOs + h⁺ → HO.
Since no significant difference in O3 conversion was observed at variable residual toluene concentrations, Figure 4 only depicts the results obtained at an aqueous toluene starting equilibrium concentration of 3.7 mg·L−1. At the longest SRT of 0.13 s·cm−2 provided by a residence time of 16 s over a TiO2-covered photocatalytic surface of 120 cm2, O3 was fully degraded, although, at a SRT of 0.065 and 0.033 s·cm−2, the O3 depletion accordingly required 240 and 360 cm2 with residence times of 16 and 12 s, respectively. At lower SRTs of 0.033 and 0.065 s·cm−2 provided by the respective residence times of 4 and 8 s over 120 cm2 of TiO2 coating, ozone did not decompose entirely, thus indicating the need for a greater area of the photocatalyst to ensure the time limit for O3 degradation. The gradual depletion of O3, within a time span longer than the one necessary for the complete oxidation of toluene residues confirms a deep oxidation of toluene degradation by-products under the experimental conditions; the accelerated depletion of O3 in the presence of toluene degradation by-products adsorbed on TiO2-coatings was reported earlier [11].
The photocatalytic treatment of the PCD exhaust air resulted in CO remaining intact, to which photocatalytic oxidation added slightly more of the CO produced from residual toluene in amounts of 0.002–0.007 mg·L−1. Variations in the CO outlet concentrations are determined by differences in the residual toluene concentrations in the air entering the photocatalytic reactor. The probable reason for the CO residues is the effect of water vapor hindering the oxidation of poorly adsorbed CO to CO2, by blocking the active sites on the photocatalyst surface [35]. The resultant CO concentration, however, is lower than the maximum permissible concentration for an eight-hour exposure in a working zone comprising 0.058 mg·L−1 [36].

3. Materials and Methods

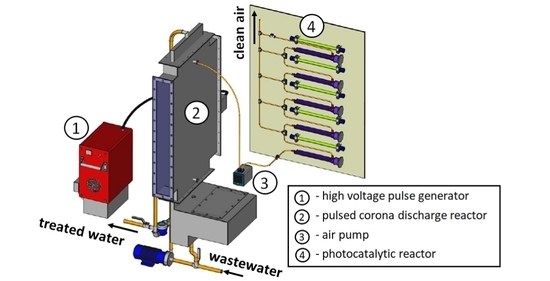
3.1. Experimental Equipment and Procedure

The PCD reactor was combined with the photocatalytic one to treat the air exhaust containing residual toluene and ozone. A 3D illustration of the combination is shown in Supplementary Figure S1.

3.1.1. Pulsed Corona Discharge

Experiments with toluene aqueous solutions using 10 L samples were conducted using the PCD device described earlier [16], and shown in Figure 5 (Flowrox Oy, Lappeenranta, Finland). Toluene, as an easily fugitive compound, is rather difficult to use in precise dosing in a 154 L reactor. To avoid massive toluene evaporation in ambient air, toluene solutions were stored in hermetically closed vessels and transferred into the PCD reactor using a peristaltic pump (Masterflex, Vernon Hills, IL, USA). Solutions initially containing approximately 10 ± 0.5, 30 ± 1.5, and 50 ± 2.3 mg·L−1 of toluene provided equilibrium to aqueous concentrations of 1.0 ± 0.05, 3.7 ± 0.15, and 6.3 ± 0.30 mg·L−1 at 20 °C. These concentrations consistently provided equilibrium to airborne toluene concentrations in the air phase, 0.4 ± 0.02, 1.0 ± 0.04, and 1.6 ± 0.07 mg·L−1, respectively, and in the overall free gaseous volume of the PCD reactor. In experiments at temperatures elevated to 30 °C, the equilibrium in solutions containing 30 mg·L−1 was established at an aqueous concentration of 2.5 ± 0.10 mg·L−1 and an airborne toluene content of 1.2 ± 0.05 mg·L−1. An inbuilt spiral coil heater was used to obtain a higher temperature of the solution. The equilibrium state of toluene in a gas–liquid system verified implementing Henry’s law (Equation (6)) [37] showed the measured concentrations being close to the theoretically calculated ones:
H = H 0 × e x p d [ l n H ( 1 T ) ] ( 1 T 1 T 0 ) ,
where H is Henry’s law solubility constant; H0 is Henry’s law solubility constant at the reference temperature, mol·kg−1·bar−1 [38]; T is the treated solution temperature, K; T0 is a reference temperature of 298.15 K.
The aqueous samples were treated in a recirculation regime and continuously sprayed into the electric discharge zone. High-voltage pulses were applied between horizontal high-voltage electrodes made of stainless steel wire 0.55 mm in diameter and a total length of 20 m, and two vertical grounded stainless steel plates with repetition frequencies of 50, 200, and 880 pps, corresponding to output powers of 9, 32, and 123 W, respectively. Water containing toluene was dispersed through a perforated plate with 51 perforations 1 mm in diameter with a flow rate of 1.0 m3·h−1 using a circulation pump (Iwaki Co. Ltd., Tokyo, Japan). The PCD reactor was hermetically closed to prevent toluene vapor leaks to ambient air.
The delivered pulsed energy was calculated using the integrated waveforms of voltage and current, as described earlier [39]. Energy efficiency E, g·kW−1·h−1, was calculated at 40% of toluene oxidation using Equation (7):
E = Δ C · V W ,
where ΔC is the decrease in toluene concentration, g·m−3; V is the volume of treated sample, m3; and W is the consumption of energy, kWh.
Solution samples were recirculated for 10 min prior to the start of the experiment and for 5 min prior to the sampling after treatment in order to reach equilibrium concentrations of toluene in liquid and gas phases (Supplementary Figure S2). The gas samples from the PCD reactor were transferred to the FTIR gas cell by means of an air pump (KNF Neuberger S.A.S, France), and analyzed for the presence of VOCs and ozone (see below). After the PCD treatment, the gaseous exhaust was transferred to the photocatalytic reactor for post-treatment.

3.1.2. Photocatalytic Oxidation

Air exhaust from the PCD reactor was treated photocatalytically using TiO2-coated (P25, Evonik Industries, Essen, Germany) glass plates under UVA-emitting fluorescent lamps, Actinic T8, 15 W (Philips, Amsterdam, Netherlands) in a multi-section continuous reactor described earlier [11], consisting of five sequential sections with a volume of 130 mL each (0.9 × 4.9 × 29.5 cm) and a wall thickness of 0.2 cm (Figure 6). The catalyst-coated surface thus comprised 120 cm2 per section, with a TiO2 surface density of 1.4 ± 0.2 mg·cm−2 and a coating thickness in the range of 1 μm.
Temperature in the reactor was measured with a temperature controller supplied with K-type thermocouple, CN9000A (Omega, Norwalk, CT, USA), comprising 38 ± 1 °C, maintained by the heat of the lamp. The gas flow rate was controlled using a flow metering valve SS-6MG-MM (Swagelok, Solon, OH, USA). The flow rates of 0.5, 1.0, and 2.0 L·min−1 were applied, providing residence times of 16, 8, and 4 s per section and specific residence times (SRT) of 0.13, 0.065, and 0.033 s·cm−2, respectively.

3.2. Chemicals and Analyses

The concentration of aqueous toluene (≥99%, Sigma-Aldrich, St. Luis, MO, USA) was measured using a 9300 HPLC System high-performance liquid chromatography (YL Instrument Co., Anyang, Korea) equipped with a UV/Vis detector and XBridge C18 column (130 Å pore size, 3.5 μm particle size, 150 mm in length, and 3.0 mm inner diameter) (Waters, Milford, MA, USA). The flow rate was 0.2 mL·min−1 at the sample run time of 13 min. The isocratic elution was applied using 70% of 0.1% CH3COOH in ultrapure water and 30% of acetonitrile.
The pH was measured with a S220 digital pH-meter (Mettler Toledo, Greifensee, Switzerland) and adjusted with either 5 M H2SO4 (96%, LACH-NER, Neratovice, Czech Republic) or 5 M NaOH (≥ 98%, Sigma-Aldrich, St. Luis, MO, USA). The concentrations of residual toluene and O3 in the air were determined using Fourier transform infrared spectroscopy (FTIR, Interspec 200-X, Tõravere, Estonia). Gaseous samples were collected into the 8 m 1.33 L gas cell (Specac Tornado, Orpington, UK) and analyzed in the wavelength range of 500–4000 cm−1. The spectrum was collected every 5 min for each reactor’s section. Toluene peaks were integrated using the Essential FTIR software (Operant LLC, Houston, TX, USA) and a quantitative database (FDM, HiRes VPFTIR for Quant). The content of O3 in the air was determined by FTIR spectroscopy, with calibration acquired using a MP-6060 ozone analyzer (Anseros Klaus Nonnenmacher GmbH, Tübingen, Germany). All the measurements were duplicated, indicating that the standard deviation was not higher than 5%.

4. Conclusions

The treatment of aqueous toluene in gas-phase pulsed corona discharge combined with the photocatalytic treatment of exhaust air eliminates residual toluene and ozone, thus producing carbon monoxide in minor amounts. The energy efficiency of both aqueous and airborne toluene PCD oxidation demonstrated unequalled levels of 6.4 to 10.5 and up to 29.6 g·kW−1·h−1, respectively, depending on the pulse repetition frequency and toluene concentration. A temperate difference in energy efficiencies at variable frequencies points to the moderate role of O3-induced oxidation of toluene. The increase of temperature in the treated toluene solution from 20 to 30 °C resulted in the decreased oxidation efficiency of the aqueous toluene of about 20%, showing higher oxidation rates in the gas phase. Indifference of toluene oxidation efficiency towards pH of treated solution indicates the predominant role of discharge-generated HO-radicals in oxidation: at pH 12.0, an order of magnitude lower gaseous ozone concentrations resulted in toluene oxidation efficiency attributable to other pH media with high ozone concentrations. Residual toluene, ozone, and CO2 and minor amounts of CO were observed as the humid air PCD exhaust constituents. Properly selected conditions of photocatalytic oxidation over TiO2 allow the complete elimination of toluene and ozone from the exhaust air, contributing, however, to a minor extent to CO formation from residual toluene.

Supplementary Materials

The following are available online at https://www.mdpi.com/article/10.3390/catal11050549/s1: Supplementary Figure S1: 3D illustration of combined PCD and photocatalytic reactor; Supplementary Figure S2: Equilibrium between liquid and gaseous phase of toluene in time: C0 = 50 mg·L−1, pH 7.0.

Author Contributions

Conceptualization, M.K. (Maarja Kask), M.K. (Marina Krichevskaya), S.P., and J.B.; data curation, M.K. (Maarja Kask); formal analysis, M.K. (Maarja Kask); funding acquisition, S.P.; investigation, M.K. (Maarja Kask); methodology, M.K. (Maarja Kask), M.K. (Marina Krichevskaya), and J.B.; project administration, S.P.; resources, S.P.; supervision, M.K. (Marina Krichevskaya) and J.B.; validation, M.K. (Maarja Kask); visualization, M.K. (Maarja Kask) and J.B.; writing—original draft, M.K. (Maarja Kask); Writing—review and editing, M.K. (Marina Krichevskaya), S.P., and J.B. All authors have read and agreed to the published version of the manuscript.

Funding

This research was funded by the Institutional Development Program of Tallinn University of Technology for 2016–2022, project 2014–2020.4.01.16-0032 from the EU Regional Development Fund, and the Research Group Support project PRG776 of Estonian Research Council.

Acknowledgments

The authors would like to acknowledge Arina Borissenko for her assistance with the experiments.

Conflicts of Interest

The authors declare no conflict of interest.

References

  1. Anjum, H.; Johari, K.; Gnanasundaram, N.; Appusamy, A.; Thanabalana, M. Investigation of green functionalization of multiwall carbon nanotubes and its application in adsorption of benzene, toluene & p-xylene from aqueous solution. J. Clean. Prod. 2019, 221, 323–338. [Google Scholar] [CrossRef]
  2. Cseri, L.; Razali, M.; Pogany, P.; Szekely, G. Chapter 3.15—Organic Solvents in Sustainable Synthesis and Engineering. In Green Chemistry: An Inclusive Approach, 1st ed.; Elsevier Inc.: Amsterdam, The Netherlands, 2018; pp. 513–553. [Google Scholar] [CrossRef]
  3. Mrowiec, B. Toluene in sewage and sludge in wastewater treatment plants. Water Sci. Technol. 2014, 69, 128–134. [Google Scholar] [CrossRef] [PubMed]
  4. World Health Organization (WHO). Air Quality Guidelines for Europe, 2nd ed.; Chapter 5.14—Toluene; WHO Regional Publications: Copenhagen, Denmark, 2000; p. 112. [Google Scholar]
  5. Leusch, F.; Bartkow, M. A Short Primer on Benzene, Toluene, Ethylbenzene and Xylenes (BTEX) in the Environment and in Hydraulic Fracturing Fluids; Smart Water Research Centre, Griffith University: Queensland, Australia, 2010. [Google Scholar]
  6. Toluene. Available online: https://www.epa.gov/sites/production/files/2016-09/documents/toluene.pdf (accessed on 30 March 2021).
  7. Mo, J.; Zhang, Y.; Xu, Q.; Joaquin, J.; Zhao, R. Photocatalytic purification of volatile organic compounds in indoor air: A literature review. Atmos. Environ. 2009, 43, 2229–2246. [Google Scholar] [CrossRef]
  8. Debono, O.; Thevenet, F.; Gravejat, P.; Hequet, V.; Raillard, C.; Lecoq, L.; Locoge, N. Toluene photocatalytic oxidation at ppbv levels: Kinetic investigation and carbon balance determination. Appl. Catal. B Environ. 2011, 106, 600–608. [Google Scholar] [CrossRef]
  9. Bolobajev, J.; Bilgin Öncü, N.; Viisimaa, M.; Trapido, M.; Balcioğlu, I.; Goi, A. Column experiment on activation aids and biosurfactant application to the persulphate treatment of chlorophene-contaminated soil. Environ. Technol. 2015, 36, 348–357. [Google Scholar] [CrossRef] [PubMed]
  10. Kask, M.; Krichevskaya, M.; Bolobajev, J. Sonolytic degradation of pesticide metazachlor in water: The role of dissolved oxygen and ferric sludge in the process intensification. J. Environ. Chem. Eng. 2019, 7, 103095. [Google Scholar] [CrossRef]
  11. Kask, M.; Bolobajev, J.; Krichevskaya, M. Gas-phase photocatalytic degradation of acetone and toluene, and their mixture in the presence of ozone in a continuous multi-section reactor as possible air post-treatment for exhaust from pulsed corona discharge. Chem. Eng. J. 2020, 399, 125815. [Google Scholar] [CrossRef]
  12. Jose, J.; Philip, L. Continuous flow pulsed power plasma reactor for the treatment of aqueous solution containing volatile organic compounds and real pharmaceutical wastewater. J. Environ. Manag. 2021, 286, 112202. [Google Scholar] [CrossRef] [PubMed]
  13. Zhu, F.; Li, X.; Zhang, H.; Wu, A.; Yan, J.; Ni, M.; Zhang, H.; Buekens, A. Destruction of toluene by rotating gliding arc discharge. Fuel 2016, 176, 78–85. [Google Scholar] [CrossRef]
  14. Huang, H.; Ye, D.; Leung, Y.C.; Feng, F.; Guan, X. Byproducts and pathways of toluene destruction via plasma-catalysis. J. Mol. Catal. A Chem. 2011, 336, 87–93. [Google Scholar] [CrossRef]
  15. Yao, X.; Jiang, N.; Li, J.; Lu, N.; Shang, K.; Wu, Y. An improved corona discharge ignited by oxide cathodes with high secondary electron emission for toluene degradation. Chem. Eng. J. 2019, 362, 339–348. [Google Scholar] [CrossRef]
  16. Bolobajev, J.; Gornov, D.; Kornev, I.; Preis, S. Degradation of aqueous alachlor in pulsed corona discharge. J. Electrostat. 2021, 109, 103543. [Google Scholar] [CrossRef]
  17. Kask, M.; Krichevskaya, M.; Preis, S.; Bolobajev, J. Oxidation of aqueous N-nitrosodiethylamine: Experimental comparison of pulsed corona discharge with H2O2-assisted ozonation. J. Environ. Chem. Eng. 2021, 9, 105102. [Google Scholar] [CrossRef]
  18. Tikker, P.; Dulova, N.; Kornev, I.; Preis, S. Effects of persulfate and hydrogen peroxide on oxidation of oxalate by pulsed corona discharge. Chem. Eng. J. 2021, 411, 128586. [Google Scholar] [CrossRef]
  19. Ajo, P.; Kornev, I.; Preis, S. Pulsed corona discharge induced hydroxyl radical transfer through the gas-liquid interface. Sci. Rep. 2017, 7, 16152. [Google Scholar] [CrossRef] [PubMed]
  20. Preis, S.; Panorel, I.C.; Kornev, I.; Hatakka, H.; Kallas, J. Pulsed corona discharge: The role of ozone and hydroxyl radical in aqueous pollutants oxidation. Water Sci. Technol. 2013, 68, 1536–1542. [Google Scholar] [CrossRef] [PubMed]
  21. Schneider, M.; Rataj, R.; Kolb, J.F.; Bláha, L. Cylindrospermopsin is effectively degraded in water by pulsed corona-like and dielectric barrier discharges. Environ. Pollut. 2020, 266, 115423. [Google Scholar] [CrossRef]
  22. Scholtz, V.; Pazlarova, J.; Souskova, H.; Khun, J.; Julak, J. Nonthermal plasma—A tool for decontamination and disinfection. Biotechnol. Adv. 2015, 33, 1108–1119. [Google Scholar] [CrossRef] [PubMed]
  23. Jose, J.; Philip, L. Comparative study of degradation of toluene and methyl isobutyl ketone (MIBK) in aqueous solution by pulsed corona discharge plasma. J. Environ. Sci. 2021, 101, 382–396. [Google Scholar] [CrossRef] [PubMed]
  24. Preis, S.; Klauson, D.; Gregor, A. Potential of electric discharge plasma methods in abatement of volatile organic compounds originating from the food industry. J. Environ. Manag. 2013, 114, 125–138. [Google Scholar] [CrossRef] [PubMed]
  25. Dou, B.; Li, J.; Liang, W.; Zhu, T.; Li, Y.; Jin, Y.; He, L. Volatile organic compounds (VOCs) removal by using dielectric barrier discharge. In Proceedings of the 2nd International Conference on Bioinformatics and Biomedical Engineering, Shanghai, China, 16–18 May 2008; IEEE: New York, NY, USA. [Google Scholar] [CrossRef]
  26. van Durme, J.; Dewulf, J.; Leys, C.; van Langenhove, H. Combining non-thermal plasma with heterogeneous catalysis in waste gas treatment: A review. Appl. Catal. B 2008, 78, 324–333. [Google Scholar] [CrossRef] [Green Version]
  27. Schiorlin, M.; Marotta, E.; Rea, M.; Paradisi, C. Comparison of toluene removal in air at atmospheric conditions by different corona discharges. Environ. Sci. Technol. 2009, 43, 9386–9392. [Google Scholar] [CrossRef] [PubMed]
  28. Malik, M.A.; Minamitani, Y.; Schoenbach, K.H. Comparison of catalytic activity of aluminum oxide and silica gel for decomposition of volatile organic compounds (VOCs) in a plasmacatalytic reactor. IEEE Trans. Plasma Sci. 2005, 33, 50–56. [Google Scholar] [CrossRef]
  29. Onga, L.; Kornev, I.; Preis, S. Oxidation of reactive azo-dyes with pulsed corona discharge: Surface reaction enhancement. J. Electrostat. 2020, 103, 103420. [Google Scholar] [CrossRef]
  30. Panorel, I.C.; Preis, S.; Kornev, I.; Hatakka, H.; Louhi-Kultanen, M. Oxidation of aqueous paracetamol by pulsed corona discharge. Ozone Sci. Eng. 2013, 35, 116–124. [Google Scholar] [CrossRef]
  31. Kornev, I.; Osokin, G.; Galanov, A.; Yavorovskiy, N.; Preis, S. Formation of nitrite- and nitrate-ions in aqueous solutions treated with pulsed electric discharges. Ozone Sci. Eng. 2013, 35, 22–30. [Google Scholar] [CrossRef]
  32. Kasprzyk-Hordern, B.; Ziółek, M.; Nawrocki, J. Catalytic ozonation and methods of enhancing molecular ozone reactions in water treatment. Appl. Catal. B Environ. 2003, 46, 639–669. [Google Scholar] [CrossRef]
  33. Gottschalk, C.; Libra, J.A.; Saupe, A. Ozonation of Water and Waste Water: A Practical Guide to Understanding Ozone and Its Applications, 2nd ed.; Wiley-VCH Verlag GmbH & Co. KGaA: Hoboken, NJ, USA, 2009; p. 109. [Google Scholar] [CrossRef]
  34. Pichat, P.; Disdier, J.; Hoang-Van, C.; Mas, D.; Goutailler, G.; Gaysse, C. Purification/deodorization of indoor air and gaseous effluents by TiO2 photocatalysis. Catal. Today 2000, 63, 363–369. [Google Scholar] [CrossRef]
  35. Soliman, N.K. Factors affecting CO oxidation reaction over nanosized materials: A review. J. Mater. Res. Technol. 2019, 8, 2395–2407. [Google Scholar] [CrossRef]
  36. Carbon Monoxide—Leading Cause of Poisoning Deaths. Available online: https://www.creia.org/carbon-monoxide---leading-cause-of-poisoning-deaths (accessed on 30 March 2021).
  37. Sander, R. Compilation of Henry’s law constants (version 4.0) for water as solvent. Atmos. Chem. Phys. 2015, 15, 4399–4981. [Google Scholar] [CrossRef] [Green Version]
  38. Leighton, D.T.; Calo, J.M. Distribution Coefficients of Chlorinated Hydrocarbons in Dilute Air-Water Systems for Groundwater Contamination Applications. J. Chem. Eng. Data 1981, 26, 382–385. [Google Scholar] [CrossRef]
  39. Kornev, I.; Saprykin, F.; Preis, S. Stability and energy efficiency of pulsed corona discharge in treatment of dispersed high-conductivity aqueous solutions. J. Electrostat. 2017, 89, 42–50. [Google Scholar] [CrossRef]
Figure 1. Degradation of aqueous toluene dependent on treatment time (a) and delivered energy (b) at pulse repetition frequencies of 50, 200, and 880 pps: C0 = 6.3 mg·L−1, initial pH 7.0, 20 °C.
Catalysts 11 00549 g001
Figure 2. Simultaneous toluene PCD oxidation in aqueous and gaseous phases depending on treatment time at various concentrations: pulse repetition frequency of 200 pps, initial pH 7.0, 20 °C.
Catalysts 11 00549 g002
Figure 3. Gaseous ozone in PCD reactor at time of treatment dependent on the initial aqueous toluene concentration: pulse repetition frequency 200 pps, initial pH 7.0, 20 °C.
Catalysts 11 00549 g003
Figure 4. Conversion of airborne toluene and ozone in photocatalytic reactor dependent on residence time at the TiO2-coated surface. PCD treatment conditions: C0 = 3.7 mg·L−1 (aq), C0 = 1.0 mg·L−1 (gas), 200 pps, inital pH 7.0, 20 °C.
Catalysts 11 00549 g004
Figure 5. Schematic illustration of the PCD device.
Catalysts 11 00549 g005
Figure 6. Schematic illustration of photocatalytic reactor: TIC: temperature indicator controller; TE:temperature element.
Catalysts 11 00549 g006
Table 1. The second-order kinetic constants and efficiency values of aqueous toluene PCD oxidation.
PCD Treatment Conditionsk2 × 10−7,
m3·J−1
R2Efficiency of Toluene Oxidation for 40%, g·kW−1·h−1
AqueousAirborne
(a)C0 = 6.3 mg·L−1, 880 pps, initial pH 7.0, 20 °C6.90.99817.522.3
(b)C0 = 6.3 mg·L−1, 200 pps, initial pH 7.0, 20 °C8.30.99648.627.0
(c)C0 = 6.3 mg·L−1, 50 pps, initial pH 7.0, 20 °C10.70.990510.529.3
(d)C0 = 3.7 mg·L−1, 200 pps, initial pH 7.0, 20 °C12.40.99947.523.0
(e)C0 = 1.0 mg·L−1, 200 pps, initial pH 7.0, 20 °C37.00.99386.413.7
(f)C0 = 3.7 mg·L−1, 200 pps, pH 3.0, 20 °C12.50.98877.622.4
(g)C0 = 3.7 mg·L−1, 200 pps, pH 12.0, 20 °C13.00.99437.624.9
(h)C0 = 2.5 mg·L−1, 200 pps, initial pH 7.0, 30 °C12.20.99845.329.5
Table 2. Toluene, O3, and CO concentrations in PCD outlet gas.
PCD Treatment ConditionsSampling Time, minConcentration, mg·L−1
TolueneO3CO
(a)C0 = 6.3 mg·L−1 (aq), C0 = 1.6 mg·L−1 (gas), 880 pps, initial pH 7.0, 20 °C60.0570.610.051
(b)C0 = 6.3 mg·L−1 (aq), C0 = 1.6 mg·L−1 (gas), 200 pps, initial pH 7.0, 20 °C200.0800.400.042
(c)C0 = 6.3 mg·L−1 (aq), C0 = 1.6 mg·L−1 (gas), 50 pps, initial pH 7.0, 20 °C600.100.220.033
(d)C0 = 3.7 mg·L−1 (aq), C0 = 1.0 mg·L−1 (gas), 200 pps, initial pH 7.0, 20 °C12.50.0610.390.028
(e)C0 = 1.0 mg·L−1 (aq), C0 = 0.4 mg·L−1 (gas), 200 pps, initial pH 7.0, 20 °C50.0650.340.016
(f)C0 = 3.7 mg·L−1 (aq), C0 = 1.0 mg·L−1 (gas), 200 pps, pH 3.0, 20 °C12.50.0570.420.030
(g)C0 = 3.7 mg·L−1 (aq), C0 = 1.0 mg·L−1 (gas), 200 pps, pH 12.0, 20 °C12.50.0650.0440.030
(h)C0 = 2.5 mg·L−1 (aq), C0 = 1.2 mg·L−1 (gas), 200 pps, initial pH 7.0, 30 °C12.50.0960.220.029
Table 3. Contents of toluene, ozone, and carbon monoxide in PCD outlet gas entering photocatalytic reactor.
PCD Treatment ConditionsSampling Time, minConcentration, mg·L−1
TolueneO3CO
C0 = 6.3 mg·L−1 (aq), C0 = 1.6 mg·L−1 (gas), 200 pps, initial pH 7.0, 20 °C200.0340.290.038
C0 = 3.7 mg·L−1 (aq), C0 = 1.0 mg·L−1 (gas), 200 pps, initial pH 7.0, 20 °C12.50.0460.290.024
C0 = 1.0 mg·L−1 (aq), C0 = 0.4 mg·L−1 (gas), 200 pps, initial pH 7.0, 20 °C50.0420.240.014
Publisher’s Note: MDPI stays neutral with regard to jurisdictional claims in published maps and institutional affiliations.

