Article

Eco-Friendly and Sustainable Process for Converting Hydrous Bioethanol to Butanol

1
Chemical Engineering Department, Blechner Center for Industrial Catalysis and Process Development, Ben-Gurion University of the Negev, Beer-Sheva 84105, Israel
2
Helbio S.A. Hydrogen & Energy Production Systems. 10 Old National Road Patras-Athens, Rio, 26500 Patras, Greece
*
Author to whom correspondence should be addressed.
Catalysts 2021, 11(4), 498; https://doi.org/10.3390/catal11040498
Submission received: 10 March 2021 / Revised: 4 April 2021 / Accepted: 11 April 2021 / Published: 14 April 2021
(This article belongs to the Section Catalytic Materials)

Abstract

:
The purpose of the study was the development of water-resistant catalyst and catalytic processes for the conversion of hydrous ethanol to 1-butanol. Water, in hydrous ethanol, strongly inhibits conversion to 1-butanol on solid catalysts. In this study, the nonstoichiometric P-deficient hydroxyapatite containing carbonate anions (C-HAP), Ca10−x/2(PO4)6−x(CO3)x(OH)2, displayed good performance in the Guerbet condensation of hydrated ethanol to 1-butanol, after proper stabilization of reaction conditions. Hydrous ethanol (96 wt%) was converted on C-HAP formed as extrudates with silica binder at 400 °C and weight hour space velocity (WHSV) = 0.5–1.0 h−1 to yield 21–23% 1-butanol and 73–74% selectivity. It displayed stable operation for up to 170 h on streams conducted in bench and mini-pilot rigs with catalyst loadings of 2 and 50 cm3, respectively. The process simulation employed the recycling of ethanol without laboratory verification to reach 68% theoretical yield of 1-butanol. The techno-economic analysis demonstrated the feasibility of this process, showing that it may be profitable depending on the prices of hydrated ethanol and 1-butanol.

Graphical Abstract

1. Introduction

Bioethanol continues to attract extensive R&D activities aimed at improving and enhancing its production from biological sources, mainly waste, and its application as blending/additives stock for fuels and the production of a wide variety of chemicals. This is reflected in several very recent reviews of those activities, including commercial applications [1,2,3,4]. Besides biomass of various kinds, syngas (mixture of CO and H2) is also a feedstock for bioethanol production by biological methods [4]. Production of bioethanol in 2019 reached 110 billion liters worldwide [5], mostly [1] in the US and Brazil. Most of the bioethanol is still produced from first generation feedstock [1], although further expansion of bioethanol production would require the implementation of second and even third and fourth generations [1]. Bioethanol is mainly used as blend stock for gasoline [4]. Its addition not only reduces the usage of fossil energy sources but improves the fuel quality by reducing the equivalent fuel consumption and dropping CO2, CO, total hydrocarbon and NOX emissions [6,7]. In addition, the production of chemicals from biobutanol is expected to increase considerably. Green butanol is definitely a very attractive intermediate with wide-range applications [8]. Selected heterogeneous-catalyzed ethanol-to-butanol studies from 2010 to 2017 (a vast number of studies were published over this period and prior to it) were summarized recently [4]. Some were conducted in condensed phase at relatively low temperature (160–250 °C) and high pressure and others in gaseous phase at higher temperature (300–400 °C) and atmospheric pressure. Anhydrous bioethanol was used in most studies since water deactivates the catalysts [9]. The advantages of the application of hydrous ethanol render it important in the development of stable catalysts [4].
Analysis of both homogeneous and heterogeneous catalysts [9] indicated that a simple model consisting of four reactions can be invoked. However, other by-products can be formed, such as ethyl acetate, 1,1-diethoxyethane, diethyl ether, ethylene, acetaldehyde and higher alcohols. Here the acetaldehyde, being an intermediate of the reaction sequence, became a by-product when produced in excess relative to the rate of its further consumption according to Scheme 1.
Since 2017, the bioethanol to butanol process has been studied extensively [10,11,12,13,14,15] on a variety of catalysts. Most of those studies were conducted with anhydrous ethanol. Although a study [11] was carried out with hydrous ethanol (6 wt% water) in the presence of Mg-Al-oxide catalyst, the runs were very short (4 h) so no deactivation measurements were conducted. Therefore, none of those studies have tackled the important issue of water inhibition and deactivation of catalysts. The kinetics of ethanol coupling to higher alcohol [16] was studied on calcium hydroxyapatite. The ethanol coupling rate decreased with increasing water content in the feed. Shifting back to anhydrous ethanol restored the catalytic activity, indicating water-induced inhibition due to site blocking rather than irreversible site reconstruction. A similar effect was reported [17] for Cu-Mg-Al mixed oxide catalysts. Deactivation of Cu on AlMgO and AlCaO mixed oxide was reported [18] in the ethanol coupling process conducted at 325 °C and 32 bar.
The effect of water on the performance of heterogeneous catalysts, in an ethanol-to-butanol reaction conducted at high temperature, in gas phase, in a fixed-bed reactor with MgO and hydroxyapatite (calcium phosphate, HAP), was studied recently [19]. Despite different activity and selectivity patterns of these catalysts with the same surface area, co-feeding of water (2.5 wt% H2O) at 340 °C completely deactivated both of them. It is suggested that the high hydrophilicity of the HAP surface leads to strong and reversible adsorption of water on coordinately unsaturated Ca2+ ions and nearby hydrophilic phosphate anions [19,20,21,22]. MgO displayed lower activity and selectivity. Its irreversible deactivation was a result of the dissociative adsorption of water onto Lewis acid–base pair sites (Mg2+/O2−) inhibiting the formation of C-C bonds [19,23]. Since hydrous bioethanol containing water is the commercial product, high-performance catalysts, in terms of activity, butanol selectivity and stability, are important.
The HAP has both acidic and basic sites, essential for catalysts in the Guerbet reaction [24,25], as shown in Scheme 1. The increased activity and high butanol selectivity due to the significant surface density of acid−base site pairs along with a weak binding energy for ethanol [24] renders this type of catalyst one of the most efficient. Properly modified HAP at the optimal Ca/P ratio, operated with anhydrous ethanol in a fixed bed reactor, yielded 18.2–25.5% butanol per pass at 400 °C and weight hour space velocity (WHSV) = 2 h−1 [26], 1.2 h−1 [27] or 4 h−1 [28], with high stability of over 1500 h on stream [27]. Improving the hydrothermal stability of HAP is a challenge. Since the reason for strong water inhibition is high hydrophilicity (water affinity) of the HAP surface, its hydrophobization could be efficient in dealing with the deactivation of acid–base catalyst in hydrothermal conditions [29].
Stoichiometric HAP Ca10(PO4)6(OH)2 has Ca/P atomic ratio of 1.67. Its high sensitivity to water inhibition is related to strong adsorption of water at reaction temperature [19,20,21,22]. Based on micro-calorimetric and spectroscopic measurements and density functional theory DFT modeling [20,21,22], water is adsorbed molecularly on the surface of stoichiometric HAP interacting with pairs of surface Lewis acid sites (Ca2+ cations) and basic oxygen (O2−) belonging to PO43− ions. It creates strong polarization of the adsorbed water, thus facilitating the formation of hydration multilayer through the hydrogen bonding of water. At reaction temperature, the strongly adsorbed water blocks acid–base pairs at the HAP surface.
Changing of Ca/P ratio in the HAP structure increases the distance between acidic and basic sites, thus decreasing the water adsorption strength and surface hydrophilicity. Non-stoichiometric HAP may be prepared by co-precipitation, varying the Ca/P ratio in parent solution (Ca-deficient HAP) [28] or inserting a source of carbonate ions (P-deficient B-type carbonated HAP) [30,31,32]. The general formula of the former HAP is expressed as Ca10−x(HPO4)x(PO4)6−x(OH)2−x, while the latter is expressed as Ca10−x/2(PO4)6−x(CO3)x(OH)2.
In the Ca-deficient HAP part of phosphate, ions are substituted with hydrophosphate that may strongly adsorb water as H3O+, thus retaining high surface hydrophilicity. Such materials became completely deactivated by hydrous ethanol. Carbonated HAP (C-HAP) operated with anhydrous ethanol was reported to be less active compared with stoichiometric and Ca-deficient HAP [26]. However, its lower hydrophilicity is expected to significantly improve its resistance to water deactivation.
The scope of this study is to develop C-HAP catalysts and investigate their activity in converting hydrous ethanol, selectivity to butanol and stability. Powder and extruded catalysts were characterized and studied in bench and mini-pilot rigs. A detailed techno-economic analysis of the process of converting hydrous bioethanol to butanol at high conversion and selectivity is presented.

2. Results and Discussion

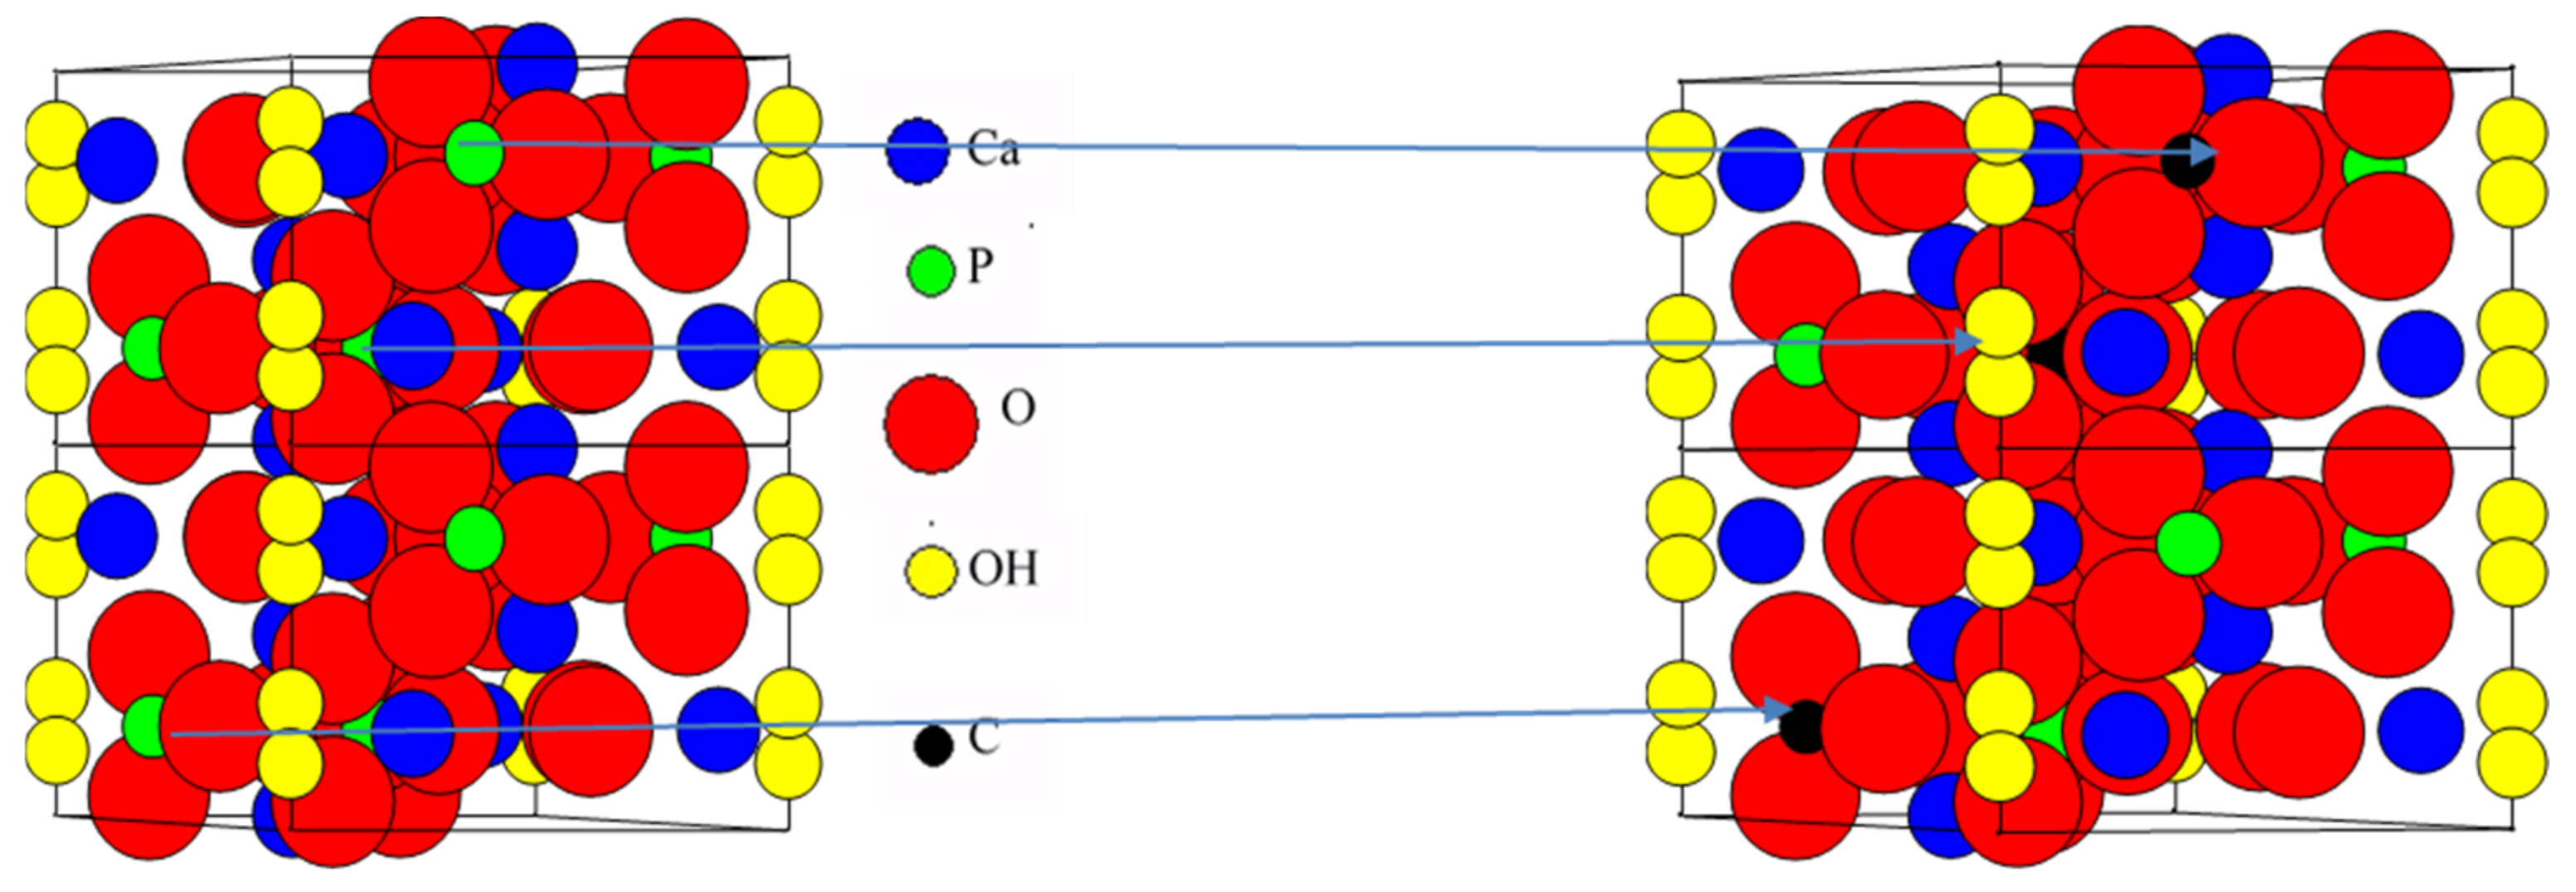
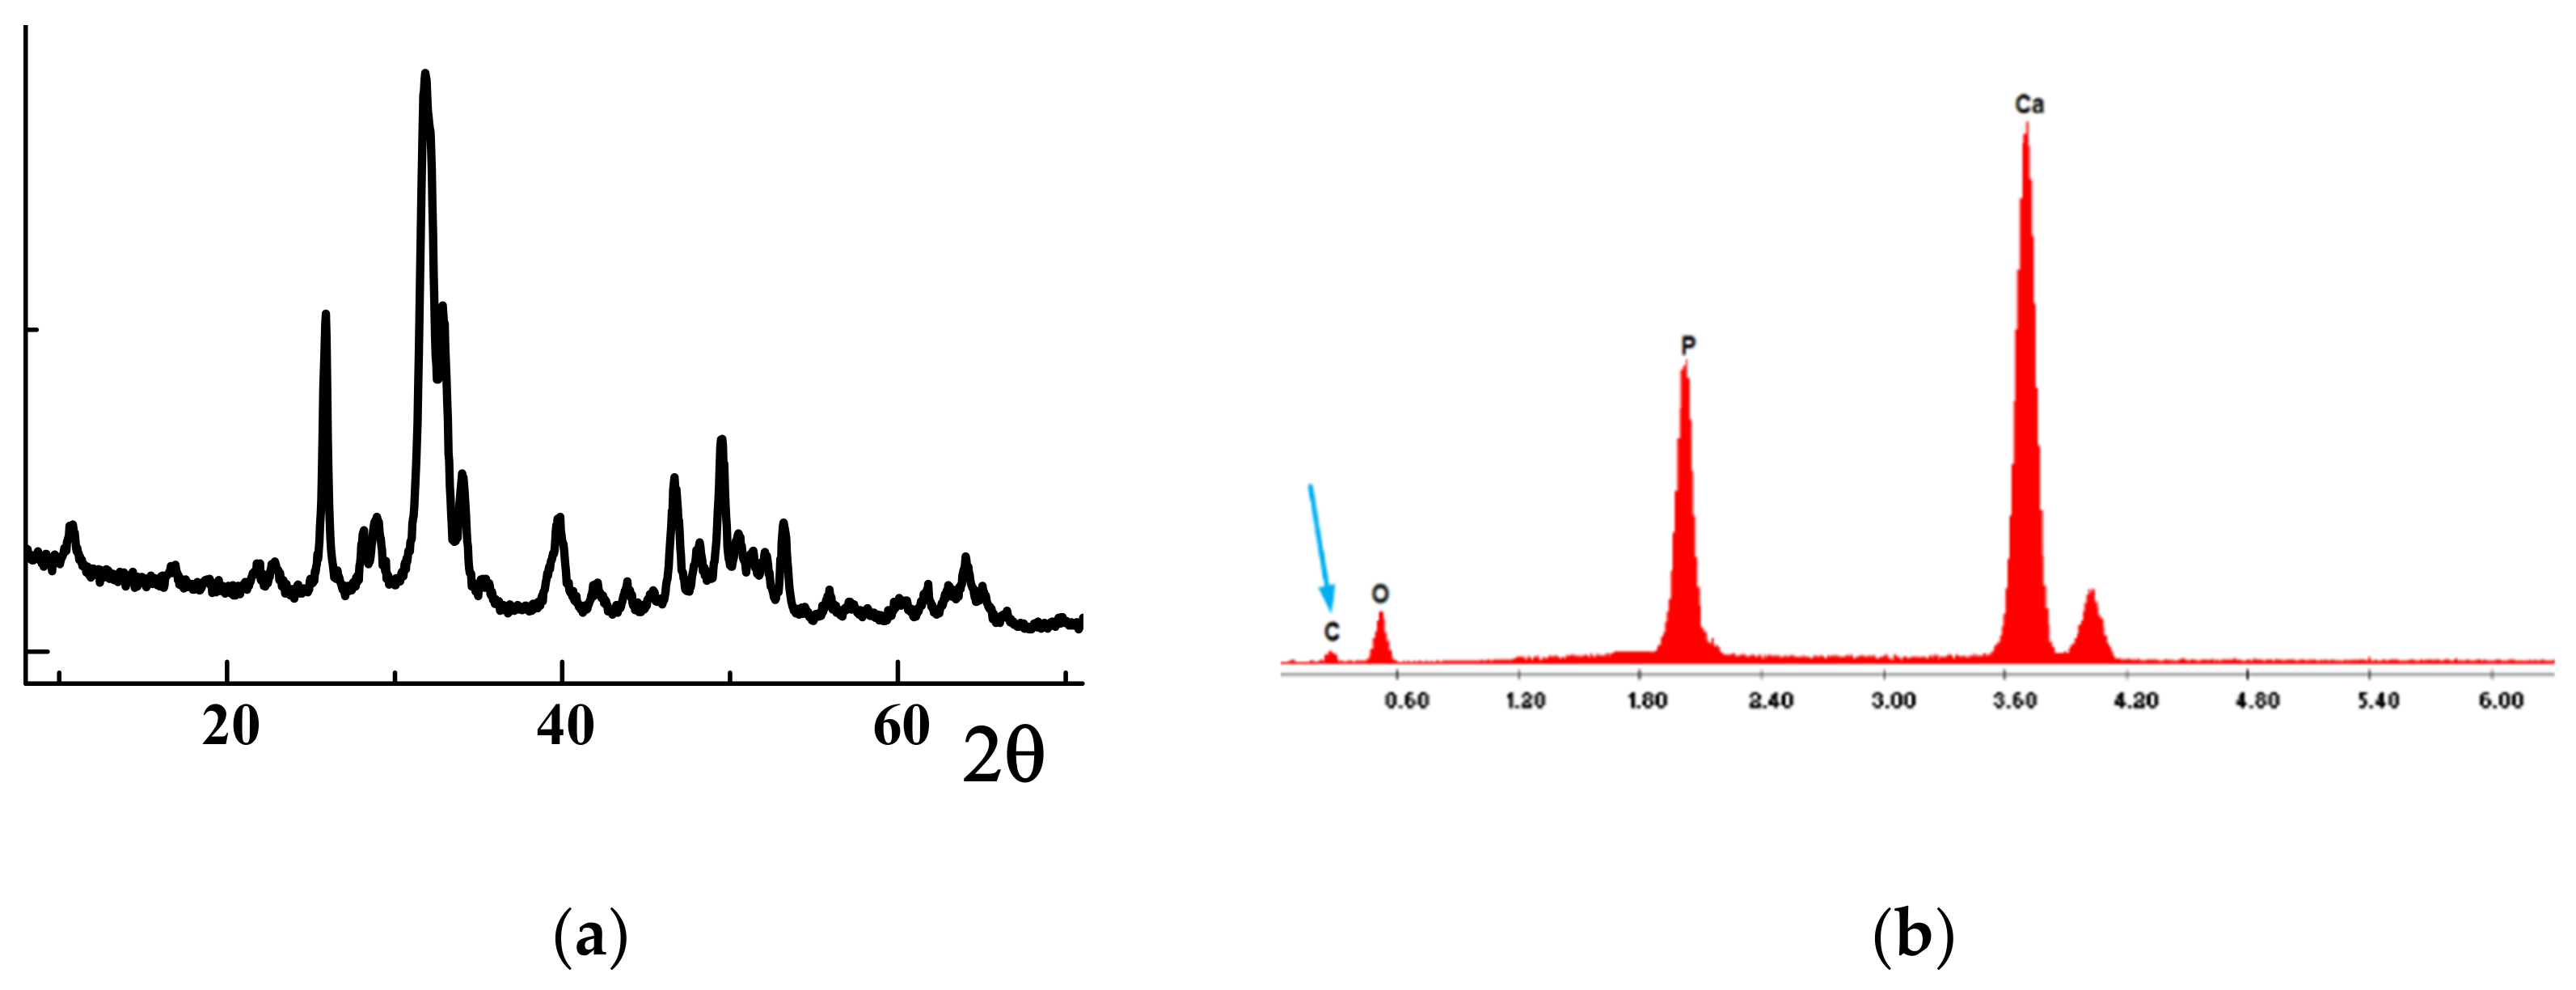
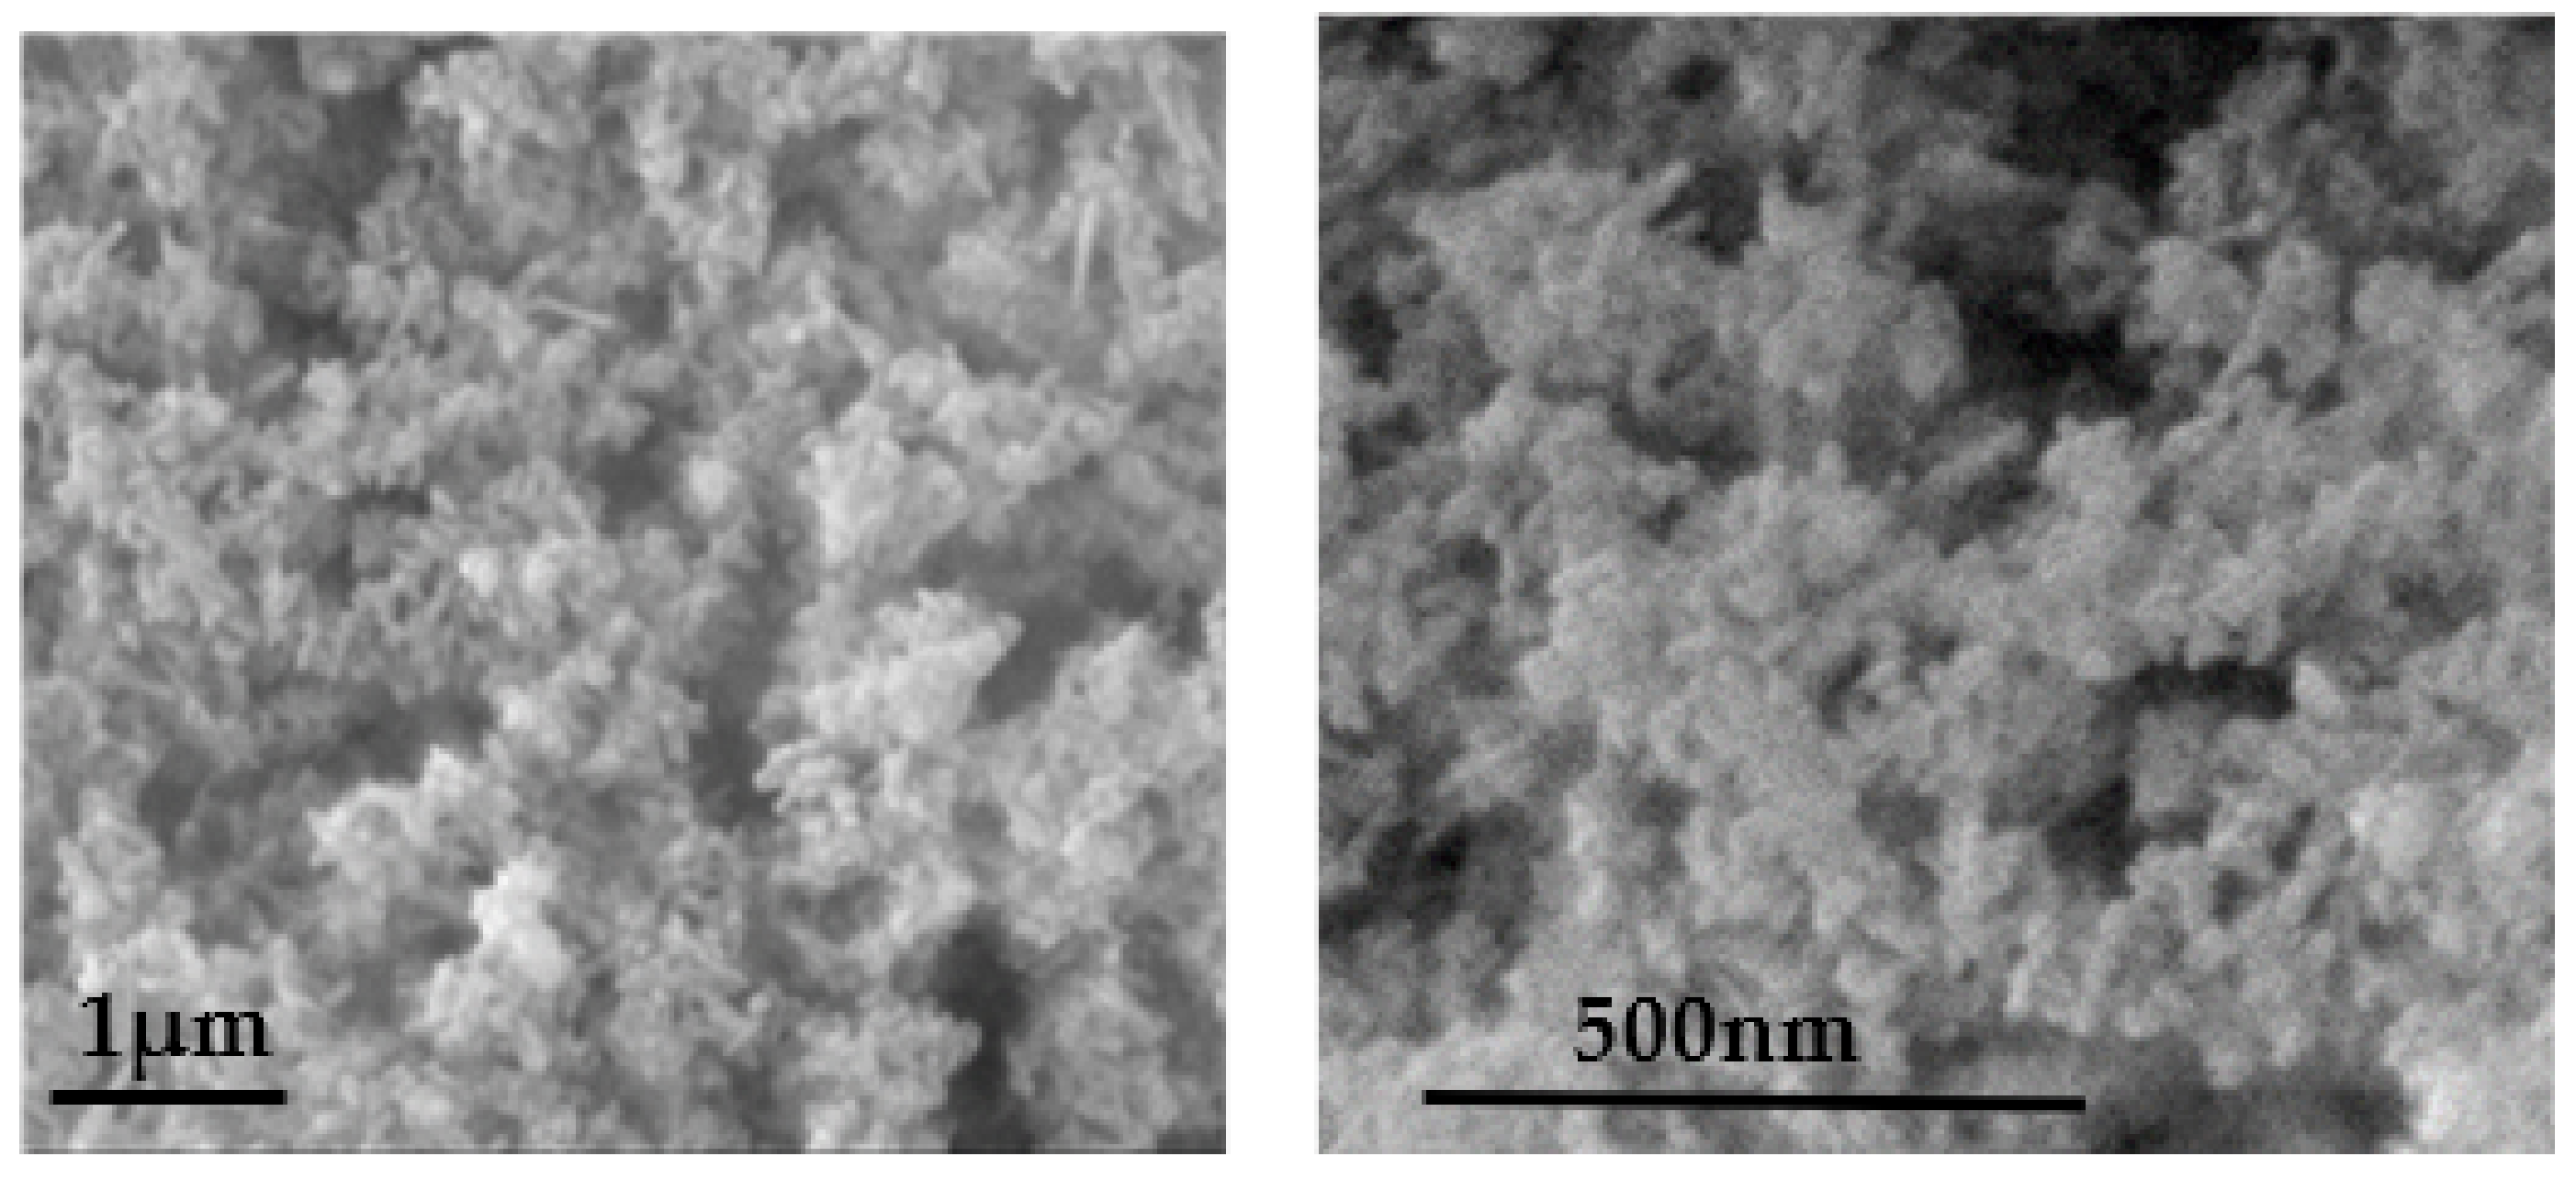
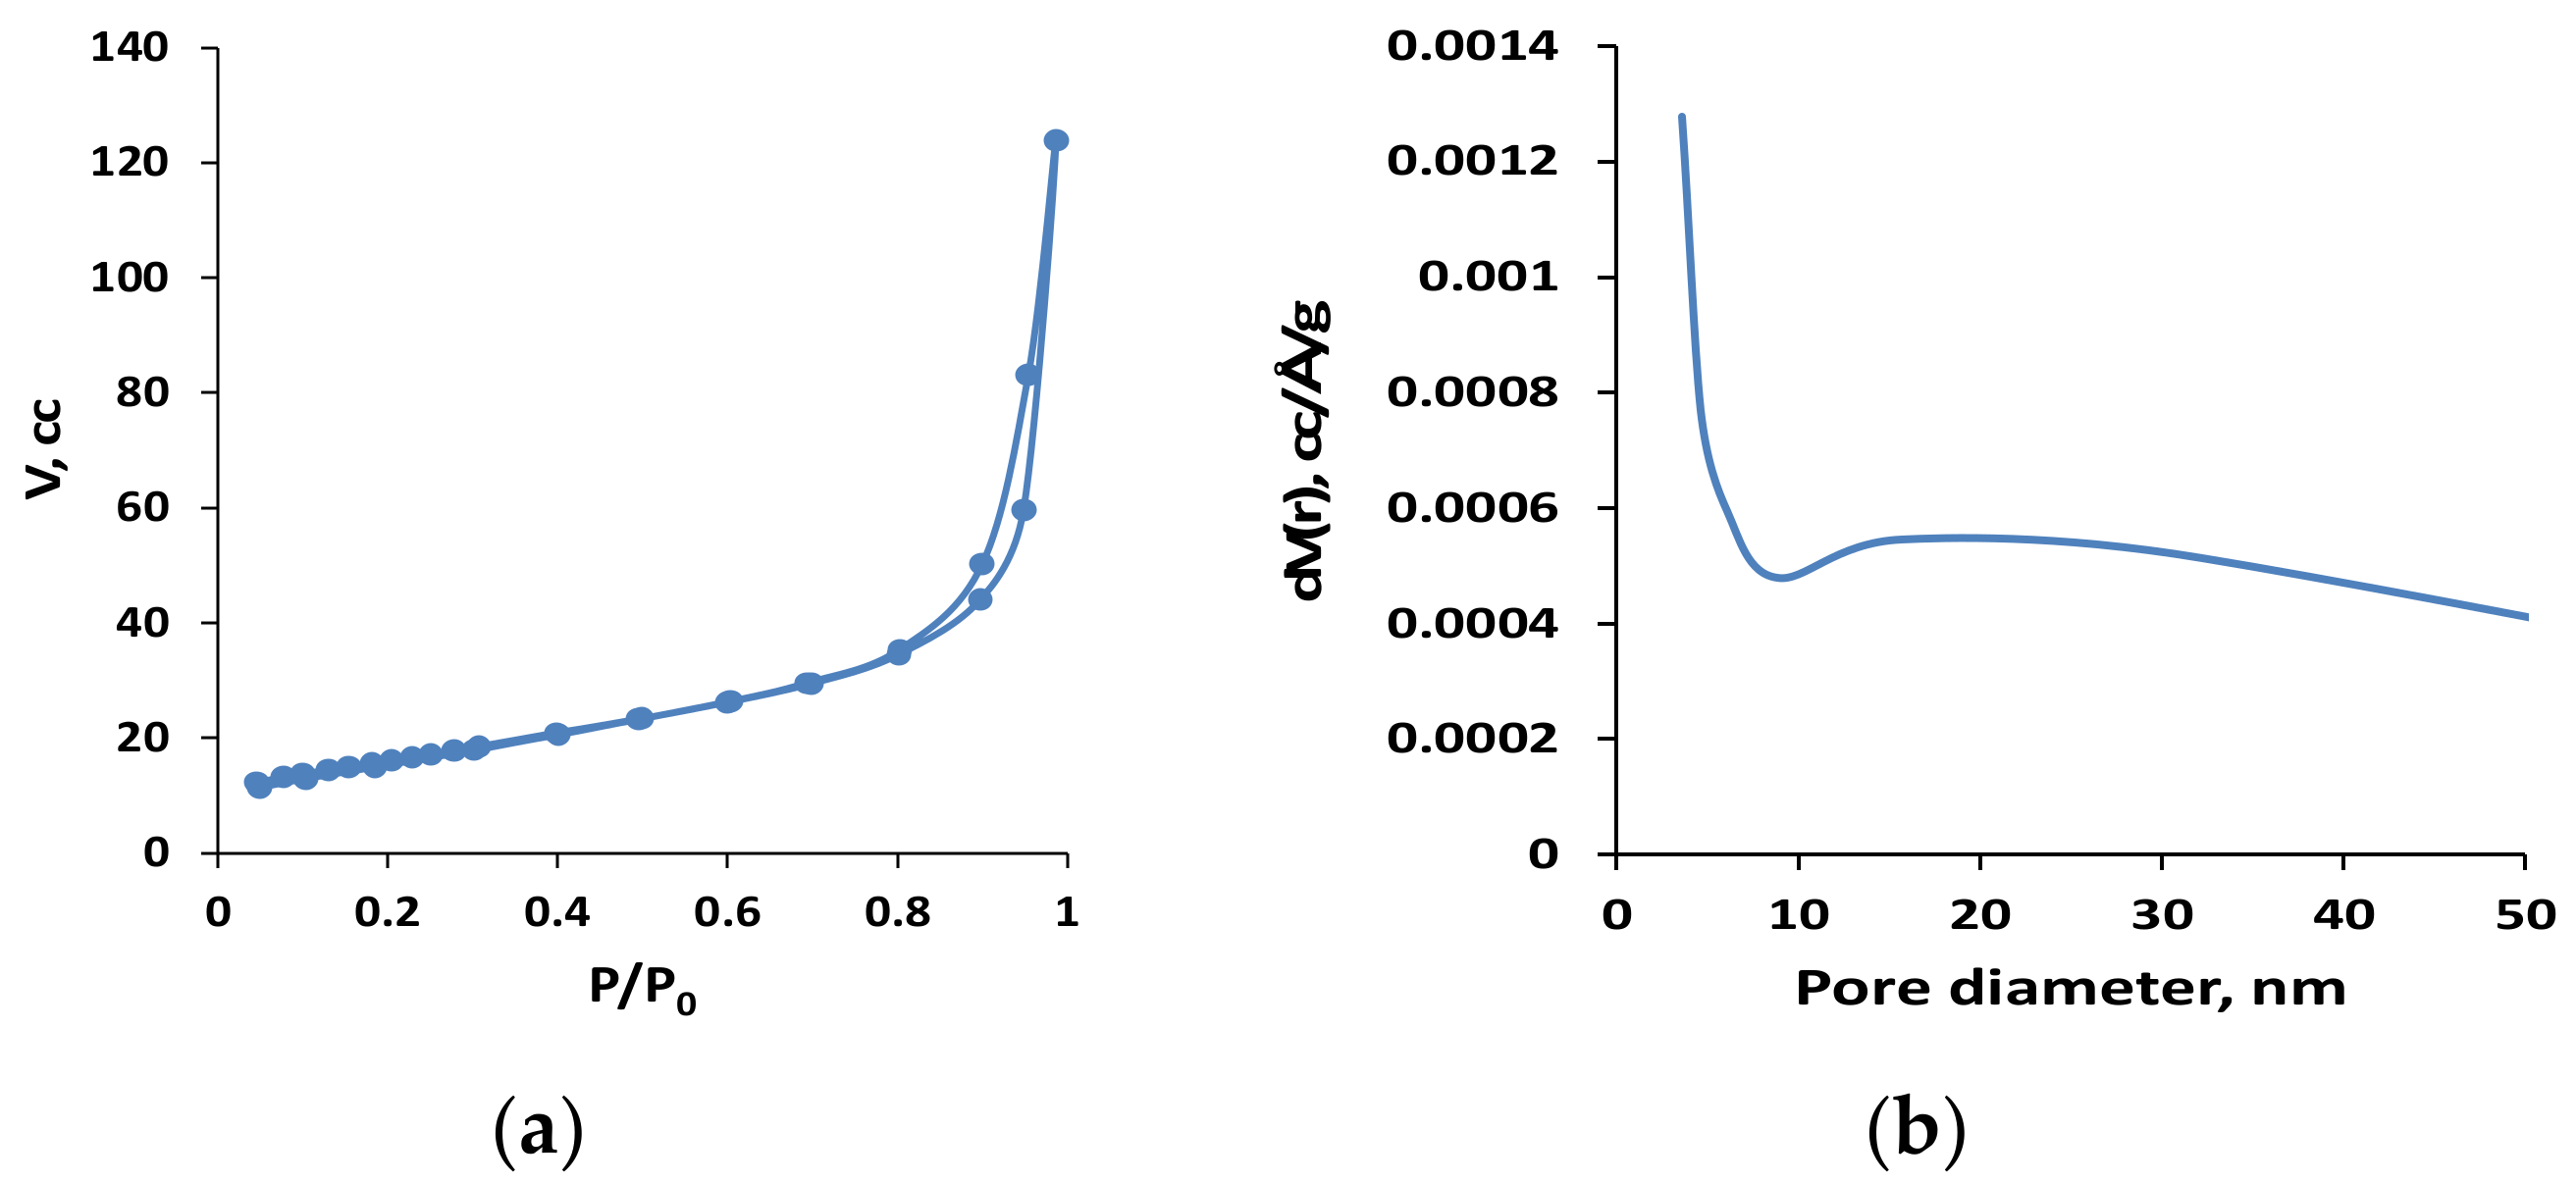
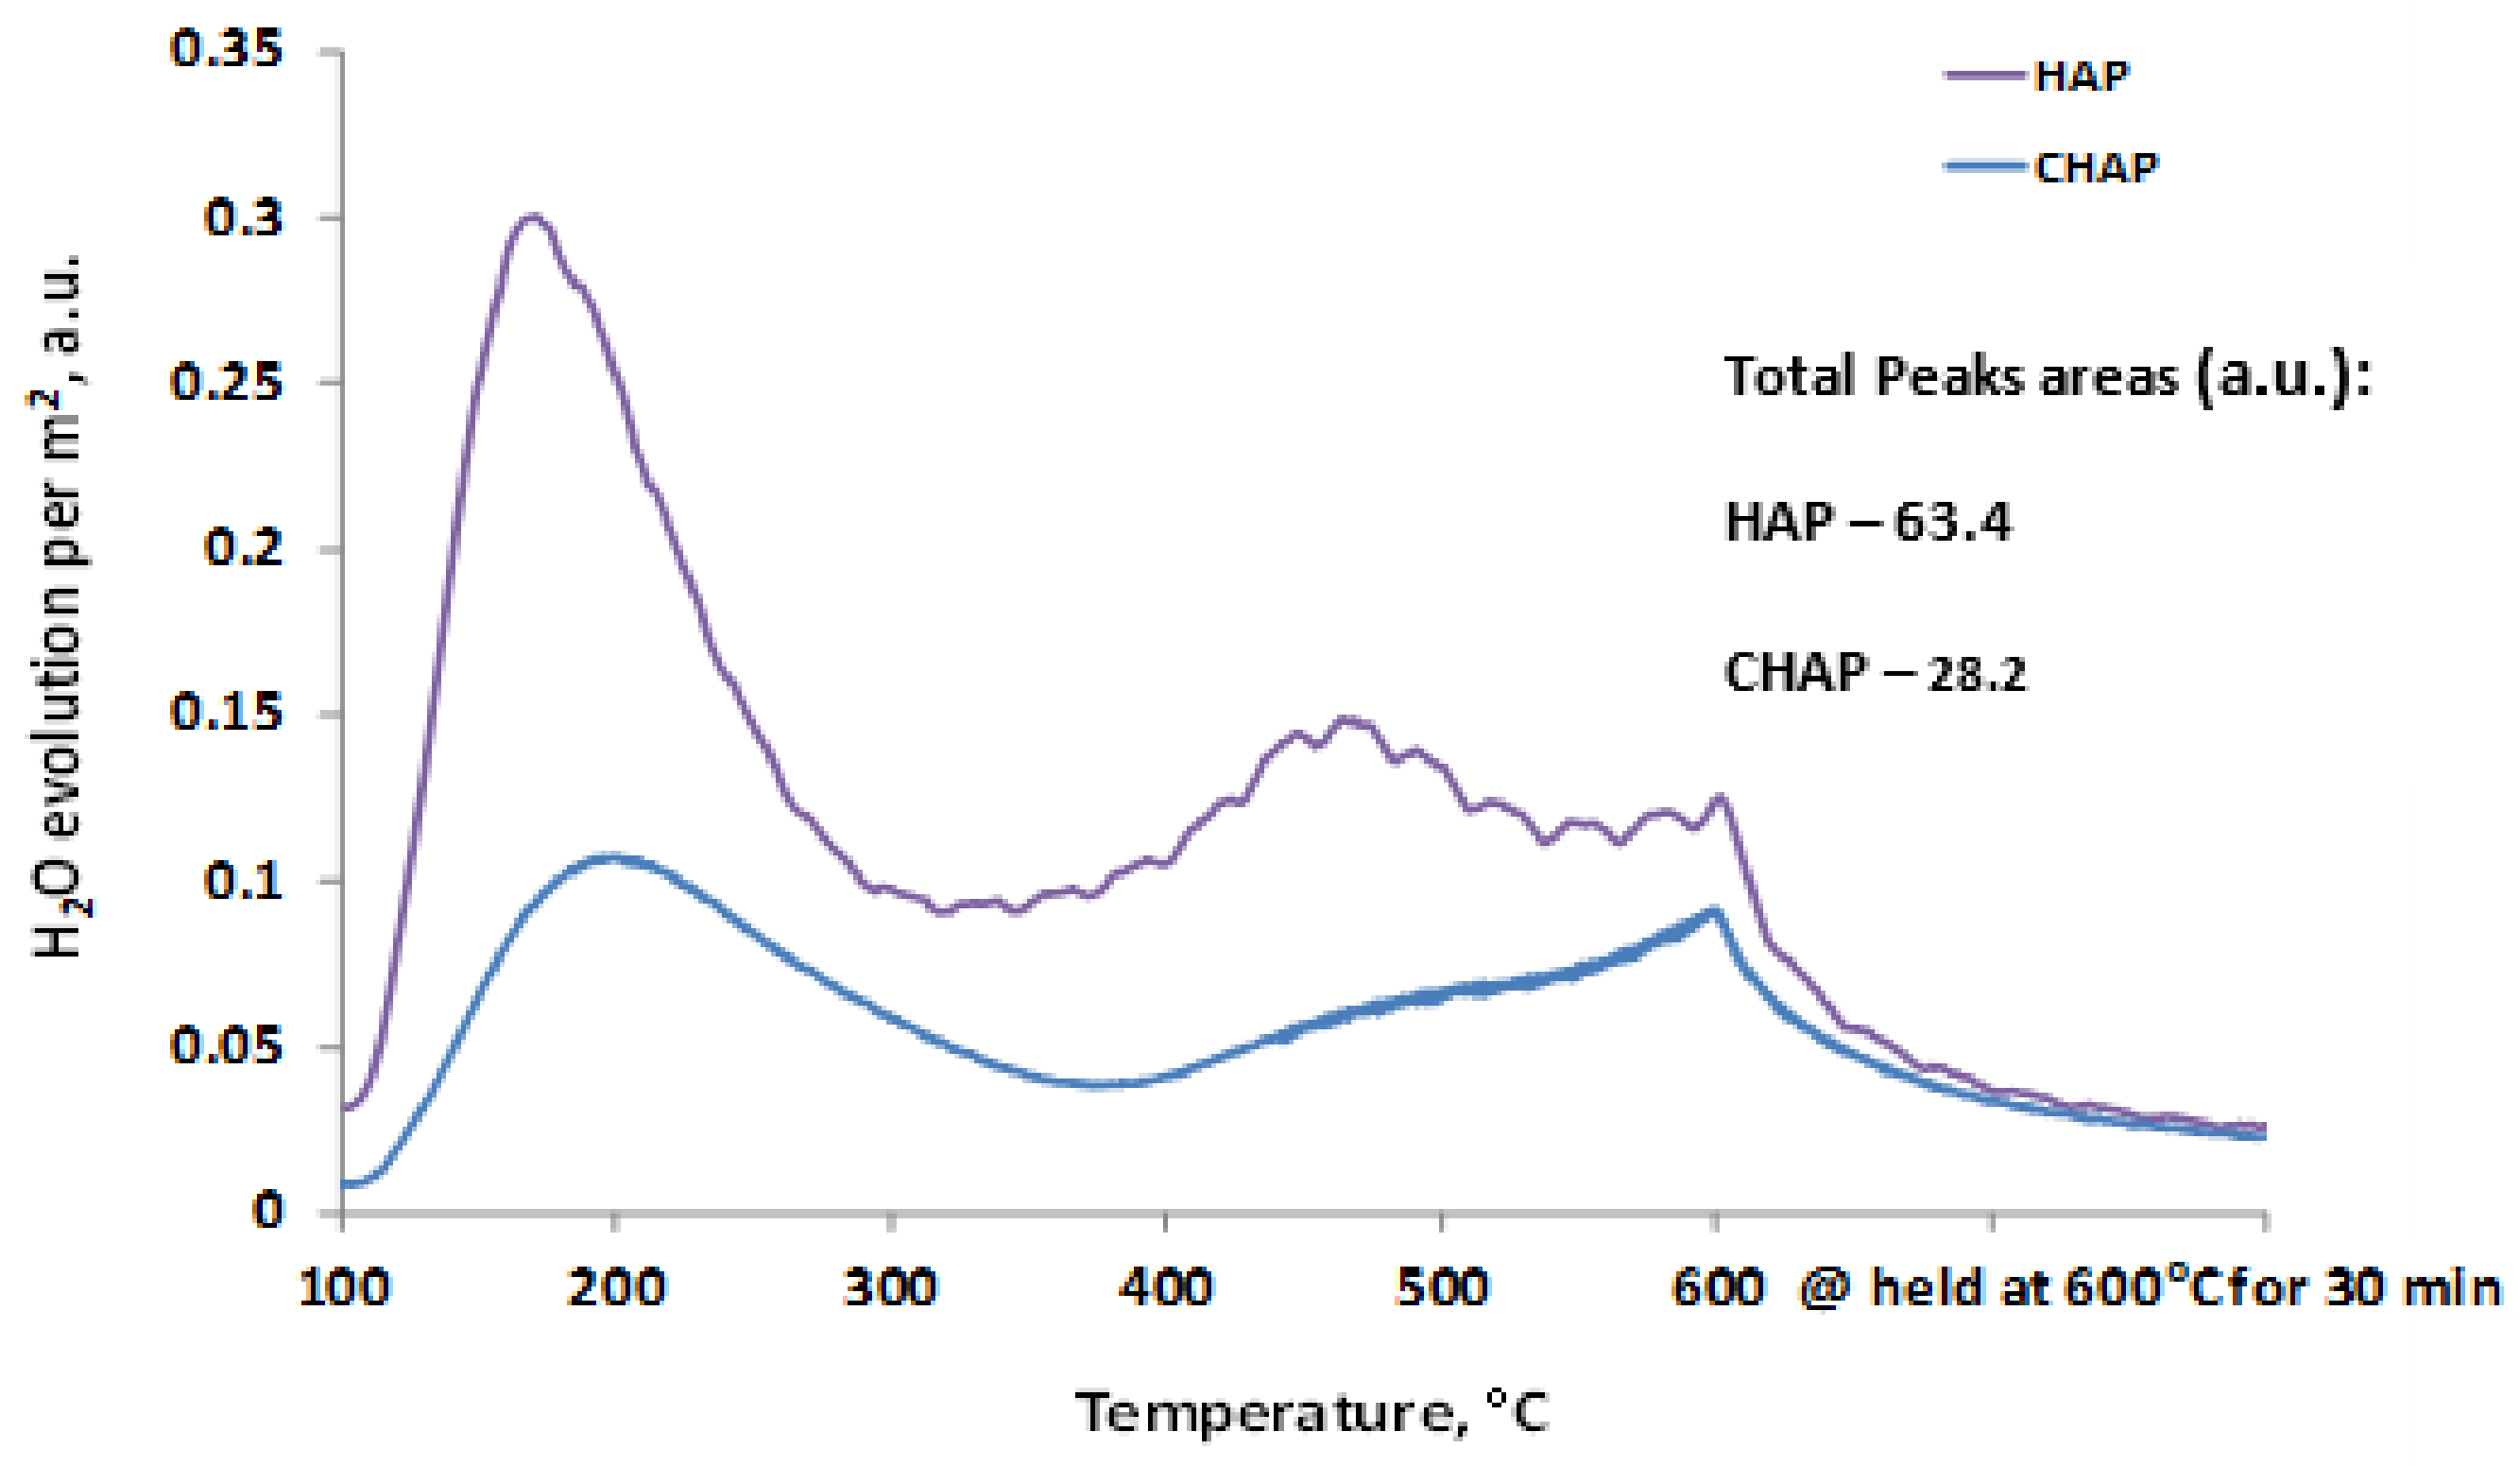
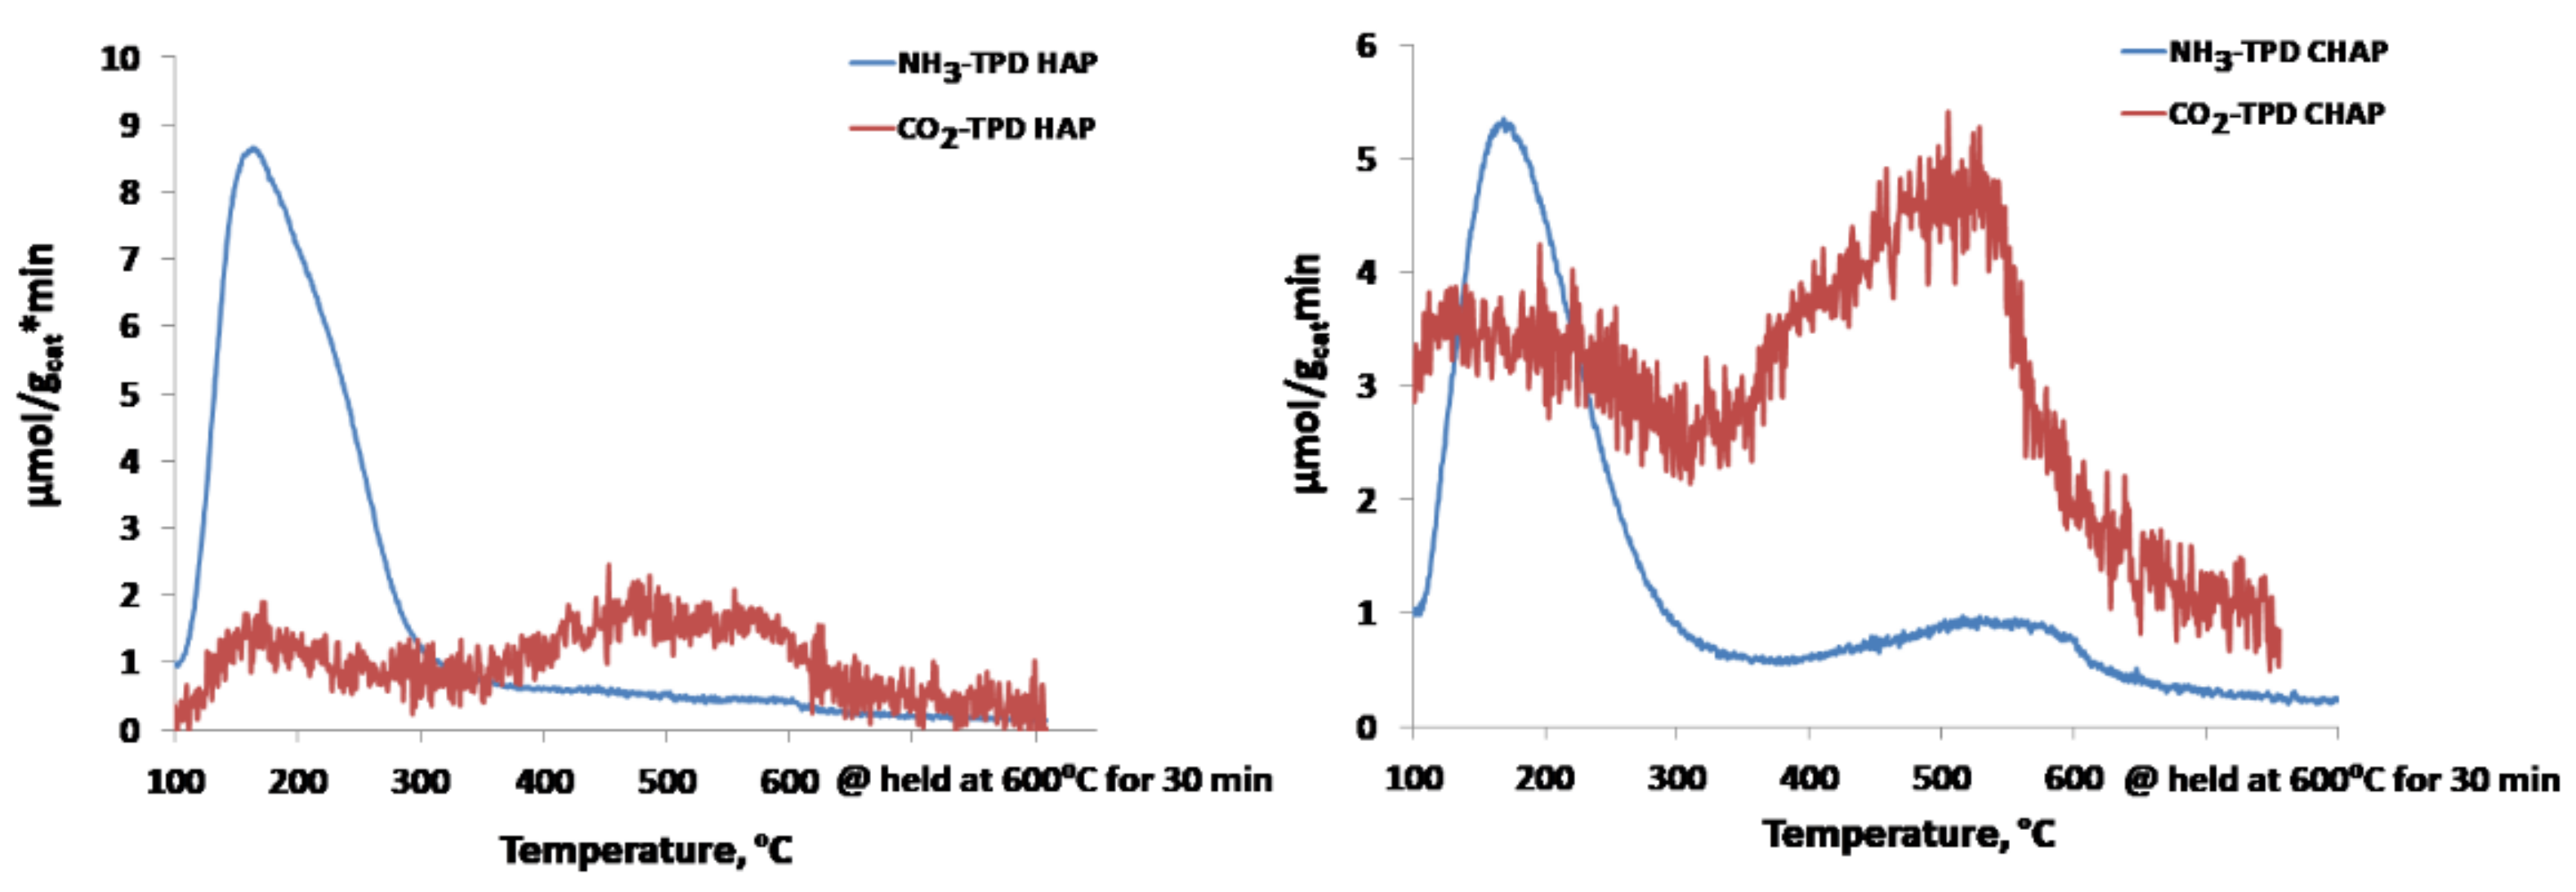
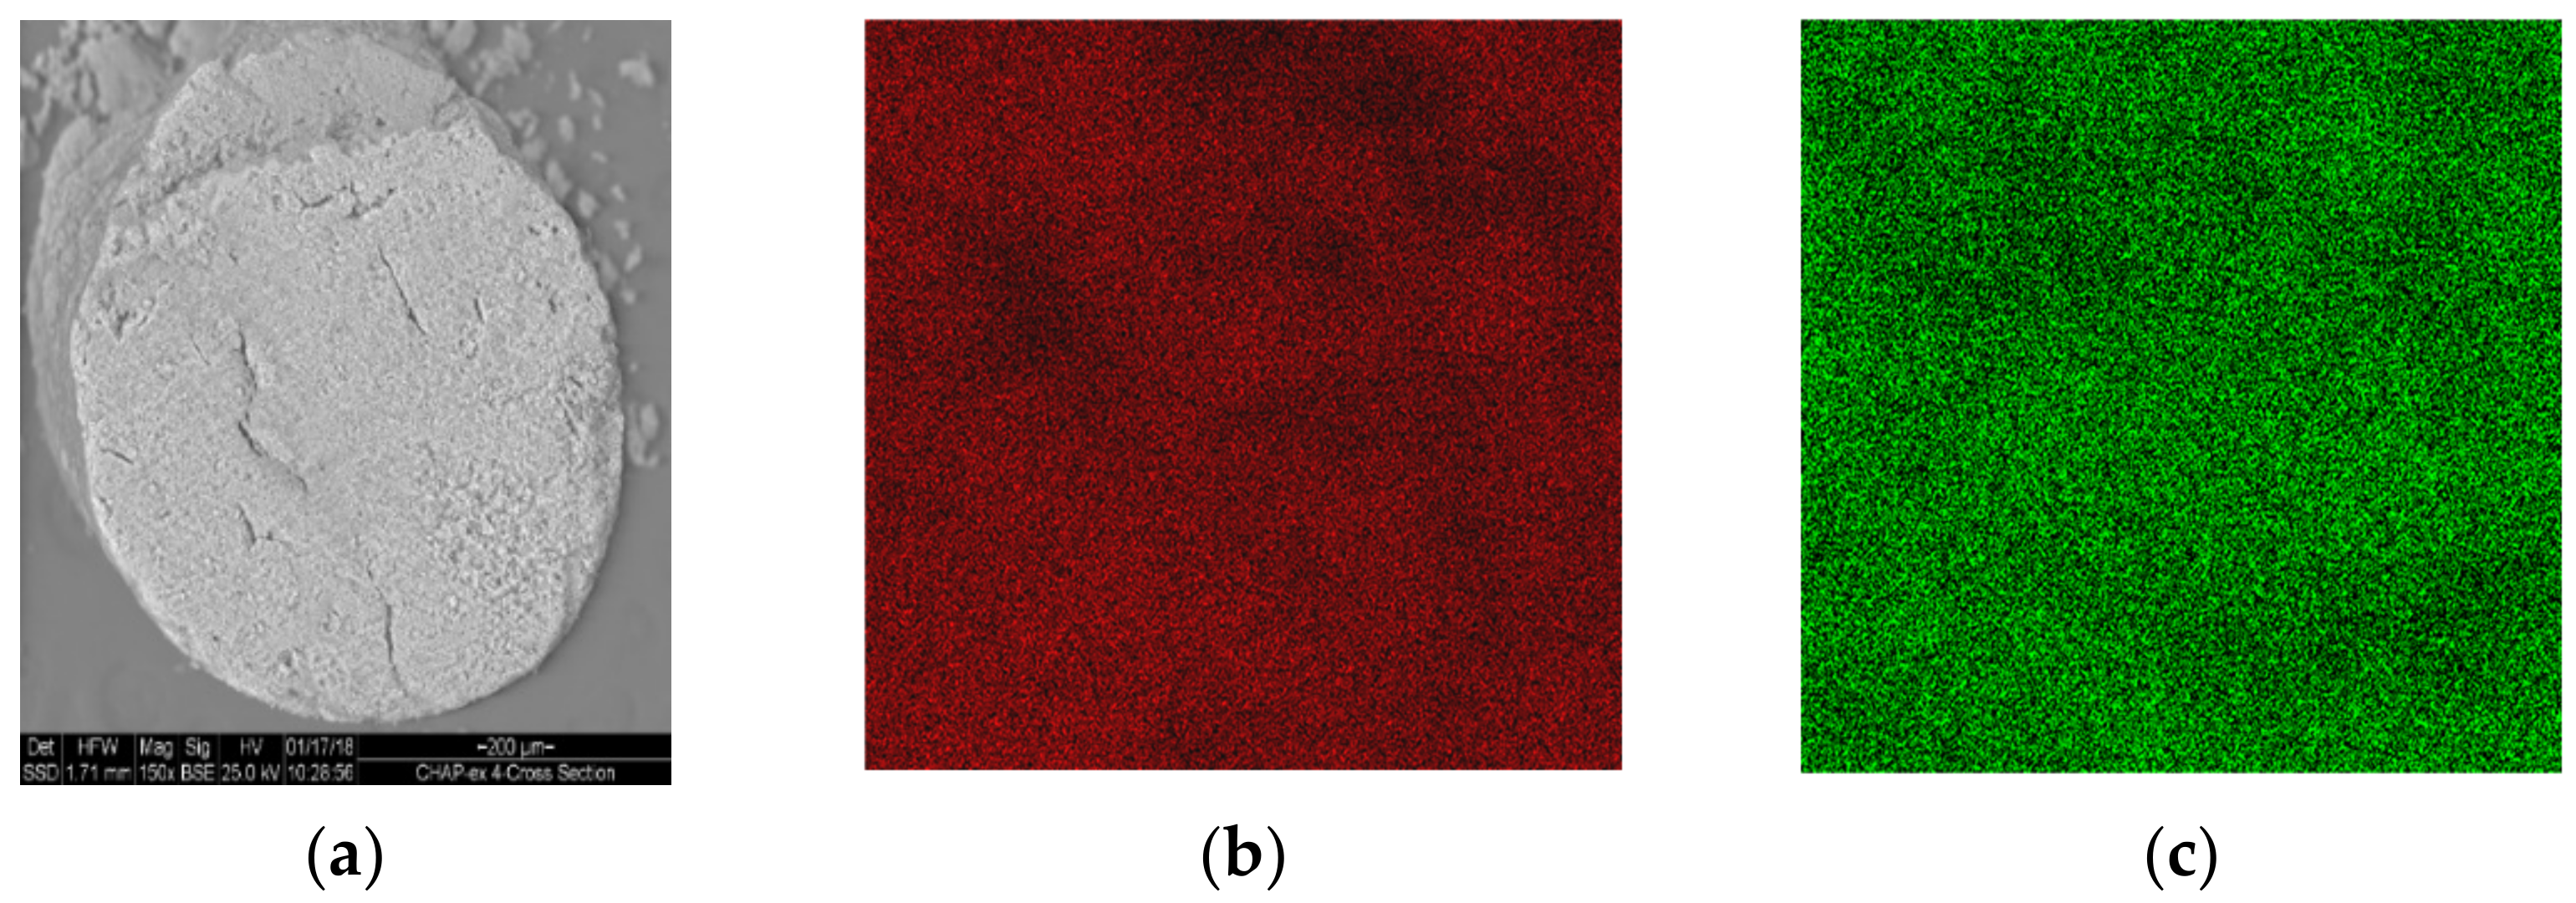
2.1. Catalyst Characterization

A non-stoichiometric hydroxyapatite [HAP, Ca10(PO4)6(OH)2] was used. The cations’ positive charge is compensated by the conversion of (PO4)3− to (H+PO4)2− and the reduction in the amount of OH groups replaced in the structure by water: Ca10−α(H+PO4)β(PO4)6−β(OH)2−γ(H2O)γ. This material contains the acid–base pairs required for the catalysis of anhydrous ethanol dehydrodimerization to butanol [9]. It is strongly hydrophilic, adsorbing water according to the following reactions:
(H+PO4)2− + H2O → (H3O+PO4)2−
HAPHOH + H2O → HAPHOH–OH2
This causes inhibition of catalytic activity in the presence of water in the ethanol feed. In our study, P-deficient HAP was used, where part of the (PO4)3− ions were replaced with CO32− anions [28,29]. The (PO4)3− anions may be replaced, in hydroxyapatite structures, by CO32− anions, so that C-atoms will be located in octahedral positions, while the positions of other atoms in the unit cell remain unchanged (Figure 1). This should eliminate acidic hydrophosphate anions and water molecules from the HAP structure/surface according to the formula Ca10(CO3)χ(PO4)6−y(OH)2+z. It would result in a significantly more hydrophobic surface, yielding the acid–base pairs that display catalytic activity and are resistant to water inhibition.
The XRD patterns of the calcined C-HAP material presented in Figure 2a correspond to the structure of hydroxyapatite (International Center for Diffraction Data (ICDD) Card #024-0033). The synthesized C-HAP material contained 1 wt% carbon, as indicated by the characteristic low-energy peak in the Energy Dispersive X-ray Spectroscopy (EDAX) spectra (Figure 2b). Treatment of XRD data for this material with the Rietveld program revealed that for the experimentally recorded patterns, the material should have a formula: Ca10(CO3)0.85(PO4)5.43(OH)2.1, with a Ca/P atomic ratio of 1.85. This corresponded well with the results of EDAX analysis.
The C-HAP material, according to the SEM micrographs (Figure 3), consisted of 25 × 100 nm nanorods. The primary nanocrystals were packed in aggregates, leaving small (between nanocrystals) and large (between aggregates) voids that determined the porous structure of the material.
The detailed quantitative information about the texture parameters of C-HAP material was derived from N2-adsorption–desorption isotherms (Figure 4a). The texture parameters of this material, listed in Table 1, and the pore size distribution (Figure 4b) show relatively high surface area for bulk solids, and significant pore volume and pore size, which is characteristic of mesopores that are favorable for mass transfer. The C-HAP material displayed higher surface area compared with HAP but lower pore volume due to smaller mesopores (Table 1).
The effect of carbon-modification of hydroxyapatite on the affinity of its surface to water was measured by thermodesorption of water from as-synthesized C-HAP material and HAP not containing carbonate ions with a Ca/P ratio of 1.65. The corresponding H2O-TPD spectra for HAP and C-HAP materials recorded at the temperature range of 100–600 °C (after storage at ambient conditions in air for 24 h and treatment in He at 100 °C for the removal of physically adsorbed water) are shown in Figure 5. The results clearly demonstrate a strong decrease, by a factor of 2.2, of the amount of water desorbed from HAP after its modification with carbon. This indicates increased hydrophobicity of the material, which is in agreement with expectations.
The acidity–basicity patterns of these two materials (i.e., not modified and C-modified HAP), were measured by recording NH3 (acidity) and CO2 (basicity) TPD spectra. The results presented in Figure 6 reflect the acidity–basicity changes caused by C-modification; as in unmodified HAP, the C-HAP material contained both acidic and basic sites with similar distribution according to their strength. Two NH3-TPD peaks centered at 180 and 500 °C reflected, respectively, weak and strong acid sites with significantly stronger acidity in C-HAP material. The content of both weak and strong basic sites characterized by CO2-TPD peaks centered at 180 and 500 °C, respectively, was about three times higher in C-HAP material that display significantly more intensive CO2-TPD reflections. The acid–base properties of C-HAP material are more favorable for catalysis of Guerbet condensation of ethanol to 1-butanol that require strong basic sites for the conducting of ethanol dehydrogenation to acetaldehyde and its aldol condensation steps (Scheme 1) [33].
The extrudates did not contain cracks (C-HAP-SiO2, Figure 7a) and displayed uniform distribution of C-HAP in their volume, as follows from Ca- and P- mapping of pellets cross sections in the SEM micrographs (Figure 7b,c). The texture characteristics of extrudates are listed in Table 2. Their surface area increased in the order of binders ZrO2 < SiO2 < Al2O3.

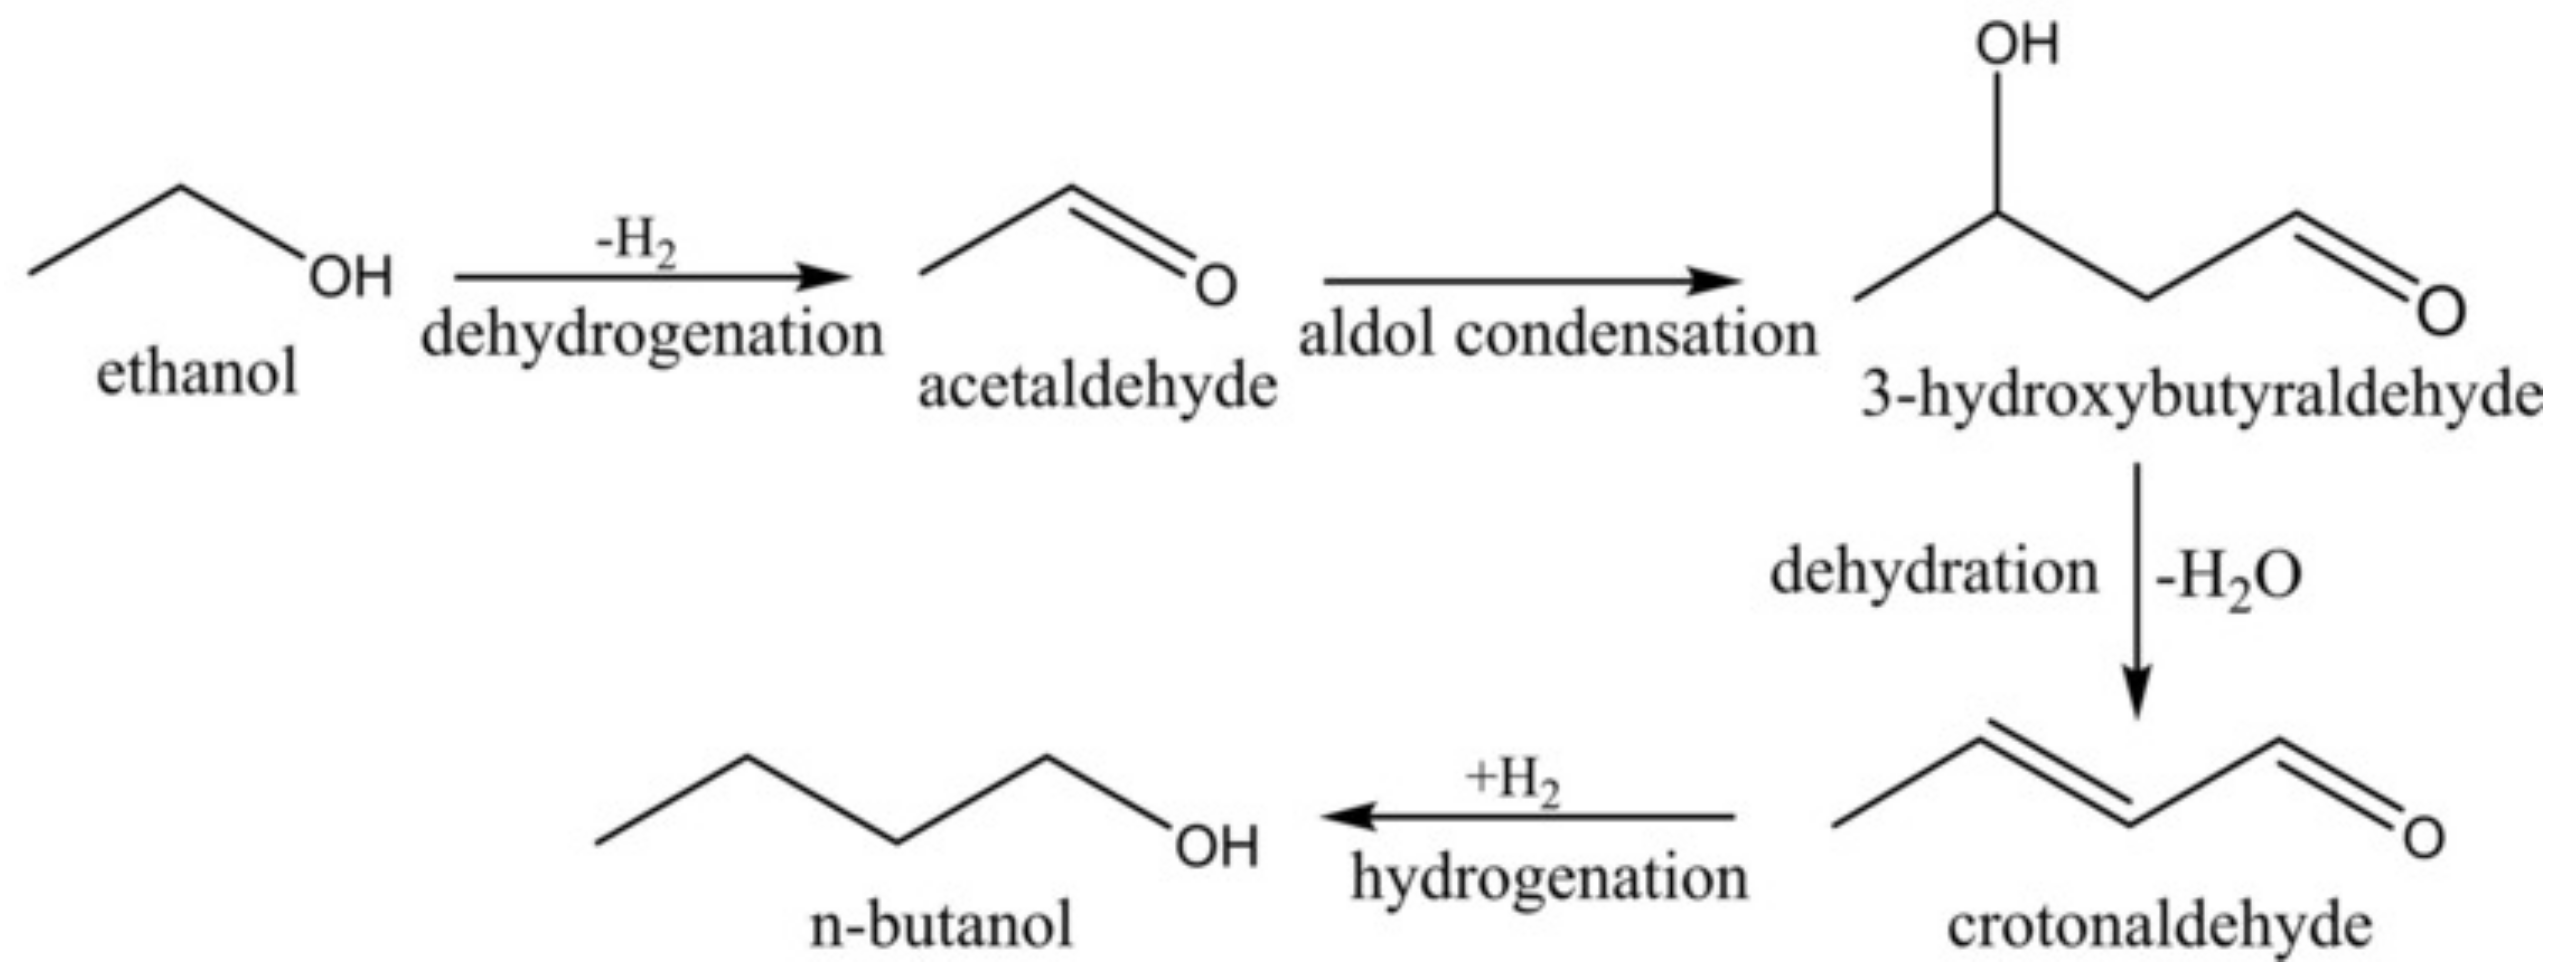
2.2. Testing of C-HAP Catalyst in Condensation of Hydrous Ethanol to 1-Butanol

Testing in bench rig. At the start of each run, hydrous ethanol was pumped through the reactor for 24 h at 530 °C and WHSV = 4 h−1 to prevent the formation of a biphase product that contains aqueous and organic phases including C5+ hydrocarbons, as reported elsewhere [34]. During this period, strong basic sites in C-HAP were blocked with coke deposits to depress the multistep ethanol condensation reactions forming an organic C5+ phase instead of 1-butanol [35]. Even after stabilization, organic and aqueous phases containing C5+ hydrocarbons and light oxygenates, respectively, were formed at extreme conditions (T > 420 °C, WHSV < 0.5 h1).
The performance of C-HAP powder catalyst conducted with anhydrous and hydrous ethanol at similar operating conditions is displayed in Figure 8. The results measured with anhydrous ethanol are consistent with the data reported for Ca-deficient HAP [28] and similar C-HAP [26] catalytic materials at 400 °C: 60–76% selectivity to 1-butanol at a low ethanol conversion rate of 14–21%. The addition of water to ethanol slightly decreases its conversion, increasing the 1-butanol selectivity, so that the yield of 1-butanol remains about the same.
The effect of temperature and ethanol conversion was studied in greater detail to select optimal working conditions of stabilized C-HAP catalyst. The ethanol conversion and 1-butanol yield decreased more than twice with the decreasing of the temperature from 400 to 350 °C. Increasing the temperature from 400 to 450 °C caused the formation of a biphase product due to shifting of the ethanol conversion route from butanol to C5+ hydrocarbons. Therefore, the effect of ethanol conversion on 1-butanol selectivity and yield was studied at the optimal temperature of 400 °C. The ethanol conversion increased from 14% to 40% as WHSV decreased from 6 to 0.2 h−1. Over this range, the selectivity and yield increased accordingly, as displayed in Figure 9. This is consistent with the results of testing the HAP catalyst with anhydrous ethanol [28].
The selection of appropriate binder for co-extrusion with C-HAP catalyst powder forming strong pellets determines the rheological characteristics of binder- C-HAP slurry in hydrated precursor form, and the mechanical strength and texture of calcined pellets. The chemical nature of binder may affect the catalysts’ performance, especially the 1-butanol selectivity, because of its own catalytic properties. The three catalysts prepared using SiO2, Al2O3 and ZrO2 binders with 70 wt% C-HAP content demonstrated high mechanical strength and texture parameters of pellets suitable for conversion of hydrous ethanol (Table 2). The results of their comparative testing at selected conditions are listed in Table 3. The highest 1-butanol selectivity and yield, like that measured with powder C-HAP material, are obtained with pellets formed with silica binder.
Dilution of C-HAP material with 30 wt% inert silica did not affect its catalytic performance. This may be attributed to the higher accessibility of the C-HAP catalyst’s surface to reacting molecules in pellets with higher pore volume and diameter compared with C-HAP powder (Table 1 and Table 2). The other two binding materials, despite the excellent mechanical strength and texture of the corresponding pellets (Table 2), yielded catalysts with low selectivity to 1-butanol (Table 3). In both cases, the gas evolved from catalytic reactor contained significant amounts of ethylene. This indicates catalytic activity of unmodified alumina [36] and zirconia [37] in ethanol dehydration yielding ethylene.
C-HAP-30%SiO2 was tested for 150 h, displaying high stability, as shown in Figure 10. The parameters of the pore structure of powder C-HAP, as-prepared C-HAP-30%SiO2 catalyst, and the same catalyst after 150 h of conversion of hydrous ethanol, were derived from N2-adsorption–desorption isotherms and pore size distributions, as shown in Figure 11 and listed in Table 1 and Table 4. The surface area of the C-HAP-30%SiO2 catalyst decreased slightly after testing from 77 to 65 m2/g, but was still higher than that of C-HAP powder (55 m2/g). The hysteresis loops recorded with C-HAP catalysts coextruded with silica were located significantly higher (high pore volumes) relative to powder catalyst, which reflects the higher pore volume of the extrudates. After testing, the hysteresis loop recorded with extrudates was shifted to higher P/P0 values as a result of widening of the pores due to hydrothermal transformation of the pellets’ texture at reaction conditions.
Based on pore size distributions (PSD) in fresh and spent catalysts (Figure 11b), it may be concluded that the observed decrease in surface area after testing was caused by the widening of mesopores so that the maximum at PSD curves was shifted from 8 to 18 nm. This was mainly a result of hydrothermal transformations of the pore structure in C-HAP-30%SiO2 catalyst pellets together with minor blocking of pores with coke deposits that caused a decrease in pore volume. This explains the high stability of the pelletized C-HAP-30%SiO2 catalyst in the conversion of hydrous ethanol to 1-butanol.
Testing in mini-pilot rig. C-HAP-30%SiO2 catalysts pellets of 50 cm3 volume, packed in the reactor and stabilized at WHSV = 4 h−1 and 450 °C for 24 h, were tested at 400 °C and 0.5 to 4.0 h−1. The results listed in Table 5 indicate that the ethanol conversion gradually increased with the decreasing of the WHSV from 18.8 to 30.5%, while the 1-butanol selectivity and yield increased to 74.4% and 22.7%, respectively. No deactivation or changes of 1-BuOH selectivity were observed at different WHSV values, in agreement with the results at the bench scale. Acetaldehyde, hydrogen and heavier alcohols C6-C8 produced by dehydrocondensation of butanol with ethanol or another butanol molecule were the main by-products. This means that not all acetaldehyde produced at the ethanol dehydrogenation step undergoes further aldol condensation (Scheme 1).

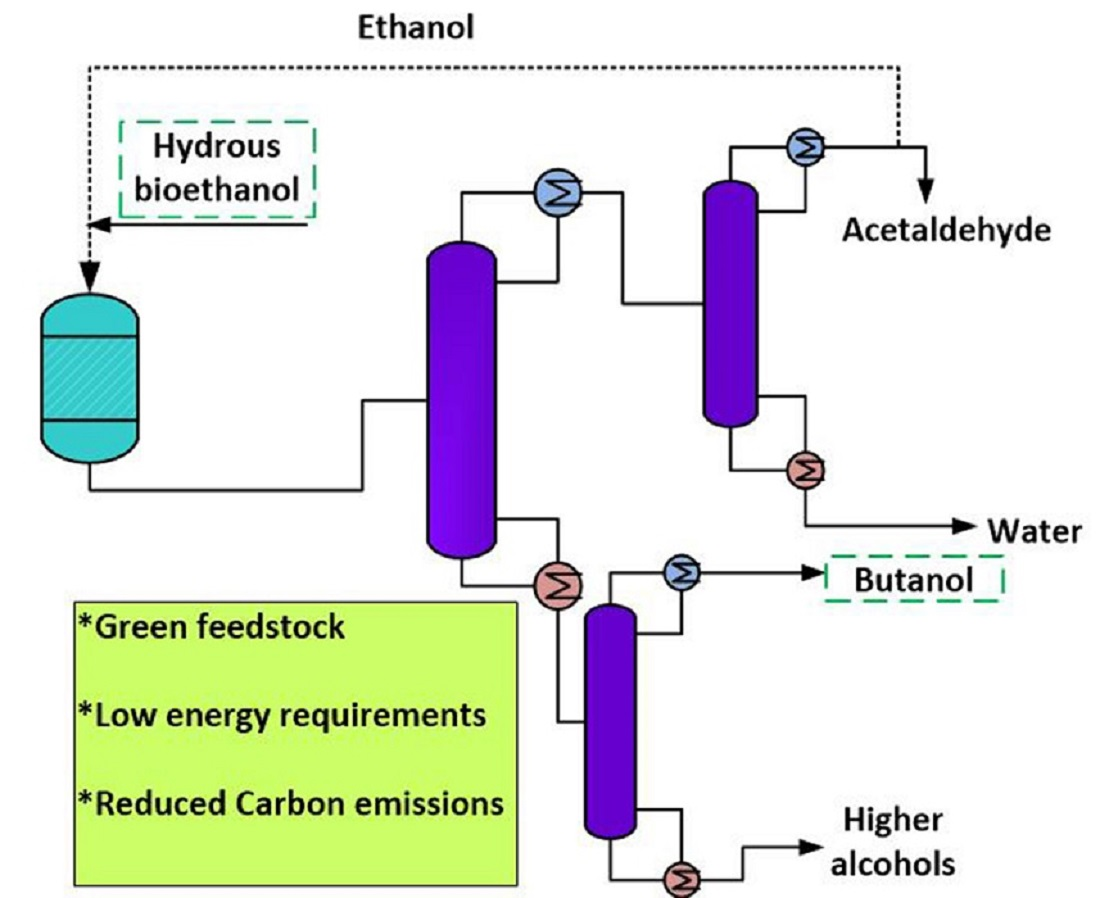
2.3. Process Simulation and Techno-Economic Analysis

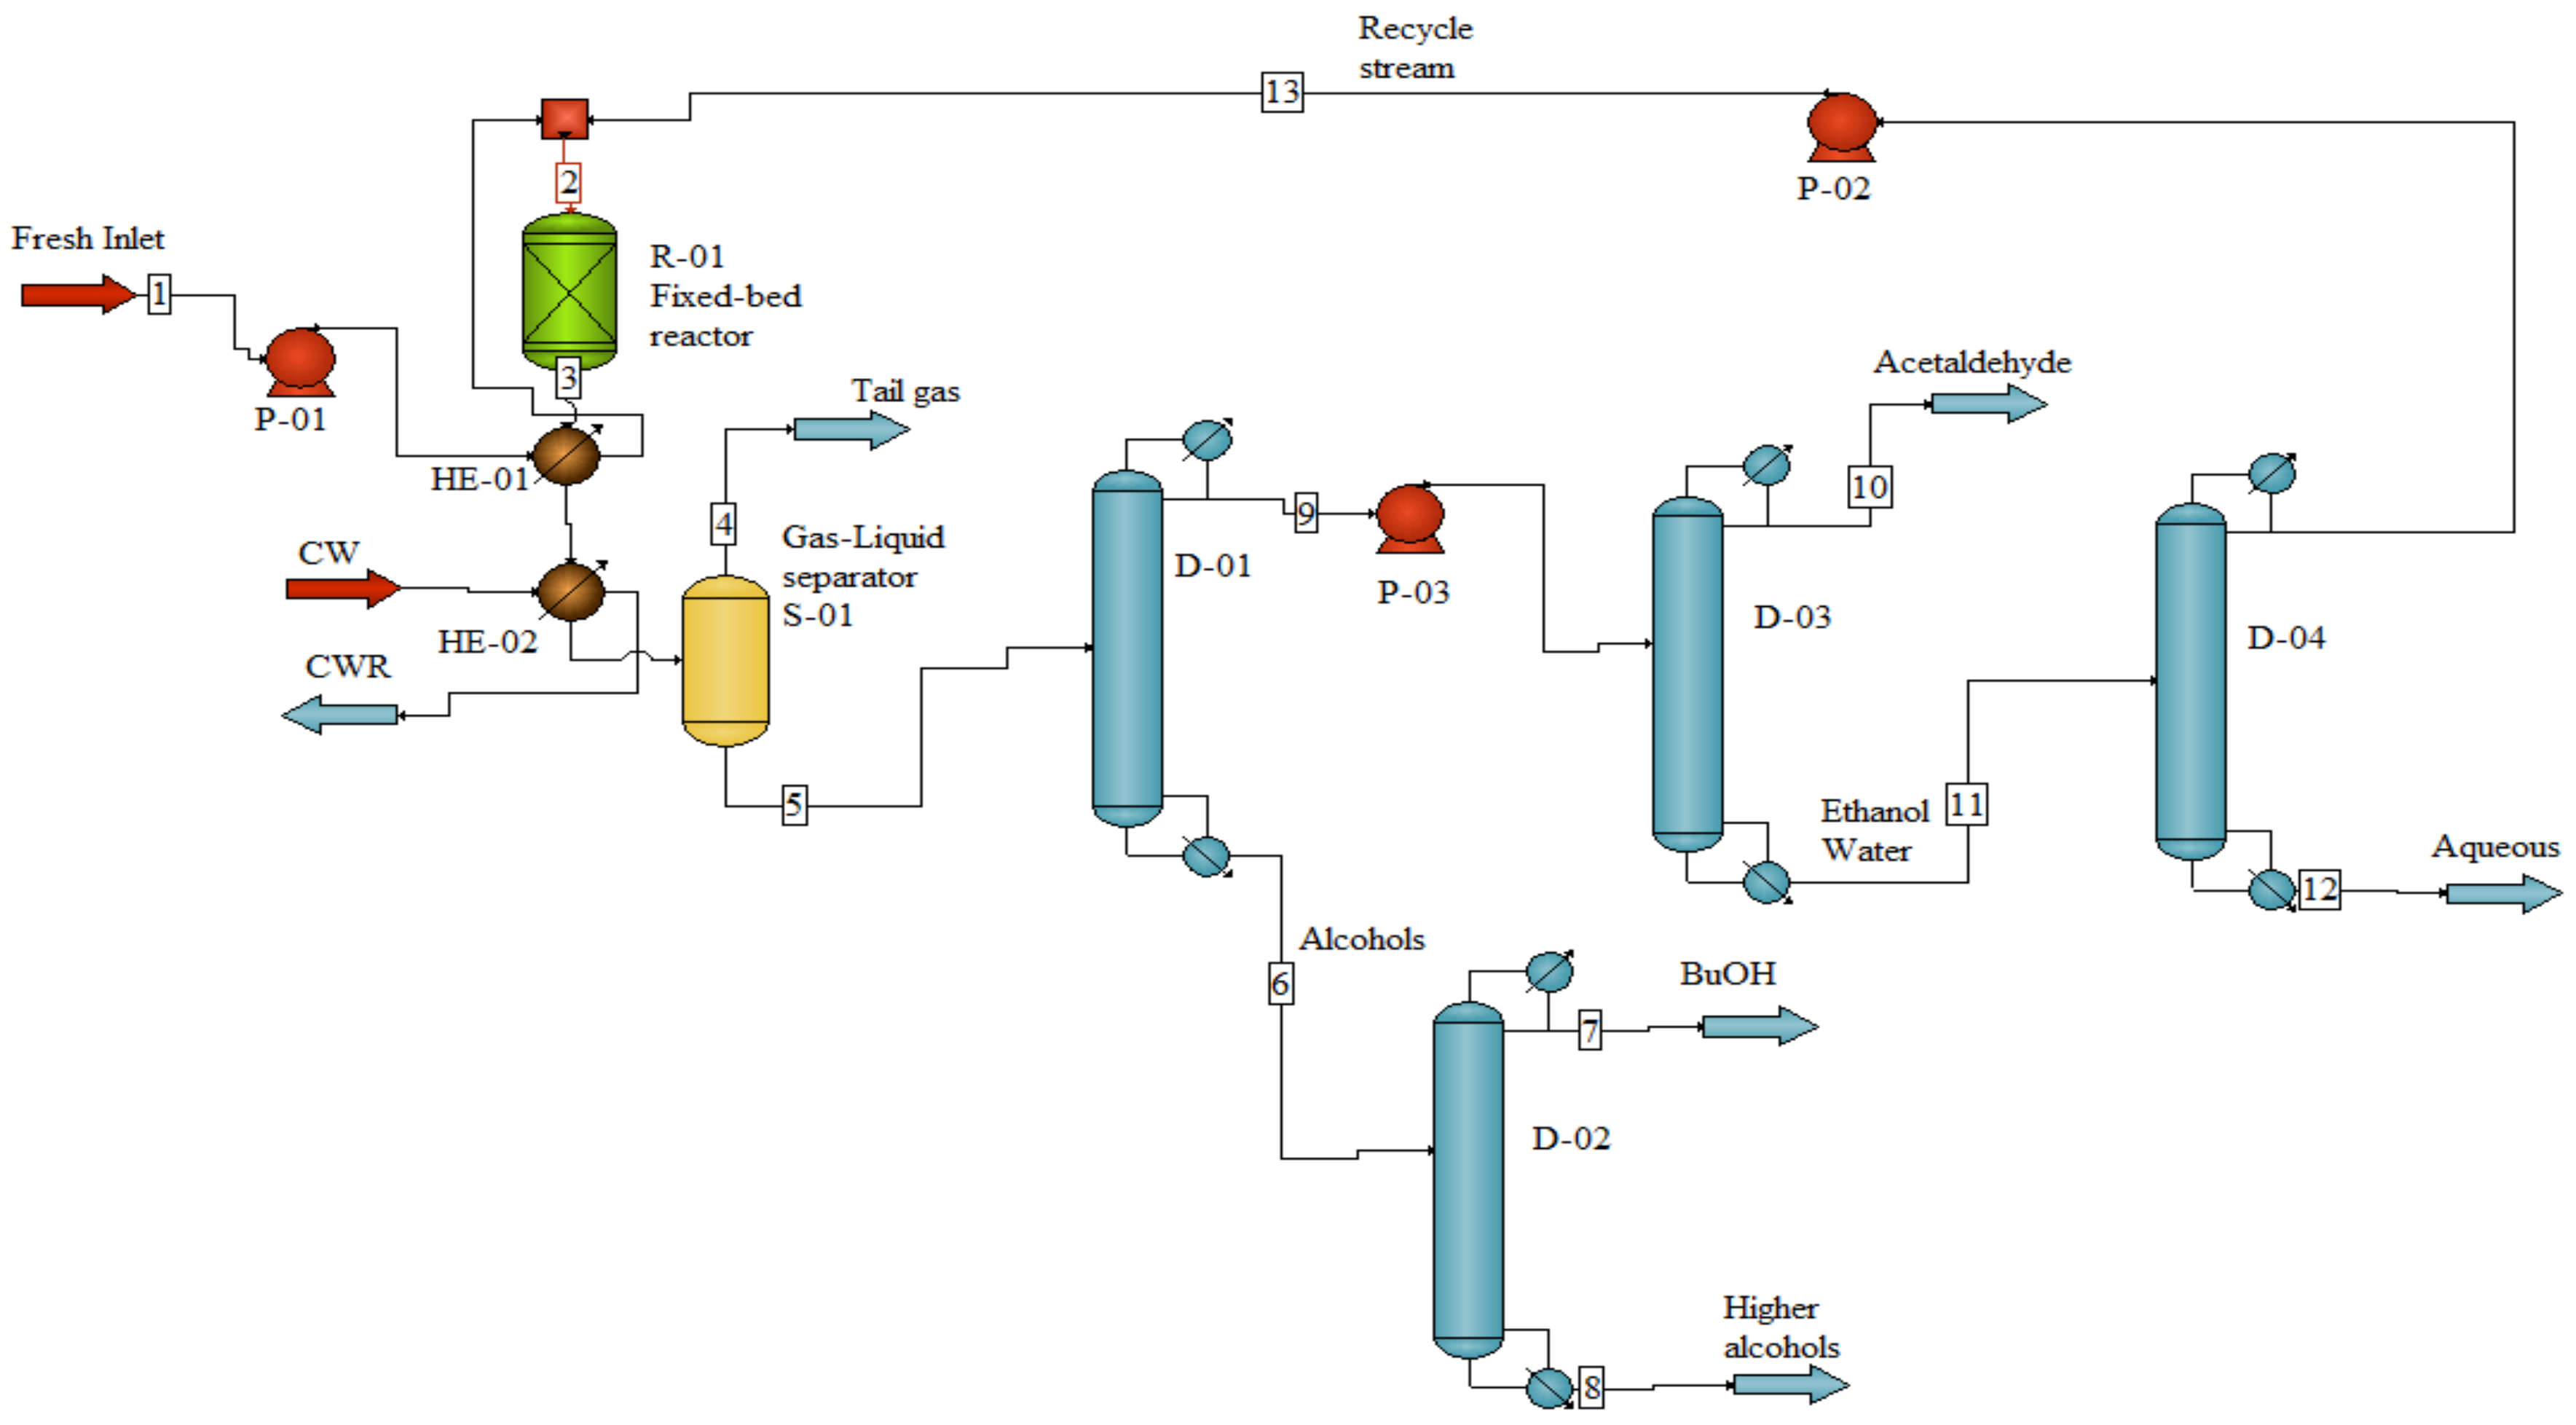
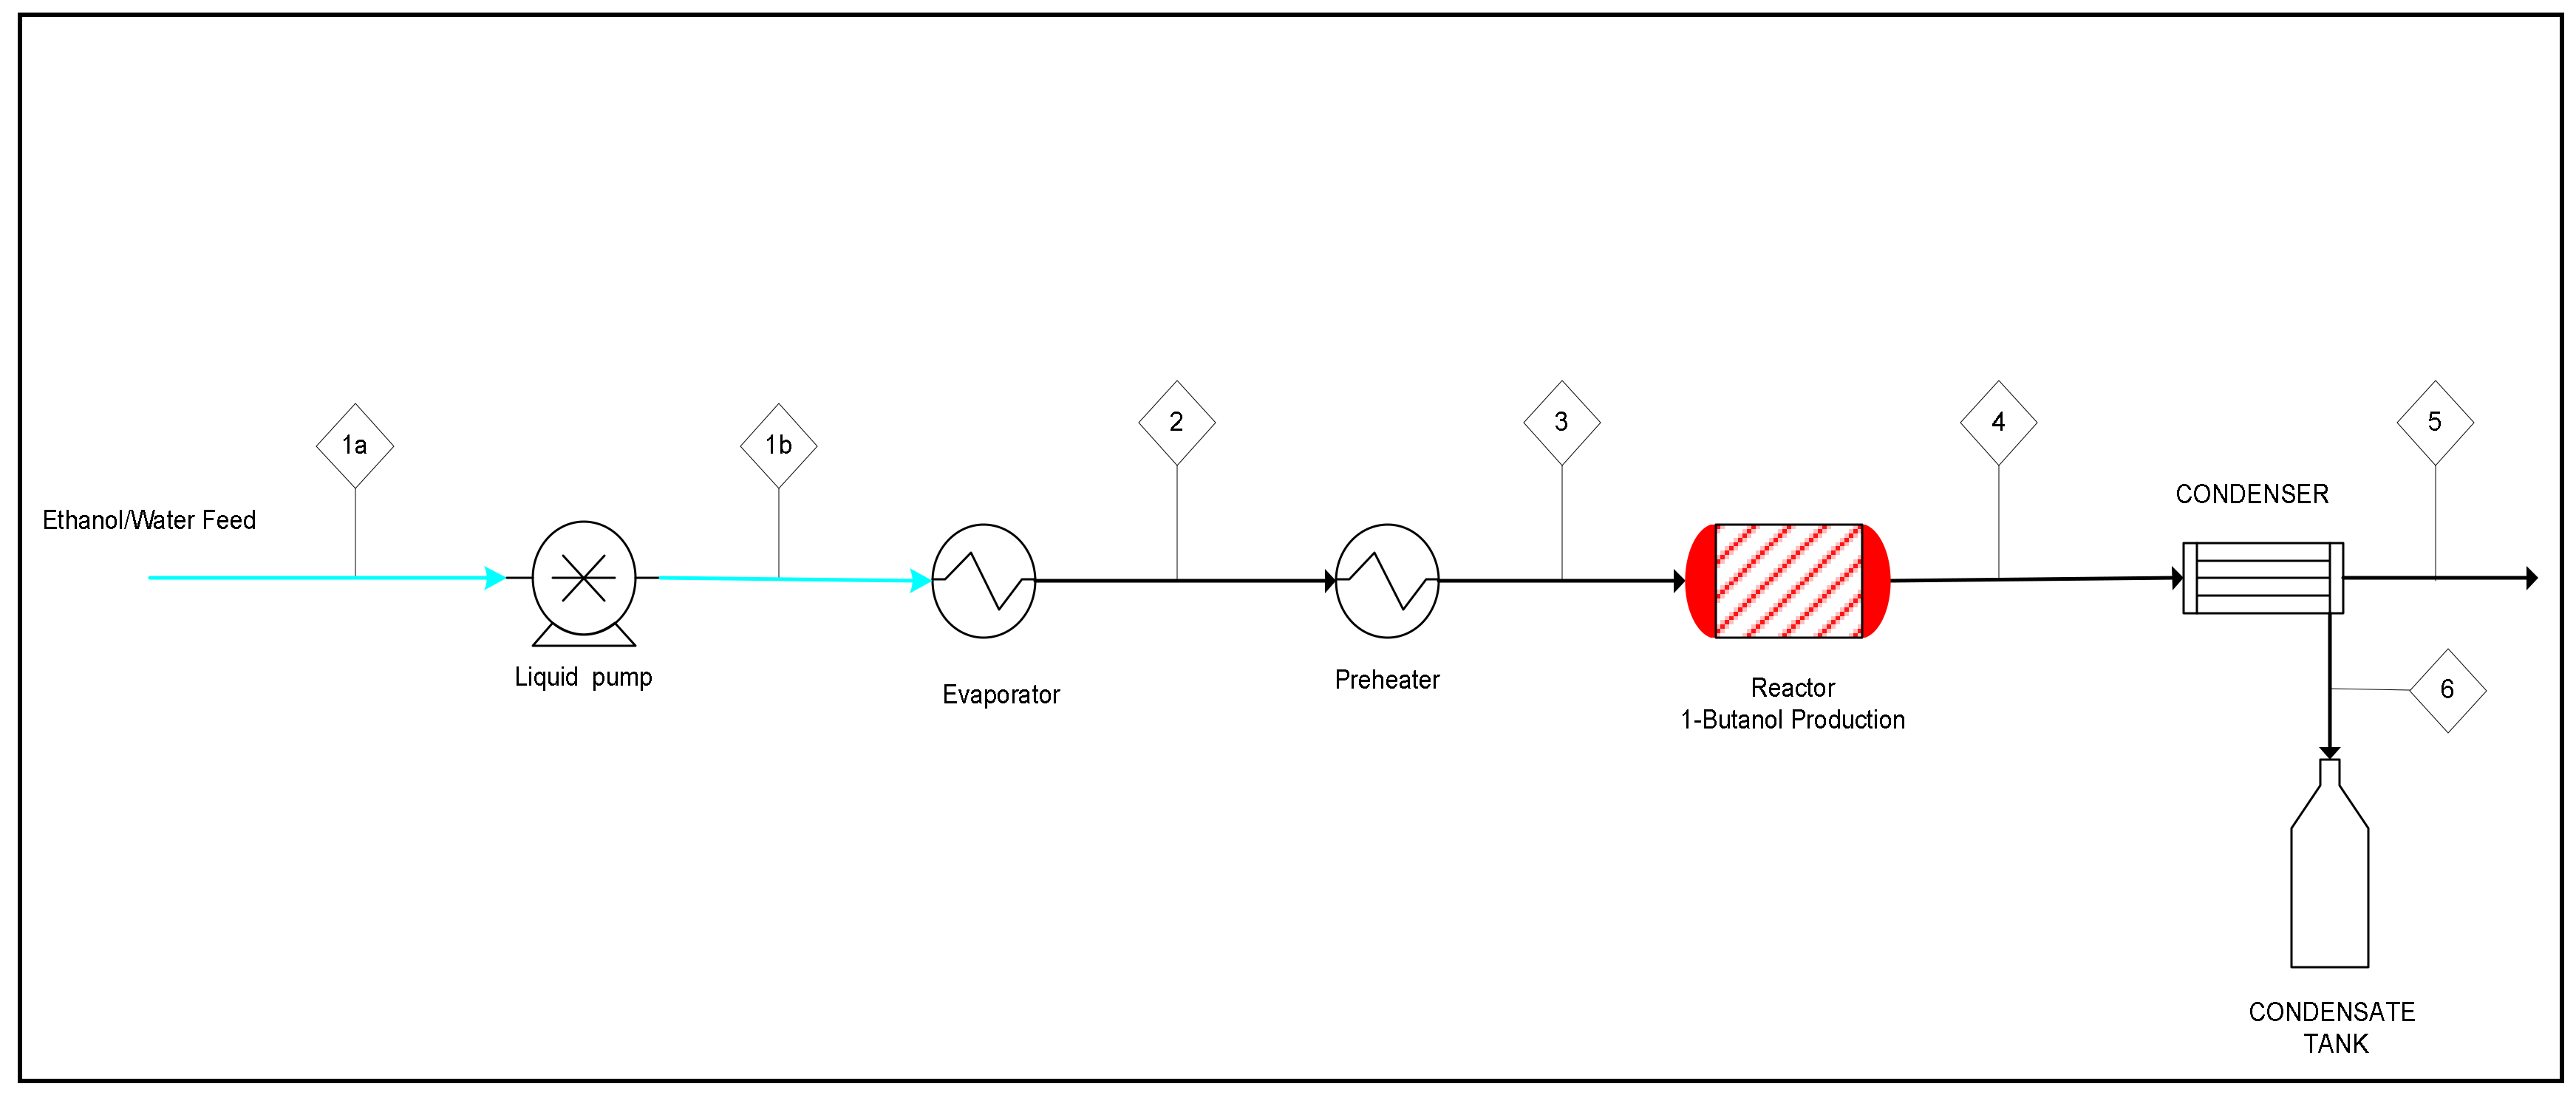
2.3.1. Mass Balance and Process Simulation

The simulation of the process was conducted using the CHEMCAD 7.1.1 software based on the results achieved in the experimental unit to estimate material balances, energy and utility requirements as the inputs for the techno-economic analysis. The hydrous ethanol is converted selectively to butanol on C-HAP catalyst packed in a fixed-bed reactor at 400 °C, 1 atm and a WHSV of 1 h−1. At these conditions, the butanol selectivity and yield are 73.2 and 21.1%, respectively (Table 5). These figures were selected for the simulation of the reactor. The basis for design is 10 tonnes per hour of butanol. The low ethanol conversion, in addition to azeotropes and by-products that may be formed in the reactor effluent, can complicate the separation process. Therefore, implementing an efficient separation stage for this process is vital to reach an economically competitive process. Different possible scenarios for separating the product in the ethanol to butanol process were suggested in the literature [15,38]. In this study, no other by-products except acetaldehyde and C5+ alcohols (represented as hexanol in the simulation) are formed in the reaction. Furthermore, the ethanol conversion is kept low; thus, the water content is relatively small in the effluent stream. The two additional columns are foreseen to provide ethanol and acetaldehyde in (re)-usable quality, making it possible to reach an efficient separation of butanol (99.9 wt%). The separation calculations in CHEMCAD were performed by using a non-random two liquid (NRTL) model, which is most suitable for these components and process conditions. The schematic description of the process is depicted in Figure 12. Mass rates of all streams and components are listed in Table 6. Fresh feed (hydrous ethanol) in stream 1 is mixed with recycle stream 13, containing ethanol–water azeotrope solution, to form stream 2, which reacts to produce stream 3. The product from the adiabatic reactor is cooled from 435 °C to about 40 °C by heat exchangers and split, in a separator, into tail gas (stream 4) and liquid product (stream 5) that flows to distillation column D-1. Distillate stream 9, containing mainly ethanol, flows to distillation column D-3 while the bottom stream 6 is the butanol and higher alcohol products. Butanol is separated in distillation column D-2 where the bottom stream 8, containing higher alcohols, is sold as a mixture. Distillation column D-3, operated at 1Barg (to allow acetaldehyde condensation at 40 °C), is used to separate acetaldehyde (99.5 wt%) in overhead stream 10, which can be sold, while the bottom stream 11 flows to distillation column D-4 to separate water with about 14% alcohols, and the recycle stream 13.
The maximum allowable water content at feed determines the distillation columns’ sizes and the required reflux ratio, which directly affect the production cost. There is also a clear trade-off between the cost of energy used in the process and the efficiency of ethanol and butanol separation. In this work, the water content at feed was limited to 6 wt%, while a carbon recovery yield of 94.2 wt% was found to be optimal. Energy for distillation reboilers is provided by steam generated in a steam boiler fueled by natural gas (90% efficiency). Cooling water is used to remove heat in the process. Heat losses in the piping system were neglected.
The calculated mass yield in this process is 54.4%. Since the maximum theoretical yield is 80%, the proposed process yields 68.0% of that maximum, which has significant implications on the economics and the feasibility of the process.

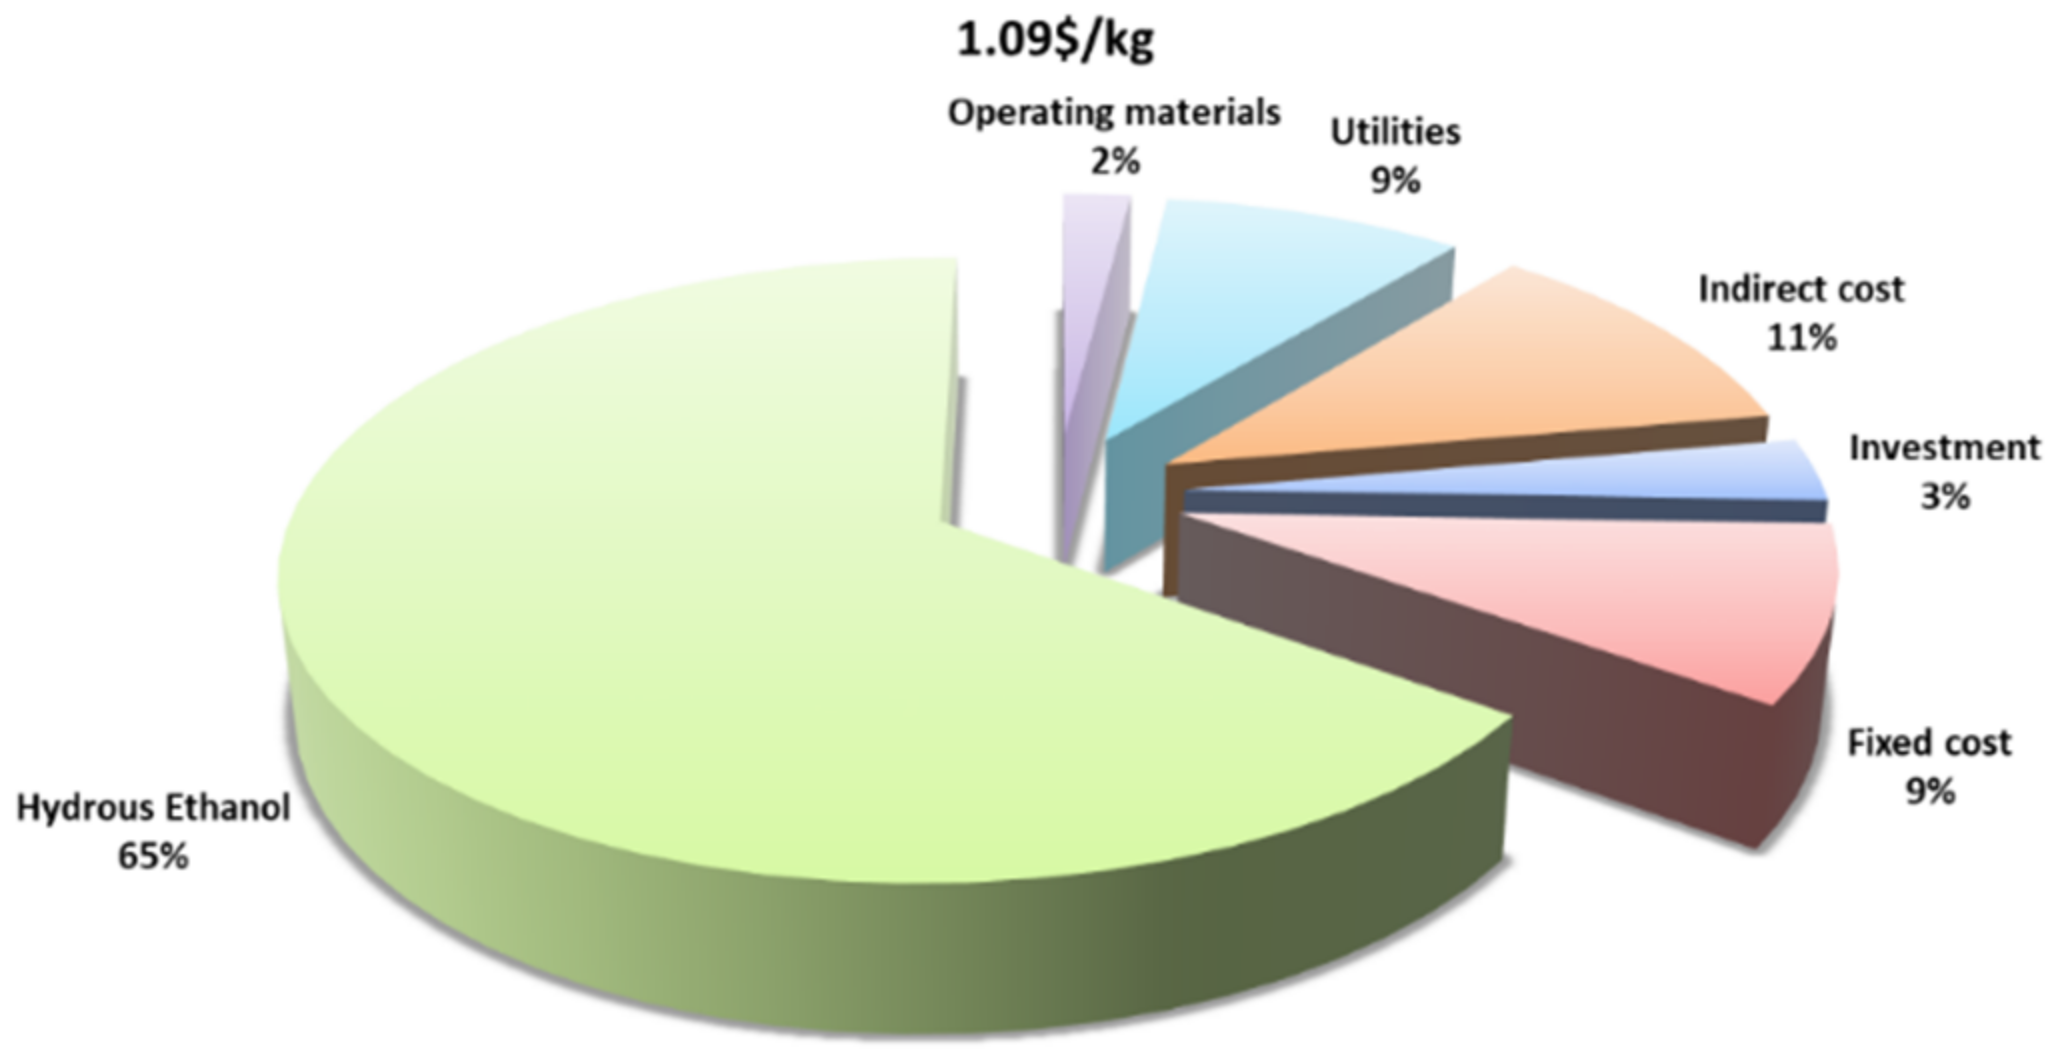
2.3.2. Initial Investment and Operational Expenditures

Based on the process simulation results for a design capacity of 80,000 tonnes/y of N-butanol, we first estimated the purchase cost equipment (PCE) for the main components. In order to account for inflation and temporal cost variations of equipment, the Chemical Engineering Plant Cost Index (CEPCI) is used to update old data with respect to the chosen reference year (2019). The specifications and description of the assumptions and sources used in the estimation of the cost of equipment are given in Table S1 in the Supplementary Information. Based on the purchase cost of the delivered main equipment units, the capital expenditures (Capex) could be estimated by ratio factors for direct and indirect capital investment [39], as described in Equation (1).
C a p e x = P C E 1 + i = 1 i = n f d i 1 + i = 1 i = n f i d i
where PCE is the purchase cost of the main equipment units, fdi is the direct ratio factor and fidi is the indirect factor for the capital investment. The initial total investment of the process of production of 80,000N-butanol tonnes/y from hydrous bioethanol is summarized in Table 7. The variable costs are calculated based on the results from the process simulation and prices of utilities and materials, as shown in Table 8. Table 9 summarizes the assumptions [39,40,41] as well as the breakdown of the annual Operational expenditures (Opex).

2.3.3. Process Economic Evaluation

During the economic analysis, several important evaluation indicators such as levelized cost of product (LCOP) and Discounted Pay Back Period (DPBP) were selected to determine the profitability of each case, taking into account the initial investment, start-up time, plant lifetime and actual discount rate. The assumptions used for this economic study are given in Table S2 in the Supplementary Information. The levelized cost of butanol results from the comparison of all costs throughout the lifetime of the plant for the construction and operating of the plant with the sum of the generated amount of butanol throughout the life cycle. The formula used for calculating the LCOP is:
L C O P = t = 1 n C I t + F t + V t + I t 1 + r t t = 1 n B t 1 + r t  
where C It is the initial capital investment in the year t, Ft and Vt are the fixed and variable annual expenses in the year t, It is the indirect annual expenses in the year t, Bt is the butanol generation in the year t, r is the discount rate and n is the economic life of the plant.
The method for DPBP calculation is shown in the following Equation (3)
0 = t = 1 t = D P B P C F t 1 + r t
where C Ft is the cash flow in year t. The value of DPBP is calculated by finding the zero of Equation (3).
The breakdown of levelized costs per kilogram of Butanol for the base case (1.09 $/kg) is shown in Figure 13. As can be seen, the cost of hydrous bioethanol accounts for about 65% of the LCOP since it closely related to its market price (0.50 $/kg [42]) and the yield of the process. Since the spread of anhydrous price over hydrous ethanol spot prices has been about 15% during the last decade [47,48], the levelized cost is about 9% higher (1.19 $/kg) in cases of feeding pure ethanol to the process. The cost of utilities, mainly thermal energy, accounts for 9% of the overall levelized cost, which is derived mainly from the separation of ethanol to allow recycling of ethanol–water azeotrope solution (93% wt ethanol). Fixed costs and indirect costs comprise about 9% and 11% of the levelized cost, respectively. The initial investment accounts for the smallest portion (3%) because of the relatively high production rate of butanol.

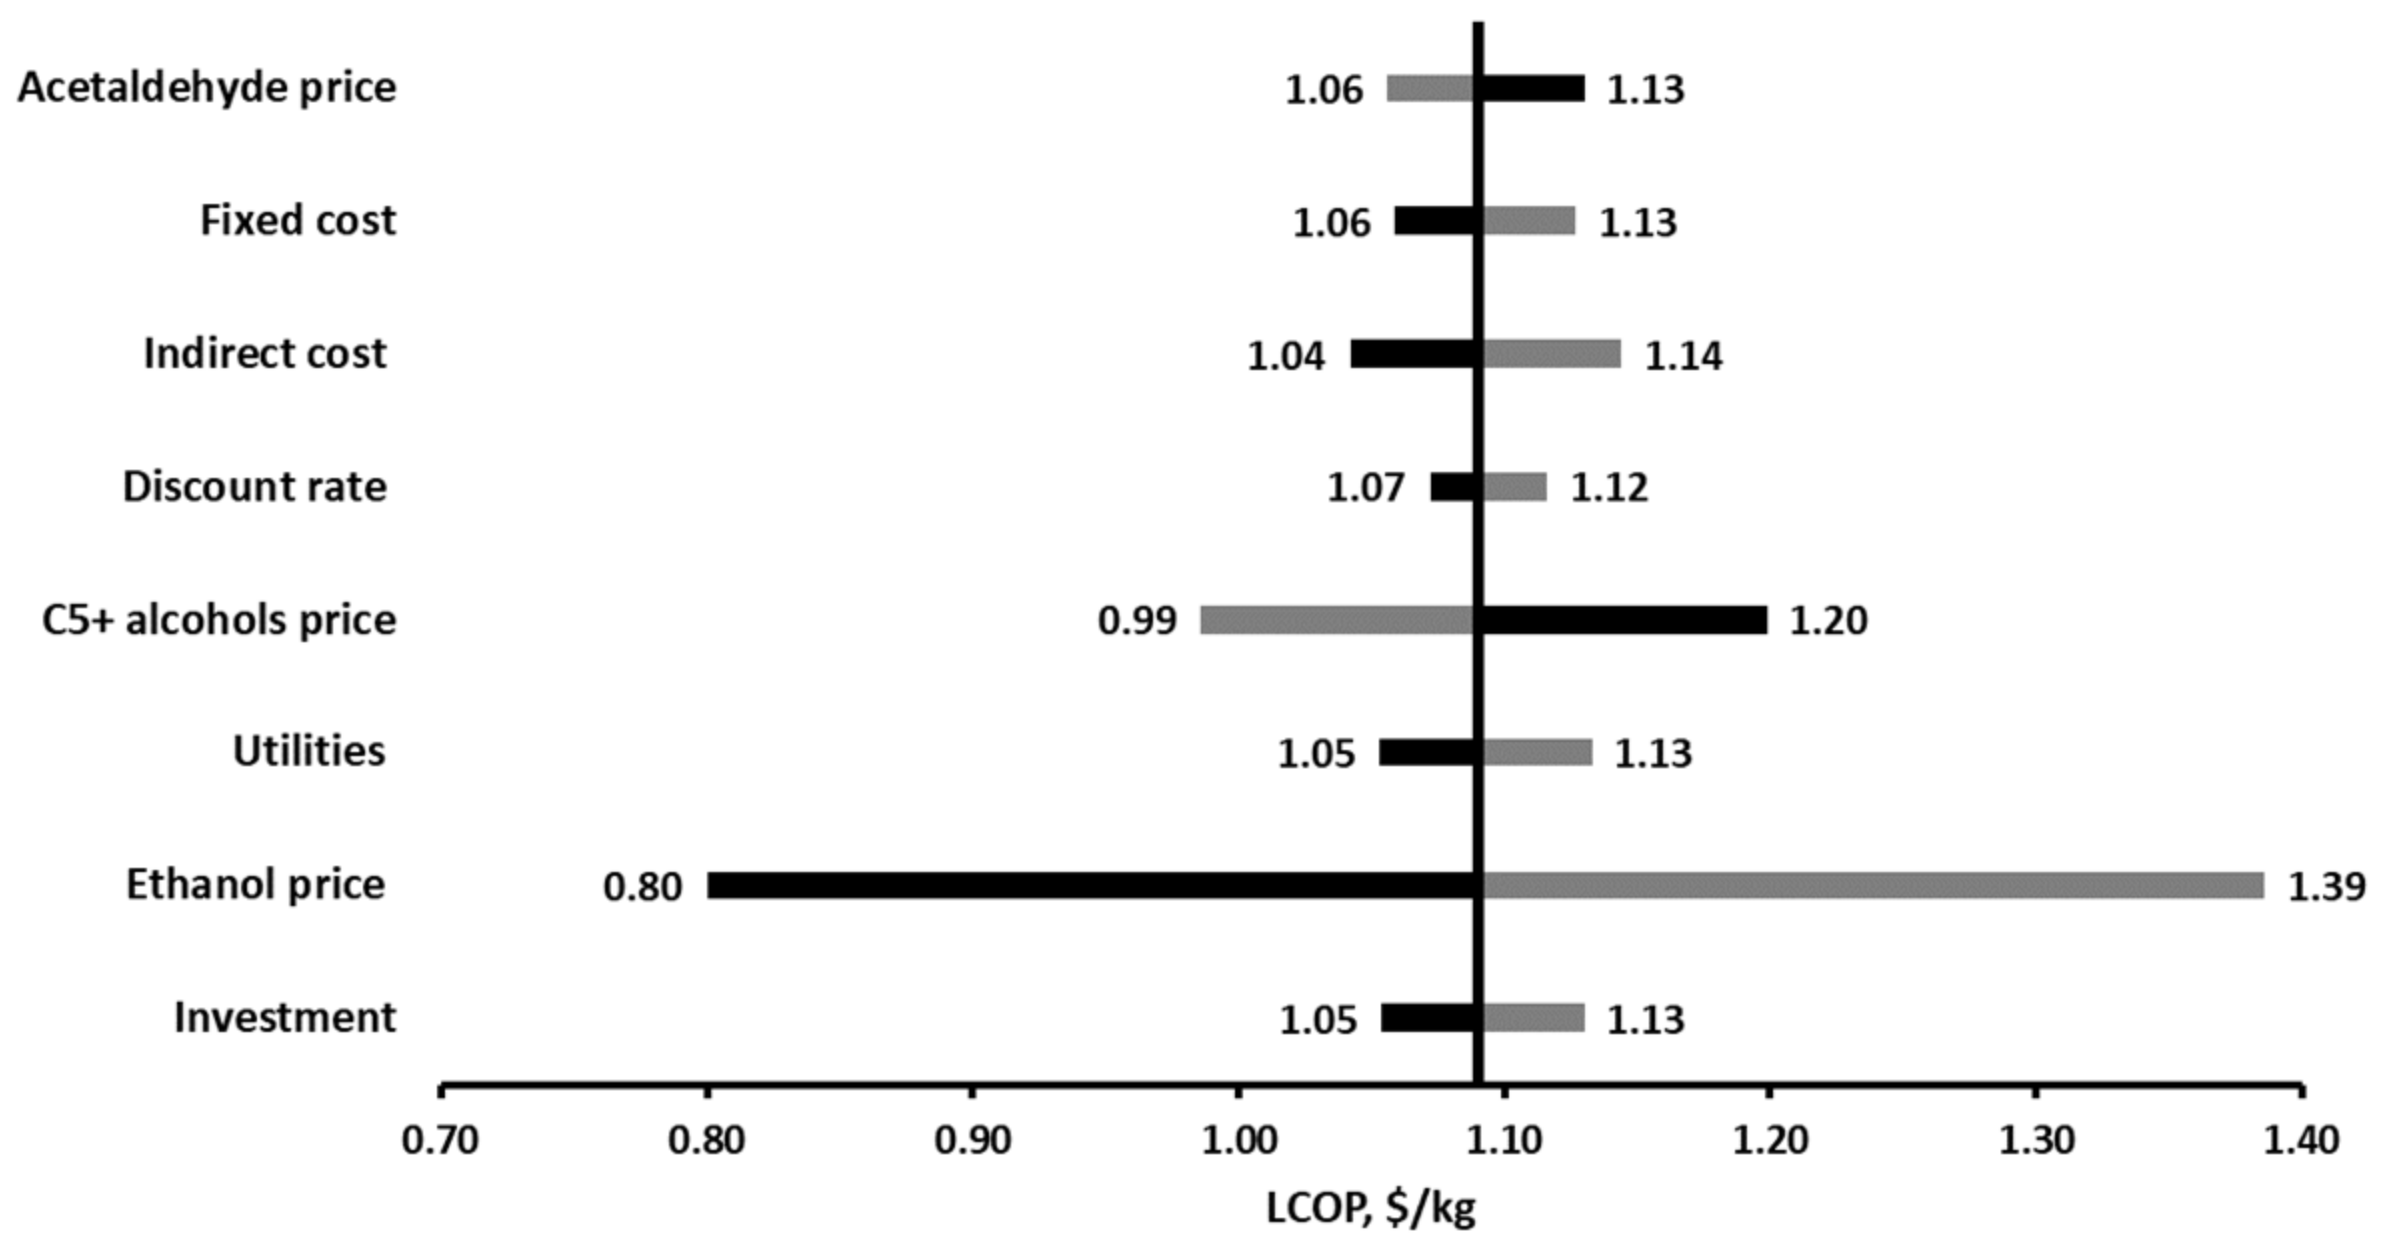
2.3.4. Sensitivity Analysis

The sensitivity analysis was implemented by considering the effect of several key parameters on the levelized cost of butanol. The parameters were varied within a range of ±30% of their initial value. The analysis results are shown in Figure 14. As expected, the LCOP is most sensitive to the Ethanol price. In cases in which that Ethanol prices would be 30% lower (across the fence prices or lower market price), the levelized cost drops to 0.80 $/kg. If the ethanol price increases by 30%, the LCOP is about 1.39 $/kg. The second important factor that increases the uncertainties in the project is the C5+ alcohols mixture selling price, since its production rate is relatively high. In cases in which C5+ alcohols mixture selling price would be 30% higher, the LCOP drops to 0.99 $kg. Lower selling price will increase the production cost to about 1.20 $/kg, 10% higher than the base case. The selling price of acetaldehyde does not affect the LCOP significantly since its generation rate is too small. The LCOP is only slightly sensitive to the initial capital investment and fixed cost (variations of ±4% from the base LCOP), indicating that an accuracy of ±30% for capital investment and fixed cost estimation is sufficient at this scale for evaluating the levelized cost. Despite the high uncertainty and possible frequent changes in the discount rate and indirect expenses, their influence on the LCOP is minor. Fluctuation in utility expenses due to changes in natural gas prices or a reduction in thermal energy requirements are not expected to affect the production cost dramatically since their share in the production cost is relatively small.

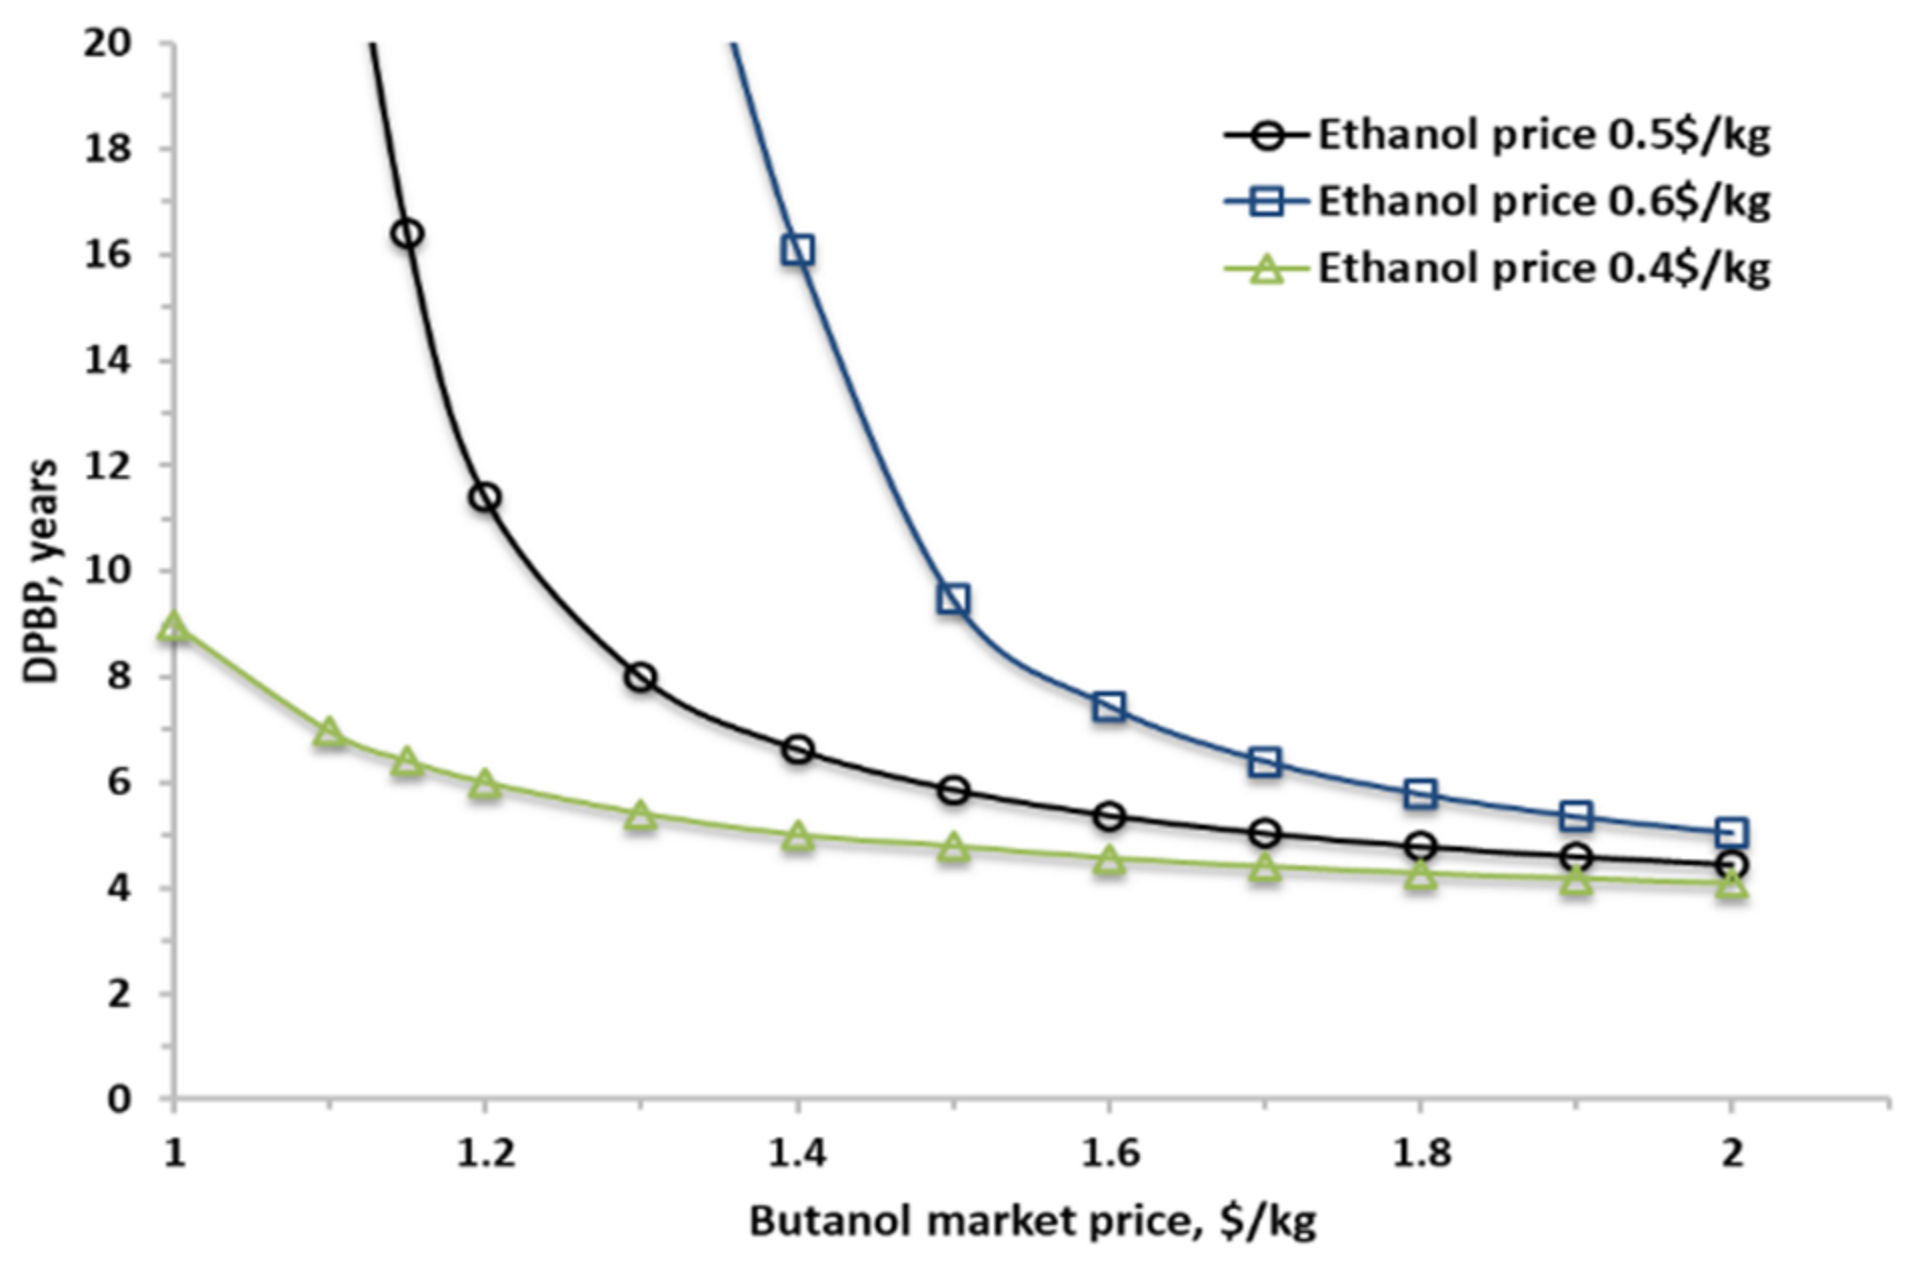
2.3.5. N-Butanol Selling Price

The market price of N-butanol tends to fluctuate wildly over time, between 1.0 $/kg and 2.0 $/kg, depending on the geographic location [45,49,50,51]. Figure 15 shows the DPBP as a function of the butanol spot price for the base scale (80,000 tonnes/y) at various ethanol prices (±20% variation from base case). It clearly shows the economic potential of this process for cases when the butanol selling price is above 1.2 $/kg, similar to its price in Europe. Below this price, the economic attractiveness of the process declines sharply unless the ethanol price drops as well. In case that the ethanol price increases by 20%, the butanol selling price should be at least above 1.5 $/kg to maintain the economic feasibility of the process at this scale.

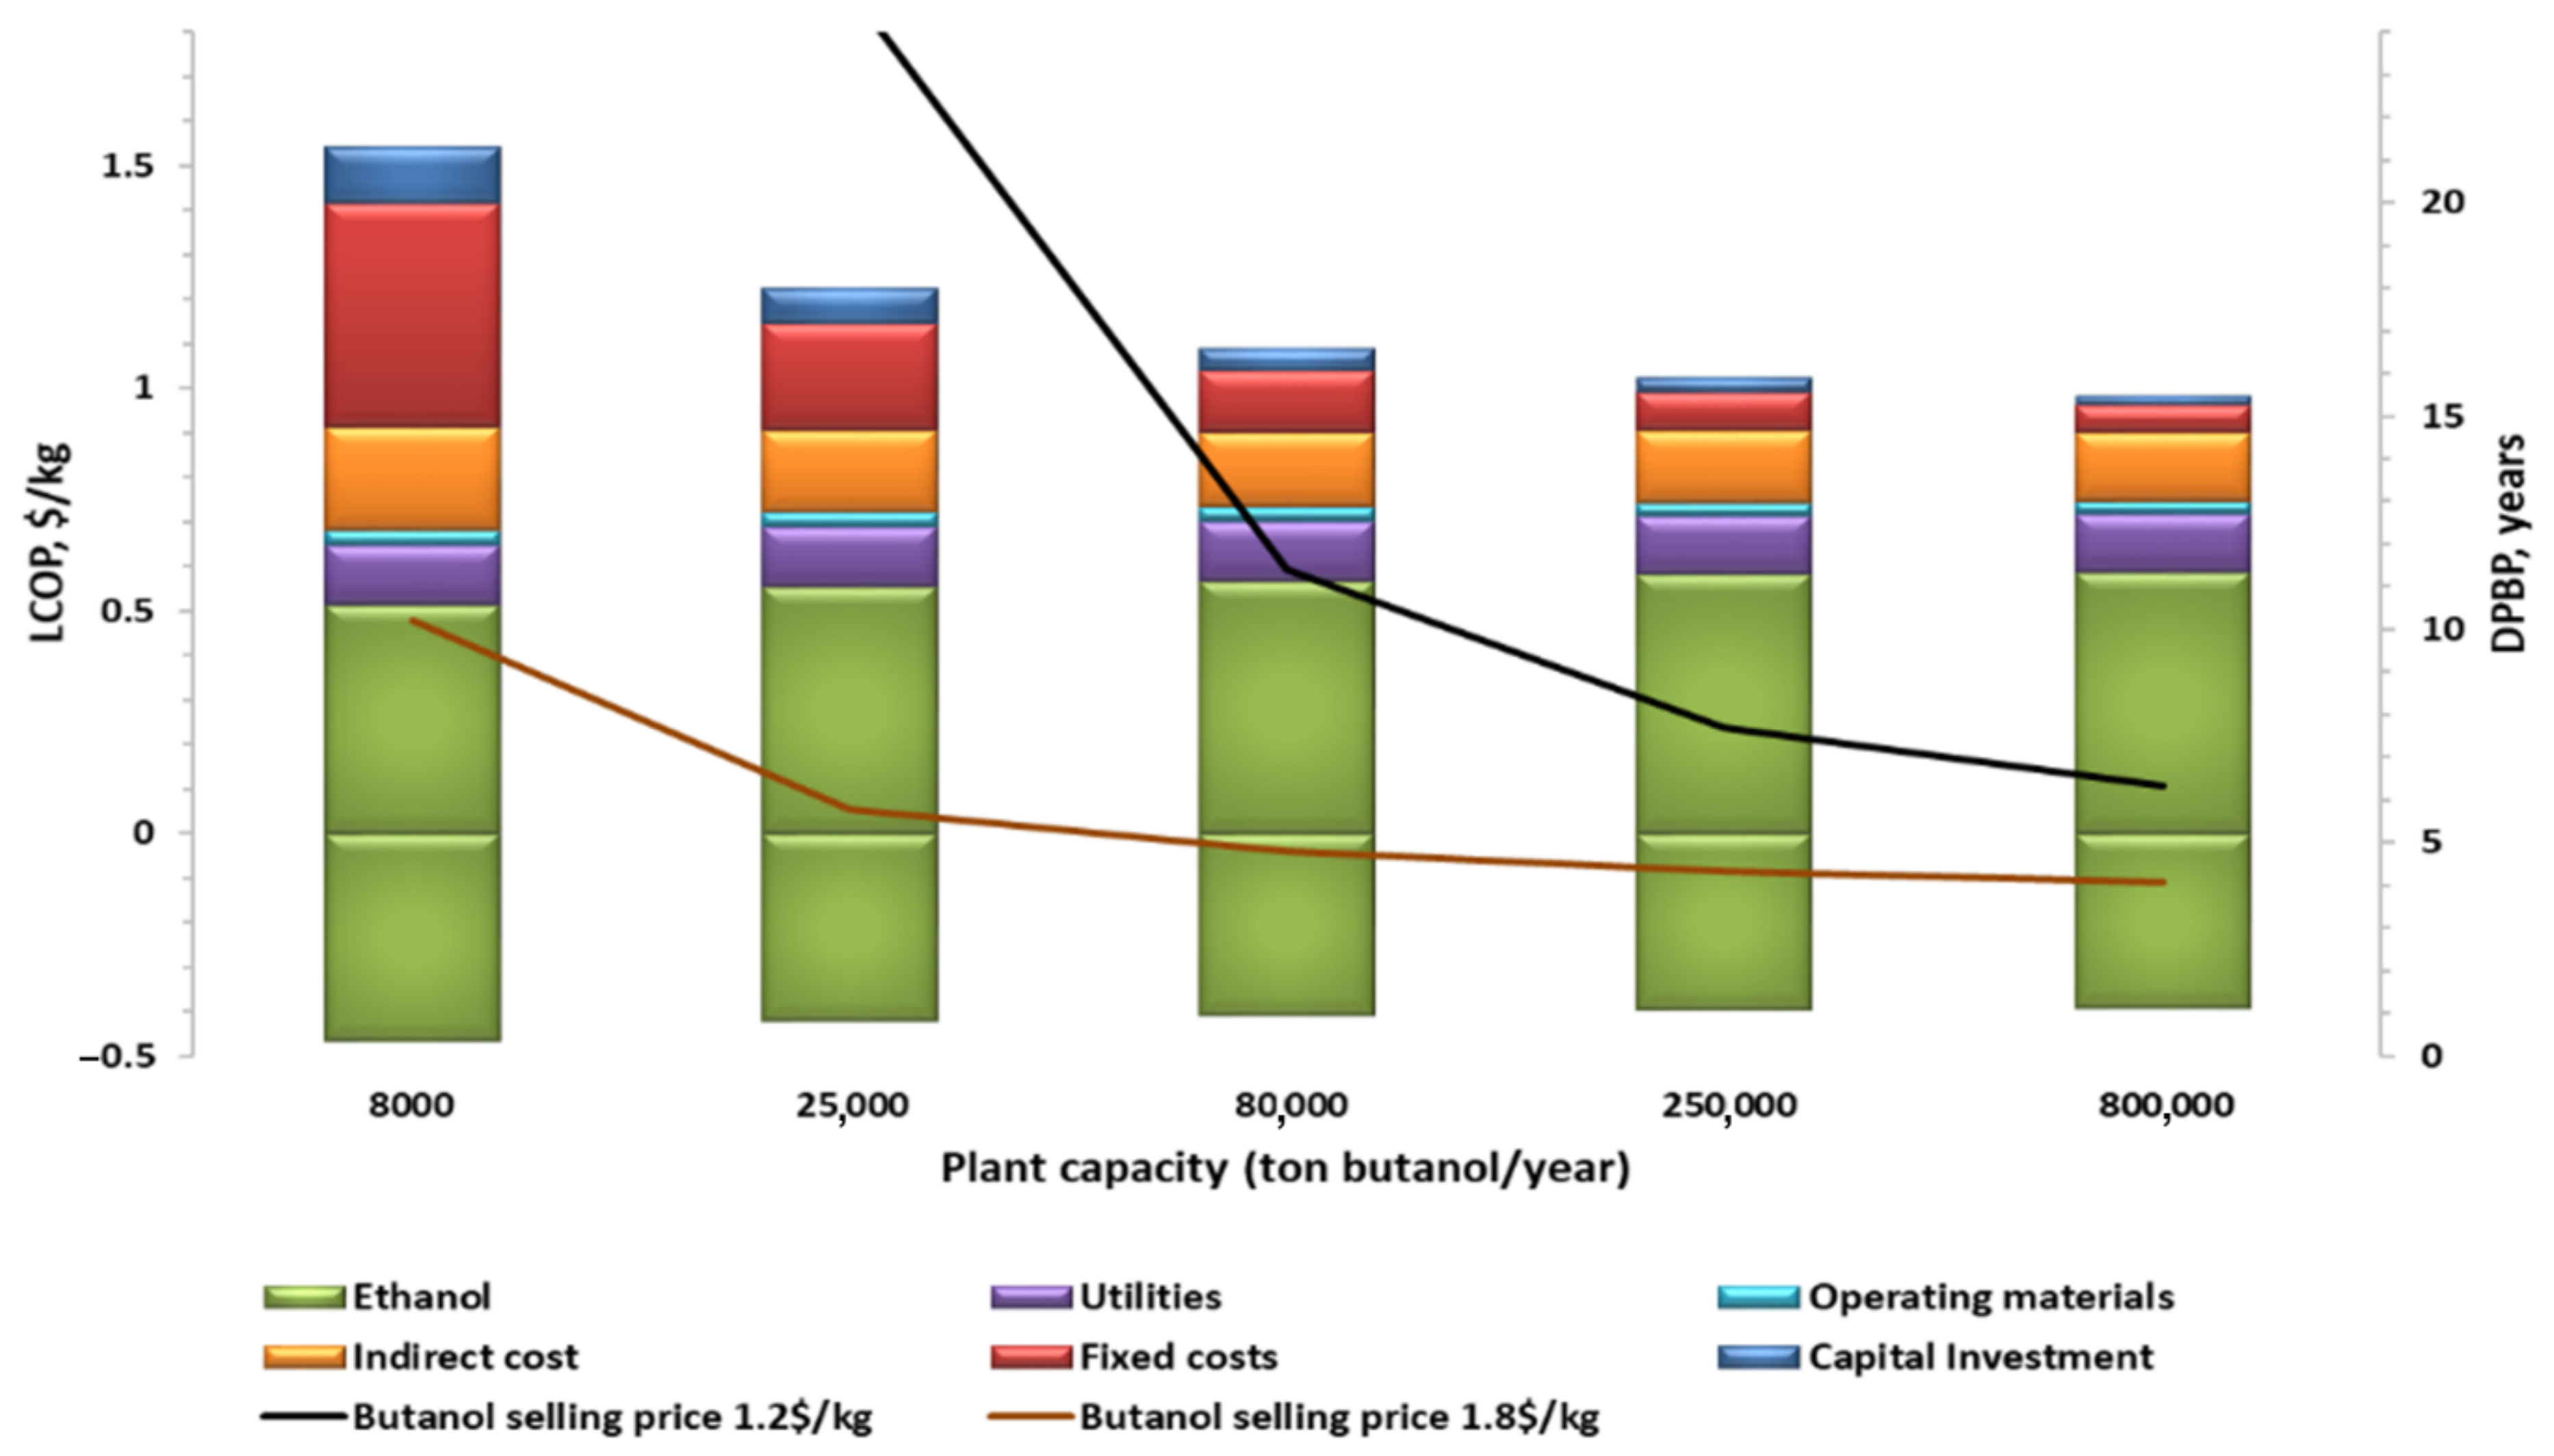
2.3.6. Impact of Plant Size

Generally, the plant capacity has vital effects on the plant economy, which is known as the ‘‘scale benefit’’. Therefore, the capacity of the proposed options is usually increased in order to decrease the capital investment on a unit product basis. Five plant capacities are evaluated, ranging from 8000 tonnes/y to 800,000 tonnes/y of N-Butanol produced per year. The six-tents factor rule [39] was applied to estimate the investment costs of the scaled-up plants as follows:
C 2 = C 1 s 2 s 1 0.6
where C1 and C2 are the costs of the base case (80,000 tonnes/y) and the scaled plant, respectively, S1 and S2 are the capacities of the base case (80,000 tonnes/y) and the scaled plant, respectively, and 0.6 is the scaling factor. The labor requirement was estimated by a correlation found in the literature [41]. Other fixed expenses are approximately 16% of the fixed capital; therefore, the same percentage was assumed in calculating the fixed costs of the scaled plants. Figure 16 shows the effect of plant capacity on the LCOP and DPBP. Further data for the Capex and Opex of all cases are presented in Table S3 in the Supplementary Information. As expected, higher output decreases the LCOP and DPBP, which again emphasises the importance of the economy of scale, which greatly benefits commercial plants. Lower plant capacity results in a higher production cost due to the large increase in fixed expenses (maintenance and labor) and capital investment, while the revenues of the plant are decreasing because of the plant small output. Therefore, investment in a plant with a capacity lower than 10 tonnes/h of butanol is unlikely when butanol prices are below 1.2 $/kg. Increasing the plant capacity to 250,000 tonnes/y of butanol (threefold bigger than the base case plant scale, representing a capacity of large-scale Ethanol plant across USA [51,52]) reduces the LCOP to 1.02 $/kg. The DPBP drops from 11.5 to 7.5 years, mainly due to the considerable reduction in fixed expenses, which derived from the lower capital investment per unit of product. However, the effect of economy of scale levels off for higher capacities (800,000 tonnes per year), where the fixed expense reductions are much smaller, while the variable expenses are almost not affected. It results in a minor reduction of only 4% in LCOP compared to the case of 250,000 tonnes/y, resulting in similar DPBP. At higher butanol market price (1.8 $/kg), similar to its current price in US, the DPBP raises as the plant capacity declines below 25,000 tonnes/y. If the plant capacity decreases below 8000 tonnes/y, the plant will not be economically feasible.

3. Materials and Methods

3.1. Preparation of Catalysts

The stoichiometric HAP (C-HAP) was prepared by co-precipitation from aqueous solutions (200 cm3 each) of Ca(NO3)2·4H2O (Acros organics, 0.5 M) and (NH4)2HPO4 (Acros organics, 0.3 M). The pH was adjusted to 10.5 by aqueous ammonia simultaneously added dropwise at stoichiometric amounts (Ca/P = 1.67) to 150 cm3 of distilled water at 80 °C [24]. The obtained suspension was stirred for 24 h at this temperature and pH with the addition of aqueous ammonia. The precipitate was separated by filtration, washed with water, dried at 120 °C overnight and calcined in air at 400 °C for 2 h. The carbonated HAP (C-HAP) was also prepared using the co-precipitation method and inserting a third solution of ammonia hydrocarbonate [34]. A quantity of 100 cm3 of aqueous solution containing NH4HCO3 (Sigma Aldrich, 0.06 M) and (NH4)2HPO4 (0.3 M) was added dropwise to 50 cm3 aqueous solution of Ca(NO3)2·4H2O (1.0 M) under stirring at 50 °C, keeping the pH at 10 by addition of aqueous ammonia. The obtained suspension was stirred for 2 h at this pH, cooled to room temperature and aged overnight. The precipitate was separated by filtration, washed with distilled water and ethanol, dried in air at 80 °C overnight and calcined in air at 600 °C for 2 h. Higher C/P ratios in C-HAP were prepared by insertion of more ammonia hydrocarbonate at co-precipitation step.
Catalysts pellets were prepared from calcined C-HAP powder mixed with bohemite (AlOOH, Disperal P2, Sasol Ltd., Johannesburg, South Africa) powder, zirconium oxide hydroxide (ZrO(OH)2, MEL Chemicals -XZO631/01) or liquid colloidal silica to yield 70 wt% C-HAP. The amount of binder was calculated on the oxides basis (SiO2, Al2O3 or ZrO2). The mixed powders were homogenized in a ball mill for 10 min and peptized with an aqueous solution of Al(NO3)3 salt (Riedel de Haen) for bohemite, diluted aqueous ammonia and polyvinyl alcohol for ZrO(OH)2 to reach the rheological characteristics suitable for its forming by extrusion. Preparation of extrudates with SiO2 binder was conducted according to procedure given in [53]. SiO2 precursor (Ludox® HS-30, Grace W.R. Co. Columbia, MD, USA) at pH = 7 (by adding 5M aqueous solution of HNO3) was mixed with C-HAP powder. The obtained mixture was kept for gelation overnight at room temperature. The gel was formed into pellets by extrusion through a die with openings diameter of 2.5 mm. After extrusion, aging at room temperature overnight, drying at 120 °C for 2 h and calcination in air at 500 °C for 2 h, all types of extrudates, 1.5 mm in diameter, were cut into pellets of 5–8 mm length.

3.2. Catalysts Characterization

The composition of the catalytic materials (EDAX method), elements mapping of catalysts pellets and SEM micrographs were measured by Quanta-200, SEM-EDAX, FEI Co. Surface area was calculated from N2 adsorption isotherms by using conventional Brunauer–Emmett–Teller (BET) method. Pore size distributions were calculated from N2-desorptiion isotherms using the conventional Barrett–Joyner–Halenda (BJH) method. Isotherms of the samples, outgassed for 2 h at 250 °C, were measured by NOVA 3200e (Quantachrome, Anton Paar QuantaTec Inc., Boynton Beach, FL, USA). Conventional wide-angle XRD patterns were measured with a Panalytical Empyrean Powder Diffractometer (Cambridge, UK) equipped with position sensitive detector X’Celerator fitted with a graphite mono- chromator, at 40 kV and 30 mA and analyzed using software developed by Crystal Logic. A SBDE ZDS (Los Angeles, CA, USA) computer search/match program coupled with the ICDD did the phase identification. The composition of crystalline catalytic materials was calculated based on their crystallographic parameters obtained by Rietveld refinement of the XRD profile through implementation of the DBWS-9807 program.
The NH3-TPD, H2O-TPD and CO2-TPD spectra were recorded on Analyzer Autochem II 2920 (Micrometrics Co., Norcross, GA, USA) equipped with mass-spectrometer (Cirrus 2, MKS, Andover, MA, USA). For NH3-TPD and CO2-TPD, a sample was treated in He flow of 25 cm3/min for 1h at 100 °C for dehydration, cooled to 40 °C and saturated for 1 h with the adsorbent (25 cm3/min of 5% CO2/ He for CO2-TPD and 5%NH3/He for NH3-TPD). Then it was heated to 100 °C under He flow and gradually (5°/min) heated to 600 °C and kept at this temperature for 1.5 h in He flow. The detected TCD signal intensity was calibrated with NH3/He and CO2/He mixtures of different compositions. The H2O-TPD spectra were recorded by heating in He-flow immediately after dehydration at 100 °C.

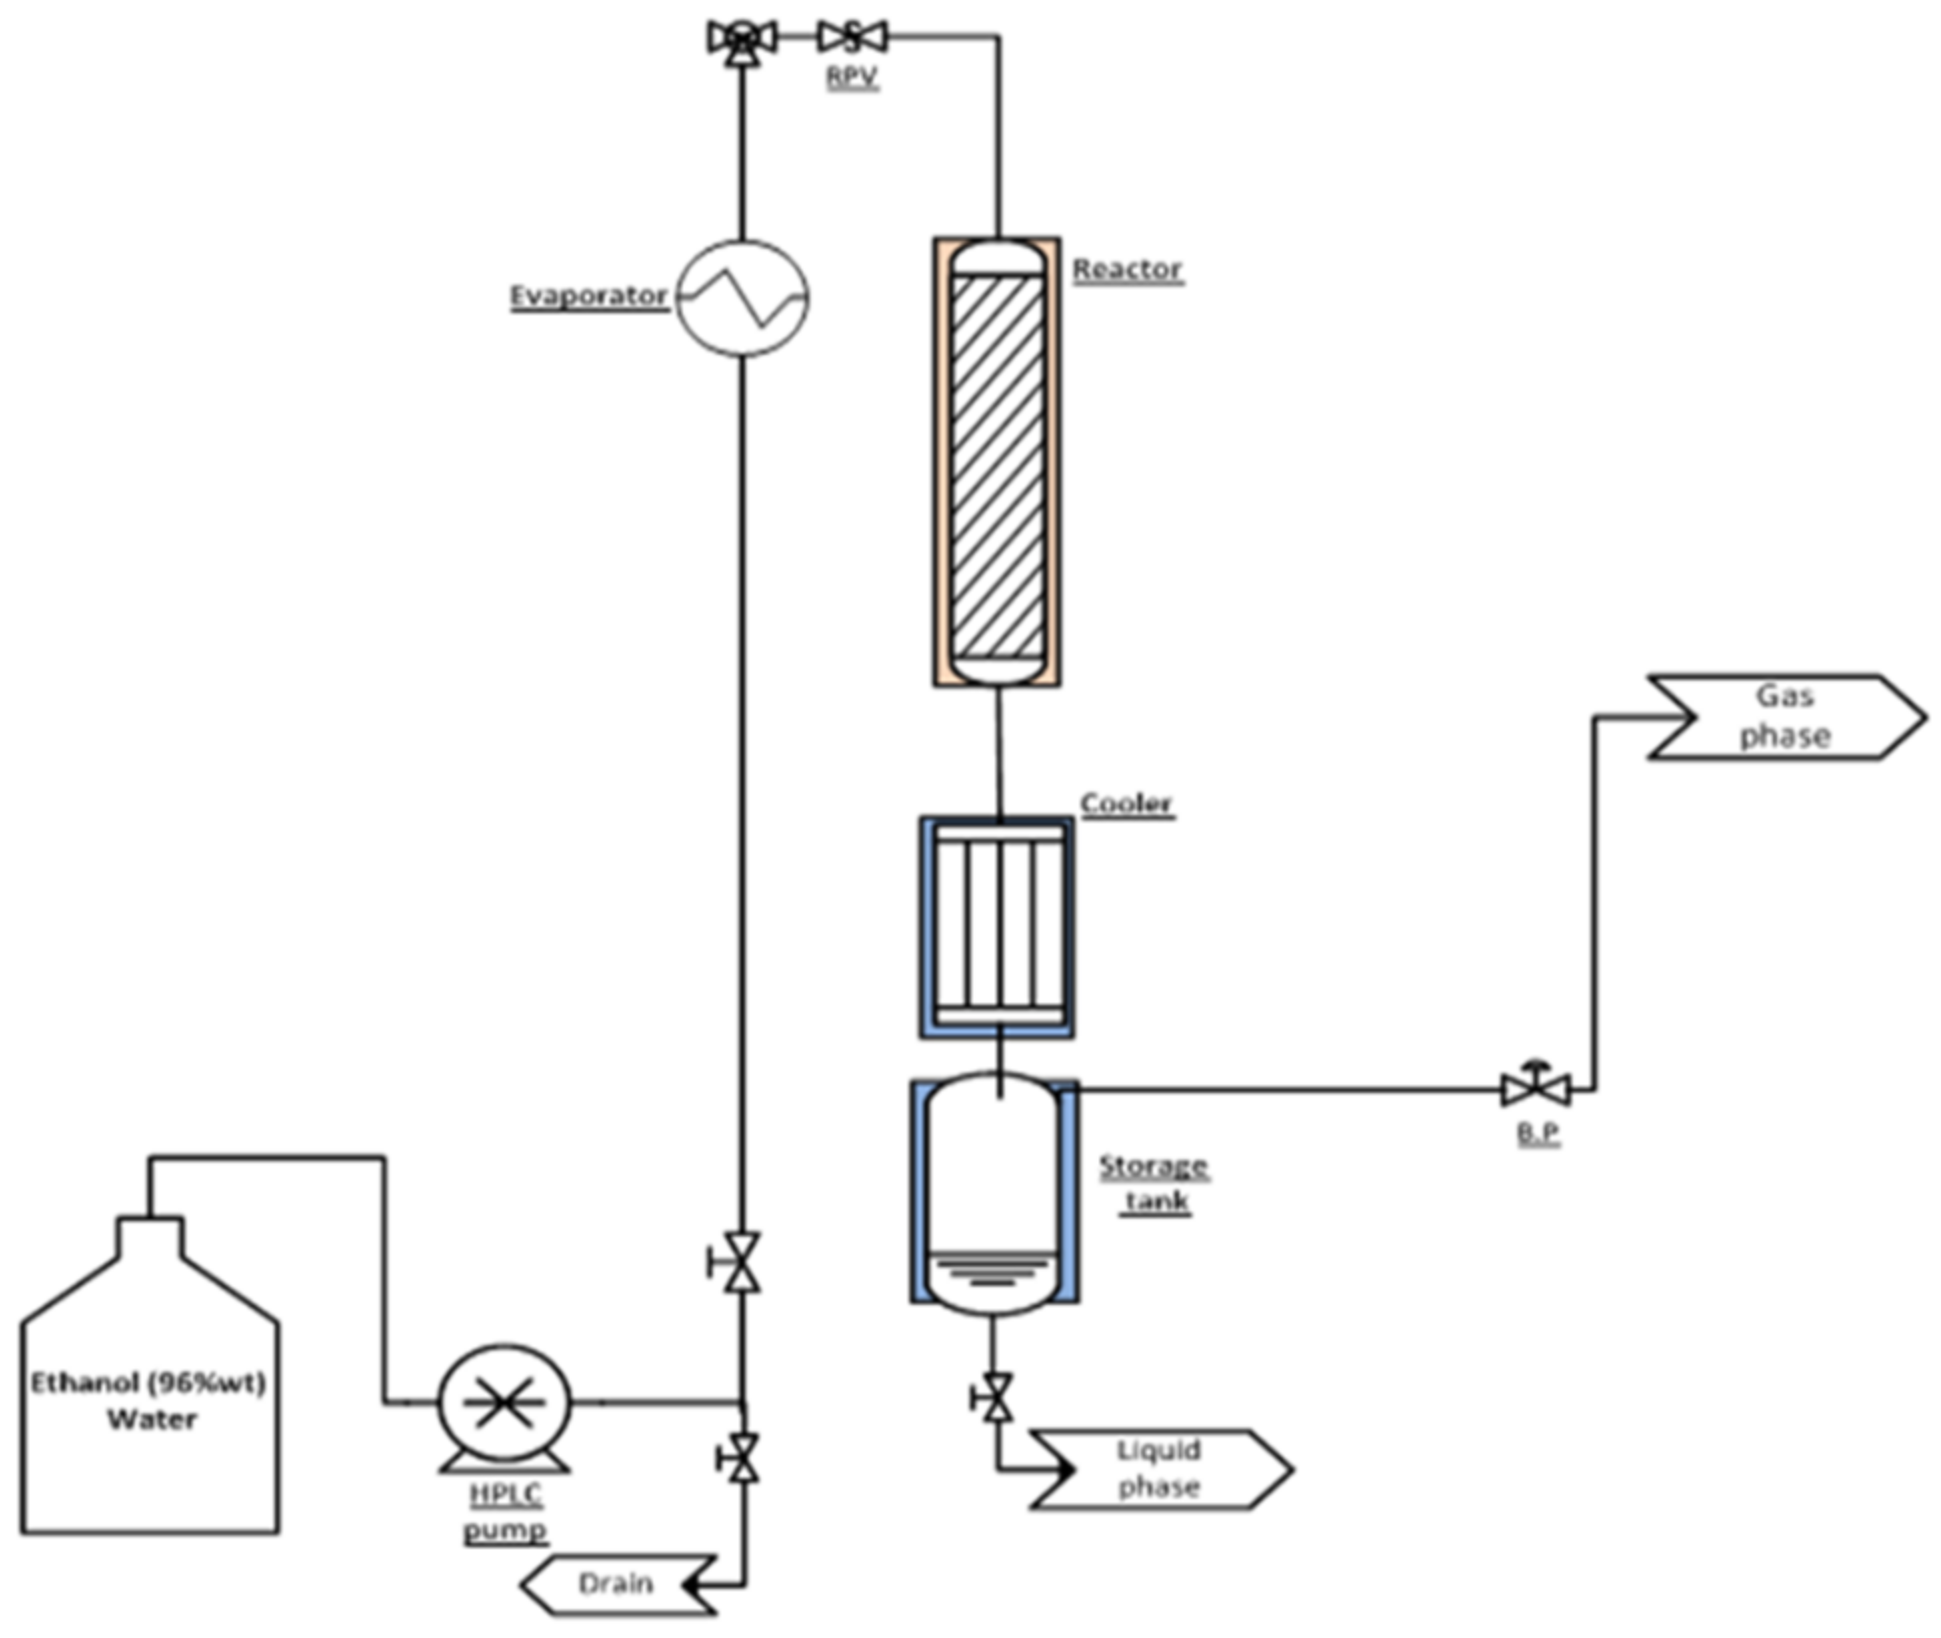
3.3. Experimental Setup and Analytical Procedures in Catalysts Testing

The catalysts testing was performed in bench and mini-pilot reactors packed with 2 and 50 cm3 catalyst, respectively. The bench reactor, 1.6 cm ID and 20 cm long reactor equipped with electric heater and axial thermowell, was loaded with 180–350 µm particles. Schematic description of the bench rig is depicted in Figure 17. The hydrous ethanol was fed by an HPLC pump (Jasco, model PU-1580, Easton, MD, USA) to an evaporator (at 250 °C) and further heated in a preheater to the reaction temperature before the reactor. WHSV (weight hourly space velocity) was modified by controlling the liquid feed rate. Condensable products were separated at 4 °C and collected in a tank.
The liquid products were analyzed by GC (Hewlett Packard, model 6890, San Diego, CA, USA), equipped with Zebron ZB column connected to FID and coupled with mass spectrometer (MS Agilent 5975C, Santa Clara, CA, USA). Gaseous C1–C6 hydrocarbons, CO2, H2 and CO concentrations were measured by GC (Agilent Technologies, model 7890A) equipped with 5 valves and 7 columns (PLOT and packed) and 2 TCD/FID detectors. The total mass balance was better than 96%.
A schematic description of the mini-pilot unit is depicted in Figure 18. It was equipped with a 300 mm long and 33.4 mm ID packed bed SS316 reactor with isothermal zone of 109 mm loaded with 1.5 mm C-HAP-SiO2 catalyst pellets. Its pictures from different viewpoints (Figure S1) and description of peripherical equipment are presented in the Supplementary Information.
The liquid products from the mini-pilot were analyzed by GC (Hewlett Packard, model 6890, San Diego, CA, USA) equipped with an HP-INNOWax capillary column (30 m × 0.25 mm id. × 0.25 μm film thickness) and interfaced directly to the MS (HP 5973) used as detector. The gaseous products were analyzed by GC (Varian CP 3800, San Diego, CA, USA) equipped with auto-sampling valves, 3 detectors (2 × TCD & 1 × FID) and several columns (2 × HAYESEP Q 80/100, HAYESEP T 80/100, Molsieve 13 × 80/100, CHROMOSORB GHP 100/120, MOLECULAR SIEVE 5A 80/100, CP-PoraPLOT U).
The ethanol conversion was calculated as:
XEtOH = (Mi EtOH − Mo EtOH)/Mi EtOH
where MiEtOH, MoEtOH are, the molar rates of ethanol at the reactor inlet (i) and outlet (o). The products (Px) yield was calculated as:
YPx = MCPx/MCiEtOH
where MCPx is the molar rate of carbon converted to the product Px; MCiEtOH—the molar rates of ethanol carbon at the reactor inlet. The products selectivity was calculated as:
SPx = YPx/XEtOH

4. Conclusions

A wide variety of solid acid–base materials were catalysts as for Guerbet condensation of anhydrous ethanol to 1-butanol. However, water in ethanol strongly inhibits their catalytic activity. We found that the insertion of carbonate ions to hydroxyapatite decreases its hydrophilicity by depressing the ability to adsorb water at reaction temperature, the main reason for the deactivation of the catalyst. The nonstoichiometric P-deficient hydroxyapatite C-HAP Ca10−x/2(PO4)6−x(CO3)x(OH)2 with depressed hydrophilicity after proper stabilization at reaction conditions is an efficient catalyst for the condensation of hydrated ethanol to 1-butanol.
Forming C-HAP powder into 1.5 mm extrudates with a silica binder did not affect its activity and selectivity, while Al2O3 and ZrO2 binders decreased the selectivity due to ethanol dehydration to ethylene. The pure C-HAP and its extrudates with silica binder yielded 21–23% of 1-butanol with 73–74% selectivity. Stable operation over 170 h on stream in the mini-pilot reactor was recorded.
The process simulation, based on the experimental data measured at the bench and mini-pilot scales, accounted for the low ethanol conversion, azeotropes and by-products, and contributed to the devising of an efficient separation process, which is vital in order to achieve an economically competitive process. The calculated mass yield in this process is 54.4%. Since the maximum theoretical yield is 80%, the proposed process yields 68.0% of that maximum. The levelized cost of butanol for a plant capacity of 80,000 tonnes/y was calculated to be 1.09 $/kg. It is most sensitive to the ethanol price. If ethanol prices change by ±30%, the levelized cost varies over the range 0.80–1.39 $/kg. The analysis of discount payback period indicates that at butanol selling price <1.2 $/kg, the economic attractiveness of the process declines sharply unless the ethanol price drops as well. In case that the ethanol price increases by 20%, the butanol selling price should be at least above 1.5 $/kg to maintain the economic feasibility of the process at this scale. Investment in a plant with a capacity lower than 10 tonnes/h of butanol is unlikely when butanol prices are below 1.2 $/kg. Increasing the plant capacity to 250,000 tonnes/y of butanol reduces the levelized cost of butanol to 1.02 $/kg. The discount payback period drops from 11.5 to 7.5 years, mainly due to the considerable reduction in fixed expenses, which is derived from the lower capital investment per unit of product.

Supplementary Materials

The following are available online at https://www.mdpi.com/article/10.3390/catal11040498/s1, Figure S1: Mini-pilot unit used for catalysts testing: a—front view; b—side view, Table S1: Summary of purchase cost for main equipment units, Table S2: Assumptions for economic model, Table S3: Economic parameters for different plant capacities.

Author Contributions

Conceptualization, M.V.L. and M.H.; methodology, M.V.L., M.H., T.H. and G.N.; validation, R.V.N. and G.N.; formal analysis, M.V.L., M.H. and G.N. investigation, R.V.N., T.H. and G.N.; data curation, M.V.L. and G.N.; writing—original draft preparation, M.V.L., M.H. and T.H.; writing—review and editing, M.V.L., M.H. and R.V.N.; visualization, R.V.N.; supervision, M.V.L. and M.H.; funding acquisition, M.V.L., M.H. and G.N. All authors have read and agreed to the published version of the manuscript.

Funding

The project WASTE2FUELS leading to this publication has received funding from the European Union’s Horizon 2020 research and innovation program (grant no 654623).

Acknowledgments

The authors are grateful to A. Erenburg for characterization of the catalysts by XRD method, to L. Ezuz for assistance in the catalysts’ preparation and to B. Porgador for help in the conducting of testing experiments at the laboratory rig.

Conflicts of Interest

The authors declare no conflict of interest.

References

  1. Gavahian, M.; Munekata, P.E.S.; Eş, I.; Lorenzo, J.M.; Mousavi, K.A.; Barba, F.J. Emerging techniques in bioethanol production: From distillation to waste valorization. Green Chem. 2019, 21, 1171–1185. [Google Scholar] [CrossRef]
  2. Robak, K.; Balcerek, M. Review of Second-Generation Bioethanol Production from Residual Biomass. Food Technol. Biotechnol. 2018, 56, 174–187. [Google Scholar] [CrossRef] [PubMed]
  3. Rosales-Calderon, O.; Arantes, V. A review on commercial-scale high-value products that can be produced alongside cellulosic ethanol. Biotechnol. Biofuels 2019, 12, 240. [Google Scholar] [CrossRef] [PubMed] [Green Version]
  4. Grim, R.G.; To, A.T.; Farberow, C.A.; Hensley, J.E.; Ruddy, D.A.; Schaidle, J.A. Growing the Bioeconomy through Catalysis: A Review of Recent Advancements in the Production of Fuels and Chemicals from Syngas-Derived Oxygenates. ACS Catal. 2019, 9, 4145–4172. [Google Scholar] [CrossRef]
  5. Global Production of Bioethanol. Available online: https://link.springer.com/chapter/10.1007/978-981-15-8779-5_10 (accessed on 9 October 2020).
  6. Stansfield, P.A.; Bisordi, A.; OudeNijeweme, D.; Williams, J.; Gold, M.; Ali, R. The performance of a modern vehicle on a variety of alcohol-gasoline fuel blends. SAE Int. J. Fuels Lubr. 2012, 5, 813–822. [Google Scholar] [CrossRef]
  7. Liu, H.; Wang, X.; Zhang, D.; Dong, F.; Liu, X.; Yang, Y.; Huang, H.; Wang, Y.; Wang, Q.; Zheng, Z. Investigation on Blending Effects of Gasoline Fuel with N-Butanol, DMF, and Ethanol on the Fuel Consumption and Harmful Emissions in a GDI Vehicle. Energies 2019, 12, 1845. [Google Scholar] [CrossRef] [Green Version]
  8. Mascal, M. Chemicals from butanol: Technologies and markets. Biofuels Bioprod. Biorefining 2012, 6, 483–0493. [Google Scholar] [CrossRef]
  9. Wu, X.; Fang, G.; Tong, Y.; Jiang, D.; Liang, Z.; Leng, W.; Liu, L.; Tu, P.; Wang, H.; Ni, J.; et al. Catalytic Upgrading of Ethanol to n-Butanol: Progress in Catalyst Development. ChemSusChem 2018, 11, 71–85. [Google Scholar] [CrossRef]
  10. Zhang, J.; Shi, K.; An, Z.; Zhu, Y.; Shu, X.; Song, H.; Xiang, X.; He, J. Acid–Base Promoted Dehydrogenation Coupling of Ethanol on Supported Ag Particles. Ind. Eng. Chem. Res. 2020, 59, 3342–3350. [Google Scholar] [CrossRef]
  11. Larina, O.V.; Valihura, K.V.; Kyriienko, P.I.; Vlasenko, N.V.; Balakin, D.Y.; Khalakhan, I.; Čendak, T.; Soloviev, S.O.; Orlyk, S.M. Successive vapour phase Guerbet condensation of ethanol and 1-butanol over Mg-Al oxide catalysts in a flow reactor. Appl. Catal. A Gen. 2019, 588, 117265. [Google Scholar] [CrossRef]
  12. Scheid, A.J.; Barbosa-Coutinho, E.; Schwaab, M.; Salau, N.P.G. Mechanism and Kinetic Modeling of Ethanol Conversion to 1-Butanol over Mg and Al Oxide Derived from Hydrotalcites. Ind. Eng. Chem. Res. 2019, 58, 12981–12995. [Google Scholar] [CrossRef]
  13. Ljpez-Olmos, C.; Virtudes Morales, M.; Guerrero-Ruiz, A.; Ramirez-Barria, C.; Asedegbega-Nieto, E.; Rodriguez-Ramos, I. Continuous Gas-Phase Condensation of Bioethanol to 1-Butanol over Bifunctional Pd/Mg and Pd/Mg–Carbon Catalysts. ChemSusChem 2018, 11, 3502–3511. [Google Scholar] [CrossRef] [PubMed]
  14. Lopez-Olmos, C.; Guerrero-Ruiz, A.; Rodríguez-Ramos, I. Optimization of Cu-Ni-Mn-catalysts for the conversion of ethanol to butanol. Catal. Today 2020, 357, 132–142. [Google Scholar] [CrossRef]
  15. Nezam, I.; Peereboom, L.; Miller, D.J. Continuous condensed-phase ethanol conversion to higher alcohols: Experimental results and techno-economic analysis. J. Clean. Prod. 2019, 209, 1365–1375. [Google Scholar] [CrossRef]
  16. Eagan, N.M.; Lanci, M.P.; Huber, G.W. Kinetic Modeling of Alcohol Oligomerization over Calcium Hydroxyapatite. ACS Catal. 2020, 10, 2978–2989. [Google Scholar] [CrossRef]
  17. Marcu, I.-C.; Tichit, D.; Fajula, F.; Tanchoux, N. Catalytic valorization of bioethanol over Cu-Mg-Al mixed oxide catalysts. Catal. Today 2009, 147, 231–238. [Google Scholar] [CrossRef]
  18. Petrolini, D.D.; Eagan, N.; Ball, M.R.; Burt, S.P.; Hermans, I.; Huber, G.W.; Dumesic, J.A.; Martins, L. Ethanol condensation at elevated pressure over copper on AlMgO and AlCaO porous mixed oxide supports. Catal. Sci. Technol. 2019, 9, 2032–2042. [Google Scholar] [CrossRef]
  19. Hanspal, S.; Young, Z.D.; Prillaman, J.T.; Davis, R.J. Influence of surface acid and base sites on the Guerbet coupling of ethanol to butanol over metal phosphate catalysts. J. Catal. 2017, 352, 182–190. [Google Scholar] [CrossRef]
  20. Corno, M.; Busco, C.; Bolis, V.; Tosoni, S.; Ugliengo, P. Water Adsorption on the Stoichiometric (001) and (010) Surfaces of Hydroxyapatite: A Periodic B3LYP Study. Langmuir 2009, 25, 2188–2198. [Google Scholar] [CrossRef]
  21. Bolis, V.; Busco, C.; Gianmario, M.; Bertinetti, L.; Sakhno, Y.; Ugliengo, P.; Chiatti, F.; Corno, M.; Roveri, N. Coordination chemistry of Ca sites at the surface of nanosized hydroxyapatite: Interaction with H2O and CO. Philos. Trans. R. Soc. A 2012, 370, 1313–13236. [Google Scholar] [CrossRef] [Green Version]
  22. Diallo-Garcia, S.; Osman, M.B.; Krafft, J.-M.; Casale, S.; Thomas, C.; Kubo, J.; Costentin, G. Identification of Surface Basic Sites and Acid−Base Pairs of Hydroxyapatite. J. Phys. Chem. C 2014, 118, 12744–12757. [Google Scholar] [CrossRef]
  23. Fubini, B.; Bolis, V.; Bailes, M.; Stone, F.S. The reactivity of oxides with water vapor. Solid State Ion. 1989, 32–33, 258–272. [Google Scholar] [CrossRef]
  24. Hanspal, S.; Young, Z.D.; Shou, H.; Davis, R.J. Multiproduct Steady-State Isotopic Transient Kinetic Analysis of the Ethanol Coupling Reaction over Hydroxyapatite and Magnesia. ACS Catal. 2015, 5, 1737–1746. [Google Scholar] [CrossRef]
  25. Osman, M.B.; Krafft, J.-M.; Thomas, C.; Yoshioka, T.; Kubo, J.; Costentin, G. Importance of the Nature of the Active Acid/Base Pairs of Hydroxyapatite Involved in the Catalytic Transformation of Ethanol to n-Butanol Revealed by Operando DRIFTS. ChemCatChem 2019, 11, 1765–1778. [Google Scholar] [CrossRef]
  26. Silvester, L.; Lamonier, J.-F.; Faye, J.; Capron, M.; Vannier, R.-N.; Lamonier, C.; Dubois, J.-L.; Couturier, J.-L.; Calais, C.; Dumeignil, F. Reactivity of ethanol over hydroxyapatite-based Ca-enriched catalysts with various carbonate contents. Catal. Sci. Technol. 2015, 5, 2994–3006. [Google Scholar] [CrossRef]
  27. Fagan, P.J.; Calvarese, T.G.; Davis, R.J.; Ozer, R. Conversion of Ethanol to a Reaction Product Comprising 1-Butanol Using Hydroxyapatite Catalysts. U.S. Patent 8.962.896 B2, 24 February 2015. [Google Scholar]
  28. Tsuchida, T.; Sakuma, S.; Takeguchi, T.; Ueda, W. Direct Synthesis of n-Butanol from Ethanol over Nonstoichiometric Hydroxyapatite. Ind. Eng. Chem. Res. 2006, 45, 8634–8642. [Google Scholar] [CrossRef]
  29. Gounder, R. Hydrophobic microporous and mesoporous oxides as Brønsted and Lewis acid catalysts for biomass conversion in liquid water. Catal. Sci. Technol. 2014, 4, 2877–2886. [Google Scholar] [CrossRef]
  30. Elliott, J.C. Structure and Chemistry of the Apatites and Other Calcium Orthophosphates; Elsevier: Amsterdam, The Netherlands, 1994. [Google Scholar]
  31. Resende, N.S.; Nele, M.; Salim, V.M.M. Effects of anion substitution on the acid properties of hydroxdyapatite. Thermochim. Acta 2006, 451, 16–21. [Google Scholar] [CrossRef]
  32. Landi, E.; Celotti, G.; Logroscino, G.; Tampieri, A. Carbonated hydroxyapatite as bone substitute. J. Eur. Ceram. Soc. 2003, 23, 2931–2937. [Google Scholar] [CrossRef]
  33. Kozlowski, J.T.; Davis, R.J. Heterogeneous catalysts for the Guerbet coupling of alcohols. ACS Catal. 2013, 3, 1588–1600. [Google Scholar] [CrossRef]
  34. Lovon-Quintana, J.J.; Rodrigues-Guerrero, J.K.; Valenca, P.G. Carbonate hydroxyapatite as a catalyst for ethanol conversion to hydrocarbon fuels. Appl. Catal. A 2017, 542, 136–145. [Google Scholar] [CrossRef]
  35. Ohayon Dahan, H.; Landau, M.V.; Herskowitz, M. Effect of surface acidity-basicity balance in modified ZnxZryOz catalyst on its performance in the conversion of hydrous ethanol to hydrocarbons. J. Ind. Eng. Chem. 2021, 95, 156–169. [Google Scholar] [CrossRef]
  36. Zhang, M.; Yu, Y. Dehydration of ethanol to ethylene. Ind. Eng. Chem. Res. 2013, 52, 9505–9514. [Google Scholar] [CrossRef]
  37. Vlasenko, N.V.; Kyriienko, P.I.; Valihura, K.V.; Yanushevska, O.I.; Soloviev, S.O.; Strizhak, P.E. Effect of modifying additives on the catalytic properties of zirconium dioxide in the conversion of ethanol to 1-butanol. Theor. Exp. Chem. 2019, 55, 43–49. [Google Scholar] [CrossRef]
  38. Michaels, W.; Zhang, H.; Luyben, W.L.; Baltrusaitis, J. Design of a separation section in an ethanol-to-butanol process. Biomass Bioenergy 2018, 109, 231–238. [Google Scholar] [CrossRef]
  39. Sinnott, R. Chemical Engineering Design: Chemical Engineering; Elsevier: Amsterdam, The Netherlands, 2005; Volume 6. [Google Scholar]
  40. Sinnott, R.; Towler, G. Principles, Practice and Economics of Plant and Process Design, Chemical Engineering Design; Elsevier: Amsterdam, The Netherlands, 2008. [Google Scholar]
  41. Peters, M.S.; Timmerhaus, K.D.; West, R.E. Plant Design and Economics for Chemical Engineers; McGraw-Hill: New York, NY, USA, 2003. [Google Scholar]
  42. Grim, R.G.; Huang, Z.; Guarnieri, M.T.; Ferrell, J.R.; Tao, L.; Schaidle, J.A. Transforming the carbon economy: Challenges and opportunities in the convergence of low-cost electricity and reductive CO2 utilization. Energy Environ. Sci. 2020, 13, 472–494. [Google Scholar] [CrossRef]
  43. EIA. Natural Gas Prices. 2020. Available online: https://www.eia.gov/dnav/ng/ng_pri_sum_dcu_nus_a.htm (accessed on 30 June 2020).
  44. ICIS. Americas Chemicals Outlook; Reed Business Information Ltd.: London, UK, 2019. [Google Scholar]
  45. US Grains Council. Ethanol Market and Pricing Data; US Grains Council: Washington, DC, USA, 2019. [Google Scholar]
  46. ICIS. Indicative Chemicals Prices A-Z. 2020. Available online: https://www.icis.com/explore/chemicals/channel-info-chemicals-a-z/ (accessed on 30 June 2020).
  47. Madhu, K.; Zilberman, D. Handbook of Bioenergy Economics and Policy: Volume II; Springer: Berlin/Heidelberg, Germany, 2017. [Google Scholar]
  48. ICIS. Europe Chemicals Outlook; Reed Business Information Ltd.: London, UK, 2019. [Google Scholar]
  49. ICIS. Asia Chemicals Outlook; Reed Business Information Ltd.: London, UK, 2019. [Google Scholar]
  50. Tecnon OrbiChem, Chemical Market Insight and Foresight—On a Single Page: N-Butanol. 2013. Available online: http://www.orbichem.com/userfiles/CNFSamples/act_13_11.pdf (accessed on 30 June 2020).
  51. Renewable Fuels Association. 2019 Ethanol Industry Outlook. 2019. Available online: https://ethanolrfa.org/wp-content/uploads/2019/02/RFA2019Outlook.pdf (accessed on 30 June 2020).
  52. BBI International. Fuel Ethanol Industry Directory, 19th ed.; BBI International: Grand Forks, ND, USA, 2019. [Google Scholar]
  53. Herskowitz, M.; Landau, M.V.; Vidruk, R.; Amoyal, M. Catalyst Composition and Catalytic Process for Producing Liquid Hydrocarbons. U.S. Patent 10,589,257, 17 March 2020. [Google Scholar]
Scheme 1. Scheme of ethanol to butanol Guerbet reaction [9].
Catalysts 11 00498 sch001
Figure 1. Partial replacement of (PO4)3− anions with (CO3)2− in hydroxyapatite.
Catalysts 11 00498 g001
Figure 2. Characterization of C-HAP material: (a) XRD patterns, (b) EDAX spectra.
Catalysts 11 00498 g002
Figure 3. SEM micrographs of C-HAP material recorded at different magnifications.
Catalysts 11 00498 g003
Figure 4. Characteristics of N2-adsorption measured with C-HAP powder material: (a) N2-adsorption–desorption isotherms; (b) pore size distribution.
Catalysts 11 00498 g004
Figure 5. H2O-TPD (Thermo-Programmed Desorption) spectra of HAP and C-HAP materials.
Catalysts 11 00498 g005
Figure 6. NH3- and CO2-TPD spectra recorded with HAP and C-HAP materials.
Catalysts 11 00498 g006
Figure 7. SEM micrograph of the cross section of C-HAP-SiO2 extrudate (a) and its Ca- (b) and P- (c) mapping.
Catalysts 11 00498 g007
Figure 8. Effect of water in ethanol feed on the performance of C-HAP catalyst: A—anhydrous ethanol; B—hydrous ethanol; T = 400 °C, WHSV = 0.8 h−1, time on stream (TOS) = 24 h. X—ethanol conversion; S—butanol selectivity and Y—butanol yield.
Catalysts 11 00498 g008
Figure 9. Effect of ethanol conversion on 1-butanol selectivity and yield measured with C-HAP catalyst at 400 °C and WHSV 0.2–6 h1.
Catalysts 11 00498 g009
Figure 10. Ethanol conversion and 1-butanol yield measured with C-HAP-30% SiO2; T = 400 °C, WHSV = 0.8 h−1.
Catalysts 11 00498 g010
Figure 11. N2-adsorption and desorption isotherms (a) and pore size distributions (b), recorded before and after testing in the conversion of hydrous ethanol to 1-butanol.
Catalysts 11 00498 g011
Figure 12. Schematic description of the process for production of 1-butanol from hydrous bioethanol.
Catalysts 11 00498 g012
Figure 13. Levelized production cost breakdown.
Catalysts 11 00498 g013
Figure 14. Sensitivity LCOP for selected technical and economic parameters.
Catalysts 11 00498 g014
Figure 15. Discount payback period for various butanol and ethanol prices for a plant with a capacity of 80,000 tonnes/y of butanol.
Catalysts 11 00498 g015
Figure 16. LCOP and DPBP for various plant capacities.
Catalysts 11 00498 g016
Figure 17. Schematic description of the bench rig.
Catalysts 11 00498 g017
Figure 18. Schematic description of the mini-pilot unit. Streams: 1a, 1b—liquid hydrous ethanol; 2—evaporated hydrous ethanol; 3—preheated hydrous ethanol (reactor inlet); 4—products streams (reactor outlet); 5—gaseous products; 6—condensed products.
Catalysts 11 00498 g018
Table 1. Texture parameters of as-synthesized HAP and C-HAP materials.
CatalystSurface Area, m2/gPore Volume, cm3/gAverage Pore Diameter, nm
C-HAP570.19214
HAP490.34828
Table 2. Texture characteristics of C-HAP extrudates formed with different binders.
CatalystTexture Parameters
Surface Area,
m2/g
Pore Volume,
cm3/g
Average Pore Diameter,
nm
C-HAP-SiO2770.37719
C-HAP-ZrO2351.1894
C-HAP-Al2O3960.4919
Table 3. Comparative testing of C-HAP catalyst pellets prepared by co-extrusion with different binding materials. Temperature = 400 °C, WHSV = 0.8 h−1, TOS = 24 h.
Binding
Material
Testing Results of C-HAP Catalyst Pellets
EtOH Conversion, %1-BuOH Selectivity, %1-BuOH Yield, %
SiO227.572.219.8
Al2O349.212.56.1
ZrO256.126.314.5
Table 4. Texture parameters of C-HAP-30%SiO2 pellets before and after testing in the conversion of hydrous ethanol to 1-butanol.
CatalystSurface Area, m2/gPore Volume, cm3/gAverage Pore Diameter, nm
C-HAP-30%SiO2 pellets as prepared770.37719
C-HAP-30%SiO2 pellets after testing: TOS = 150 h650.35722
Table 5. Results of testing experiments conducted with hydrous ethanol in a mini-pilot rig packed with C-HAP-30% SiO2.
WHSV, h−1;
TOS, h
Feed, g/hProducts Out, g/hPerformance, %
EtOHH2OEtOHBuOHH2O *AcetaldehydeHeavier AlcoholsH2EtOH Conversion1-BuOH Selectivity1-BuOH Yield
0.5; 2431.21.321.75.83.00.71.60.0330.574.422.7
1.0; 2462.42.644.410.65.81.03.40.0428.873.221.1
2.8; 24174.77.3133.222.114.64.08.20.0223.766.615.8
4.0; 9825010.4202.924.018.15.29.80.0218.863.311.9
* including water in feed.
Table 6. Mass rates of all streams and components.
Stream No.1234567
NameFresh feedReactor InletReactor OutletTail GasD-01 InletAlcoholsBuOH
Temperature, °C254004354040122118
Total Mass rate, kg/h19,135.067,351.867,351.8242.467,109.412,853.510,010.0
Ethanol rate, kg/h18,369.563,211.145,074.9140.844,934.1--
Butanol rate, kg/h--10,678.95.410,673.510,033.110,000.0
Water rate, kg/h765.54032.77622.219.47602.81.31.3
Acetaldehyde rate, kg/h-108.01110.830.91079.9--
Hydrogen rate, kg/h--45.945.9---
C5+ alcohols--2819.10.02819.12819.18.7
Stream No.8910111213
NameHigh alcoholsD-03 InletAcetaldehydeD-04 InletAqueousRecycle stream
Temperature, °C15777419711096
Total Mass rate, kg/h2843.554,255.9974.853,281.15064.348,216.8
Ethanol rate, kg/h-44,934.12.644,931.589.944,841.6
Butanol rate, kg/h33.1640.4-640.4640.4-
Water rate, kg/h-7601.50.37601.24334.03267.2
Acetaldehyde rate, kg/h-1079.9971.9108.0-108.0
Hydrogen rate, kg/h------
C5+ alcohols2810.4-----
Table 7. Ratio factors for direct and indirect capital investment.
ItemFactorCost, $K
Purchased Equipment Cost 5829
Equipment erection0.402332
Piping0.704080
Buildings and site development0.603497
Electrical0.201166
Instruments and control0.301749
Storages0.15874
Total Direct Plant Cost3.3519,527
Contractor’s fee0.05976
Design and Engineering0.305858
Contingency allowance0.101953
Capex4.8628,314
Working capital a 2831
Total Capital Investment (TCI) 31,146
a Plant start-up; 10% of Fixed capital.
Table 8. Cost of utilities and materials.
Utility/MaterialCostUnitsQuantity, tonne/yearUnitsCost $K/yearRef.
Cooling water0.03$/tonne51,840,000tonne/year1555[40]
Electricity0.06$/kWh2400MWh/year144[42]
Thermal energy3.9$/MMBTU c2,240,000MMBTU/year8736[43]
Hydrous Ethanol500$/tonne153,080tonne/year76,540[44,45]
Waste water treatment2$/tonne40,520tonne/year81[40]
Acetaldehyde1000$/tonne7800tonne/year7800[46]
C5+ alcohol mixture1000 a$/tonne22,552tonne/year22,552-
Mg catalyst30,000 a$/tonne68 btonne/year2040-
a Own assumption. b Catalyst replacement every one year was assumed. c 1 million BTU.
Table 9. Annual operational expenses for production of 80,000 tonnes/year.
Fixed Expenses$K
Maintenance a2265
Operating labour b1200
Laboratory costs c300
Supervision d300
Plant overheads e600
Capital charges f1133
Local taxes g566
Insurance h566
Total fixed expenses6930
Variable expenses
Hydrous Ethanol76,540
Catalyst& Operating materials i2351
Utilities 10,516
Acetaldehyde credit−7800
C5+ alcohols credit−22,552
Total Variable expenses59,056
Total direct costs65,986
Indirect costs j13,197
Annual production expenses79,183
a Eight percent of fixed capital. Includes: cost of labor and the materials needed for the maintenance. b Four operators/shift*5 shifts*60,000$. c Twenty-five percent of operating labor. d Twenty-five percent of operating labor. e Fifty percent of operating labor. Includes: general management, general clerical staff and safety. f Four percent of fixed capital. Interest payments due on any debt or loans used to finance the project. g Two percent of fixed capital. h Two percent of fixed capital. i Catalyst cost and 10% of maintenance expenses. Includes: safety clothing, accessories. j Twenty percent of direct costs. Includes: sales expenses, overheads and contingency.
Publisher’s Note: MDPI stays neutral with regard to jurisdictional claims in published maps and institutional affiliations.

