Article

Insight into Active Centers and Anti-Coke Behavior of Niobium-Containing SBA-15 for Glycerol Dehydration

Department of Heterogeneous Catalysis, Faculty of Chemistry, Adam Mickiewicz University, ul. Uniwersytetu Poznanskiego 8, 61-614 Poznan, Poland
*
Author to whom correspondence should be addressed.
Catalysts 2021, 11(4), 488; https://doi.org/10.3390/catal11040488
Submission received: 24 March 2021 / Revised: 7 April 2021 / Accepted: 8 April 2021 / Published: 11 April 2021

Abstract

:
Niobium containing SBA-15 was prepared by two methods: impregnation with different amounts of ammonium niobate(V) oxalate (Nb-15/SBA-15 and Nb-25/SBA-15 containing 15 wt.% and 25 wt.% of Nb, respectively) and mixing of mesoporous silica with Nb2O5 followed by heating at 500 °C (Nb2O5/SBA-15). The use of these two procedures allowed obtaining materials with different textural/surface properties determined by N2 adsorption/desorption isotherms, XRD, UV-Vis, pyridine, and NO adsorption combined with FTIR spectroscopy. Nb2O5/SBA-15 contained exclusively crystalline Nb2O5 on the SBA-15 surface, whereas the materials prepared by impregnation had both metal oxide and niobium incorporated into the silica matrix. The niobium species localized in silica framework generated Brønsted (BAS) and Lewis (LAS) acid sites. The inclusion of niobium into SBA-15 skeleton was crucial for the achievement of high catalytic performance. The strongest BAS were on Nb-25/SBA-15, whereas the highest concentration of BAS and LAS was on Nb-15/SBA-15 surface. Nb2O5/SBA-15 material possessed only weak LAS and BAS. The presence of the strongest BAS (Nb-25/SBA-15) resulted in the highest dehydration activity, whereas a high concentration of BAS was unfavorable. Silylation of niobium catalysts prepared by impregnation reduced the number of acidic sites and significantly increased acrolein yield and selectivity (from ca. 43% selectivity for Nb-25/SBA-15 to ca. 61% for silylated sample). This was accompanied by a considerable decrease in coke formation (from 47% selectivity for Nb-25/SBA-15 to 27% for silylated material).

Graphical Abstract

1. Introduction

The paths to sustainable development lead, inter alia, to the processing of raw materials from renewable resources into useful value-added products. Glycerol belongs to such renewable resources. The overproduction of glycerol as a side-product in the production of biodiesel has stimulated the search for practical methods of employing it for different purposes. For many years, various research groups have been working on different catalytic transformations of glycerol to desired target products [1,2,3]. One of the possible catalytic routes for glycerol transformation is its dehydration to acrolein [4] and oxidehydration to acrylic acid [5]. Acrolein is a versatile intermediate that is largely employed in the chemical industry, among others, for the production of acrylic acid. The latter is widely applied in the production of polymers (e.g., plastics [6], synthetic rubbers [7] and fibers [8]). In the catalytic production of acrylic acid via one pot oxidehydration process, in the first step, acrolein is formed in the presence of acidic centers on the catalyst surface, and next, redox centers are involved in the oxidation of acrolein to acrylic acid. In both reactions, the dehydration and oxidehydration of glycerol, one of the most important causes of the solid catalyst deactivation is the formation of a coke deposit, for which the acidic centers involved in the first step of the reaction are mainly responsible. Therefore, the search for minimization of coke formation in dehydration of glycerol is still an important task.
Recently, the authors of two review papers [4,5] have discussed literature data on dehydration and oxidehydration of glycerol on different solid catalysts and indicated two different mechanisms of glycerol dehydration on Lewis and Brønsted acid sites (LAS and BAS, respectively). On strong Lewis acid sites, glycerol is chemisorbed with terminal OH group to form an intermediate enol (2-propene-1,2-diol) which easily tautomerizes to hydroxyacetone. Brønsted acid sites take part in chemisorption of glycerol via secondary OH group followed by dehydration to 1,3-dihydroxypropene which tautomerizes to 3-hydroxypropanal. The latter is dehydrated to acrolein. An interesting observation has been pointed out in [9]. A comparison of IR spectra taken after glycerol adsorption on the niobium(V) oxide at room temperature with the analogous spectra recorded after glycerol adsorption on the surfaces of the other metal oxides: Al2O3, ZrO2 [10]), revealed that the latter two oxides that have only LAS centers do not adsorb glycerol at room temperature, in contrast to Nb2O5 having both LAS and BAS centers. It has been found that dehydration of glycerol adsorbed on LAS of niobia involved the participation of nearby BAS. The authors of [11] indicated that in the presence of BAS, the barrier for dehydration of glycerol adsorbed on LAS was significantly lowered, making this compound susceptible to decomposition at much lower temperatures. As proven in [9] during the adsorption of glycerol on niobia’s LAS, one of the primary OH groups of alcohol dissociates to form bridging alkoxy groups, whereas the second primary OH group is coordinatively but non-dissociatively bonded to metal LAS. The secondary OH group of glycerol can be hydrogen bonded to basic oxygen atom on the niobia surface. The formed glycerol adsorbed complex is stable and does not easily dehydrate to 2-propene-1,2-diol. However, in the presence of acidic proton (BAS), one of the primary hydroxyl group can be easily dehydrated. On the other hand, when glycerol interacts directly with BAS, the dehydration of the secondary OH groups is strongly preferred due to the higher stability of the carbenium ion that is formed as the transition state leading via the next dehydration step to acrolein formation.
Generally BAS on the catalysts surface favor the formation of acrolein, whereas LAS are responsible for the formation of other dehydration products, such as hydroxyacetone. However, the catalysts containing exclusively BAS are not easily obtained. Usually BAS coexist with LAS and to achieve satisfactory glycerol dehydration selectivity to acrolein a high BAS/LAS ratio on the catalyst surface is recommended [4,5]. However, strong BAS lead to coke formation and in this way cause deactivation of the catalyst. On the other hand, as mentioned in [12], the presence of steam at the reaction temperature may hydrate a part of LAS, forming new BAS. Thus, the starting BAS/LAS ratio on the catalyst surface can be changed during the reaction. It is worth noting that not only is the BAS/LAS ratio on the catalyst surface a factor responsible for the dehydration of glycerol to acrolein, textural properties of the catalyst are also very important [5]. Tsukuda et al. [13] have observed that heteropolyacids supported on mesoporous silica gave satisfactory stable catalytic activity and a very high yield of acrolein in glycerol dehydration. Generally, the use of ordered mesoporous silicas as supports for different acidic active phases leads to increased acrolein yield.
Different acidic solid catalysts have been studied up to now in the dehydration of glycerol to acrolein, among them heteropolyacids, zeolites, metal oxides and phosphates [5]. From among different metal oxides, niobium(V) oxide has been used for this purpose [9,14,15]. Nb2O5 was also supported on silica and tested in glycerol dehydration [16]. With 20 wt.% of metal loading the authors obtained the best efficiency of the reaction.
The goal of our study was to apply mesoporous SBA-15 silica as a support for niobium species and to obtain a deeper insight into the active centers formation when applying different methods for niobium loading on mesoporous silica. We also wanted to modify the catalysts towards reaching s minimization of coke deposits responsible for deactivation of the catalysts used in the dehydration of glycerol. The research hypothesis was that both, the use of the support with large mesopores and silylation of niobium containing SBA-15, lead to a decrease in coke formation and enhance the acrolein selectivity.

2. Results and Discussion

Two different methods of SBA-15 modification with niobium species were applied: (i) wetness impregnation with ammonium niobate(V) oxalate used in different amounts to obtain two different niobium depositions, of 15 wt.% and 25 wt.%, and (ii) mixing of SBA-15 with Nb2O5 (15 wt.% of niobium) followed by calcination. On the basis of literature data [17] one can expect that both types of modifications would lead to different niobium species supported on SBA-15 mesoporous silica. These procedures were followed by silylation of niobium modified SBA-15 in order to modify its surface properties.

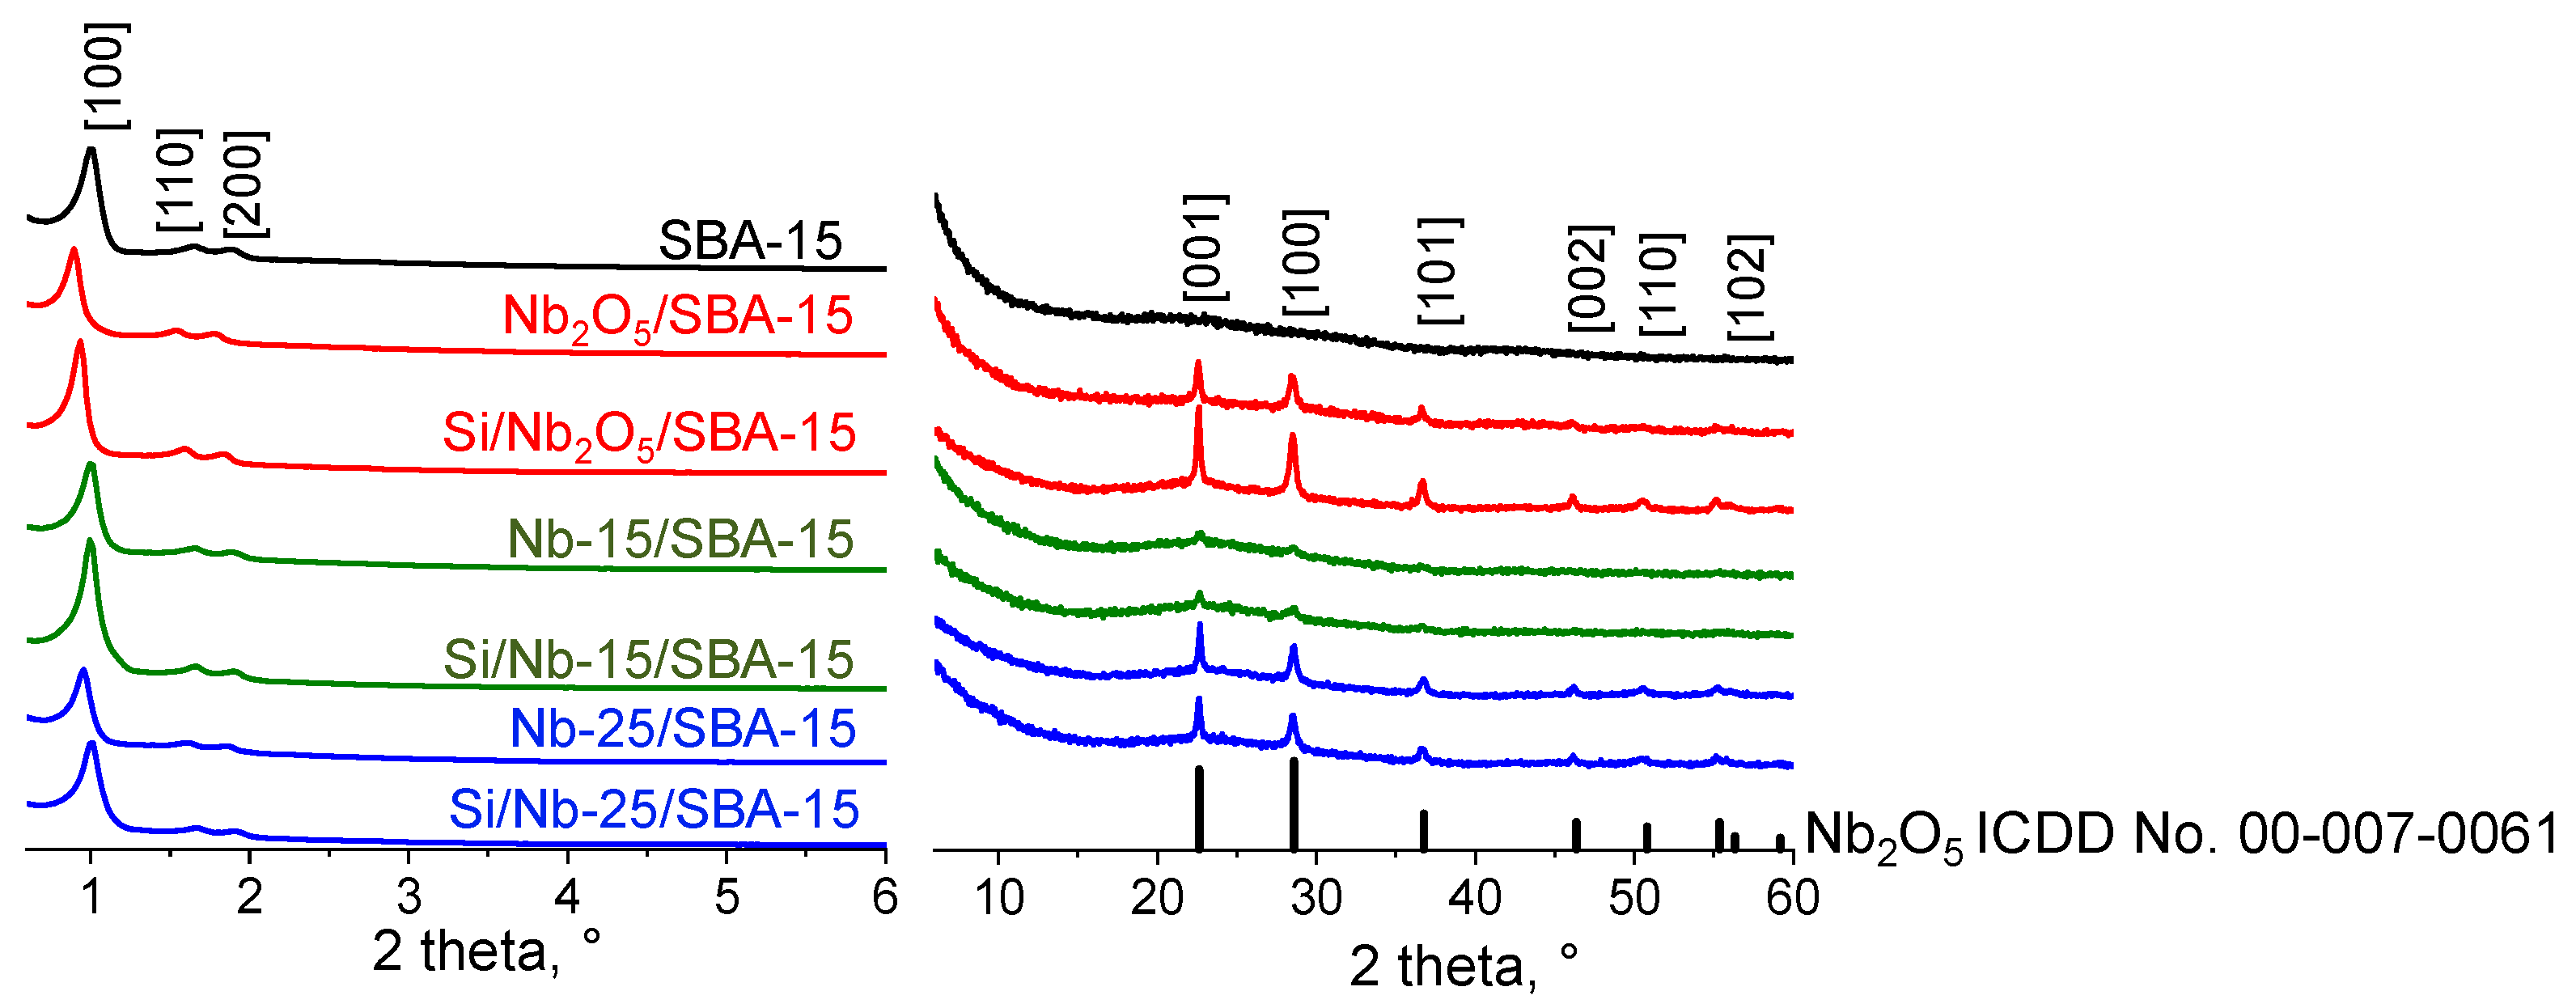
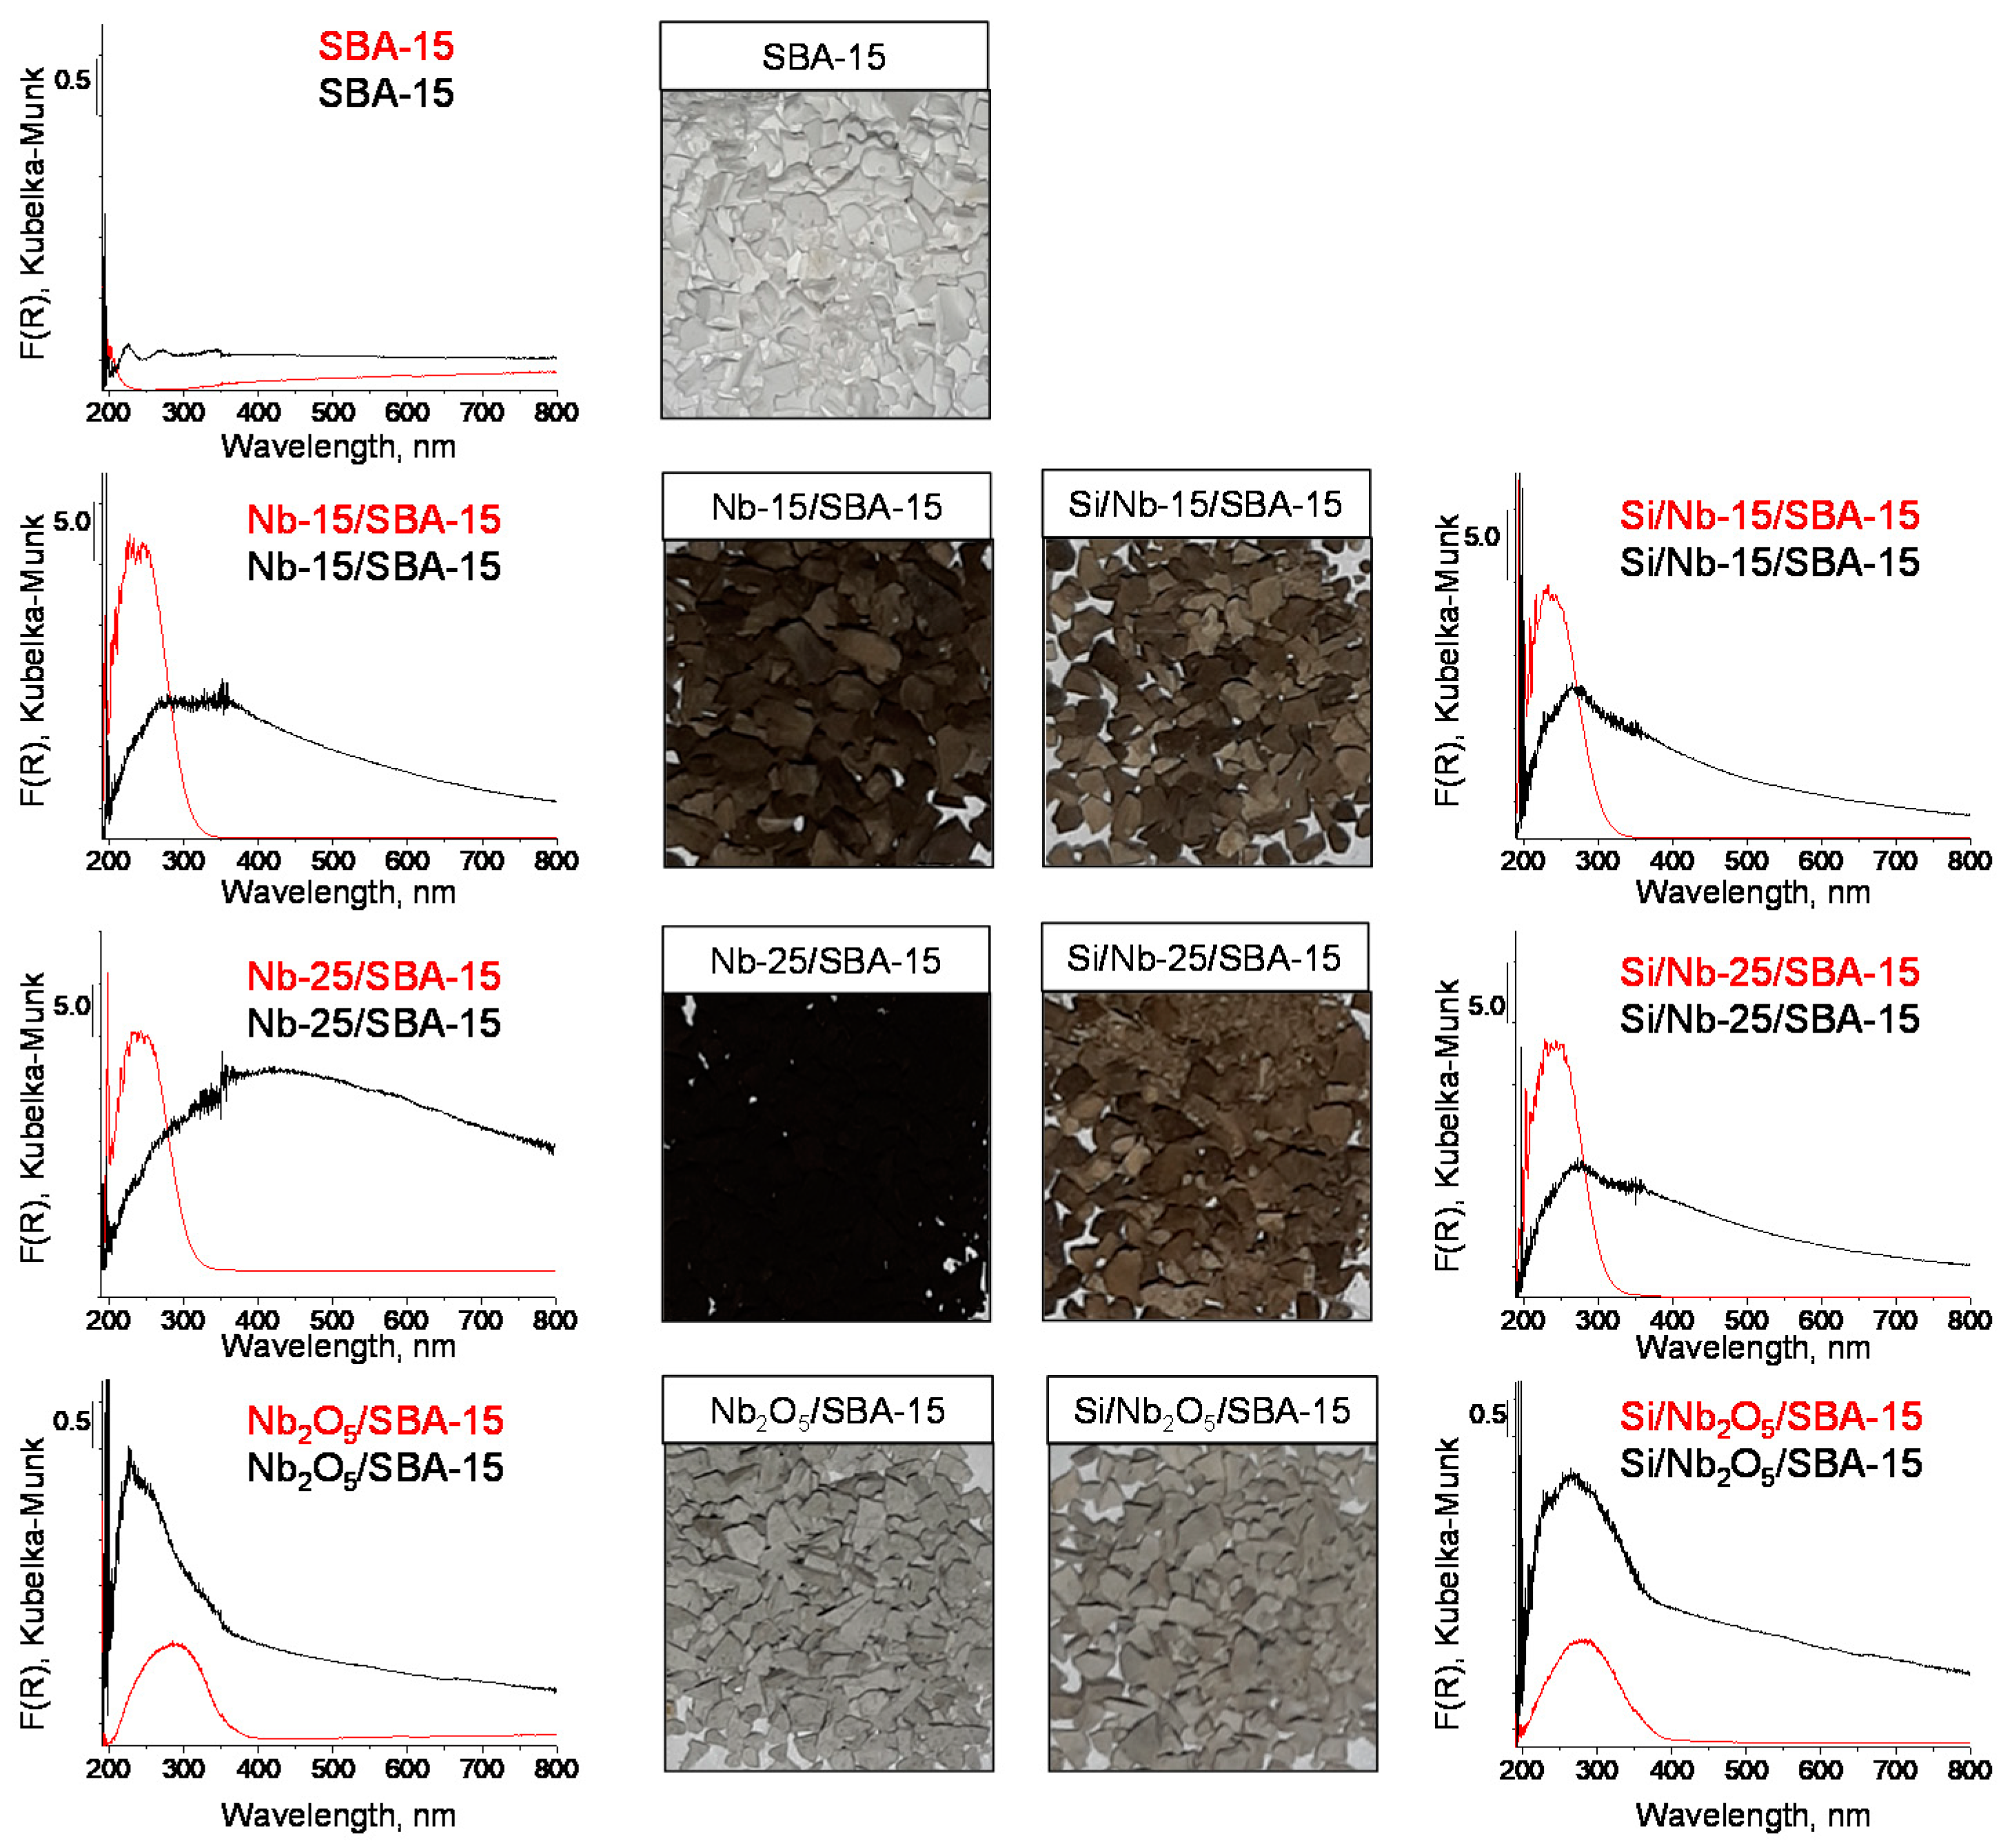
2.1. Texture/Structure Characterization

The post synthesis modification of SBA-15 with niobium species and with APTMS, i.e., (3-aminopropyl)trimethoxysilane, followed by calcination did not change the hexagonal ordering of mesopores in SBA-15 support, as deduced from XRD patterns in the low angle range (Figure 1) and low temperature nitrogen adsorption isotherms (Supplementary Figure S1). The low-angle XRD patterns of all catalysts showed the reflexes typical of hexagonal structure of SBA-15 (Figure 1). The most intense peak (100) at 2 theta 1.0° recorded for parent SBA-15 material is related to the reflections of the hexagonal plain group p6mm and characterizes hexagonally ordered mesoporous solids. Its position depends on the size of mesopores. The slight changes in this position shown in Figure 1 depending on the modification procedure indicated some changes in the pore sizes, manifested also in the shape of the nitrogen adsorption isotherms discussed below. Two other low intensity peaks, (110) and (200) in the range of 2 theta 1.3–2.0°, indicate high ordering of mesopores in all prepared materials [18].
The textural parameters were calculated from nitrogen adsorption isotherms. All nitrogen adsorption isotherms shown in Supplementary Figure S1 are of type IVa according to IUPAC classification [19]. It confirms the mesoporous character of the materials obtained. The hysteresis loop of type H1 observed at high values of p/p0, appearing as a result of nitrogen condensation inside the pores, is typical of SBA-15 and confirm the presence of uniform narrow mesopores. In all materials obtained the pore size ranged from 11.8 nm (for the parent SBA-15) to 9.7 nm (Table 1). Interestingly, all materials modified by impregnation with niobium source and the samples silylated with APTMS exhibited the same pore size, namely 9.7 nm. However, the other textural parameters of the samples differed, depending on the modification procedure used. The sizes of pores in Nb2O5/SBA-15 varied between those of the parent SBA-15 and those observed for Nb/SBA-15 materials. However, silylation of Nb2O5/SBA-15 decreased its pore sizes, in comparison to those in the materials prepared by impregnation with ammonium niobate(V) oxalate. It suggests the different type interaction of APTMS with Nb/SBA-15 samples, which is related to the presence of niobium species different than those present in Nb2O5/SBA-15. The prepared materials had a relatively large surface area, between 336 and 828 m2/g and pore volume in the range of 0.31–0.64 cm3/g (Table 1). The introduction of niobium precursor into SBA-15 followed by calcination, caused a decrease in the above-mentioned parameters. Silylation of the niobium-containing SBA-15 with immobilized APTMS caused a further decrease in the surface area and pore volume. The increase in wall thickness of the niobium containing mesoporous silica in comparison to that of the pristine SBA-15 indicated the incorporation of niobium species into silica walls. A further increase in the wall thickness of both Nb/SBA-15 and Nb2O5/SBA-15, after modification with APTMS, indicated that the modifier was successfully anchored into the supports.
The wide-angle XRD pattern of SBA-15 presents only one wide reflection typical of amorphous material [20] (Figure 1). The modification of SBA-15 with ammonium niobate(V) oxalate led to the formation of crystalline niobium(V) oxide on the surface of Nb-15/SBA-15 and Nb-25/SBA-15. Similar reflections characteristic of crystalline niobium(V) oxide were observed in the wide-angle XRD pattern of Nb2O5/SBA-15 (Nb2O5—ICDD No. 00-007-0061). The XRD patterns of silylated materials presented also the reflections typical of crystalline Nb2O5. However, the full width at half maximum (FWHM) of the reflections assigned to niobia differed depending on the samples. The average crystal sizes were calculated with the Scherrer’s equation. The results are shown in Table 1. The highest dispersion of niobia was observed for Nb-15/SBA-15 (average crystal size 34 nm). The material with a higher niobium deposition (Nb-25/SBA-15) was found to have twice larger crystallites of metal oxide on its surface. Relatively large crystallites were also formed on Nb2O5/SBA-15 sample. It is important to point out that silylation led to an increase in niobia crystal size for all materials. It suggests that niobia crystals are partly driven out from the sites they occupy by APTMS, which leads to an increase in the niobia crystals mobility and to their agglomeration.
The crystalline Nb2O5 was not the only niobium species present in SBA-15 impregnated with ammonium niobate(V) oxalate. The UV-Vis spectra shown in Figure 2 confirm the metal incorporation into SBA-15 silica concluded from the increase in wall thickness described above. The UV-vis spectra of the samples modified by impregnation with ammonium niobate(V) oxalate show three bands. The first of them at ca. 216 nm is typical of charge transfer (CT) transition between oxygen and tetrahedrally coordinated niobium, the second one at ca. 250 nm is characteristic of the charge transfer transition between oxygen and pentacoordinated niobium and the third one at ca. 285 nm can be ascribed to the charge transfer transition between oxygen and octahedrally-coordinated niobium species in Nb2O5 [17,21,22,23]. The UV-Vis spectrum of SBA-15 modified with niobium(V) oxide shows two bands at ca. 250 nm and 300 nm. These bands are typical of the charge transfer transition between oxygen and niobium in pentahedral and octahedral coordination, respectively, which is characteristic of niobium(V) oxide [24]. The observed bands are red shifted in relation to the bands shown in Figure 2 for bulk Nb2O5, which indicates the interaction of niobium(V) oxide with the SBA-15 support. Thus, the band at ~250 nm is characteristic of both, niobium(V) oxide loaded on SBA-15 surface and niobium incorporated into the silica walls. Therefore, this band is the most intense (from among the three bands) in the spectra of the impregnated materials containing both types of niobium species. The UV-Vis spectrum of Nb2O5/SBA-15 did not reveal the band characteristic of charge transfer in tetrahedrally coordinated niobium located in the silica walls. Such behavior suggests that in this sample niobium was not incorporated into the silica structure. The bands analogous to the above-discussed ones are present in the spectra of the materials after silylation (Figure 2). However, there is a difference in their positions. For Si/Nb-15/SBA-15 and Si/Nb-25/SBA-15 the bands are blue shifted, which suggests the interaction between niobium species and the immobilized silylating agent. Such a shift was not observed for Si/Nb2O5/SBA-15, confirming the presence of different surface species in the materials modified via impregnation and by mixing SBA-15 with Nb2O5.

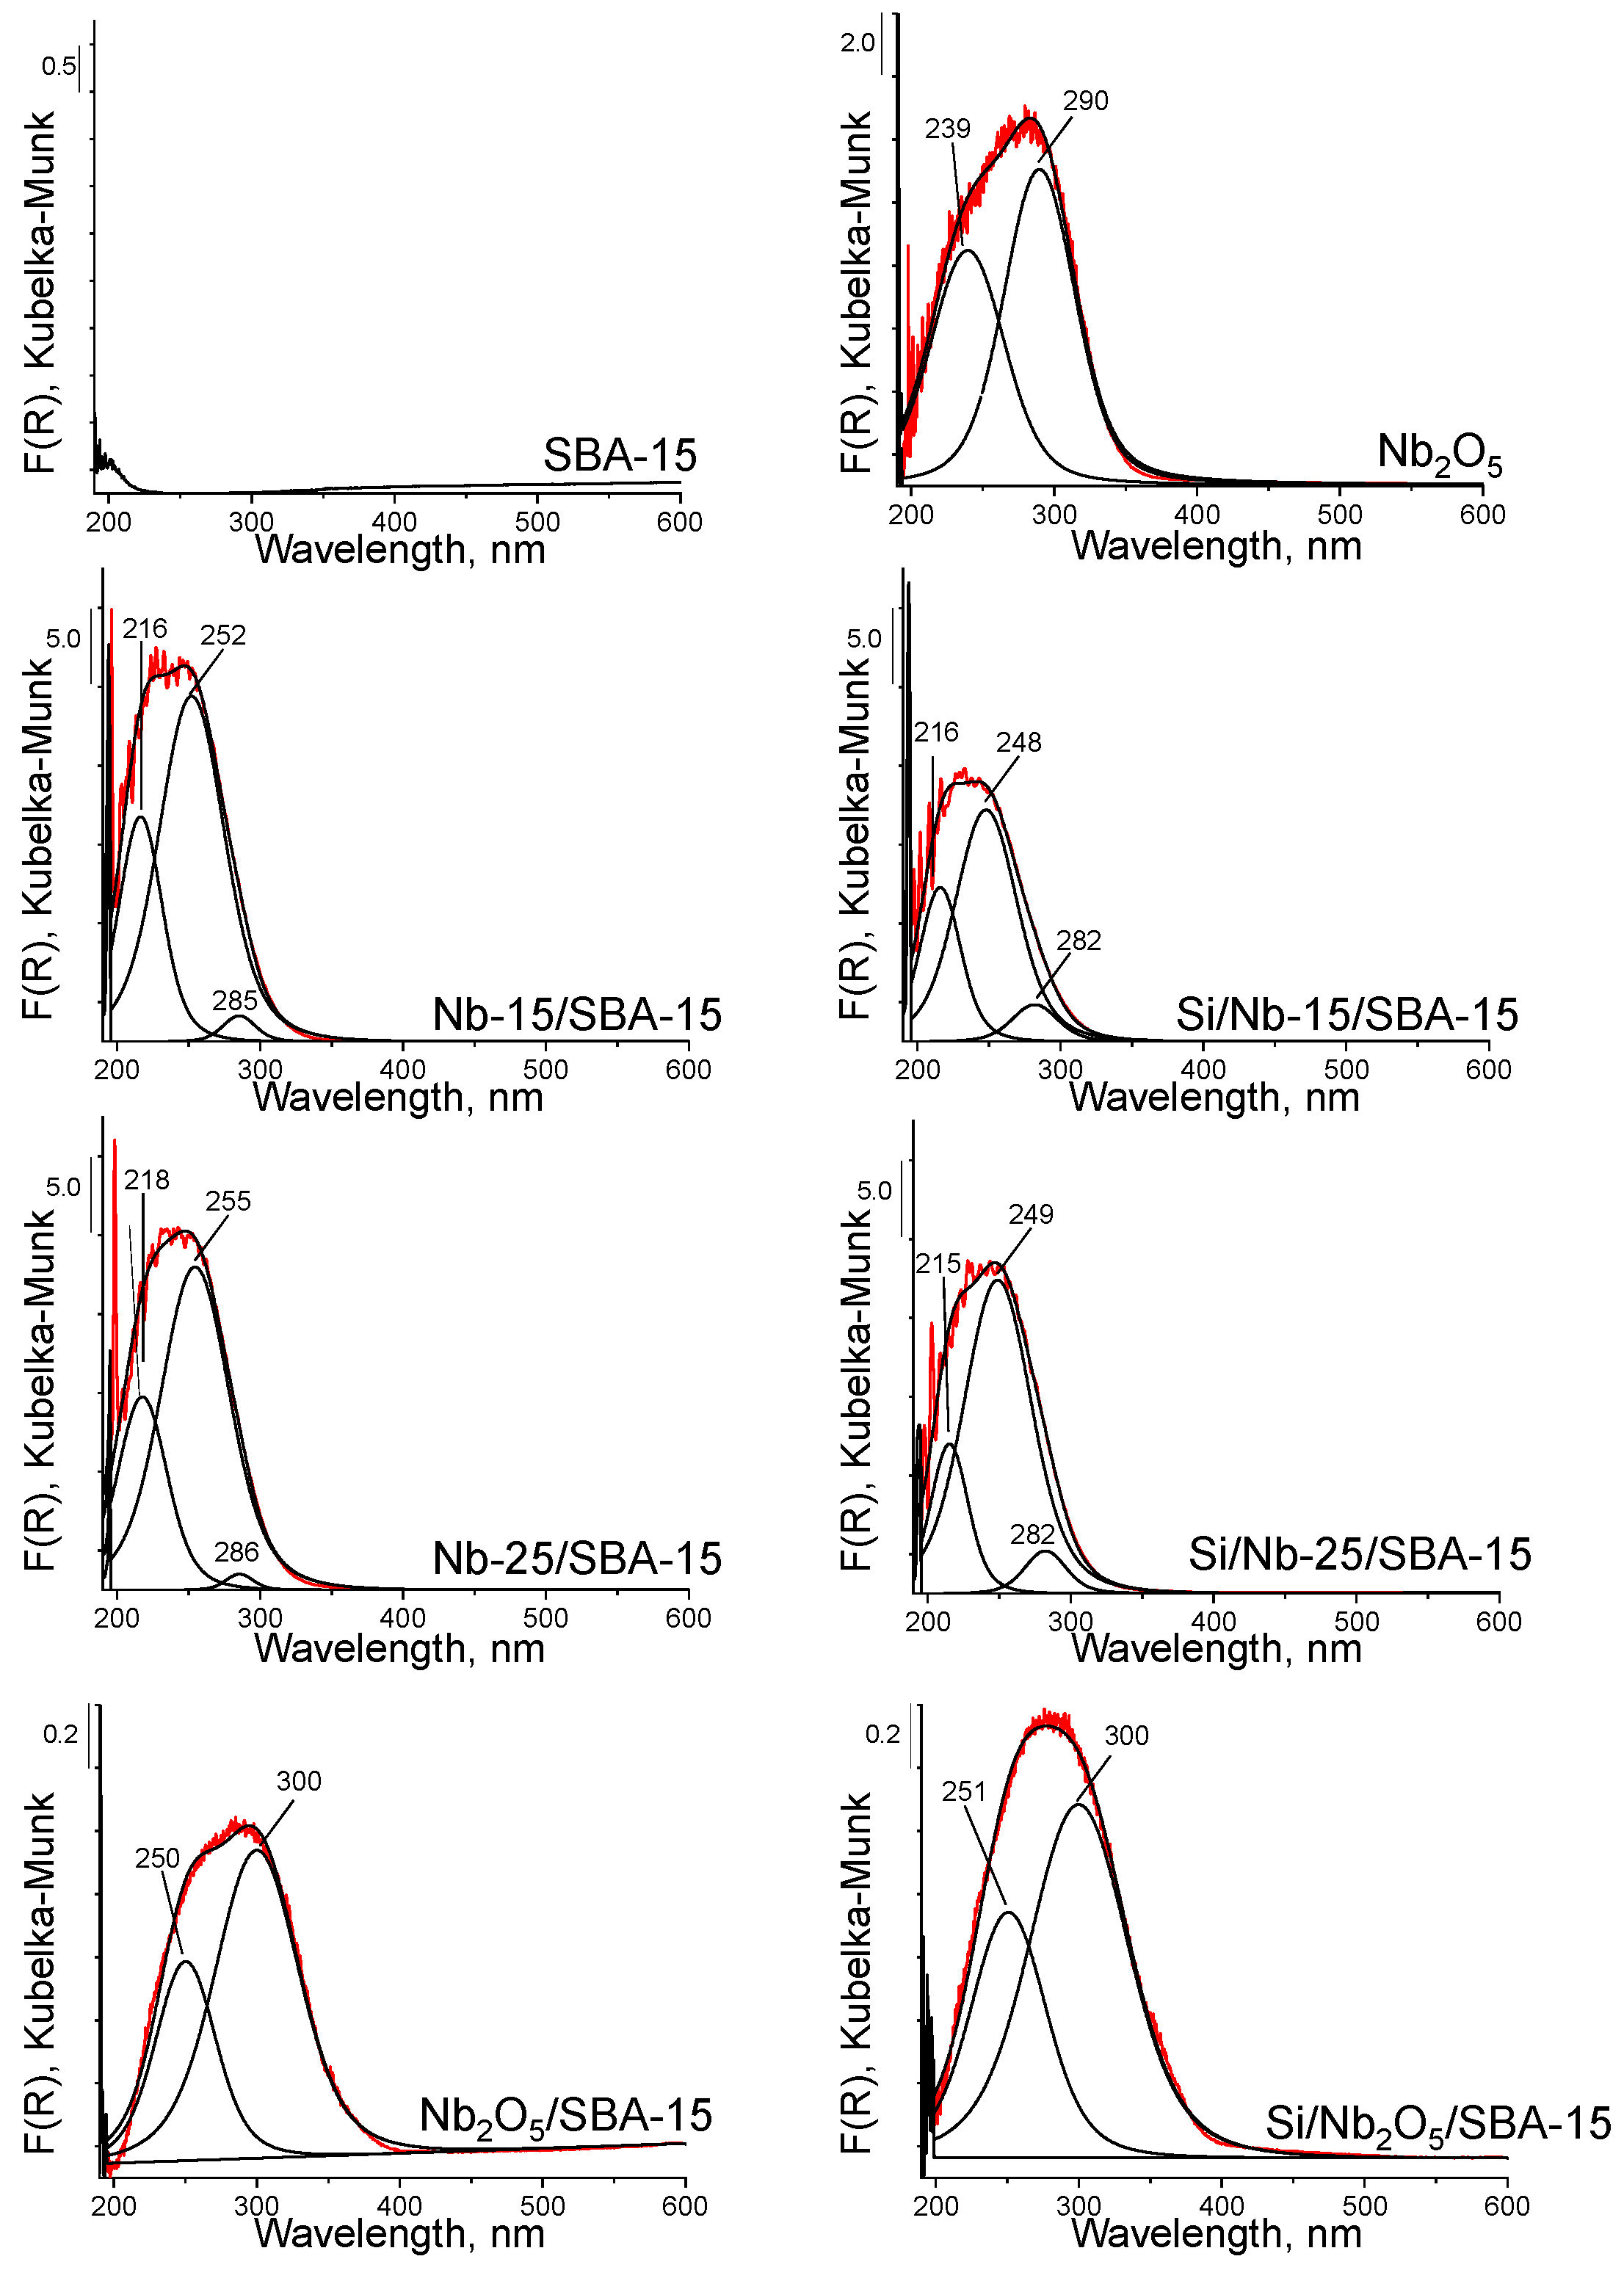
2.2. Surface Properties

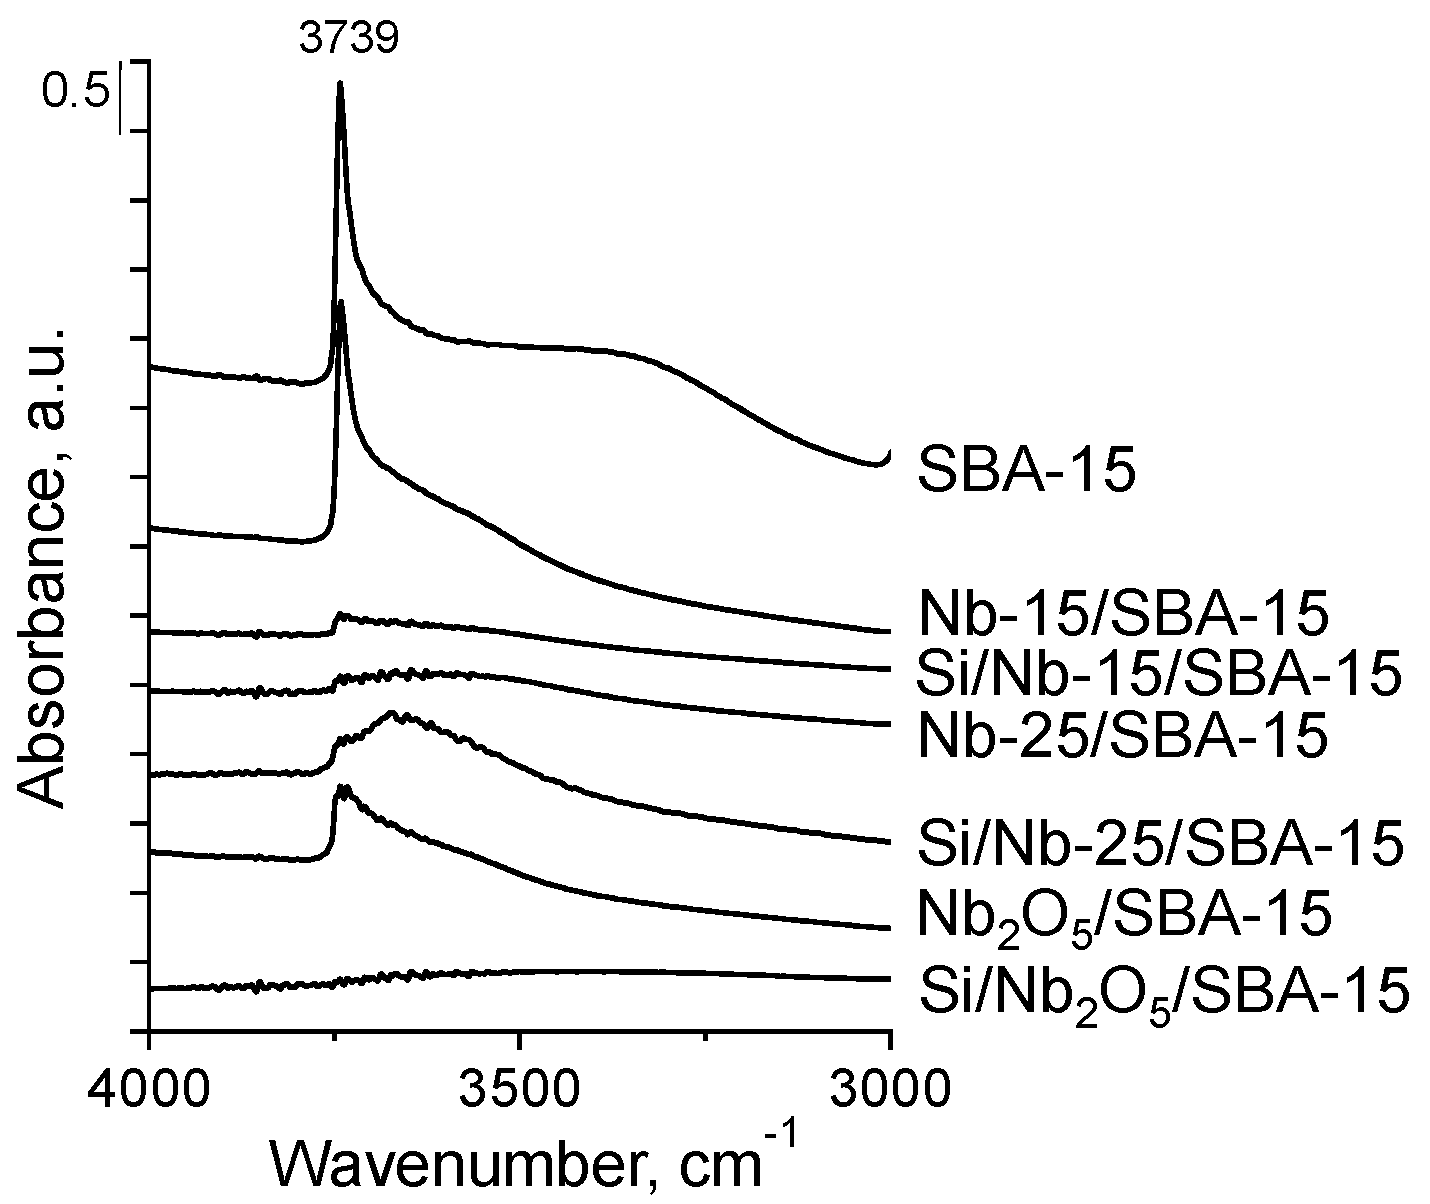
2.2.1. Hydroxyls on the Catalysts Surface

Surface hydroxyls were examined by FTIR spectroscopy after activation of the samples under vacuum at 400 °C for 2 h, i.e., in the conditions similar to those used in activation of the catalysts in argon flow before the catalytic dehydration of glycerol. The spectra in the hydroxyl region, 4000–3000 cm−1, are presented in Figure 3. According to literature (e.g., [25,26]) the presence of terminal and geminal hydroxyl groups is manifested by a sharp infrared band at ca. 3740 cm−1 characteristic of the O-H stretching vibrations. A broad band in the OH stretching vibration region between 3600 cm−1 and 3000 cm−1 is typical of the vibration in silanol groups interacting with water molecules, whereas the band or a shoulder at ca. 3660 cm−1 is assigned to the vibrations in bridged (vicinal) hydrogen bonded hydroxyls. The bands characteristic of terminal and/or geminal silanol groups and hydroxyls interacting with water molecules are clearly visible in the spectrum of SBA-15 support. The deposition of niobium via impregnation with ammonium niobate(V) oxalate (15 wt.% of niobium) led to a partial decrease in the intensity of 3740 cm−1 band, disappearance of a broad band in the range of 3600–3000 cm−1 and a significant increase in the intensity of the spectral line in 3660 cm−1 region. The raised tail shown in this region covers the band at 3660 cm−1 characteristic of acidic hydroxyls in Nb-OH species as shown in [23] for Nb-MCF system in which niobium was incorporated to silica structure forming Nb-OH-Si bonds. Thus, it is clear that a part of niobium species occupy positions in the silica network, while the others are in the form of crystalline Nb2O5 indicated by the XRD pattern. In the spectrum of Nb-25/SBA-15, a significant decrease in the intensity of FTIR bands is observed, pointing to almost total disappearance of hydroxyl groups. It means that a high concentration of niobium precursor used for the modification resulted in covering of almost all hydroxyls present on the SBA-15 external and internal surface. The FTIR spectrum in the region corresponding to hydroxyl groups became considerably flattened, but clearly raised between 3750 and 3500 cm−1. Thus, the presence of some amounts of silanols and Nb-OH species on the surface of Nb-25/SBA-15 is indicated. The spectrum of the sample prepared by modification of SBA-15 with Nb2O5, in the amount related to 15 wt.% of niobium, is similar to that of Nb-15/SBA-15, but the intensity of the band at 3740 cm−1 is much lower than that in the spectrum of the impregnated material. This observation indicates that the same amount of niobium loaded on SBA-15 by two different modification methods (impregnation with ammonium niobate(V) oxalate vs. mixing of Nb2O5 with SBA-15) led to different surface properties. In Nb2O5/SBA-15, more niobium species interacted with silanol groups.
Silylation of two niobium modified SBA-15 samples (Nb-15/SBA-15 and Nb2O5/SBA-15) with the same niobium loading by APTMS drastically decreased the intensity of the band coming from silanol groups and Nb-OH. The spectrum of Nb2O5/SBA-15 shows that the band at 3740 cm−1 disappeared for the silylated sample, pointing to the complete removal of terminal and geminal hydroxyl groups as a result of grafting with the silylating agent. It is a clear indication of the chemical reaction between organosilane reagent and the terminal and geminal silanol groups as well as with Nb-OH acidic hydroxyls. The result is different for Nb-25/SBA-15 material in which the amount of silanols was very low. Immobilization of APTMS led to the increase in intensity of the band at 3740 cm−1 and appearance of a well-visible broad band centered at ca. 3660 cm−1. This observation can be related to the partial replacement of Nb2O5 loaded on SBA-15 in Nb-25/SBA-15 by APTMS during the silylation, as postulated in the section describing XRD patterns and niobia crystal sizes. This process combined with agglomeration of niobia crystals resulted in partial uncovering of surface hydroxyls. For all the samples studied, the silylation process resulted in the disappearance of the broad band in the range 3500–3000 cm−1, characteristic of SBA-15 silica and coming from water molecules hydrogen bonded to hydroxyl groups. This phenomenon can be understood taking into account the replacement of silanol groups by Si(CH3)3 moieties during the silylation process.

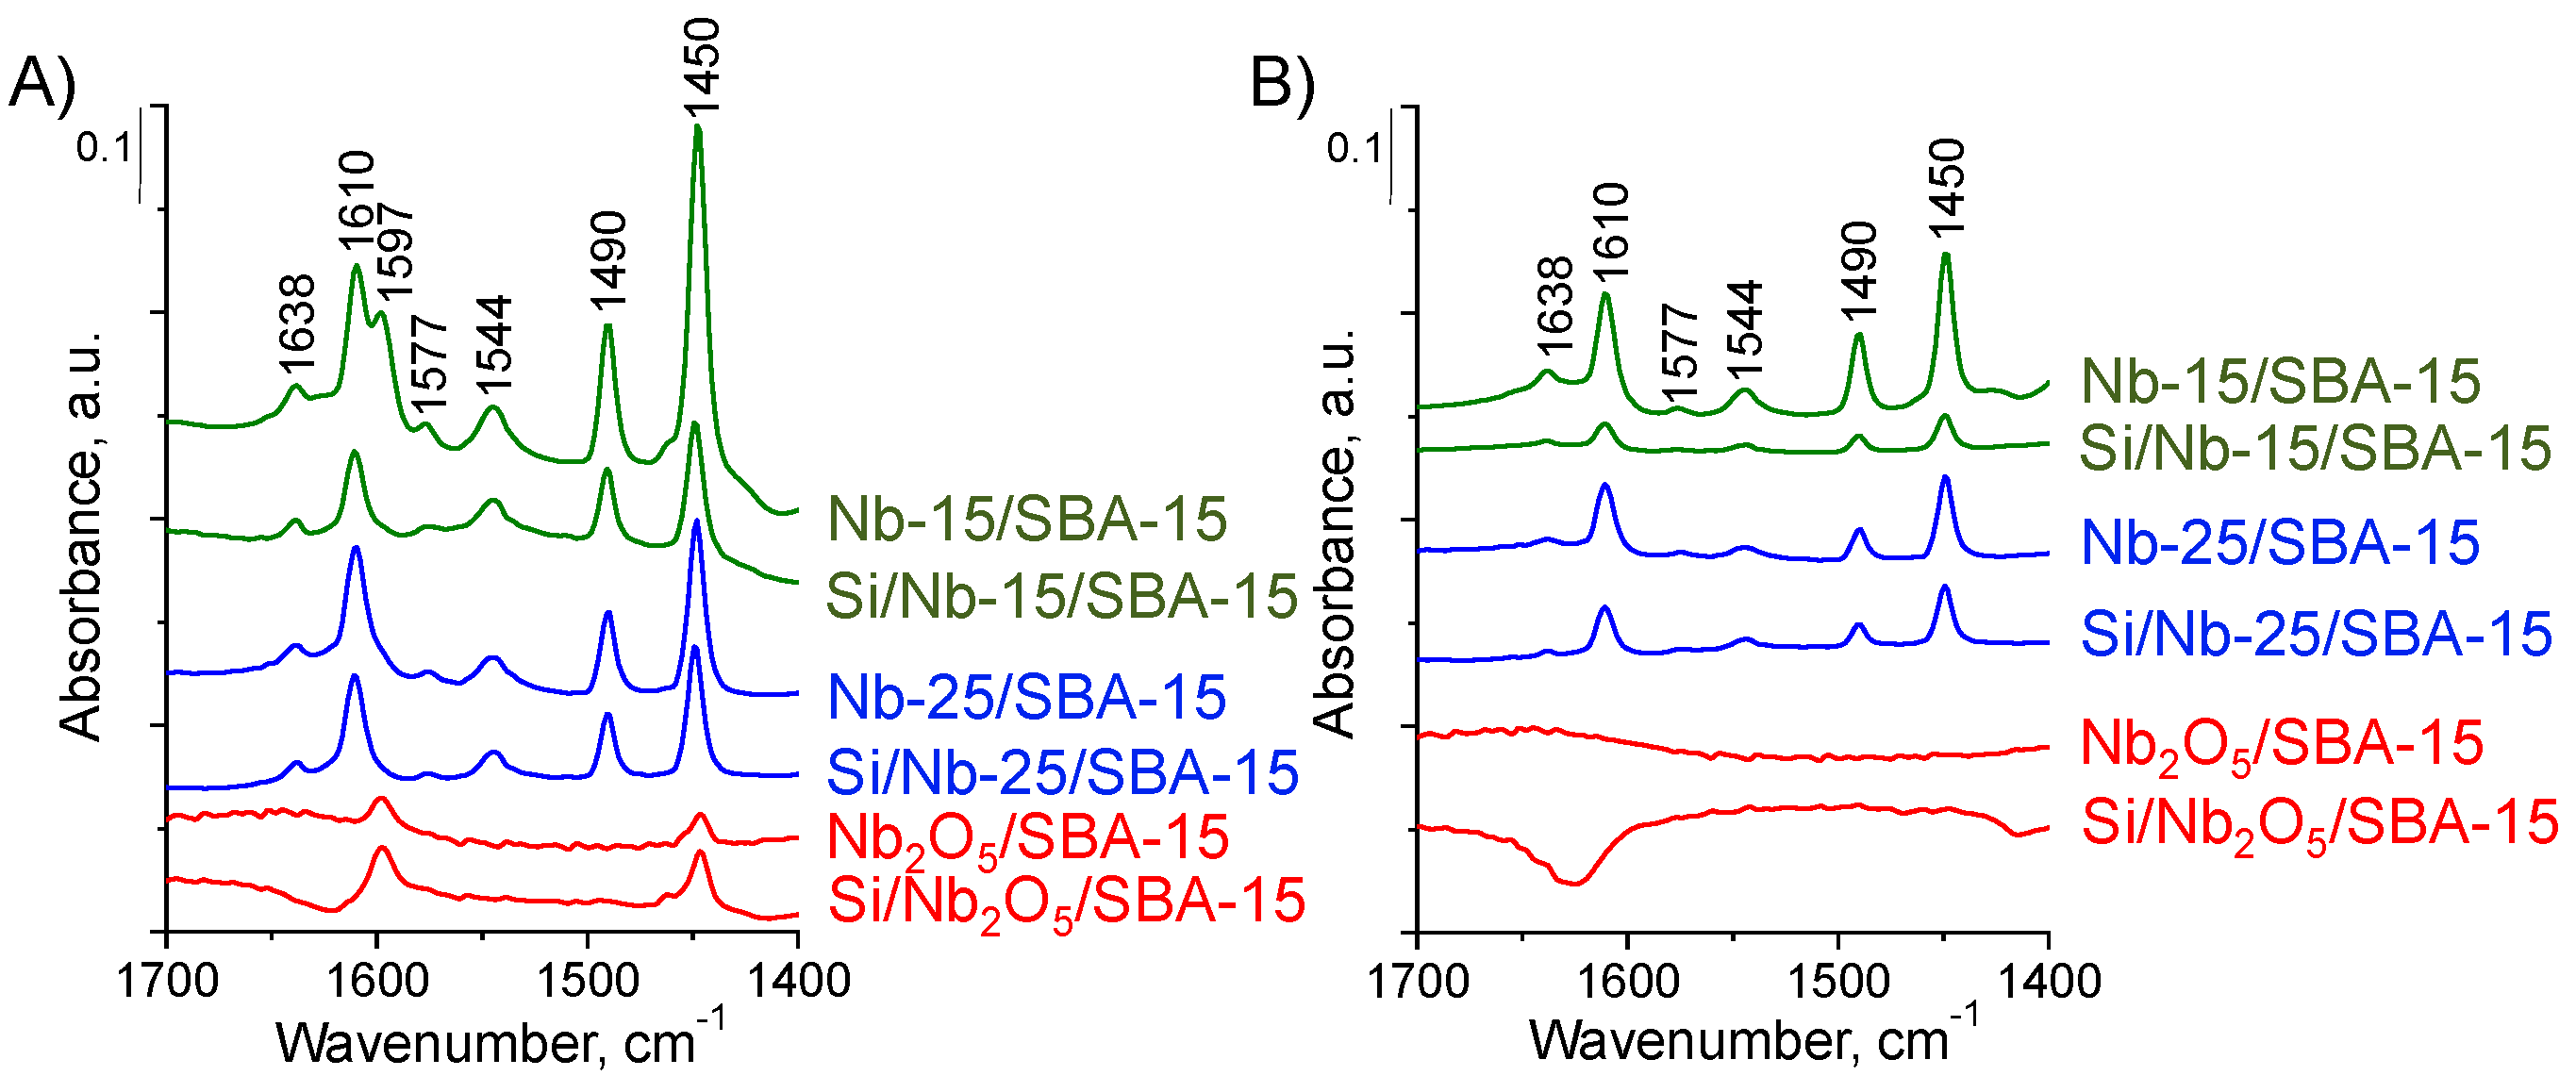
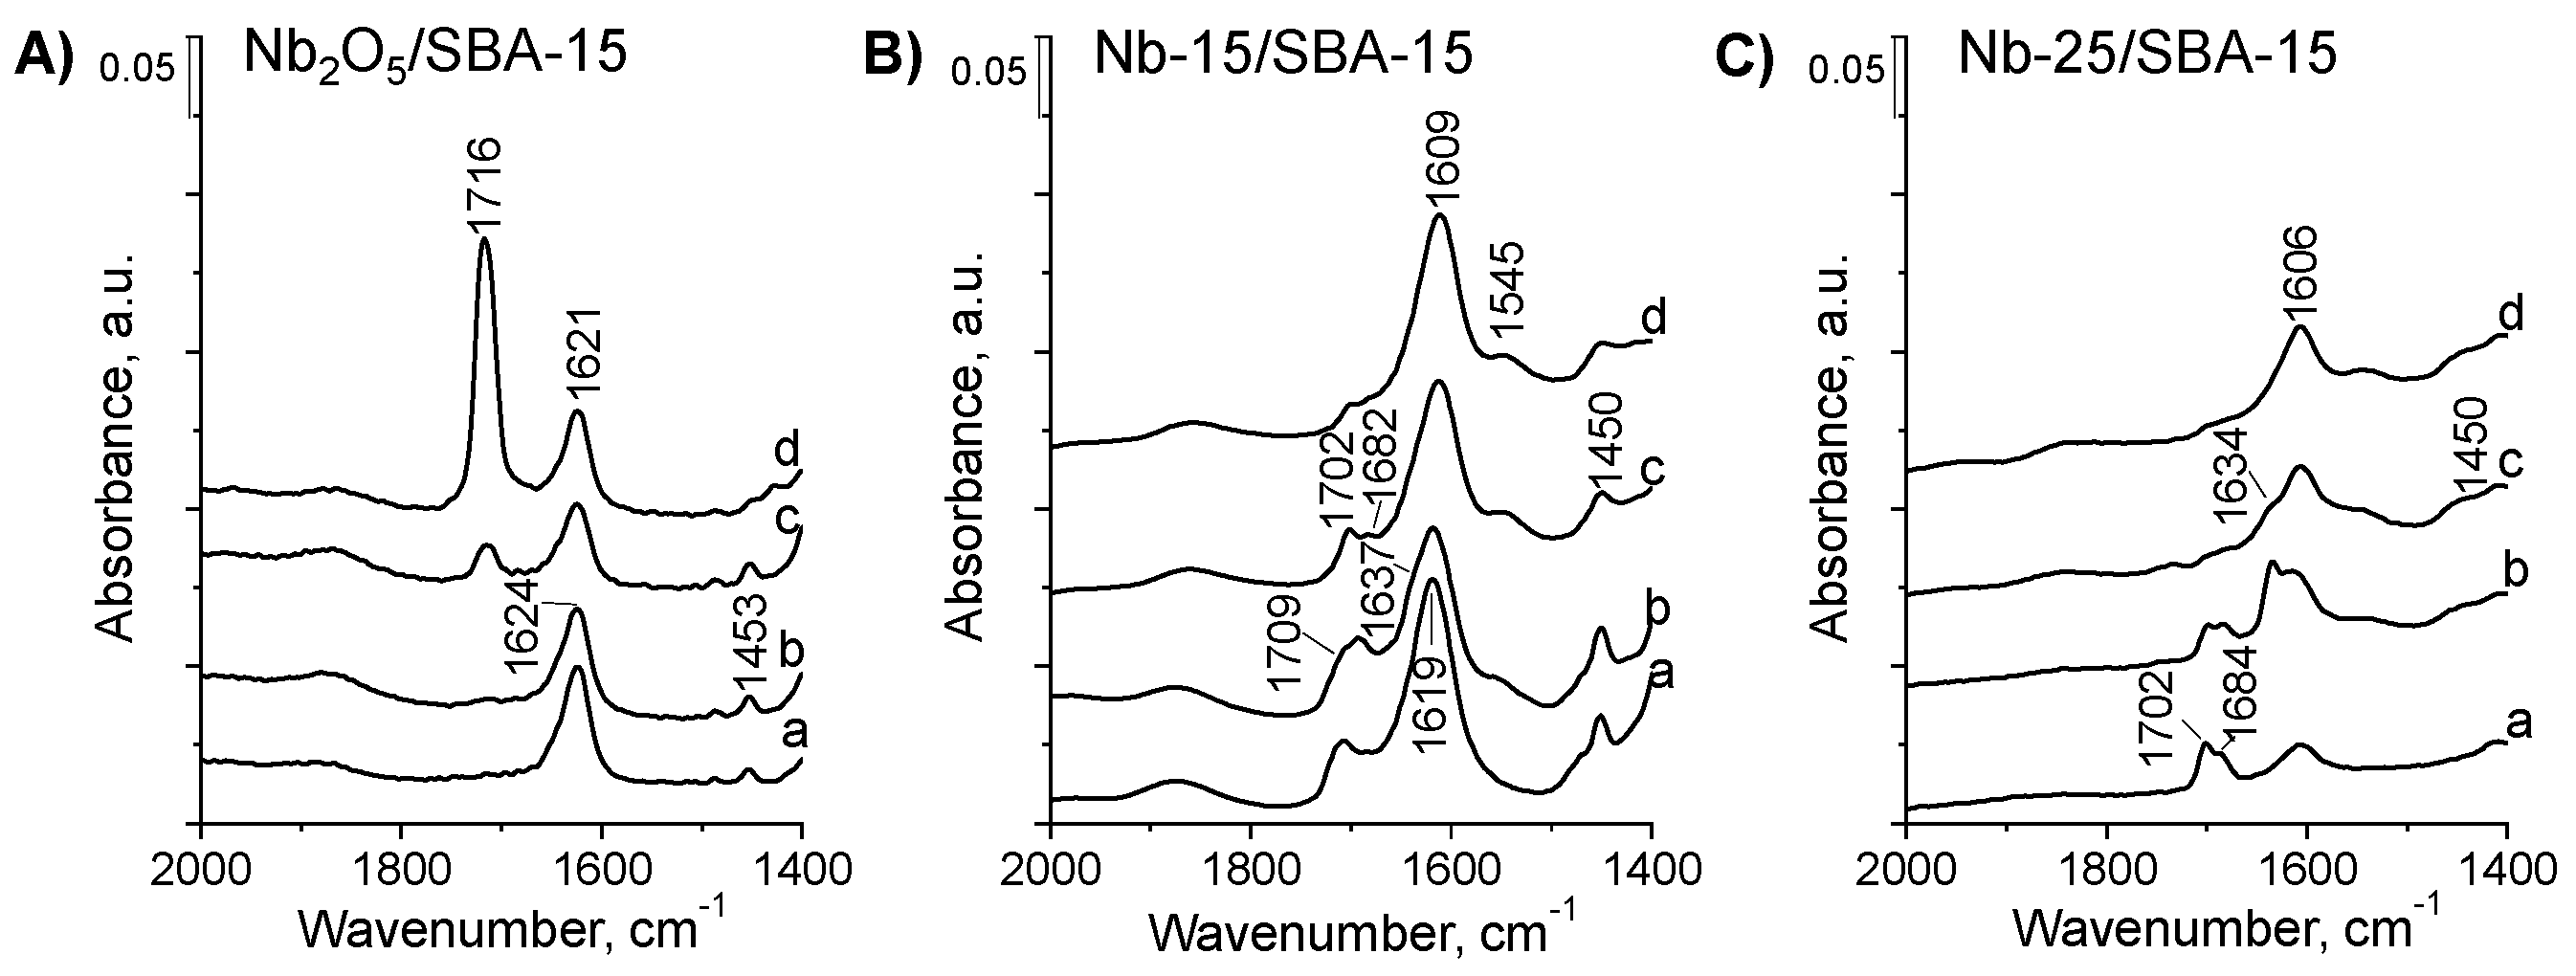
2.2.2. Acid-Base Properties

The surface acid-base properties of all materials were tested by FTIR spectroscopy measurements after pyridine and nitrogen(II) oxide adsorption. Pyridine adsorption allowed the estimation of Lewis and Brønsted acidity [27], whereas NO adsorption provided the information on the Lewis acid-base properties [28].
The FTIR spectra after pyridine adsorption at 150 °C on all investigated samples previously activated at 400 °C for 2 h, in the region characteristic of the stretching vibrations in pyridine molecules (1700–1400 cm−1), are shown in Figure 4A. According to literature (e.g., [29]), the pair of bands at 1450 cm−1 and 1610 cm−1 originates from the symmetric and antisymmetric vibrations, respectively, in pyridine molecules coordinatively bonded to Lewis acid sites (LAS), whereas another pair of bands (1544 cm−1 and 1638 cm−1) is assigned to the symmetric and antisymmetric (respectively) stretching vibrations in pyridinium cations formed by the protonation of pyridine on Brønsted acid sites (BAS). The pair of bands at 1447 cm−1 and 1597 cm−1 is characteristic of pyridine hydrogen bonded to weak BAS. The intense band at 1490 cm−1 is typical of pyridine chemisorbed on both, LAS and BAS, whereas the band at 1577 cm−1 comes from physisorbed pyridine. The spectra of the samples prepared by impregnation with ammonium niobate(V) oxalate and the silylated materials exhibited all above-mentioned bands after pyridine adsorption at 150 °C. The difference in the intensity of these bands resulted from the different numbers of acidic sites exposed to pyridine. In contrast, the spectra of the sample obtained by the mixing of SBA-15 and Nb2O5 followed by calcination at 500 °C and the silylated material showed only the infrared bands coming from hydrogen bonded pyridine.
To evaluate the strength of pyridine adsorption, which is an indicator of the acidity strength on the catalyst surface, the outgassing of pyridine was performed on increasing temperature in the range 150–300 °C. All spectra recorded after adsorption and desorption of pyridine are shown in Supplementary Figure S2, whereas, as an example, Figure 4B presents the spectra obtained after evacuation at 200 °C. It is clear that a short outgassing of pyridine adsorbed on Nb2O5/SBA-15 and Si/Nb2O5/SBA-15 at 150 °C resulted in the total desorption of the adsorbed base. It means that these materials have hydroxyl groups forming only very weak hydrogen bonds with pyridine. As shown in Supplementary Figure S3, pyridine adsorption caused mainly a reduction in intensity of the infrared band at 3740 cm−1 coming from silanol groups. Thus, Brønsted acidity of these materials was very weak. The bands characteristic of pyridine chemisorbed on LAS (1450 cm−1) and BAS (1545 cm−1) present on the surface of the samples modified by impregnation with ammonium niobate(V) oxalate (Figure 4 and Figure S2) were used for calculation of the concentration of the acidic sites and the results obtained are shown in Table 2. The number of LAS was not calculated from the spectra obtained after pyridine desorption at 150 °C due to a partial overlapping of the 1450 cm−1 band with the one coming from hydrogen bonded pyridine (symmetric vibration), which was concluded from the well-visible band at 1597 cm−1 (antisymmetric vibrations). The results presented in Table 2 indicated that the highest concentration of LAS and BAS was on the surface of Nb-15/SBA-15. The LAS number was almost twice higher on Nb-15/SBA-15 than that on Nb-25/SBA-15 material, whereas the BAS number was ca. ¼ higher. The acidity strength estimated on the basis of pyridine desorbed at 250 °C was inversely related to the amount of adsorbed pyridine left after desorption at 200 °C (the higher the amount of desorbed pyridine, the weaker the acidity). The strength of acid centers, especially BAS, was greater for Nb-25/SBA-15 than that for Nb-15/SBA-15, which is the opposite trend to the acid site concentration. The silylation of niobium containing materials caused a decrease in the number of both, Lewis and Brønsted acid sites (Table 2). This effect was greater for Si/Nb-15/SBA-15 than for Si/Nb-25/SBA-15. Interestingly, BAS/LAS ratio was much higher for Nb-15/SBA-15 than for Nb-25/SBA-15 and did not change after silylation.
Taking into account that the material containing exclusively Nb2O5 loaded on SBA-15 (Nb2O5/SBA-15—as indicated by XRD and UV-Vis results) did not have LAS and BAS characterized by pyridine adsorption, it can be concluded that the Lewis and Brønsted acidity of Nb-15/SBA-15 and Nb-25/SBA-15 as well as their silylated counterparts comes from niobium incorporated into silica matrix. Previously, it has been indicated that niobium located in mesoporous silicas forms bridged Nb-OH species, which after dehydroxylation form penta-coordinated NbO and tetra-coordinated positively charged niobium [31]. The former play a role of Lewis basic sites, whereas the latter act as Lewis acid centers. Identification of both types of centers in dehydroxylated samples was possible by using nitrogen(II) oxide as a probe molecule combined with FTIR spectroscopy measurements.
The NO molecule is an electron donor, i.e., a weak Lewis base [32]. Thus, it can be coordinated to Lewis acid sites via a nitrogen atom. Moreover, if strong Lewis base species are present on the surface of a solid, NO molecule can be chemisorbed on them forming nitrito or nitrato ions. Nitrogen(II) oxide has been used for identification of niobium species incorporated to silica matrix, namely niobium cations (Lewis acid sites) and NbO species playing a role of base/redox centers (e.g., [28,31,33,34]). The FTIR spectra of niobium containing SBA-15 materials after adsorption of NO at room temperature (r.t.), followed by heating at 100 °C, 200 °C and 300 °C, are shown in Figure 5. The adsorption of NO at r.t. on Nb2O5/SBA-15 resulted in the appearance of an intense band at 1624 cm−1 and a much less intense one at 1453 cm−1 (Figure 5A spectrum a). The former can be assigned to the bridging bidentate nitrate (Nb-O)2=NO [32] formed in the interaction of two neighboring metal-oxygen species in Nb2O5 crystals with NO molecule. This band is accompanied by another one at 1450 cm−1 coming from ν(N=O)vibration in monodentate nitrito species (NbO-NO) [28,32]. Heating at 100 °C did not change the spectrum, whereas heating at 200 °C led to some decrease in intensity of the band coming from the bridging bidentate nitrate species and the appearance of a new band at 1716 cm−1. This band became very intensive after heating at 300 °C. On the basis of literature data [28,32] this band was assigned to dinitrosyl complex (Nb(NO)2) formed by partial desorption of NO from the bidentate nitrate complex and NO adsorption on niobium cations in Nb2O5 in combination with adsorption of NO from the gas phase. Adsorption of NO on niobium cations (LAS) only after heating at 200 °C and 300 °C indicates a very weak Lewis acidity of niobium(V) oxide loaded on SBA-15. This is in line with the results of pyridine adsorption, which did not detect Lewis acidity under experimental conditions used.
The FTIR spectra of NO adsorbed at r.t. on Nb-15/SBA-15 containing the same amount of niobium as Nb2O5/SBA-15 are different from the above-described ones (Figure 5B). Adsorption of NO at r.t. led to the appearance of a relatively broad band at ca. 1705 cm−1 with a shoulder at ca. 1680 cm−1, which was resolved into two bands at 1702 cm−1 and 1682 cm−1 after heating at 200 °C. These bands are assigned to dimers containing different isomers, cis and trans ONNO forms and antisymmetric NONO species [28,32]. At low temperatures NO tends to dimerize. Dimeric molecules were often detected as a principal adspecies located on transition metal cations. The vibration ν(O=N-) in antisymmetric NONO dimers’ isomers resulted in the appearance of a band at 1682 cm−1, which comes from the adsorption of such dimers on Lewis acid sites. Such bands were not observed after NO adsorption at r.t. on Nb2O5/SBA-15 containing niobium located exclusively in Nb2O5 crystals (Figure 5A). Thus, the bands at 1709 and 1682 cm−1 observed after NO adsorption at r.t. on Nb-15/SBA-15 (Figure 5B) and also on Nb-25/SBA-15 (Figure 5C, the second band shifted to 1684 cm−1) containing niobium located in both, Nb2O5 crystals and in the silica matrix, allowed us to assign them to dimers adsorbed on niobium cations in the silica skeleton. Cationic niobium (LAS) was identified earlier in niobium containing mesoporous silicas of various types (e.g., [28,31,33,34]). The generation of niobium LAS in the silica matrix is accompanied by the formation of the skeleton NbO species (basic/redox sites) at which nitrogen(II) oxide is also chemisorbed. In fact, the vibrations in (NbO-NO) complex giving the infrared band at 1634–1637 cm−1 are well visible in the spectra of Nb-15/SBA-15 and Nb-25/SBA-15 after heating at 100 °C. It is especially pronounced on the latter material with the larger niobium loading. The most intense bands in the spectra of NO adsorbed on impregnated materials after heating at 300 °C are the ones at 1606 cm−1 and 1609 cm−1 for Nb-25/SBA-15 and Nb-15/SBA-15, respectively. For the former material the band did not change its position depending on the temperature treatment, whereas for the latter sample the position of the band was at a higher wavenumber than after adsorption at r.t. (1609 cm−1 vs. 1619 cm−1). Thus, for Nb-25/SBA-15, one can postulate that the band at 1606 cm−1 originates exclusively from the vibrations in bridged nitrato (NbO)2-NO species [28,31].
To sum up, NO adsorption study allowed the identification of Lewis acid and basic sites, while the pyridine adsorption gave information about the nature (LAS and BAS), concentration and strength of acidic sites. Nb2O5/SBA-15 had only weak Lewis acid sites able to adsorb NO at higher temperatures, but they were not able to adsorb pyridine in the conditions of the study. This catalyst presented weak Brønsted acid sites, which was confirmed by the appearance of FTIR bands at 1447 cm−1 and 1597 cm−1 assigned to pyridine hydrogen bonded to OH groups on the catalyst surface. NO adsorption led to the identification of Lewis acid-base pairs on the surface of impregnated samples (Nb-15/SBA-15 and Nb-25/SBA-15) in the form of framework niobium cations (LAS) and NbO species in the silica skeleton. The framework LAS and BAS were detected on both impregnated catalysts by pyridine adsorption. The highest concentration of LAS and BAS was on Nb-15/SBA-15 surface, whereas the higher strength of both types of acidic centers, but especially BAS, was observed for Nb-25/SBA-15 material. After silylation, the number of both types of acidic centers and the BAS/LAS ratio decreased.

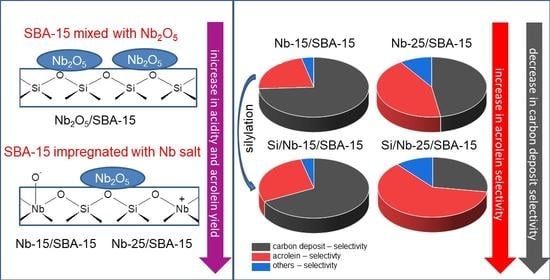
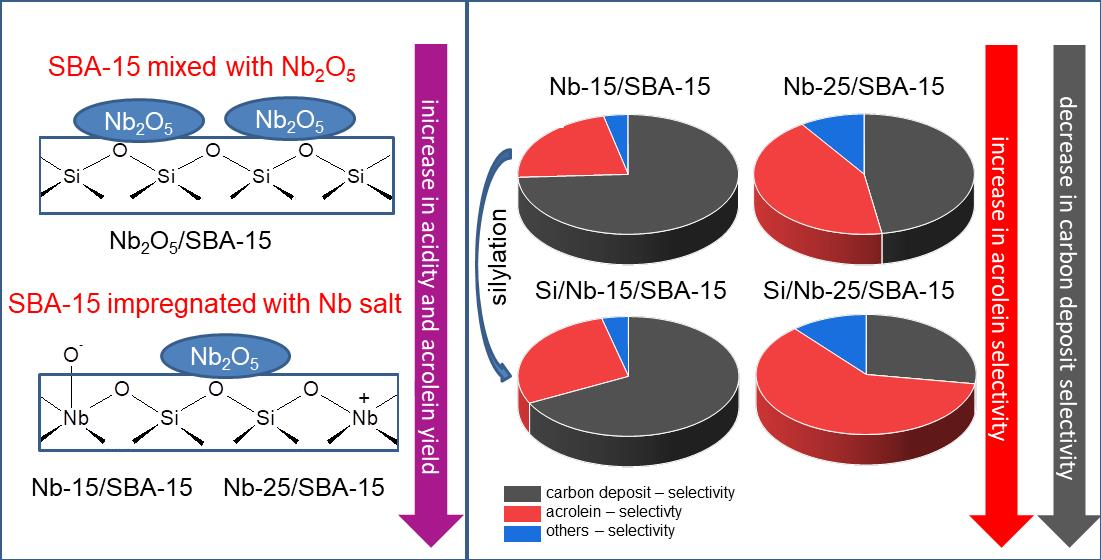
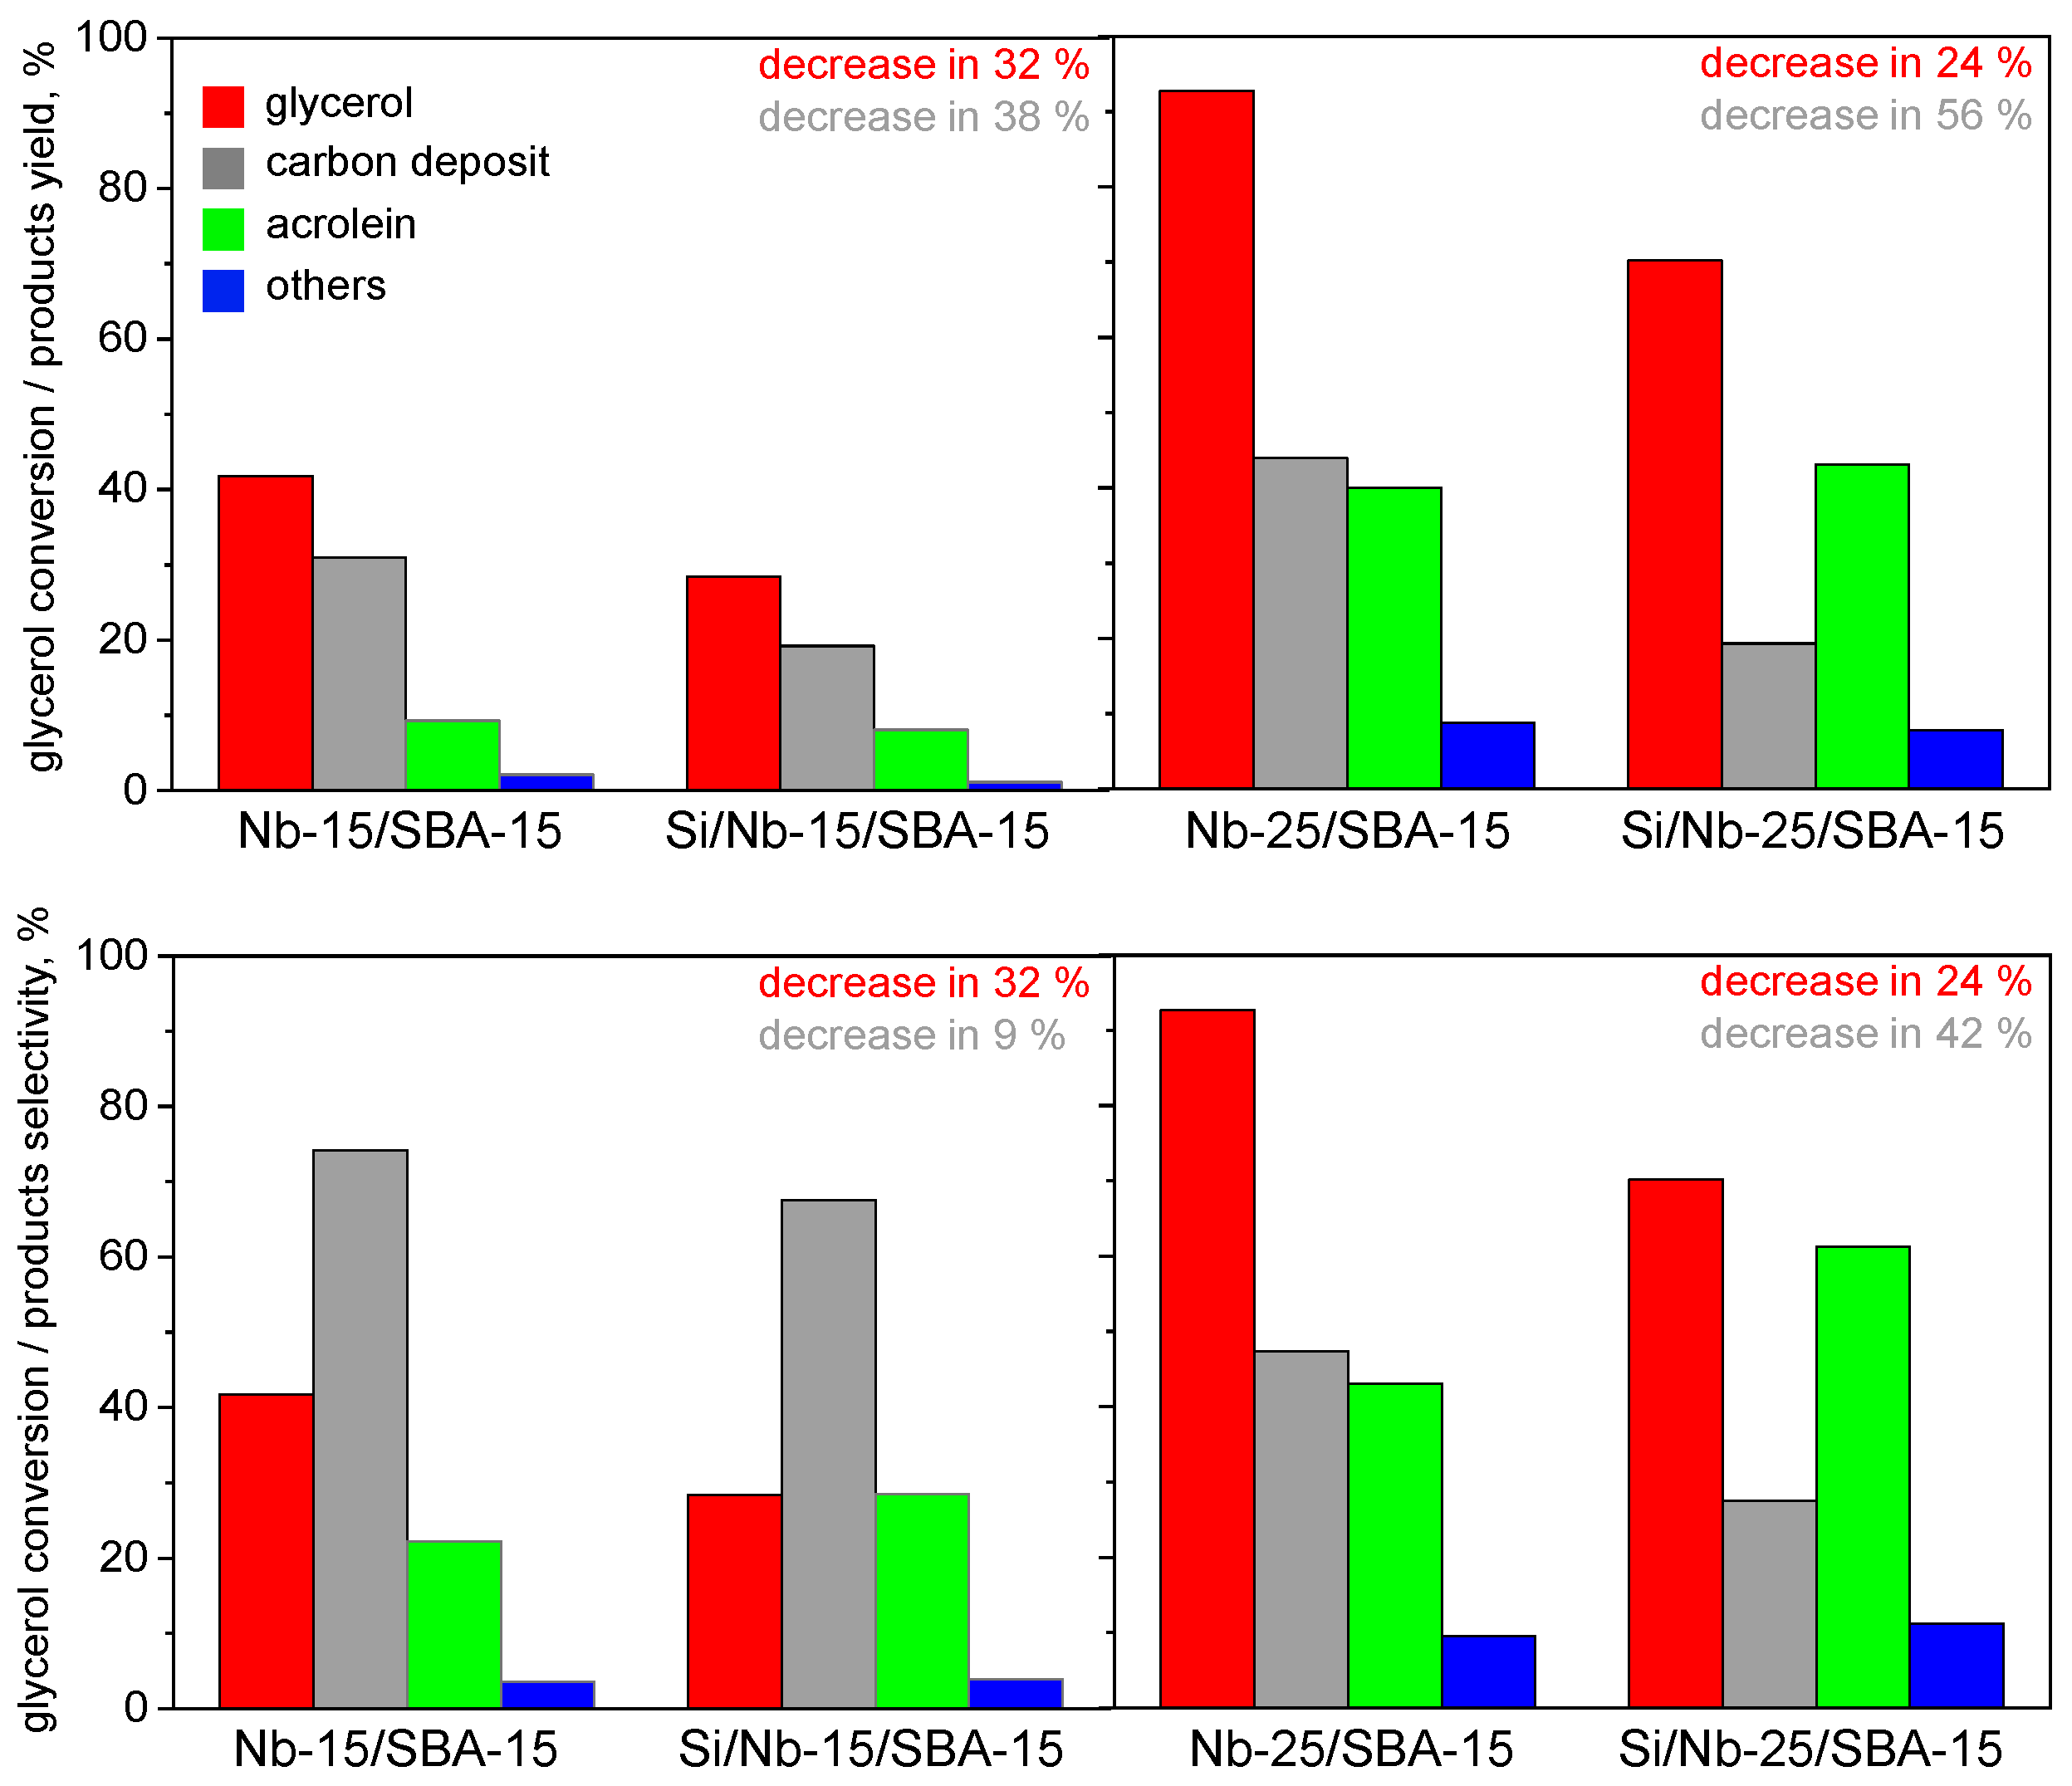
2.3. Glycerol Dehydration

Acrolein is the target product of glycerol dehydration. Although most authors (e.g., [4,5] review papers) have indicated that Brønsted acid sites are responsible for the reaction pathway leading to acrolein formation via 3-hydroxypropanal intermediate product, whereas Lewis acid sites activate dehydration of glycerol to hydroxyacetone, one has to take into account that LAS can be transformed to pseudo-Brønsted acid sites in the presence of H2O in the reaction medium [35]. Therefore, in the analysis of activity and selectivity in glycerol dehydration, both BAS and LAS should be taken into account.
The catalyst activities (expressed as glycerol conversion and turnover frequency—TOF), the yields of products and the selectivities to each of them, in glycerol dehydration performed in the presence of all catalysts used in this work are presented in Supplementary Table S1 and Figure 6 and Figure 7. Acrolein is the main reaction product formed in the presence of all investigated catalysts, although the yield of this product differs significantly depending on both, glycerol conversion and coke deposit. The activity of the SBA-15 support is negligible. It is clear that Nb-25/SBA-15 and silylated Si/Nb-25/SBA-15 catalysts showed the highest activity (expressed by both glycerol conversion and TOF—Figure 6A) from among all materials used, with the silylated sample giving a lower glycerol conversion. The same was observed for the acrolein yield (Figure 6C), although the difference in the yield of this product over both catalysts was much smaller than that for glycerol conversion. Moreover, the selectivity to acrolein was the highest on silylated Si/Nb-25/SBA-15 material (Figure 6B). With the increase in glycerol conversion, the selectivity to acrolein slightly increased (Figure 6D). The catalysts with a lower niobium content (15 wt.%) revealed significantly lower activity and acrolein yield, however, some differences were observed to be dependent on the modification method. Nb-15/SBA-15 and Si/Nb-15/SBA-15 prepared by the impregnation method showed much higher glycerol conversion than Nb2O5/SBA-15. The difference was smaller in the acrolein yield. Independently of the preparation methods, silylated materials were less active than the starting niobium-containing materials. The other products which were formed in glycerol dehydration were: acetaldehyde, acetone, acetic acid and hydroxyacetone (Supplementary Table S1). Hydroxyacetone is a characteristic product for the glycerol dehydration pathway which occurs on Lewis acid sites. The highest yield of this product was observed for Nb-25/SBA-15 and Si/Nb-25/SBA-15 but the selectivity to hydroxyacetone was relatively low, i.e., ≤5% (in comparison to acrolein selectivity > 61% for Si/Nb-25/SBA-15). Acetaldehyde was another product which was obtained in small but significant quantities (selectivity ca. 6%) on the samples with 25 wt.% of niobium loading and on Nb2O5/SBA-15, Si/Nb2O5/SBA-15. It is produced by thermal decomposition of acrolein [4]. This product was obtained in much smaller amounts (selectivity ca. 2%) when the reaction was performed on Nb-15/SBA-15 and Si/Nb-15/SBA-15. Thus, one can suggest that thermal decomposition of acrolein is due to the presence of crystalline niobium(V) oxide on the catalyst surface, which was much lower on Nb-15/SBA-15 sample.
Taking into account that the number of BAS and LAS on the surface of Nb-15/SBA-15 was much higher than that on Nb-25/SBA-15, it was concluded that the materials with a too high concentration of acidic centers were ineffective in catalytic dehydration of glycerol to acrolein. It is in line with literature data [4,36] showing that high density of acid sites may reduce acrolein production. A high BAS/LAS ratio (much higher for Nb-15/SBA-15 than for Nb-25/SBA-15) was also not conducive to a high yield of acrolein. However, the strength of BAS was significantly higher for Nb-25/SBA-15, and therefore, a correlation between the activity and acrolein yield and the presence of strong BAS is postulated. Moreover, Wang et al. [37] have suggested that Lewis acid sites in ZSM-5 zeolite could enhance the formation of acrolein in a cooperative mechanism. To achieve such a cooperative action, LAS would have to be in direct vicinity of BAS. Such a close proximity of LAS and BAS is possible in Nb-25/SBA-15, containing the highest niobium loading in comparison with the other materials used. Thus, one can postulate that both the strength of BAS and the proximity of LAS and BAS on the surface of Nb-25/SBA-15 can contribute to the highest activity and selectivity to acrolein in glycerol dehydration.
An important feature of the catalysts applied in glycerol dehydration to acrolein is their stability. The main reason for the catalyst deactivation is coke formation. It has been established [9,35] that Brønsted acid sites are involved in intramolecular reactions resulting in the formation of coke, and consequently, provoking the deactivation of catalysts. In our work, coke deposit formation was evaluated by different manners. Figure 8 shows the UV-Vis spectra of the samples before and after glycerol dehydration and the photos of catalysts after the reaction. The photos clearly show the highest coke deposit on Nb-25/SBA-15 (the picture is deep black). The increase in the intensity of the UV-Vis spectral line in the range 400–800 nm in the spectra of the catalysts after dehydration of glycerol also confirms coke deposition, which was the highest for Nb-25/SBA-15. Interestingly, after silylation of this catalyst (Si/Nb-25/SBA-15), the color of the catalyst pellets was considerably lighter and the increase in the UV-Vis spectral line was less pronounced. A similar effect was observed for the silylated Si/Nb-15/SBA-15 although the differences in color intensity between the silylated and pristine materials were smaller. Thanks to the large pore sizes in all catalysts used, the coke deposit loaded during 4 h of the reaction did not decrease the glycerol conversion for most of the catalysts (Figure 6). Only for Nb-25/SBA-15 and Si/Nb-25/SBA-15 was a slightly decrease in activity observed.
To calculate the amount of coke deposit and selectivity of its formation the elemental and thermogravimetric analyses of the catalysts after 4 h of the reaction were performed. All the results of thermogravimetric analyses are presented in Supplementary Figure S4, whereas the exemplary spectra are shown in Figure 9. Supplementary Figure S5 presents the TG and DTG curves characteristic of glycerol loaded into mesopores of SBA-15. On the basis of these curves, the percentage of mass loss for temperatures up to 350 °C was assigned to the unreacted glycerol that resided in the catalysts pores (the percentage of unreacted glycerol estimated from the mass loss has been referred to the amount of C in mmol/g obtained from elemental analyses of the spent catalysts; the obtained value was added to the unreacted glycerol analyzed by GC/MS in post-reaction mixture), whereas the percent of mass loss in the region 350 °C to 800 °C was due to coke deposit. A similar method for assignment of coke deposition was applied in [16]. Figure 7 shows glycerol conversion and yield/selectivity of the reaction products, including coke deposit collected, during 4 h of the reaction for the most active niobium impregnated materials. The higher the glycerol conversion, the higher the amount of coke deposited (yield of coke). Silylation of pristine niobium catalysts caused a decrease in both glycerol conversion and coke deposition. However, the degree of glycerol conversion decrease was lower than that in the amount of coke deposited, for both niobium impregnated materials. This effect is well illustrated by the diagrams showing the selectivity of the reaction to the products and it is the most pronounced in Nb-25/SBA-15 and Si/Nb-25/SBA-15 catalysts (Figure 7). The silylation of the material led to ca. twice higher reduction of coke formation than the decrease in glycerol conversion. The decrease in the concentration of acidic sites in Si/Nb-25/SBA-15 in comparison with the concentration of these sites in Nb-25/SBA-15 resulted in the larger separation of acidic centers. Glycerol products and intermediates chemisorbed on acidic centers located in close proximity (a higher concentration of BAS and LAS as in Nb-25/SBA-15) interacted much more easily with the formation of multimolecular components present in coke than if the acid sites are separated. Moreover, the selectivity to acrolein production significantly increased over the silylated catalyst. Again, such an effect was more visible for the materials with larger amount of niobium introduced via impregnation. Thus, to sum up, the silylation procedure of niobium containing SBA-15 prepared by the impregnation method, leading to location of niobium in the silica framework, can be proposed as anti-coke procedure in the catalysts preparation.

3. Materials and Methods

3.1. Materials

  • Pluronic P123 (Aldrich, St. Louis, MO, USA);
  • HCl (Stanlab, Lublin, Poland);
  • Tetraethoxysilane (TEOS) (Aldrich, St. Louis, MO, USA);
  • Ammonium niobate(V) oxalate (Aldrich, St. Louis, MO, USA);
  • Nb2O5 (CBMM, Araxá, Minas Gerais, Brazil);
  • (3-aminopropyl)trimethoxysilane (APTMS) (Aldrich, St. Louis, MO, USA);
  • Toluene (Stanlab, Lublin, Poland);
  • Acetonitrile (Aldrich, St. Louis, MO, USA);
  • Pyridine (Aldrich, St. Louis, MO, USA);
  • Glycerol (Aldrich, St. Louis, MO, USA);
  • Hydroquinone (Aldrich, St. Louis, MO, USA).

3.2. Catalysts Preparation

3.2.1. Synthesis of SBA-15

The synthesis of SBA-15 was performed according to the procedure described in [22]. First, Pluronic P123 (poly(ethylene glycol)-block-poly(propylene glycol)-block-poly(ethylene glycol)-block) (16 g) as an nonionic surfactant was dissolved in 600 mL of 0.7 M HCl solution at 35–40 °C in a polypropylene bottle. After surfactant dissolution, TEOS (34.108 g) as a silica source was added into the synthesis gel. The mixture was then stirred at 35–40 °C for 20 h and heated in an oven at 100 °C for 24 h. The obtained powder was then filtered, washed with distilled water (1200 mL), and dried at room temperature (r.t.). The template was removed by calcination at 500 °C for 8 h.

3.2.2. SBA-15 Modification with Niobium Precursor

The niobiosilicas were synthesized by two strategies: (i) SBA-15 modification with ammonium niobate(V) oxalate by impregnation method or (ii) SBA-15 mixing with amorphous Nb2O5.
The samples modified with ammonium niobate(V) oxalate were prepared as follows. A portion of 2.2 g of dried silica (previously outgassed at 80 °C for 1 h) was put into the flask together with ammonium niobate(V) oxalate (1.91 g or 3.61 g, 15 wt.% or 25 wt.% of niobium, respectively) previously dissolved in distilled water (20 mL). The nominal Si/Nb molar ratio was 8.9 and 4.6 for 15 wt.% and 25 wt.% of niobium, respectively. The mixture obtained was then rotated in a vacuum evaporator at 100 °C until water evaporated. Then the solid material was dried at 110 °C for 18 h and calcined at 500 °C for 4 h. The samples obtained were denoted as Nb-15/SBA-15 (15 wt.% of niobium) and Nb-25/SBA-15 (25 wt.% of niobium).
The modification of SBA-15 with amorphous Nb2O5 was performed as follows. A portion of 2.2 g of silica previously dried overnight at 100 °C was mixed with 0.55 g of Nb2O5 (15 wt.% of niobium). The nominal Si/Nb molar ratio was 8.9. The mixture obtained was then ground in an agate pot for one hour. Then, the solid material was calcined at 500 °C for 4 h. The sample obtained was denoted as Nb2O5/SBA-15.

3.2.3. Silylation of Niobiosilicas

The obtained niobiosilicas were then modified with (3-aminopropyl)trimethoxysilane (APTMS) by the grafting method, as described below. One gram of the solid (first dried overnight at 100 °C) and 100 mL of toluene were put together into a flask. Then APTMS (2.5 mL) was added to the solution and the mixture was stirred and heated at 100 °C for 18 h. The powder was filtered off, washed sequentially with 156 mL of toluene, 78 mL of water, and 16 mL of acetonitrile and dried overnight at 80 °C. The samples modified with APTMS were then calcined at 500 °C for 4 h to generate the silanol species on niobiosilicas surface. The samples obtained were denoted as Si/Nb-15/SBA-15, Si/Nb-25/SBA-15, and Si/Nb2O5/SBA-15.

3.3. Samples Characterization

The obtained samples were examined by several analytical techniques such as: N2 adsorption/desorption (Micromeritics, Norcross, GA, USA), XRD (Bruker, Karlsruhe, Germany), UV-Vis (Candela, Warszawa, Poland), elemental analysis, DTA/TG, FTIR (Bruker, Poznan, Poland) combined with pyridine or NO adsorption. The catalytic activity of the synthesized samples was examined in the gas phase glycerol dehydration.
N2 adsorption/desorption isotherms were recorded using ASAP 2020 apparatus (Micromeritics, Norcross, GA, USA). At first the samples were outgassed under vacuum at 300 °C for 8 h. The surface area was calculated using the BET method, whereas the pore volume and diameter were determined by DFT method appropriate for mesoporous silicas with cylindrical pore system. The DFT method was attached to the MicroActive software (Version 4.0) from Micromeritics.
XRD patterns were recorded at r.t. on a Bruker AXS D8 Advance apparatus (Bruker, Karlsruhe, Germany) using CuKα radiation (γ = 0.154 nm), with a step of 0.02° in the small-angle and 0.05° in the wide-angle range, respectively.
UV–Vis spectra were recorded using a Varian-Cary 300 Scan UV–Visible Spectrophotometer (Candela, Warszawa, Poland). The catalysts dried overnight at 100 °C were placed in a cell equipped with a quartz window. The spectra were recorded in the range between 800–190 nm. Spectralon was used as a reference sample.
Elemental analyses of the samples before and after glycerol dehydration were carried out on an Elemental AnalyserVario EL III.
DTA/TGA measurements of samples after glycerol dehydration were performed in an air atmosphere using a SETARAM SETSYS-12 apparatus in the temperature range 100–800 °C with a temperature ramp 10 °C/min. Prior to analysis the isothermal drying plateau at 100 °C for 15 min was applied.
Infrared spectra combined with pyridine adsorption were recorded using a Bruker INVENIO S (Bruker, Poznan, Poland) spectrometer with an in situ vacuum cell. Before the measurement, catalysts were formed into thin wafers and placed inside the cell. The cell with the sample was then outgassed at 400 °C for 2 h. After this step, pyridine was admitted at 150 °C. After saturation with pyridine, the solid was degassed at 150 °C, 200 °C, 250 °C and 300 °C in vacuum for 30 min at each temperature. The spectrum without adsorbed pyridine (after sample activation at 400 °C for 2 h) was subtracted from all recorded spectra. The numbers of Lewis and Brønsted acidic sites were calculated assuming the extinction coefficient ε for the band at 1455 cm−1 = 2.22 µmol−1 cm (Lewis acid sites) and for the band at 1545 cm−1 = 1.67 µmol−1 cm (Brønsted acidic sites) [30].
Infrared spectra combined with NO adsorption were acquired with a Vertex 70 spectrometer (Bruker, Poznan, Poland) using an in situ vacuum cell. The solid materials were pressed into a thin wafer and immersed inside the cell. Before NO admission, the cell with the sample was outgassed at 400 °C for 2 h. Then, the NO was admitted at r.t. and after 10 min of sample saturation with NO the spectrum was recorded. At the next step, the catalyst was heated for 30 min at 100 °C, 200 °C, and 300 °C. After each temperature treatment, an FTIR spectrum of the sample was recorded. The spectrum without the adsorbed probe molecule (“background spectrum”—after samples evacuation at 400 °C for 2 h) was subtracted from all recorded spectra.

3.4. Glycerol Dehydration

A portion of 0.1 g of granulated (0.5 < ø < 1 mm) catalyst was placed in the reactor and activated at 400 °C for 2 h under argon flow (50 mL/min). Then, the temperature was set to 350 °C for the reaction. Next, 4 mL of aqueous solution of glycerol (10 wt.%) was passed continuously for 4 h using a pump system (KD Scientific) together with a carrier gas (50 mL/min). The reaction products were collected within each hour in an aqueous solution of hydroquinone (0.001 wt.%, 5 mL) and then analyzed by a gas chromatograph (Thermo Scientific, Waltham, Massachusetts, USA) equipped with a DB-1 column (30 m) and a MS detector. Helium was used as a carrier gas. To determine the concentration of reaction products, the calibration curves were used.

4. Conclusions

The presented results have pointed out a significant difference in the niobium acid-base properties depending on the metal location in the SBA-15 ordered mesoporous silica. The presence of only very weak BAS and LAS was indicated in the materials containing exclusively crystalline Nb2O5 on the SBA-15 surface. Stronger BAS and LAS were observed in the samples in which niobium was located not only in the anchored crystalline metal oxide but also in the silica framework. The niobium species in such positions played an important role as active centers in glycerol dehydration to acrolein. High concentration of framework niobium BAS was not conducive to a high acrolein yield. The lower concentration of BAS and the possible proximity of LAS and BAS on the surface of Nb-25/SBA-15 as well as the highest strength of BAS in this sample were postulated as the reasons for the highest activity and very high yield/selectivity to acrolein in glycerol dehydration. Silylation of niobium containing SBA-15 samples, in which niobium was located in the silica framework, resulted in the catalyst showing some decrease in glycerol conversion, but a significant decrease in coke deposition accompanied by an increase in acrolein selectivity. This effect was especially visible for Si/Nb-25/SBA-15. Thus, the anti-coke behavior of silylated Nb/SBA-15 catalysts, especially for the materials with high niobium loading (25 wt.%), for glycerol dehydration, was postulated.

Supplementary Materials

The following are available online at https://www.mdpi.com/article/10.3390/catal11040488/s1, Figure S1: N2 adsorption/desorption isotherms of SBA-15 before and after its modification with niobium species and silylation, Figure S2: FTIR spectra of the samples after pyridine adsorption at 150 °C (a) and desorption at 150–300 °C for 30 min (150 °C (b); 200 °C (c); 250 °C (d); 300 °C (e)). The spectra of activated samples (i.e., catalysts pretreated at 400 °C in vacuum for 2 h) were subtracted from recorded spectra. Spectra were normalized to 10 mg of the catalyst, Figure S3: FTIR spectra in hydroxyl region of Nb2O5/SBA-15 after evacuation at 400 °C for 2 h ((a)—black line) and pyridine adsorption at 150 °C ((b)—red line), Figure S4: Thermogravimetric analyses of catalysts after 4 h of glycerol dehydration, Figure S5: Thermogravimetric analysis of SBA-15 material mixed with glycerol, Table S1: Results of glycerol dehydration. Conditions: mass of catalyst: 100 mg; catalyst pretreating: 2 h 400 °C in argon flow; reaction temperature: 350 °C; speed of glycerol dosing: 1 mL/h; Ar flow: 50 mL/min. Conversion of glycerol calculated from the total yield of products.

Author Contributions

Conceptualization, K.S.; methodology, K.S. and M.T.; validation, K.S. and M.Z.; formal analysis, K.S.; investigation, K.S.; resources, M.Z. and M.T.; data curation, K.S.; writing—original draft preparation, K.S. and M.Z.; writing—review and editing, K.S., M.Z., and M.T.; visualization, K.S.; supervision, M.Z.; project administration, K.S. and M.Z.; funding acquisition, M.Z. All authors have read and agreed to the published version of the manuscript.

Funding

This research was funded by National Science Centre in Poland, grant number UMO-2018/29/B/ST5/00137. The APC was funded by National Science Centre in Poland, grant number UMO-2018/29/B/ST5/00137.

Data Availability Statement

Data is contained within the article or supplementary material. Data sharing is not applicable to this article.

Acknowledgments

National Science Center in Poland (project no. 2018/29/B/ST5/00137) is acknowledged for financial support. A. Piaszczynska is acknowledged for assistance in a part of the experimental work.

Conflicts of Interest

The authors declare no conflict of interest. The funders had no role in the design of the study; in the collection, analyses, or interpretation of data; in the writing of the manuscript, or in the decision to publish the results.

References

  1. Zheng, Y.; Chen, X.; Shen, Y. Commodity chemicals derived from glycerol, an important biorefinery feedstock. Chem. Rev. 2008, 108, 5253–5277. [Google Scholar] [CrossRef]
  2. Zhou, C.H.; Beltramini, J.N.; Fan, Y.-X.; Lu, G.Q. Chemoselective catalytic conversion of glycerol as a biorenewable source to valuable commodity chemicals. Chem. Soc. Rev. 2008, 37, 527–549. [Google Scholar] [CrossRef]
  3. Tan, H.W.; Abdul Aziz, A.R.; Aroua, M.K. Glycerol production and its applications as a raw material: A review. Renew. Sustain. Energy Rev. 2013, 27, 118–127. [Google Scholar] [CrossRef]
  4. Cecilia, J.A.; García-Sancho, C.; Jiménez-Gómez, C.P.; Moreno-Tost, R.; Maireles-Torres, P. Porous silicon-based catalysts for the dehydration of glycerol to high value-added products. Materials 2018, 11, 1569. [Google Scholar] [CrossRef] [Green Version]
  5. Wu, S.T.; She, Q.M.; Tesser, R.; Di Serio, M.; Zhou, C.H. Catalytic glycerol dehydration-oxidation to acrylic acid. Catal. Rev. Sci. Eng. 2020, 62, 481–523. [Google Scholar] [CrossRef]
  6. Avalos, A.S.; Hakkarainen, M.; Odelius, K. Superiorly plasticized PVC/PBSA blends through crotonic and acrylic acid functionalization of PVC. Polymers 2017, 9, 84. [Google Scholar] [CrossRef] [Green Version]
  7. Cabana, S.; Lecona-Vargas, C.S.; Meléndez-Ortiz, H.I.; Contreras-García, A.; Barbosa, S.; Taboada, P.; Magariños, B.; Bucio, E.; Concheiro, A.; Alvarez-Lorenzo, C. Silicone rubber films functionalized with poly(acrylic acid) nanobrushes for immobilization of gold nanoparticles and photothermal therapy. J. Drug Deliv. Sci. Technol. 2017, 42, 245–254. [Google Scholar] [CrossRef]
  8. Riccardi, C.M.; Kasi, R.M.; Kumar, C.V. Nanoarmoring of Enzymes by Interlocking in Cellulose Fibers with Poly(Acrylic Acid), 1st ed.; Elsevier Inc.: Amsterdam, The Netherlands, 2017; Volume 590. [Google Scholar]
  9. Foo, G.S.; Wei, D.; Sholl, D.S.; Sievers, C. Role of Lewis and Brønsted acid sites in the dehydration of glycerol over niobia. ACS Catal. 2014, 4, 3180–3192. [Google Scholar] [CrossRef]
  10. Copeland, J.R.; Santillan, I.A.; Schimming, S.M.N.; Ewbank, J.L.; Sievers, C. Surface interactions of glycerol with acidic and basic metal oxides. J. Phys. Chem. C 2013, 117, 21413–21425. [Google Scholar] [CrossRef]
  11. Nimlos, M.R.; Blanksby, S.J.; Qian, X.; Himmel, M.E.; Johnson, D.K. Mechanisms of glycerol dehydration. J. Phys. Chem. A 2006, 110, 6145–6156. [Google Scholar] [CrossRef]
  12. Park, H.; Yun, Y.S.; Kim, T.Y.; Lee, K.R.; Baek, J.; Yi, J. Kinetics of the dehydration of glycerol over acid catalysts with an investigation of deactivation mechanism by coke. Appl. Catal. B Environ. 2015, 176–177, 1–10. [Google Scholar] [CrossRef]
  13. Tsukuda, E.; Sato, S.; Takahashi, R.; Sodesawa, T. Production of acrolein from glycerol over silica-supported heteropoly acids. Catal. Commun. 2007, 8, 1349–1353. [Google Scholar] [CrossRef]
  14. Lee, Y.Y.; Moon, D.J.; Kim, J.H.; Park, N.C.; Kim, Y.C. Studies on the dehydration of glycerol over niobium catalysts. J. Nanosci. Nanotechnol. 2011, 11, 7128–7131. [Google Scholar] [CrossRef] [PubMed]
  15. Chai, S.H.; Wang, H.P.; Liang, Y.; Xu, B.Q. Sustainable production of acrolein: Gas-phase dehydration of glycerol over Nb2O5 catalyst. J. Catal. 2007, 250, 342–349. [Google Scholar] [CrossRef]
  16. Shiju, N.R.; Brown, D.R.; Wilson, K.; Rothenberg, G. Glycerol valorization: Dehydration to acrolein over silica-supported niobia catalysts. Top. Catal. 2010, 53, 1217–1223. [Google Scholar] [CrossRef] [Green Version]
  17. Carniti, P.; Gervasini, A.; Marzo, M. Dispersed NbOx catalytic phases in silica matrixes: Influence of niobium concentration and preparative route. J. Phys. Chem. C 2008, 112, 14064–14074. [Google Scholar] [CrossRef]
  18. Li, W.; Xu, K.; Xu, L.; Hu, J.; Ma, F.; Guo, Y. Preparation of highly ordered mesoporous AlSBA-15-SO3H hybrid material for the catalytic synthesis of chalcone under solvent-free condition. Appl. Surf. Sci. 2010, 256, 3183–3190. [Google Scholar] [CrossRef]
  19. Thommes, M.; Kaneko, K.; Neimark, A.V.; Olivier, J.P.; Rodriguez-Reinoso, F.; Rouquerol, J.; Sing, K.S.W. Physisorption of gases, with special reference to the evaluation of surface area and pore size distribution (IUPAC Technical Report). Pure Appl. Chem. 2015, 87, 1051–1069. [Google Scholar] [CrossRef] [Green Version]
  20. Wang, G.; Zhang, L.; Deng, J.; Dai, H.; He, H.; Au, C.T. Preparation, characterization, and catalytic activity of chromia supported on SBA-15 for the oxidative dehydrogenation of isobutane. Appl. Catal. A Gen. 2009, 355, 192–201. [Google Scholar] [CrossRef]
  21. Selvaraj, M.; Kawi, S.; Park, D.W.; Ha, C.S. A merit synthesis of well-ordered two-dimensional mesoporous niobium silicate materials with enhanced hydrothermal stability and catalytic activity. J. Phys. Chem. C 2009, 113, 7743–7749. [Google Scholar] [CrossRef]
  22. Kryszak, D.; Stawicka, K.; Calvino-Casilda, V.; Martin-Aranda, R.; Ziolek, M. Imidazole immobilization in nanopores of silicas and niobiosilicates SBA-15 and MCF—A new concept towards creation of basicity. Appl. Catal. A Gen. 2017, 531, 139–150. [Google Scholar] [CrossRef]
  23. Tranca, D.C.; Wojtaszek-Gurdak, A.; Ziolek, M.; Tielens, F. Supported and inserted monomeric niobium oxide species on/in silica: A molecular picture. Phys. Chem. Chem. Phys. 2015, 17, 22402–22411. [Google Scholar] [CrossRef] [PubMed] [Green Version]
  24. Tiozzo, C.; Bisio, C.; Carniato, F.; Gallo, A.; Scott, S.L.; Psaro, R.; Guidotti, M. Niobium–silica catalysts for the selective epoxidation of cyclic alkenes: The generation of the active site by grafting niobocene dichloride. Phys. Chem. Chem. Phys. 2013, 15, 13354–13362. [Google Scholar] [CrossRef]
  25. Van Der Voort, P.; Vansant, E.F. Silylation of the silica surface A review. J. Liq. Chromatogr. Relat. Technol. 1996, 19, 2723–2752. [Google Scholar] [CrossRef]
  26. Capel-Sanchez, M.C.; Barrio, L.; Campos-Martin, J.M.; Fierro, J.L. Silylation and surface properties of chemically grafted hydrophobic silica. J. Colloid Interface Sci. 2004, 277, 146–153. [Google Scholar] [CrossRef]
  27. Khabtou, S.; Chevreau, T.; Lavalley, J.C. Quantitative infrared study of the distinct acidic hydroxyl groups contained in modiifed Y zeolites. Microporous Mater. 1994, 3, 133–148. [Google Scholar] [CrossRef]
  28. Stawicka, K.; Decyk, P.; Wojtaszek-Gurdak, A.; Ziolek, M. Comparative study of acid-basic properties of MCF impregnated with niobium and cerium species. Catal. Today 2019, 325, 2–10. [Google Scholar] [CrossRef]
  29. Busca, G. Spectroscopic characterization of the acid properties of metal oxide catalysts. Catal. Today 1998, 41, 191–206. [Google Scholar] [CrossRef]
  30. Emeis, C.A. Determination of integrated molar extinction coefficients for infrared absorption bands of pyridine adsorbed on solid acid catalysts. J. Catal. 1993, 141, 347–354. [Google Scholar] [CrossRef]
  31. Ziolek, M.; Sobczak, I.; Lewandowska, A.; Nowak, I.; Decyk, P.; Renn, M.; Jankowska, B. Oxidative properties of niobium-containing mesoporous silica catalysts. Catal. Today 2001, 70, 169–181. [Google Scholar] [CrossRef]
  32. Hadjiivanov, K.I. Identification of neutral and charged NxOy surface species by IR spectroscopy. Catal. Rev. Sci. Eng. 2000, 42, 71–144. [Google Scholar] [CrossRef]
  33. Ziolek, M.; Decyk, P.; Sobczak, I.; Trejda, M.; Florek, J.; Klimas, W.; Golinska, H.; Wojtaszek, A. Catalytic performance of niobium species in crystalline and amorphous solids—Gas and liquid phase oxidation. Appl. Catal. A Gen. 2011, 391, 194–204. [Google Scholar] [CrossRef]
  34. Wojtaszek, A.; Sobczak, I.; Ziolek, M. NO adsorption combined with FTIR spectroscopy as a useful tool for characterization of niobium species in crystalline and amorphous molecular sieves. Catal. Today 2012, 192, 149–153. [Google Scholar] [CrossRef]
  35. Alhanash, A.; Kozhevnikova, E.F.; Kozhevnikov, I.V. Gas-phase dehydration of glycerol to acrolein catalysed by cesium heteropoly salt. Appl. Catal. A Gen. 2010, 378, 11–18. [Google Scholar] [CrossRef]
  36. Lourenço, J.P.; Macedo, M.I.; Fernandes, A. Sulfonic-functionalized SBA-15 as an active catalyst for the gas-phase dehydration of glycerol. Catal. Commun. 2012, 19, 105–109. [Google Scholar] [CrossRef]
  37. Wang, Z.; Wang, L.; Jiang, Y.; Hunger, M.; Huang, J. Cooperativity of Brønsted and Lewis acid sites on zeolite for glycerol dehydration. ACS Catal. 2014, 4, 1144–1147. [Google Scholar] [CrossRef]
Figure 1. The small (left) and wide-angle (right) XRD patterns of the prepared catalysts and the wide-angle XRD database pattern of Nb2O5 (ICDD No. 00-007-0061).
Catalysts 11 00488 g001
Figure 3. FTIR spectra of the samples activated in vacuum at 400 °C for 2 h.
Catalysts 11 00488 g003
Figure 4. FTIR spectra of the catalysts after pyridine adsorption at 150 °C (A) and pyridine evacuation at 200 °C (B). The spectra of activated samples (i.e., catalysts pretreated at 400 °C in vacuum for 2 h) were subtracted from recorded spectra. Spectra were normalized to 10 mg of the catalyst.
Catalysts 11 00488 g004
Figure 6. Activity (A), selectivity to acrolein (B), yield of acrolein (C) and glycerol conversion vs. acrolein selectivity (D) of the catalysts in glycerol dehydration. Activity of catalysts expressed as turnover frequency (TOF) after 1 h of the reaction was calculated as mole of glycerol converted on one mole of BAS (detected by pyridine desorption at 250 °C) for one second. Conditions: mass of catalyst: 100 mg; catalyst pretreating: 2 h 400 °C in argon flow; reaction temperature: 350 °C; speed of glycerol dosing: 1 mL/h; Ar flow: 50 mL/min. Conversion of glycerol calculated from the total yield of products.
Catalysts 11 00488 g006
Figure 7. Glycerol conversion, the yield and selectivities of products after 4 h of the reaction performed on niobium impregnated materials. Conditions: mass of catalyst: 100 mg; catalyst pretreating: 2 h 400 °C in argon flow; reaction temperature: 350 °C; speed of glycerol dosing: 1 mL/h; Ar flow: 50 mL/min.
Catalysts 11 00488 g007
Figure 8. UV-Vis spectra of the samples before (red spectra) and after (black spectra) glycerol dehydration and photos of catalysts after the reaction.
Catalysts 11 00488 g008
Figure 9. Thermogravimetric analyses of the most active catalysts after 4 h of glycerol dehydration.
Catalysts 11 00488 g009
Figure 2. UV-Vis spectra of SBA-15, Nb2O5, SBA-15 modified with niobium species and silylated samples.
Catalysts 11 00488 g002
Figure 5. FTIR spectra of Nb2O5/SBA-15 (A), Nb-15/SBA-15 (B) and Nb-25/SBA-15 (C) after NO adsorption at room temperature (a) and heating at 100 °C (b), 200 °C (c) and 300 °C (d). The spectra of activated samples (i.e., catalysts pretreated at 400 °C in vacuum for 2 h) were subtracted from recorded spectra. Spectra were normalized to 10 mg of the catalyst.
Catalysts 11 00488 g005
Table 1. Texture/structure parameters of synthesized samples evaluated on the basis of N2 ads./des. isotherms and XRD patterns.
CatalystSurface Area, m2/gPore Volume, cm3/g
(BJH)
Pore Diameter, nm
(DFT)
dwall,
nm
Nb2O5
Average Crystal Size *, nm
SBA-15828 ± 2.00.6411.81.74-
Nb-15/SBA-15533 ± 1.20.469.72.2534
Nb-25/SBA-15441 ± 0.70.399.72.6668
Nb2O5/SBA-15674 ± 1.60.5310.82.2655
Si/Nb-15/SBA-15428 ± 0.90.389.72.6068
Si/Nb-25/SBA-15336 ± 0.50.319.72.9291
Si/Nb2O5/SBA-15500 ± 1.20.4210.12.5868
* evaluated from XRD patterns and using Scherrer’s equation.
Table 2. The number of acid sites in synthesized catalysts occupied by pyridine adsorbed at 150 °C and desorbed at 150 °C, 200 °C and 250 °C; calculated by the use of extinction coefficients from [30]: ɛ 1545 cm−1 = 1.67 μmol−1 cm; ε 1455 cm−1 = 2.22 μmol−1 cm.
CatalystLAS, μmol/g BAS, μmol/g BAS/LAS
200 °C250 °CPyridine Desorbed at 250 °C, % *150 °C200 °C250 °CPyridine Desorbed at 250 °C, % *200 °C
Nb-15/SBA-1562265831223860.35
Nb-25/SBA-153216502394660.28
Si/Nb-15/SBA-15148431652600.36
Si/Nb-25/SBA-152410581562670.25
* in relation to the amount of pyridine adsorbed at 200 °C—characteristic of acidic strength.
Publisher’s Note: MDPI stays neutral with regard to jurisdictional claims in published maps and institutional affiliations.

