Article

A Computational Method to Predict Effects of Residue Mutations on the Catalytic Efficiency of Hydrolases

Key Laboratory of Cell Differentiation and Apoptosis of Chinese Ministry of Education, School of Medicine, Shanghai Jiao Tong University, Shanghai 200025, China
*
Authors to whom correspondence should be addressed.
Catalysts 2021, 11(2), 286; https://doi.org/10.3390/catal11020286
Submission received: 1 February 2021 / Revised: 17 February 2021 / Accepted: 20 February 2021 / Published: 22 February 2021
(This article belongs to the Section Computational Catalysis)

Abstract

:
With scientific and technological advances, growing research has focused on engineering enzymes that acquire enhanced efficiency and activity. Thereinto, computer-based enzyme modification makes up for the time-consuming and labor-intensive experimental methods and plays a significant role. In this study, for the first time, we collected and manually curated a data set for hydrolases mutation, including structural information of enzyme-substrate complexes, mutated sites and Kcat/Km obtained from vitro assay. We further constructed a classification model using the random forest algorithm to predict the effects of residue mutations on catalytic efficiency (increase or decrease) of hydrolases. This method has achieved impressive performance on a blind test set with the area under the receiver operating characteristic curve of 0.86 and the Matthews Correlation Coefficient of 0.659. Our results demonstrate that computational mutagenesis has an instructive effect on enzyme modification, which may expedite the design of engineering hydrolases.

Graphical Abstract

1. Introduction

Enzymes, acting as biological catalysts, have a remarkable capacity to accelerate chemical reactions by 107–1019 fold [1], and make important contributions to shaping and controlling cellular life. For instance, kinases are indispensable for signal transduction and cell regulation [2]. ATPases have to do with activating transport to export toxins, wastes, and solutions, which block the cellular process [3]. Proteases implement a breakdown of large molecules into smaller ones to be absorbed, related to digestion of ingested proteins and protein catabolism [4,5]. Glycoses [6] and oxidoreductases [7] collaborate to create metabolic pathways and maintain a normal life. By virtue of their highly efficient catalytic activity, awesome biodegradability, extremely strong environmental tolerance, and exquisite substrate selectivity, enzymes are widely employed in the biofuel industry [8,9], biological detergents [10], brewing industry [11,12], food processing [13,14], etc. However, enzymes have finite productivity in vitro with a limitation that they only convert intrinsic substrates at high rates in vivo. Not only that, but wild-type enzymes also have challenges catalyzing non-natural substrates in the application of industry.
On the theoretical basis that amino acid sequence determines protein tertiary structure [15], a wide range of amino acid residues that form temporary bonds with substrates and make the catalytic reaction faster by lowering the activation energy, make up the functional sites and mediate various functions of enzymes. For this reason, the alteration of residues may give rise to the functional change of enzymes. Valine in position 56 of glutathione S-transferases (GSTs) formed hydrogen bonds with its substrate glutathione and a dramatic decrease in the thermodynamic stability would be seen when mutating the residue to alanine [16]. Mutations of the catalytic site of Candida Antarctica lipase B (CALB) W104V/A281Y/A282Y/V149G represented a 40-fold higher catalytic efficiency than wild-type in the hydrolysis reaction with 4-nitrophenyl benzoate since the mutations reshaped the structure of the active site and made it easier for 4-nitrophenyl benzoate to enter the catalytic site [17]. G136F mutant changed the substrate specificity of (R)-stereospecific amine transaminases (R-ATAs) on the account that this mutation altered the conformation of a loop next to the active site, accommodating larger substrate pro-sitagliptin ketone [18]. Hence, residue mutations typically have diverse abilities to fine-tune the functions of enzymes.
Enzyme engineering is proposed on the foundation of the above mentioned, which is generally utilized to broaden characters of enzymes (stability, expression level, catalytic activity, and specificity) and comprises two widespread strategies, including the de novo synthesis of new proteins by rational design [19,20,21,22] and the amino acid mutation of existing proteins by direct evolution [23,24,25,26,27,28]. The directed evolution method performs mutagenesis for iterative production of mutant libraries used to screen for enzyme variants with enhanced properties (thermal, pH, solvent, and activity), and an enormous amount of experimental effort will be made to confirm whether the enzymes have the desired character. The first direct evolution case of enzymes was published in 1991, when researchers successfully promoted the solvent resistance of a protease [29] by mutating triple residues D60N, Q103R and N218S and subsequently received increasing attention. Direct evolution still has shortcomings, notwithstanding, it does work in enzyme engineering, that it needs to build and screen large libraries where most variants have unclear or even counteractive activity, leading to slow progress in enzyme function optimization, and it is unable to meet keen demand of human development.
Computational methods of reconstructing enzymes have been the hotspot in recent years for the sake of their low cost and high efficiency because these methods enable to construct a prediction model to disclose the attributes of available mutant data and generate potential mutants, which greatly shortens the research cycle. To date, many computational approaches have been developed to predict enzymatic properties: CompassR-Strategy was provided to identify beneficial substitutions to improve enzyme performance by calculating the relative free energy of folding (ΔΔGfold) [30]. Knowledge-based method SDM web server was established to predict changes of mutations on protein stability and malfunction with statistical energy function [31]. Molecular dynamics method was also used to analyze flexibility and conformational changes on dynamics of various enzymes like α-amylases [32], xylanases [33], and β-fructosidases [34]. Amounts machine learning approaches also have been applied to enzyme engineering: Artificial neural networks and support vector machines were wielded to estimate stability alteration of proteins upon mutation [35,36]. Random forests were executed to forecast enzyme function by residue substitutions [37]. K-nearest-neighbors algorithm was applied to predict function [38] and mechanism [39] of enzymes.
Hydrolases, a class of enzymes that catalyze bond cleavages by reactions with water, are sufficient to digest macromolecules into fragments and supply the carbon sources needed for energy production. A few studies on the biological modification of hydrolases have been done. The first example, polyethylene terephthalate (PET) hydrolase, is one of the hotspots and wet experiments have shown that PET-depolymerization specific activity and thermos ability were improved after mutagenesis, hastening the decomposition cycle of plastic waste [40]. Meanwhile, to design and modify this enzyme more effectively, computational method GRAPE, a novel method combined with the greedy and clustering algorithms to obtain recombined Ideonella sakaiensis 201-F6 (IsPETase) and enhanced its degradation activity by 400-fold [41]. Rational design of epoxide hydrolases was operated to enhance their bio resolution of bulky pharmacy [42]. Engineered organophosphate hydrolase had dual functions and self-assembling ability, beneficial for the formation of catalytic biomaterials [43]. Two amino acid substitutions of butyrylcholinesterase (BChE) successfully accomplished the improvement of drug metabolism and clearance rate [44].
The above research illustrates that the directed evolution of hydrolases is indeed of essential significance yet to modify hydrolases and computational methods seem to be particularly meaningful to enhance the activity of enzymes, especially those beneficial to the environment like PETases. Moreover, these methods are requisite for the reason that it is quite labor-intensive and time-consuming to verify the effect of mutants by wet experiments. However, as shown above, computational methods to improve and tailor enzymes are mainly focused on enzyme stability based on thermodynamics calculation or the enzyme activity executed by molecular dynamics. Little attention is paid to the catalytic efficiency (Kcat/Km value) of the enzyme catalytic reaction. Hence, in this study, we proposed a computational method to predict the effect of residue mutations on the catalytic efficiency of hydrolases by comparing the generally acknowledged used assessment metric Kcat/Km ratio, where Kcat represents rate constants for the catalytic conversion of substrate into product and Km represents Michaelis constant. Here, we built a classification model based on historical data that described the catalytic effectiveness change between wild-type and mutated enzymes and then predicted new output (increasing-mutation and decreasing-mutation). The method may contribute to speeding up the engineering process of hydrolases.

2. Results

2.1. Data Set

The completed data set was composed of 314 mutations (77 increasing-mutation and 237 decreasing-mutation, see Supplementary File), distributed across 65 kinds of proteins from 33 organisms, combined with 68 kinds of various reaction substrates. To prevent bias on the method, we made the proportion of increasing-mutation and decreasing-mutation on training and test set, respectively, which was consistent with that on the primitive data set when separating the data. Eventually, the training set contained 257 mutations (65 increasing-mutation and 192 decreasing-mutation) and the test set embodied 57 mutations (12 increasing-mutation and 45 decreasing-mutation). Meanwhile, the total data were primarily distributed in 13 categories based on its specific hydrolysis reaction type (Figure 1), such as phosphohydrolysis (27.4%), proteolysis (8.3%), glutathione hydrolysis (0.3%), and dehalogenation (0.3%).

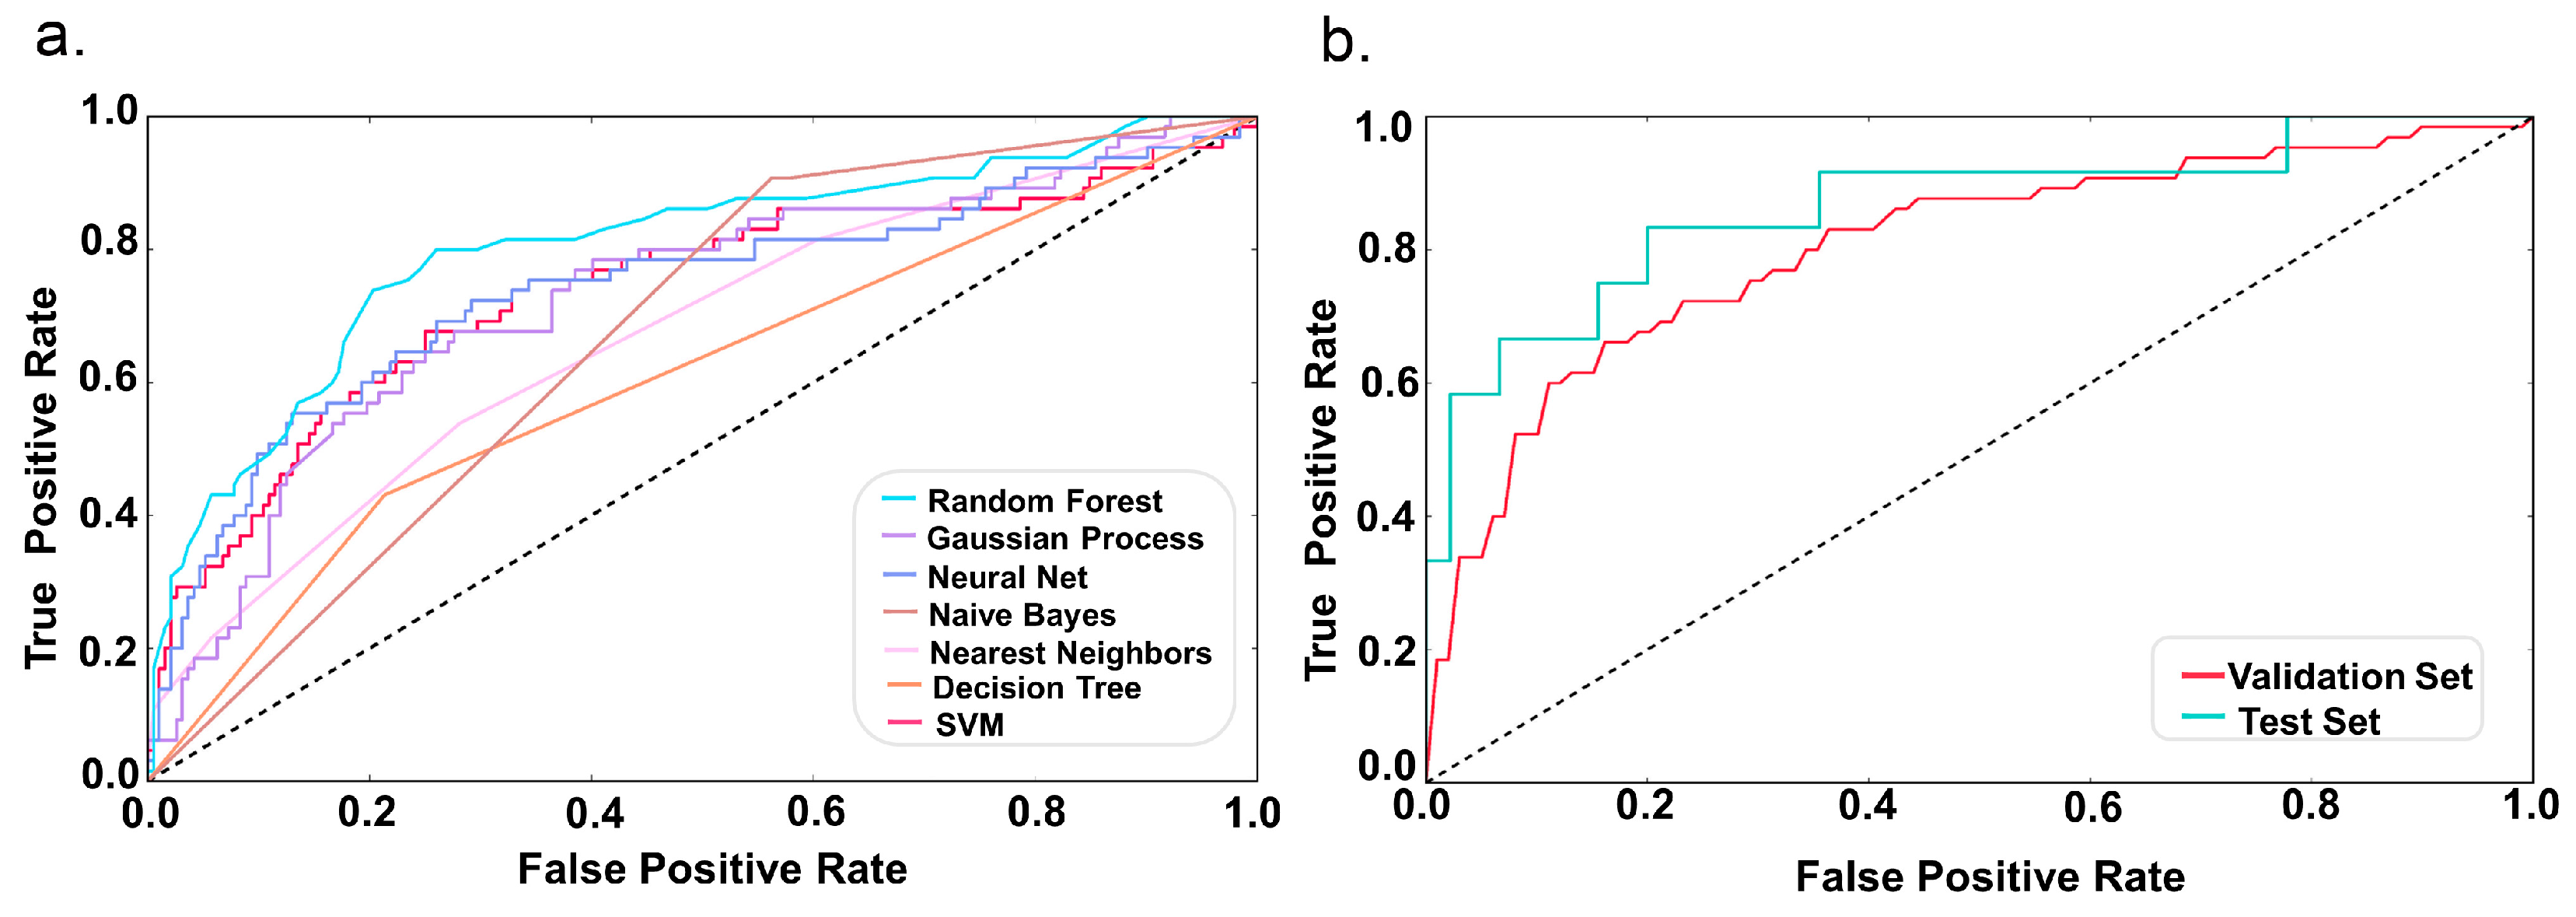
2.2. Model Performance
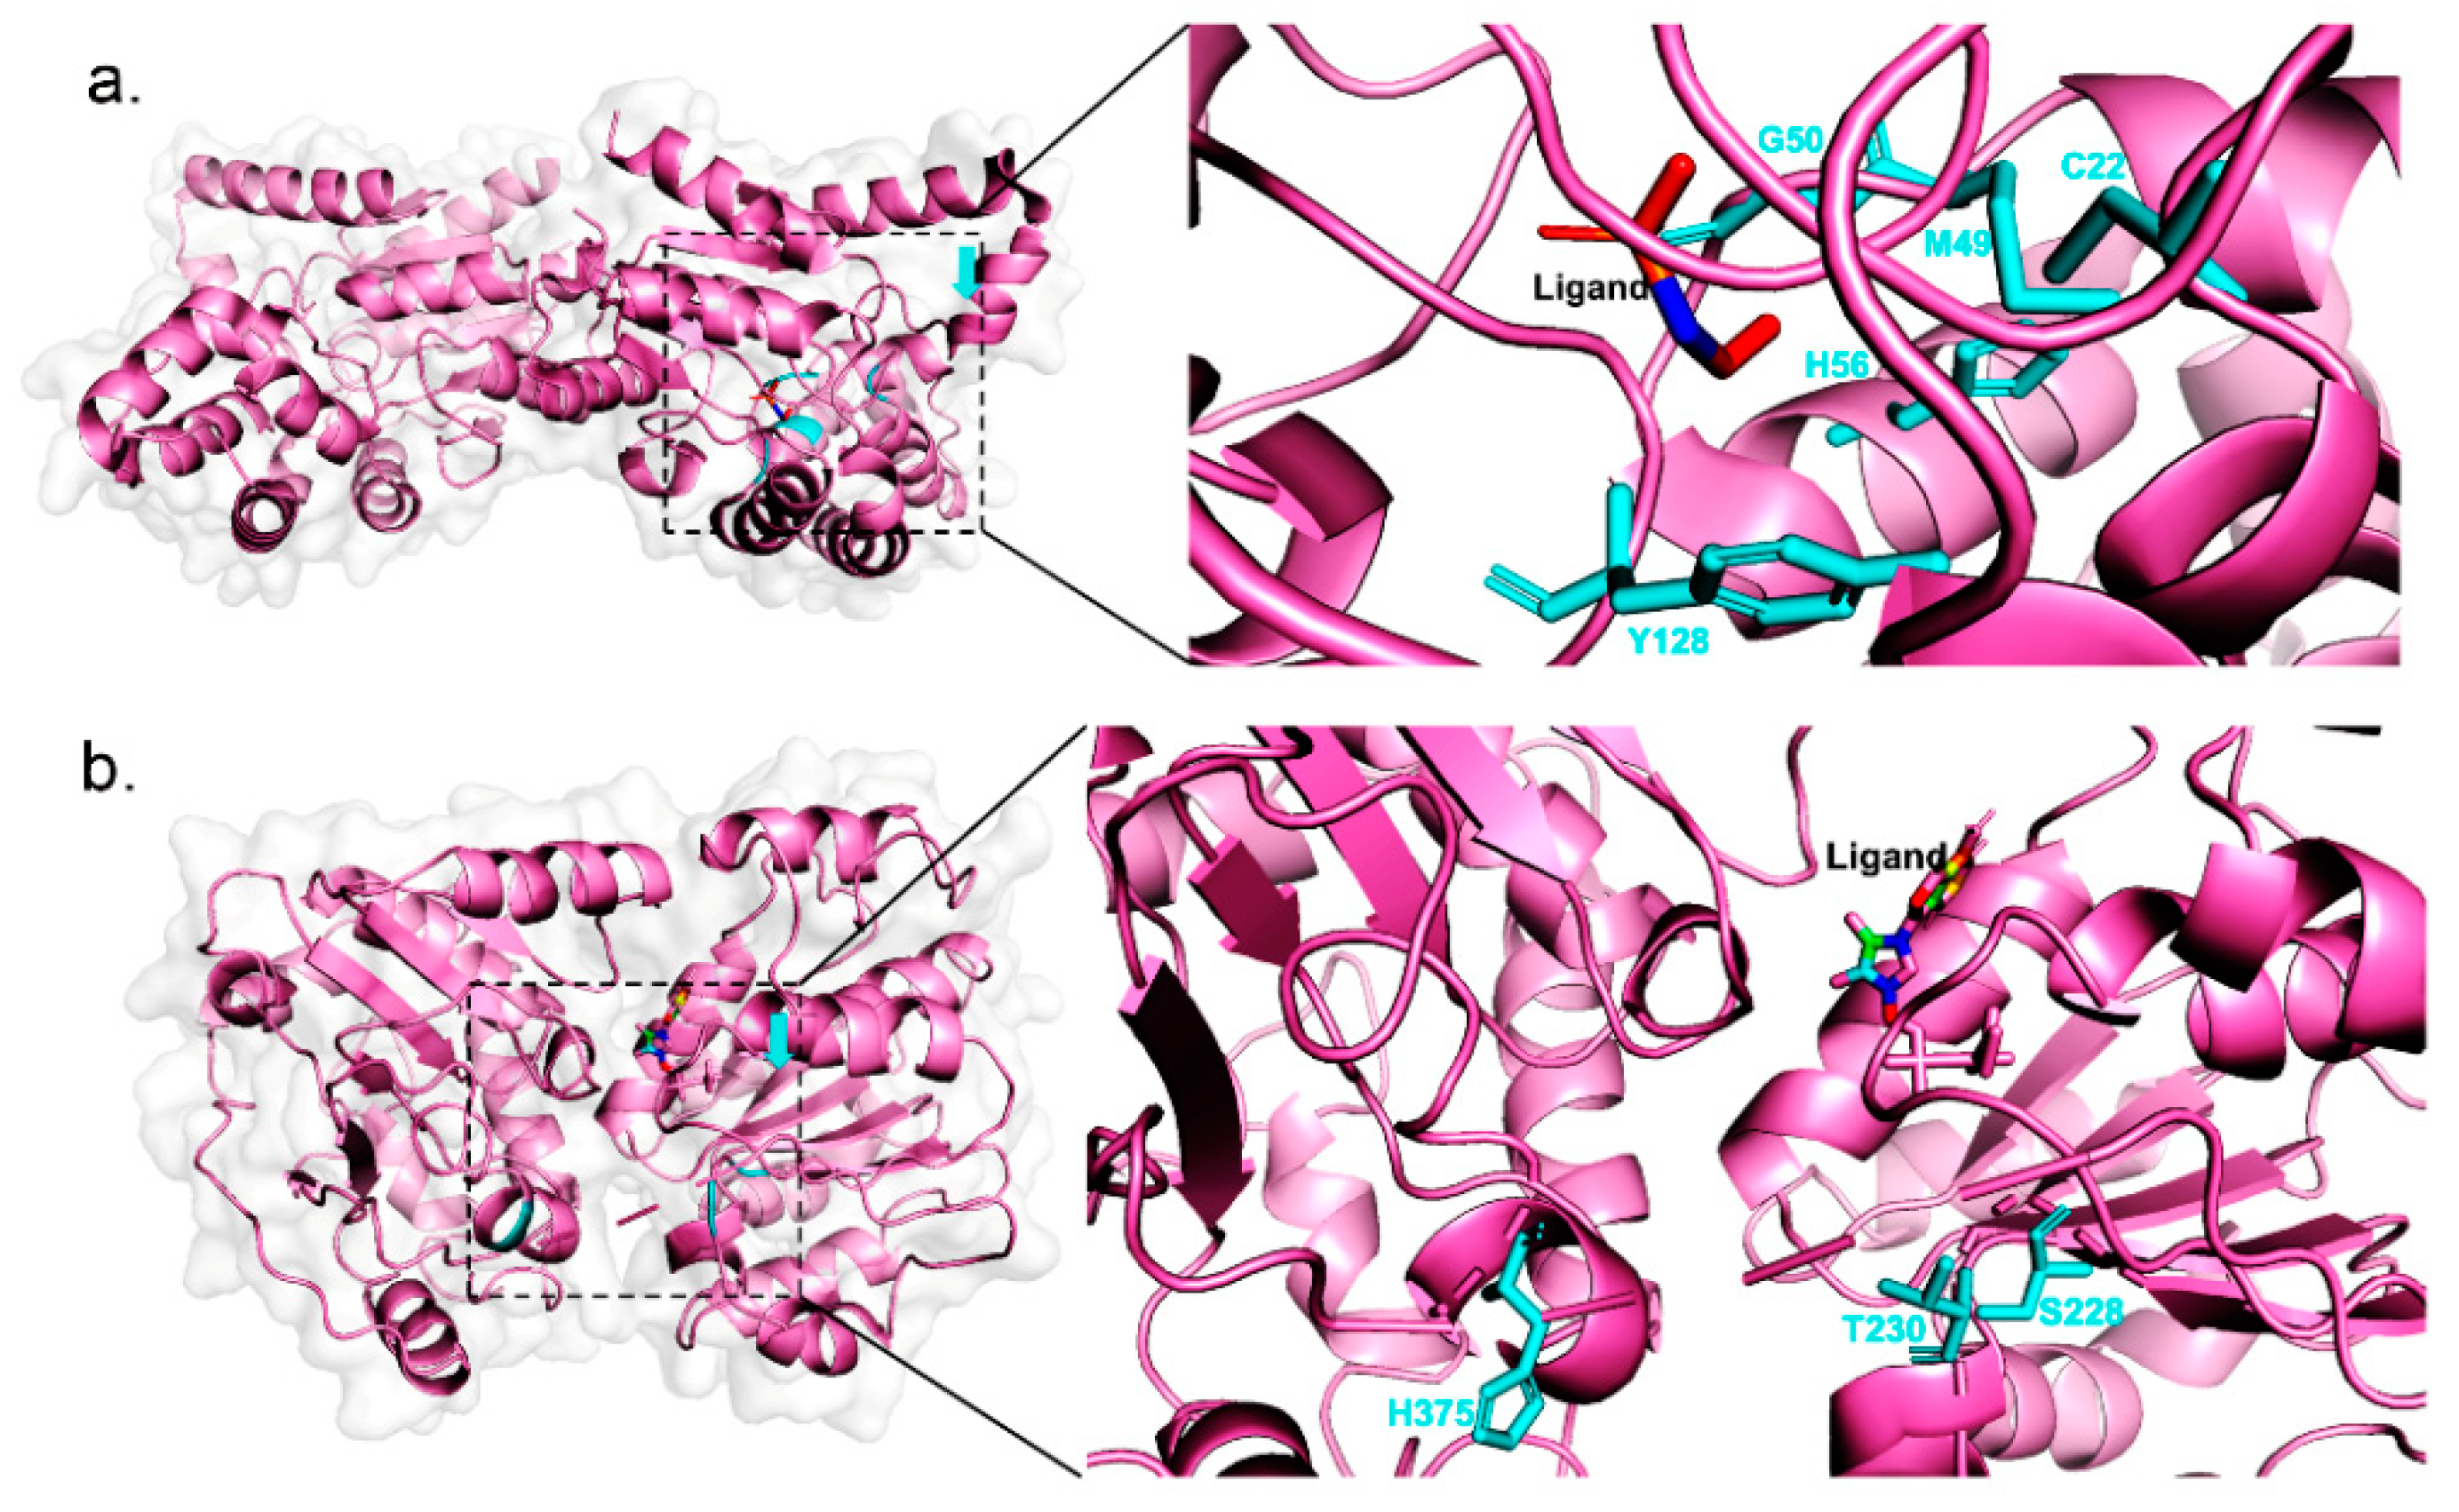
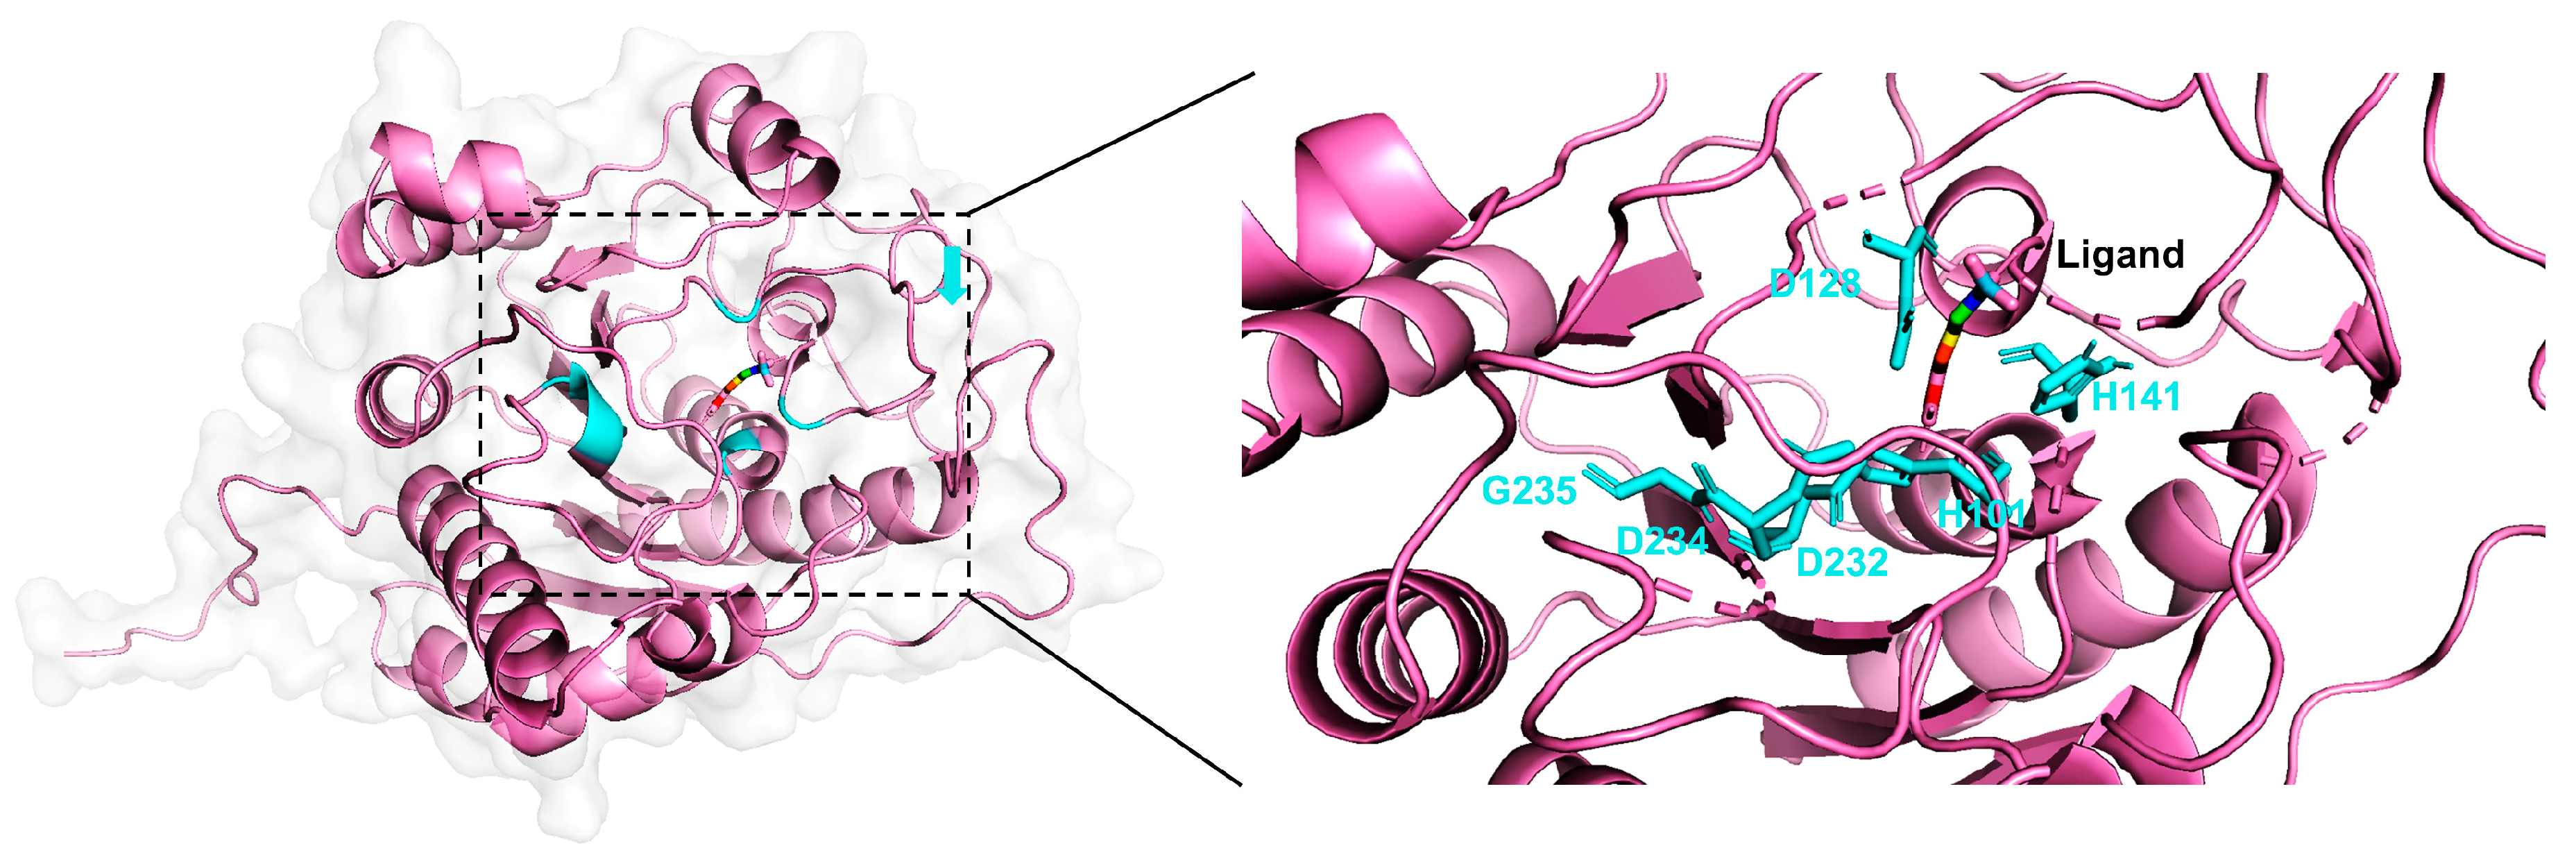
A classification model based on the descriptors was constructed to predict whether the mutated residue would increase or decrease catalytic activity. To begin with, we trained several classification algorithms to compare their performance on a five-fold cross-validation data set: Ensemble algorithm like the random forest, decision tree algorithm, support vector machine algorithm, clustering algorithm that is K-nearest neighbors. Bayesian algorithms involve naive Bayes and Gaussian naive Bayes and neural net like multilayer perceptron. It is apparent from Figure 2a and Table 1 that the choice of algorithms does affect the performance of the model, where the AUC, accuracy, and MCC tend to be larger in ensemble modeling techniques (random forest) than as compared to the other models. Random forest classifier constructs a multitude of decision trees, of which every decision tree will give a class prediction, and afterward, the class with the most votes will be the final prediction result of the method [45]. Obviously, the random forest has the best result in our study, with the highest MCC of 0.382 and the maximum AUC of 0.8, which shows a significant advantage in prediction. We thus perceived the random forest as a suitable model to predict the effect of residue mutation on the catalytic efficiency of hydrolases.
Nevertheless, just as the data (Figure 2a and Table 1) revealed, the recall, AUC, and MCC of the model were not optimal, especially the MCC. Therefore, we successively adopted several measures to achieve a higher-quality prediction model. On the one hand, to balance the model’s prediction ability of different classes of samples, we harmonized the slightly unequal dataset (the ratio of positive and negative samples was close to 1:3) by oversample way synthetic minority oversampling technique (SMOTE), which synthesizes new examples for the minority class. On the other hand, we did hyper parameter optimization to improve the model’s performance targeting numbers of trees in the forest, the depth of every decision tree, the numbers of samples allowed in the leaf node, and the numbers of samples when placed in the node before the node is split. Eventually, we improved the prediction ability of this random forest model on the aspect of MCC (Table 2), increasing to 0.448 from 0.382, which meant the model had a better prediction result on both increasing-mutation and decreasing-mutation. The final model was exploited to predict the blind test set ultimately, and what stands out in Figure 2b and Table 2 is the model was unexpectedly satisfactory on the test set, with AUC of 0.86 and MCC of 0.659.

2.3. Case Study

To analyze the prediction capability of the method, we performed several case studies on increasing-mutation or decreasing-mutation predicted by this method. Figure 3 displays the prediction effects of residue mutation on glycoside hydrolysis reaction efficiency, which revolved with the hydrolysis of glycosidic bonds in complex sugars [46]. Enzymes represented here are Beta-D-glucosidase from Maize (PDB: 1HXJ) and Rye (PDB: 3AIU). We noted that the method predicted correctly with two increasing-mutations (V205L and P377A) and three decreasing-mutations (F198V, D261N, and M263F) of Beta-D-glucosidase from Maize [47], plus with two increasing-mutations (G464F and S465L) and two decreasing-mutations (F198A, Y378A) of Beta-D-glucosidase from Rye were predicted by the method [48], among which F198V and D261N resulted in an almost inactive enzyme. Insights into the structure of the enzymes, mutation at position 198 motivated the rearrangement of Phe205, Phe466, and Glu464, the three residues that all related to the glycoside and aglycone binding pocket and mutation of residue Asp261 destabilized the protonation states of the acid-base catalyst. Phosphohydrolysis reactions catalyzed by Phosphonoacetaldehyde hydrolase (Figure 4a) and RNA helicase (Figure 4b) are the process of hydrolysis of organic phosphate [49]. From graphs, we uncovered the model predicted rightly with five decreasing-mutations of Phosphonoacetaldehyde hydrolase (C22A, M49L, G50A, H56A, and Y128F) [50], and three decreasing-mutations of RNA helicase (S228A, T230A, and H375A) [51]. In Phosphonoacetaldehyde hydrolase, the Kcat/Km ratio of M49L was reduced 15,000-fold, along with Kcat/Km of G50A was reduced 11,000-fold. On the view of protein structure, Met49 was located in the catalytic site and bound with a water molecule, which was proved to be linked with the formation of the hydrogen bond with the carbonyl oxygen of substrate and the transfer of protons. However, Gly50 enabled to aid the hairpin turn at the helix-turn-helix motif and stabilize the closed conformation state of enzyme, which could interpret the drastic descend of G50A mutant catalytic efficiency.
Apart from these, our model also correctly predicted several decreasing-mutations in lactam hydrolysis, ester hydrolysis and amino acid hydrolysis reactions. They were in Beta-Lactamase (Figure 5, H86S, H88S, D90E, H149S, C168S, and H210S) [52,53], Pectin Esterase A (Figure 6, Q153A, Q177A, V198A, T272A, and M306A) [54], additionally with Arginase (Figure 7, H101E, D128A, H141N, D232A, D234E, and G235A) [55,56,57]. Thereinto, Kcat/Km of D232A of Arginase showed a sharp reduction of 23,000-fold. Back to the original reaction mechanism, research has demonstrated that this reaction required an intact binuclear manganese cluster, yet the mutation of D232 was unable to steady Mn2+ and make the metal-bridging hydroxide ion in the appropriate position, resulting from the decline of catalytic activity of the enzyme. Original Kcat/Km parameters are shown in Table 3.
All these results show that our method does have a noticeable ability to predict the effect of residue mutation on hydrolysis reaction, especially on glucoside hydrolysis, phosphohydrolysis, lactam hydrolysis, etc. However, there is still one question that the number of increasing-mutation predicted by our method was much less than decreasing-mutation because of our imbalanced data set. Therefore, we will measure our model in more cases that contain increasing-mutations in the further work to make our method more rigorous.

3. Discussion

Research on the engineering of hydrolases has always been the hotspot in enzyme engineering. In this paper, we exhibited a computational approach to predict the change of catalytic efficiency of hydrolases after residue mutations. Importantly, the dataset employed in this method was a manually curated, literature-derived dataset, comprising 314 single residue mutations, and associated for the first-time experimental information on alterations in catalytic hydrolysis reaction activity with three-dimensional structures of protein–ligand complexes. Nevertheless, there are still some unanswered questions. As the data (Supplementary File) show, we only focused on individual residue mutations of enzymes, whereas iterative mutations are more integrant in protein engineering. Previous studies assumed that mutation effects of proteins have additivity [58,59], and the ProSAR algorithm [60] was also applied to identify synergistic effects by statistical analysis way. Therefore, it is still a rough but worthwhile road to study the effects of iterative mutation on proteins. Besides, features utilized in our methods were focused on sequence, structure, and assay environment, which were predominantly molecular-level descriptors. Nevertheless, lots of studies have confirmed that the hydrophobic effect and hydrogen bonding are the dominant force in protein folding, which contributes to the stability of proteins [61,62,63] and the reduction of free energy and may impact the transition of proteins state and the kinetic properties of enzymes. Therefore, more attention should be paid to the atomic-level characteristics [64], which facilitate the establishment of causal relationships between protein–ligand complexes and catalytic activity. Meanwhile, chemical reactions catalyzed by enzymes are dynamic processes associated with activation energy, bond break, and transformation of chemical groups. Hence, comprehensive understanding of reaction mechanisms, dynamics, structures and sequences is essential for in-silico enzyme engineering. At the same time, just as shown in Figure 1, hydrolases are an enzyme family containing diverse enzymes that catalyze various hydrolytic reactions, e.g., lipases break ester bonds and phosphatases act analogously upon phosphate. Thus, different subsets of hydrolyses-class may catalyze the substrate with different attributes and characters. Hence, prediction models on the catalytic efficiency of hydrolyses should make a difference between certain subsets of hydrolyses. Future studies on the topics mentioned above are, therefore, recommended.

4. Materials and Methods

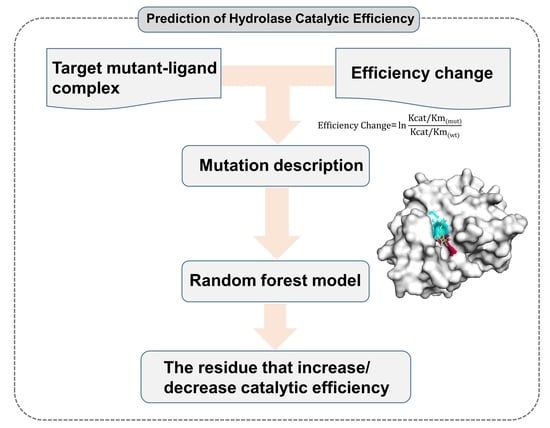
4.1. Method Workflow

As schematically represented by Figure 8, our method was made up of four major steps, including data collection, data preparation, feature construction, and model prediction.

4.2. Data Collection and Preparation

The availability of high-quality data is essential for computational methods because its confidence and attribute determine the universality of the model. However, current kinetic data and structural information of protein–ligand complexes of both wild and mutant proteins are unsystematic and nonstandard. To fill this gap, we collected and manually curated experimental-based data from MuteinDB [65] and SABIO-RK [66], two databases that include information about reaction substrate, products, kinetic parameters, and enzymatic reactions directly with variants of enzymes, and also checked it for accuracy from the literature. We manually aggregated exceed 300 data from MuteinDB, including protein name, mutated site, reaction substrate, reaction condition and crawled about 60,000 data by Python (Python Software Foundation, Scotts Valley, CA, USA, 2009) from SABIO-RK, and then removed some data against criteria that include requiring enzyme kinetics data of single residue mutation and the three-dimensional structure had been determined. About 3000 data pieces of ultimately matched our criteria.
All the data were distributed at different reaction types and the data related to hydrolysis reaction were taken out and thereafter, corresponding mutated residues were localized onto protein structures deposited in the Protein Data Bank (PDB) [67]. Meanwhile, the reaction substrate was also mapped onto experimentally solved protein–ligand complexes if the crystal complex exists. Otherwise, the ligand was docked into the catalytic sites of proteins by SMINA [68]. Then, we divided data into two groups based on the catalytic efficiency change of a given single-point residue mutation on a logarithm scale:
Efficiency   Change   =   ln Kcat / Km ( mut ) Kcat / Km ( wt )
where Kcat/Km(mut) indicates the catalytic efficiency of the mutant protein–ligand complex and Kcat/Km(wt) indicates the catalytic efficiency of the wild-type complex. The residue mutation was classified as increasing-mutation (to increase catalytic efficiency) when efficiency change was positive and the decreasing-mutation (to decrease catalytic efficiency) when the change was negative.

4.3. Feature Construction

In an attempt to predict increasing-mutation or decreasing-mutation with the computational method, we turned it into a classification problem and constructed 50 features of protein and ligand at the molecule and atomic level to describe mutation information. Overall, features were categorized as sequence features, structural features, and assay conditions.
According to our previous research [69], sequence features that have been the most preferred descriptor applied in computational methods, here, included Shannon entropy to depict conservation of mutated residue, position-specific scoring matrix to describe mutated residue evolutionary distance and other physicochemical properties of residues like hydropathy, hydrophobicity, and polarity. All the sequence features were computed by Prody (Bahar Lab, Pittsburgh, PA, USA, 2011) [70], Biopython (Open Bioinformatics Foundation, Toronto, Canada, 2020) [71] toolkit, and KAlign (Stockholm Bioinformatics Centre, Sweden, 2011) [72] software.
Structural features were divided into four categories.
(1) Basic structural features of proteins consisted of geometric characterization, secondary structure assignments, residue solvent-accessible surface area calculated by DSSP (Wolfgang Kabsch and Chris Sander, Heidelberg, Germany, 2003) [73] software and Biopython (Open Bioinformatics Foundation, Toronto, Canada, 2020) [71] toolkit, along with B-factor [74] attained from protein 3D structure file to reflect displacement fluctuation of atoms.
(2) Residue network features were also included in this method, which involved the change of non-covalent interactions of mutated amino acids based on residue network, generated by RING [75] software (BiocomputingUP Lab, Italy, 2016).
(3) Ligand properties comprised molecule weight, number of hydrogen acceptors and donors, number of heavy atoms, rotatable bonds, number of rings, and LogP, which were all calculated by cheminformatics toolkit RDKit (Greg Landrum, San Francisco, CA, USA, 2020, http://www.rdkit.org/).
(4) In order to describe the difference of characterization of interactions in protein–ligand complexes, we drew on Protein–Ligand Interaction Profiler (PLIP) [76] tool (Michael Schroeder group, Tatzberg, Dresden, Germany, 2015) to excavate relevant to non-covalent contacts in protein–ligand structure and calculated quantity changes of seven interaction types (pi-stacking, pi-cation interactions, hydrogen bonds, hydrophobic interactions, salt bridges, water bridges, hydrogen and halogen bonds) for mutated residues.
Considering in vitro assays of enzyme catalytic activity is easily affected by experimental conditions that could lead to different Kcat values in different conditions, we added pH and experimental temperature as two descriptors to address this issue.

4.4. Comparison of Different Classifiers

With the purpose of improving the accuracy of the method, we compared seven different classifiers exploited to select the best model. They were random forest classifier, Gaussian process classifier, neural net classifier, naive Bayes, nearest neighbor classifier, decision tree, and support vector machine (SVM). All the classifiers were trained on the training set, and according to the performance metrics, we chose the best method to construct the model in the future. All the machine learning models mentioned above were implemented by Python 3 and the scikit-learn [77] library.

4.5. Model Evaluation

Commonly, the model will be fitted on a training set and then utilized to predict unknown data of the test set. However, due to the limitation of our data set and to prevent overfitting, we employed five-fold cross-validation on the training set. The training set was randomly split into five complementary subsets, and each of the subsets would be exploited as the validation set to validate analysis or find the best parameters after the model was fitted on the other four subsets left. Afterward, the independent and brand-new test set was used to provide an impartial assessment of the final model. The performance of the model was evaluated by several metrics, including accuracy, precision, recall, Matthews Correlation Coefficient (MCC), the receiver operating characteristic (ROC) curve, along with false positive rate (FPR), true positive rate (TPR, also defined as recall), and the area under the curve (AUC).
The measurements above were defined as:
Accuracy   =   TP   +   TN TP   +   TN   +   FP   +   FN
Precision   =   TP TP   +   FP
TPR   ( Recall )   =   TP TP   +   FN
FPR   =   TP FP   +   TN
MCC   =   TP   ×   TN     TP   ×   FN ( TP   +   FP )   ×   ( TP   +   FN )   ×   ( TN   +   FP )   ×   ( TN   +   FN )
where TP, FP, TN, FN represent true positive, false positive, true negative, and false negative. The ROC curve is plotted with TPR against the FPR at diverse threshold values, and AUC provides a cumulative measure of performance across all possible classification thresholds.
When it comes to classification problems, accuracy, precision, recall, and AUC are commonly applied to assess the model. Whereas just as the equation is shown, when the dataset was imbalanced, which means the distribution of data across the known classes is skewed, accuracy became invalid. Precision, recall, and even the ROC curve were in the same situation as they just focused on the single category (positive or negative class) which we were interested in. Thereby, to estimate the model roundly, we took into account other metrics MCC [78], which took into account all four values FN and regarded the true class (whether it is a positive or negative class) and the predicted class as two variables to calculate their correlation coefficient. The higher the correlation between true and predicted values, the better the prediction for all classes.

5. Conclusions

Engineering of hydrolyses to strengthen their activity by mutating certain residues has always been the hotspot for researchers. Here, in our study, to discriminate the effects (increase and decrease) of residue mutation on the catalytic activity of hydrolyses, we constructed a classifier executed by Random Forest algorithm on 257 single mutations of hydrolyses with properties of enzymes on sequence, structure, and assay condition and to predict the residue effect by assessing the Kcat/Km of enzymes. After training on the five-fold cross-validation set and optimization of parameters, ultimately, the independent test set had a dazzling result with the AUC of 0.86 and the MCC of 0.659. Our study not only provides a solid theoretical basis for related research but also expedites the engineering process of hydrolyses.

Supplementary Materials

The supplementary file is available online at https://www.mdpi.com/2073-4344/11/2/286/s1.

Author Contributions

Conceptualization, Y.L., K.S., J.Z. and S.L.; methodology, Y.L., K.S., J.Z. and S.L.; validation, Y.L.; formal analysis, Y.L., K.S. and J.Z.; writing-original draft preparation, Y.L. and S.L.; writing-review and editing, S.L. and Y.L.; funding acquisition, J.Z. and S.L. All authors have read and agreed to the published version of the manuscript.

Funding

This research was funded by the National Natural Science Foundation of China (grant number 22077082 and 21778037).

Data Availability Statement

Data are contained within the article or supplementary material.

Conflicts of Interest

The authors declare no conflict of interest.

References

  1. Garcia-Viloca, M.; Gao, J.; Karplus, M.; Truhlar, D.G. How enzymes work: Analysis by modern rate theory and computer simulations. Science 2004, 303, 186–195. [Google Scholar] [CrossRef]
  2. Zhou, X.X.; Fan, L.Z.; Li, P.; Shen, K.; Lin, M.Z. Optical control of cell signaling by single-chain photoswitchable kinases. Science 2017, 355, 836–842. [Google Scholar] [CrossRef] [PubMed] [Green Version]
  3. Feltcher, M.E.; Braunstein, M. Emerging themes in SecA2-mediated protein export. Nat. Rev. Microbiol. 2012, 10, 779–789. [Google Scholar] [CrossRef] [Green Version]
  4. Shen, Y.; Joachimiak, A.; Rosner, M.R.; Tang, W.J. Structures of human insulin-degrading enzyme reveal a new substrate recognition mechanism. Nature 2006, 443, 870–874. [Google Scholar] [CrossRef] [Green Version]
  5. King, J.V.; Liang, W.G.; Scherpelz, K.P.; Schilling, A.B.; Meredith, S.C.; Tang, W.J. Molecular basis of substrate recognition and degradation by human presequence protease. Structure 2014, 22, 996–1007. [Google Scholar] [CrossRef] [Green Version]
  6. Goyal, M.S.; Vlassenko, A.G.; Blazey, T.M.; Su, Y.; Couture, L.E.; Durbin, T.J.; Bateman, R.J.; Benzinger, T.L.; Morris, J.C.; Raichle, M.E. Loss of Brain Aerobic Glycolysis in Normal Human Aging. Cell Metab. 2017, 26, 353–360. [Google Scholar] [CrossRef]
  7. Greule, A.; Stok, J.E.; De Voss, J.J.; Cryle, M.J. Unrivalled diversity: The many roles and reactions of bacterial cytochromes P450 in secondary metabolism. Nat. Prod. Rep. 2018, 35, 757–791. [Google Scholar] [CrossRef] [PubMed] [Green Version]
  8. Wen, D.; Eychmuller, A. Enzymatic Biofuel Cells on Porous Nanostructures. Small 2016, 12, 4649–4661. [Google Scholar] [CrossRef]
  9. Ji, C.; Hou, J.; Wang, K.; Ng, Y.H.; Chen, V. Single-Enzyme Biofuel Cells. Angew. Chem. Int. Ed. Engl. 2017, 56, 9762–9766. [Google Scholar] [CrossRef] [PubMed]
  10. Kirk, O.; Borchert, T.V.; Fuglsang, C.C. Industrial enzyme applications. Curr. Opin. Biotechnol. 2002, 13, 345–351. [Google Scholar] [CrossRef]
  11. Dulieu, C.; Moll, M.; Boudrant, J.; Poncelet, D. Improved performances and control of beer fermentation using encapsulated alpha-acetolactate decarboxylase and modeling. Biotechnol. Prog. 2000, 16, 958–965. [Google Scholar] [CrossRef]
  12. Boyce, A.; Walsh, G. Expression and characterisation of a thermophilic endo-1,4-beta-glucanase from Sulfolobus shibatae of potential industrial application. Mol. Biol. Rep. 2018, 45, 2201–2211. [Google Scholar] [CrossRef] [PubMed]
  13. Hu, W.; Zhou, L.; Xu, Z.; Zhang, Y.; Liao, X. Enzyme inactivation in food processing using high pressure carbon dioxide technology. Crit. Rev. Food Sci. Nutr. 2013, 53, 145–161. [Google Scholar] [CrossRef] [PubMed]
  14. Pariza, M.W.; Johnson, E.A. Evaluating the safety of microbial enzyme preparations used in food processing: Update for a new century. Regul. Toxicol. Pharm. 2001, 33, 173–186. [Google Scholar] [CrossRef] [PubMed]
  15. Anfinsen, C.B.; Haber, E.; Sela, M.; White, F.H., Jr. The kinetics of formation of native ribonuclease during oxidation of the reduced polypeptide chain. Proc. Natl. Acad. Sci. USA 1961, 47, 1309–1314. [Google Scholar] [CrossRef] [Green Version]
  16. Yang, X.; Wei, J.; Wu, Z.; Gao, J. Effects of Substrate-Binding Site Residues on the Biochemical Properties of a Tau Class Glutathione S-Transferase from Oryza sativa. Genes 2019, 11, 25. [Google Scholar] [CrossRef] [Green Version]
  17. Cen, Y.; Singh, W.; Arkin, M.; Moody, T.S.; Huang, M.; Zhou, J.; Wu, Q.; Reetz, M.T. Artificial cysteine-lipases with high activity and altered catalytic mechanism created by laboratory evolution. Nat. Commun. 2019, 10, 3198. [Google Scholar] [CrossRef]
  18. Guan, L.-J.; Ohtsuka, J.; Okai, M.; Miyakawa, T.; Mase, T.; Zhi, Y.; Hou, F.; Ito, N.; Iwasaki, A.; Yasohara, Y.; et al. A new target region for changing the substrate specificity of amine transaminases. Sci. Rep. 2015, 5, 10753. [Google Scholar] [CrossRef] [Green Version]
  19. Marshall, S.A.; Lazar, G.A.; Chirino, A.J.; Desjarlais, J.R. Rational design and engineering of therapeutic proteins. Drug Discov. Today 2003, 8, 212–221. [Google Scholar] [CrossRef]
  20. Kostarelos, K. Rational design and engineering of delivery systems for therapeutics: Biomedical exercises in colloid and surface science. Adv. Colloid Interface Sci. 2003, 106, 147–168. [Google Scholar] [CrossRef]
  21. Carpenter, J.F.; Pikal, M.J.; Chang, B.S.; Randolph, T.W. Rational design of stable lyophilized protein formulations: Some practical advice. Pharm. Res. 1997, 14, 969–975. [Google Scholar] [CrossRef]
  22. Johnsson, K.; Allemann, R.K.; Widmer, H.; Benner, S.A. Synthesis, structure and activity of artificial, rationally designed catalytic polypeptides. Nature 1993, 365, 530–532. [Google Scholar] [CrossRef] [PubMed]
  23. Arnold, F.H. The nature of chemical innovation: New enzymes by evolution. Q. Rev. Biophys. 2015, 48, 404–410. [Google Scholar] [CrossRef]
  24. Jaeger, K.; Eggert, T. Enantioselective biocatalysis optimized by directed evolution. Curr. Opin. Biotechnol. 2004, 15, 305–313. [Google Scholar] [CrossRef] [PubMed]
  25. Turner, N.J. Directed evolution of enzymes for applied biocatalysis. Trends Biotechnol. 2003, 21, 474–478. [Google Scholar] [CrossRef]
  26. Lutz, S. Novel methods for directed evolution of enzymes: Quality, not quantity. Curr. Opin. Biotechnol. 2004, 15, 291–297. [Google Scholar] [CrossRef]
  27. Otten, L.G.; Quax, W.J. Directed evolution: Selecting today’s biocatalysts. Biomol. Eng. 2005, 22, 1–9. [Google Scholar] [CrossRef]
  28. Hibbert, E.G.; Dalby, P.A. Directed evolution strategies for improved enzymatic performance. Microb. Cell Factories 2005, 4, 29. [Google Scholar] [CrossRef] [Green Version]
  29. Chen, K.Q.; Arnold, F.H. Enzyme engineering for nonaqueous solvents: Random mutagenesis to enhance activity of subtilisin E in polar organic media. Biotechnol. (N. Y.) 1991, 9, 1073–1077. [Google Scholar] [CrossRef] [PubMed]
  30. Cui, H.; Cao, H.; Cai, H.; Jaeger, K.E.; Davari, M.D.; Schwaneberg, U. Computer-Assisted Recombination (CompassR) Teaches us How to Recombine Beneficial Substitutions from Directed Evolution Campaigns. Chemistry 2020, 26, 643–649. [Google Scholar] [CrossRef] [PubMed] [Green Version]
  31. Pandurangan, A.P.; Ochoa-Montano, B.; Ascher, D.B.; Blundell, T.L. SDM: A server for predicting effects of mutations on protein stability. Nucleic. Acids Res. 2017, 45, W229–W235. [Google Scholar] [CrossRef] [Green Version]
  32. Fitter, J.; Heberle, J. Structural Equilibrium Fluctuations in Mesophilic and Thermophilic α-Amylase. Biophys. J. 2000, 79, 1629–1636. [Google Scholar] [CrossRef] [Green Version]
  33. Purmonen, M.; Valjakka, J.; Takkinen, K.; Laitinen, T.; Rouvinen, J. Molecular dynamics studies on the thermostability of family 11 xylanases. Protein Eng. Des. Sel. 2007, 20, 551–559. [Google Scholar] [CrossRef] [PubMed] [Green Version]
  34. Mazola, Y.; Guirola, O.; Palomares, S.; Chinea, G.; Menéndez, C.; Hernández, L.; Musacchio, A. A comparative molecular dynamics study of thermophilic and mesophilic β-fructosidase enzymes. J. Mol. Model. 2015, 21, 228. [Google Scholar] [CrossRef]
  35. Teng, S.; Srivastava, A.K.; Wang, L. Sequence feature-based prediction of protein stability changes upon amino acid substitutions. BMC Genom. 2010, 11, S5. [Google Scholar] [CrossRef] [PubMed] [Green Version]
  36. Laimer, J.; Hofer, H.; Fritz, M.; Wegenkittl, S.; Lackner, P. MAESTRO--multi agent stability prediction upon point mutations. BMC Bioinform. 2015, 16, 116. [Google Scholar] [CrossRef] [Green Version]
  37. Wainreb, G.; Ashkenazy, H.; Bromberg, Y.; Starovolsky-Shitrit, A.; Haliloglu, T.; Ruppin, E.; Avraham, K.B.; Rost, B.; Ben-Tal, N. MuD: An interactive web server for the prediction of non-neutral substitutions using protein structural data. Nucleic Acids Res. 2010, 38, W523–W528. [Google Scholar] [CrossRef] [Green Version]
  38. Koskinen, P.; Törönen, P.; Nokso-Koivisto, J.; Holm, L. PANNZER: High-throughput functional annotation of uncharacterized proteins in an error-prone environment. Bioinformatics 2015, 31, 1544–1552. [Google Scholar] [CrossRef]
  39. De Ferrari, L.; Mitchell, J.B. From sequence to enzyme mechanism using multi-label machine learning. BMC Bioinform. 2014, 15, 150. [Google Scholar] [CrossRef] [PubMed]
  40. Tournier, V.; Topham, C.M.; Gilles, A.; David, B.; Folgoas, C.; Moya-Leclair, E.; Kamionka, E.; Desrousseaux, M.L.; Texier, H.; Gavalda, S.; et al. engineered PET depolymerase to break down and recycle plastic bottles. Nature 2020, 580, 216–219. [Google Scholar] [CrossRef]
  41. Cui, Y.; Chen, Y.; Liu, X.; Dong, S.; Tian, Y.e.; Qiao, Y.; Mitra, R.; Han, J.; Li, C.; Han, X.; et al. Computational Redesign of a PETase for Plastic Biodegradation under Ambient Condition by the GRAPE Strategy. ACS Catal. 2021, 11, 1340–1350. [Google Scholar] [CrossRef]
  42. Kong, X.D.; Yuan, S.; Li, L.; Chen, S.; Xu, J.H.; Zhou, J. Engineering of an epoxide hydrolase for efficient bioresolution of bulky pharmaco substrates. Proc. Natl. Acad. Sci. USA 2014, 111, 15717–15722. [Google Scholar] [CrossRef] [Green Version]
  43. Lu, H.D.; Wheeldon, I.R.; Banta, S. Catalytic biomaterials: Engineering organophosphate hydrolase to form self-assembling enzymatic hydrogels. Protein Eng. Des. Sel. 2010, 23, 559–566. [Google Scholar] [CrossRef] [Green Version]
  44. Sun, H.; Pang, Y.-P.; Lockridge, O.; Brimijoin, S. Re-engineering Butyrylcholinesterase as a Cocaine Hydrolase. Mol. Pharmacol. 2002, 62, 220–224. [Google Scholar] [CrossRef] [Green Version]
  45. Ho, T.K. The random subspace method for constructing decision forests. IEEE Trans. Pattern Anal. Mach. Intell. 1998, 20, 832–844. [Google Scholar]
  46. Henrissat, B.; Davies, G.J. Glycoside Hydrolases and Glycosyltransferases. Families, Modules, and Implications for Genomics. Plant. Physiol. 2000, 124, 1515–1519. [Google Scholar] [CrossRef] [PubMed] [Green Version]
  47. Verdoucq, L.; Czjzek, M.; Moriniere, J.; Bevan, D.R.; Esen, A. Mutational and Structural Analysis of Aglycone Specificity in Maize and Sorghum β-Glucosidases. J. Biol. Chem. 2003, 278, 25055–25062. [Google Scholar] [CrossRef] [PubMed] [Green Version]
  48. Sue, M.; Yamazaki, K.; Yajima, S.; Nomura, T.; Matsukawa, T.; Iwamura, H.; Miyamoto, T. Molecular and structural characterization of hexameric beta-D-glucosidases in wheat and rye. Plant. Physiol 2006, 141, 1237–1247. [Google Scholar] [CrossRef] [PubMed] [Green Version]
  49. Li, X.; Wilmanns, M.; Thornton, J.; Köhn, M. Elucidating human phosphatase-substrate networks. Sci. Signal. 2013, 6, rs10. [Google Scholar] [CrossRef] [PubMed]
  50. Morais, M.C.; Zhang, G.; Zhang, W.; Olsen, D.B.; Dunaway-Mariano, D.; Allen, K.N. X-ray crystallographic and site-directed mutagenesis analysis of the mechanism of Schiff-base formation in phosphonoacetaldehyde hydrolase catalysis. J. Biol. Chem. 2004, 279, 9353–9361. [Google Scholar] [CrossRef] [PubMed] [Green Version]
  51. Rocak, S.; Emery, B.; Tanner, N.K.; Linder, P. Characterization of the ATPase and unwinding activities of the yeast DEAD-box protein Has1p and the analysis of the roles of the conserved motifs. Nucleic Acids. Res. 2005, 33, 999–1009. [Google Scholar] [CrossRef] [Green Version]
  52. De Seny, D.; Prosperi-Meys, C.; Bebrone, C.; Rossolini, G.M.; Page, M.I.; Noel, P.; Frère, J.M.; Galleni, M. Mutational analysis of the two zinc-binding sites of the Bacillus cereus 569/H/9 metallo-beta-lactamase. Biochem. J. 2002, 363, 687–696. [Google Scholar] [CrossRef]
  53. Llarrull, L.I.; Fabiane, S.M.; Kowalski, J.M.; Bennett, B.; Sutton, B.J.; Vila, A.J. Asp-120 locates Zn2 for optimal metallo-beta-lactamase activity. J. Biol. Chem. 2007, 282, 18276–18285. [Google Scholar] [CrossRef] [Green Version]
  54. Fries, M.; Ihrig, J.; Brocklehurst, K.; Shevchik, V.E.; Pickersgill, R.W. Molecular basis of the activity of the phytopathogen pectin methylesterase. Embo. J. 2007, 26, 3879–3887. [Google Scholar] [CrossRef] [PubMed] [Green Version]
  55. Cama, E.; Emig, F.A.; Ash, D.E.; Christianson, D.W. Structural and functional importance of first-shell metal ligands in the binuclear manganese cluster of arginase I. Biochemistry 2003, 42, 7748–7758. [Google Scholar] [CrossRef] [PubMed]
  56. Colleluori, D.M.; Reczkowski, R.S.; Emig, F.A.; Cama, E.; Cox, J.D.; Scolnick, L.R.; Compher, K.; Jude, K.; Han, S.; Viola, R.E.; et al. Probing the role of the hyper-reactive histidine residue of arginase. Arch. Biochem. Biophys. 2005, 444, 15–26. [Google Scholar] [CrossRef]
  57. Lavulo, L.T.; Emig, F.A.; Ash, D.E. Functional consequences of the G235R mutation in liver arginase leading to hyperargininemia. Arch. Biochem. Biophys. 2002, 399, 49–55. [Google Scholar] [CrossRef]
  58. Wells, J.A. Additivity of mutational effects in proteins. Biochemistry 1990, 29, 8509–8517. [Google Scholar] [CrossRef] [PubMed]
  59. Skinner, M.M.; Terwilliger, T.C. Potential use of additivity of mutational effects in simplifying protein engineering. Proc. Natl. Acad. Sci. USA 1996, 93, 10753–10757. [Google Scholar] [CrossRef] [Green Version]
  60. Fox, R.J.; Davis, S.C.; Mundorff, E.C.; Newman, L.M.; Gavrilovic, V.; Ma, S.K.; Chung, L.M.; Ching, C.; Tam, S.; Muley, S.; et al. Improving catalytic function by ProSAR-driven enzyme evolution. Nat. Biotechnol. 2007, 25, 338–344. [Google Scholar] [CrossRef] [PubMed]
  61. Pace, C.N. Energetics of protein hydrogen bonds. Nat. Struct. Mol. Biol. 2009, 16, 681–682. [Google Scholar] [CrossRef] [PubMed]
  62. Tanford, C. Contribution of Hydrophobic Interactions to the Stability of the Globular Conformation of Proteins. J. Am. Chem. Soc. 1962, 84, 4240–4247. [Google Scholar] [CrossRef]
  63. Kauzmann, W. Some Factors in the Interpretation of Protein Denaturation. In Advances in Protein Chemistry; Elsevier: Amsterdam, The Netherlands, 1959; pp. 1–63. [Google Scholar] [CrossRef]
  64. Rouhani, M.; Khodabakhsh, F.; Norouzian, D.; Cohan, R.A.; Valizadeh, V. Molecular dynamics simulation for rational protein engineering: Present and future prospectus. J. Mol. Graph. Model. 2018, 84, 43–53. [Google Scholar] [CrossRef]
  65. Braun, A.; Halwachs, B.; Geier, M.; Weinhandl, K.; Guggemos, M.; Marienhagen, J.; Ruff, A.J.; Schwaneberg, U.; Rabin, V.; Torres Pazmino, D.E.; et al. MuteinDB: The mutein database linking substrates, products and enzymatic reactions directly with genetic variants of enzymes. Database (Oxford) 2012, 2012, bas028. [Google Scholar] [CrossRef]
  66. Wittig, U.; Kania, R.; Golebiewski, M.; Rey, M.; Shi, L.; Jong, L.; Algaa, E.; Weidemann, A.; Sauer-Danzwith, H.; Mir, S.; et al. SABIO-RK--database for biochemical reaction kinetics. Nucleic. Acids Res. 2012, 40, D790–D796. [Google Scholar] [CrossRef] [PubMed] [Green Version]
  67. Sussman, J.L.; Lin, D.; Jiang, J.; Manning, N.O.; Prilusky, J.; Ritter, O.; Abola, E.E. Protein Data Bank (PDB): Database of three-dimensional structural information of biological macromolecules. Acta. Cryst. D Biol. Cryst. 1998, 54, 1078–1084. [Google Scholar] [CrossRef] [Green Version]
  68. Koes, D.R.; Baumgartner, M.P.; Camacho, C.J. Lessons learned in empirical scoring with smina from the CSAR 2011 benchmarking exercise. J. Chem. Inf. Model. 2013, 53, 1893–1904. [Google Scholar] [CrossRef]
  69. Song, K.; Li, Q.; Gao, W.; Lu, S.; Shen, Q.; Liu, X.; Wu, Y.; Wang, B.; Lin, H.; Chen, G.; et al. AlloDriver: A method for the identification and analysis of cancer driver targets. Nucleic Acids Res. 2019, 47, W315–W321. [Google Scholar] [CrossRef] [PubMed]
  70. Bakan, A.; Meireles, L.M.; Bahar, I. ProDy: Protein dynamics inferred from theory and experiments. Bioinformatics 2011, 27, 1575–1577. [Google Scholar] [CrossRef] [Green Version]
  71. Cock, P.J.; Antao, T.; Chang, J.T.; Chapman, B.A.; Cox, C.J.; Dalke, A.; Friedberg, I.; Hamelryck, T.; Kauff, F.; Wilczynski, B.; et al. Biopython: Freely available Python tools for computational molecular biology and bioinformatics. Bioinformatics 2009, 25, 1422–1423. [Google Scholar] [CrossRef]
  72. Lassmann, T.; Sonnhammer, E.L. Kalign--an accurate and fast multiple sequence alignment algorithm. BMC Bioinform. 2005, 6, 298. [Google Scholar] [CrossRef] [Green Version]
  73. Kabsch, W.; Sander, C. Dictionary of Protein Secondary Structure: Pattern Recognition of Hydrogen-Bonded and Geometrical Features. Biopolymers 1983, 22, 2577–2637. [Google Scholar] [CrossRef] [PubMed]
  74. Yuan, Z.; Bailey, T.L.; Teasdale, R.D. Prediction of protein B-factor profiles. Proteins 2005, 58, 905–912. [Google Scholar] [CrossRef] [PubMed]
  75. Piovesan, D.; Minervini, G.; Tosatto, S.C. The RING 2.0 web server for high quality residue interaction networks. Nucleic Acids Res. 2016, 44, W367–W374. [Google Scholar] [CrossRef] [PubMed]
  76. Salentin, S.; Schreiber, S.; Haupt, V.J.; Adasme, M.F.; Schroeder, M. PLIP: Fully automated protein-ligand interaction profiler. Nucleic Acids Res. 2015, 43, W443–W447. [Google Scholar] [CrossRef] [PubMed]
  77. Pedregosa, F.; Varoquaux, G.; Gramfort, A.; Michel, V.; Thirion, B.; Grisel, O.; Blondel, M.; Prettenhofer, P.; Weiss, R.; Dubourg, V.; et al. Scikit-learn: Machine Learning in Python. J. Mach. Learn. Res. 2011, 12, 2825–2830. [Google Scholar]
  78. Matthews, B.W. Comparison of the predicted and observed secondary structure of T4 phage lysozyme. Biochim. et Biophys. Acta (BBA)-Protein Struct. 1975, 405, 442–451. [Google Scholar] [CrossRef]
Figure 1. Distribution of hydrolysis reaction types involved in the data set.
Catalysts 11 00286 g001
Figure 2. ROC curves for predicting effects on the catalytic efficiency of hydrolases by residue mutation. (a) The ROC curve of different classifiers on the five-fold cross-validation set. (b) The ROC curve on the five-fold cross-validation set and test set by the random forest model.
Catalysts 11 00286 g002
Figure 3. View of predicting effects of residue mutation on the catalytic efficiency of the glycoside hydrolysis reaction. Regions of mutated sites that increase/decrease catalytic efficiency are highlighted in red/cyan on the cartoon. Ligand is shown as sticks in the rainbow. (a) Beta-D-glucosidase 1, Maize (PDB:1HXJ). (b) Beta-D-glucosidase, Rye (PDB:3AIU).
Catalysts 11 00286 g003
Figure 4. View of predicting effects of residue mutation on the catalytic efficiency of the phosphohydrolysis reaction. Regions of mutated sites that decrease catalytic efficiency are highlighted in cyan on the cartoon. Ligand is shown as sticks in the rainbow. (a) Phosphonoacetaldehyde hydrolase (PDB:1SWW). (b) RNA helicase (PDB:5Z3G).
Catalysts 11 00286 g004
Figure 5. View of predicting effects of residue mutation on the catalytic efficiency of the lactam hydrolysis reaction (Beta-Lactamase, PDB:1BC2). Regions of mutated sites that decrease catalytic efficiency are highlighted in cyan on the cartoon. Ligand is shown as sticks in the rainbow.
Catalysts 11 00286 g005
Figure 6. View of predicting effects of residue mutation on the catalytic efficiency of the ester hydrolysis reaction (Pectin Esterase A, PDB:1QJV). Regions of mutated sites that decrease catalytic efficiency are highlighted in cyan on the cartoon. Ligand is shown as sticks in the rainbow.
Catalysts 11 00286 g006
Figure 7. View of predicting effects of residue mutation on the catalytic efficiency of the amino acid hydrolysis reaction (Arginase, PDB:1RLA). Regions of mutated sites that decrease catalytic efficiency are highlighted in cyan on the cartoon. Ligand is shown as sticks in the rainbow.
Catalysts 11 00286 g007
Figure 8. The method workflow.
Catalysts 11 00286 g008
Table 1. Prediction of effects on the catalytic efficiency of hydrolases by residue mutation on different classifiers.
Classifier.AccuracyPrecisionRecallAUCMCC
Random Forest0.80.80.620.800.382
Gaussian Process0.770.690.680.730.363
Neural Net0.770.690.660.740.353
Naive Bayes0.550.640.670.670.307
Nearest Neighbors0.760.670.580.670.232
Decision Tree0.70.600.610.610.213
SVM0.750.880.520.740.152
Table 2. Prediction of effects on the catalytic efficiency of hydrolases by residue mutation on validation and test set by random forest model.
DataAccuracyPrecisionRecallAUCMCC
Validation Set0.810.760.690.800.448
Test Set0.890.890.780.860.659
Table 3. Kcat/Km parameters of wild-type enzymes and their mutants.
Mutation TypeProtein NameMutantKcat/Km(wt)/
s−1uM−1
Kcat/Km(mut)/
s−1uM−1
Increase/Decrease Fold
Increasing-
Mutation
Beta-D-glucosidase(Maize)V205L0.08190.08691.1
P377A0.08190.1051.3
Beta-D-glucosidase(Rye)G464F0.012470.0151.2
S465L0.012470.037243.0
Decreasing-MutationBeta-D-glucosidase(Maize)F198V0.08190.01485.5
D261N0.04610.005528.4
M263F0.04610.027071.7
Beta-D-glucosidase(Rye)F198A0.14750.00528327.9
Y378A0.14750.13741.1
Phosphonoacetaldehyde hydrolaseC22A0.45460.00368123.5
M49L0.45460.000029415,462.6
G50A0.45460.000039111,626.6
H56A0.45460.0005172879.0
Y128F0.45460.049119.3
RNA helicaseS228A0.00020450.00008332.5
T230A0.00020450.000080242.5
H375A0.00020450.000076092.7
Beta-LactamaseH86S1.3530.0886815.3
H88S1.3530.0156586.5
C168S1.3530.0315842.8
H149S1.3530.0012281101.8
D90E1.3860.0206967.0
H210S1.3860.003562389.1
Pectin Esterase AQ153A3.4620.105532.8
Q177A3.4620.181819.0
V198A3.4621.1333.1
T272A3.4620.55196.3
M306A3.4620.111331.1
ArginaseH101E0.17860.00265567.3
D128E0.17860.000053572.0
H141N0.17860.00233376.6
D232A0.17860.000007523,813.3
D234E0.17860.0026467.7
G235A0.11750.081.5
Publisher’s Note: MDPI stays neutral with regard to jurisdictional claims in published maps and institutional affiliations.

