
LaFeO3 Modified with Ni for Hydrogen Evolution via Photocatalytic Glucose Reforming in Liquid Phase


 ,
,  , ,
, ,  and
and
Abstract
:1. Introduction
2. Material and Methods
2.1. Synthesis of Photocatalysts
2.2. Photocatalysts Characterization
2.3. Photocatalytic Tests
3. Results and Discussion
3.1. Photocatalysts Characterization
3.1.1. X-ray Diffraction (XRD)
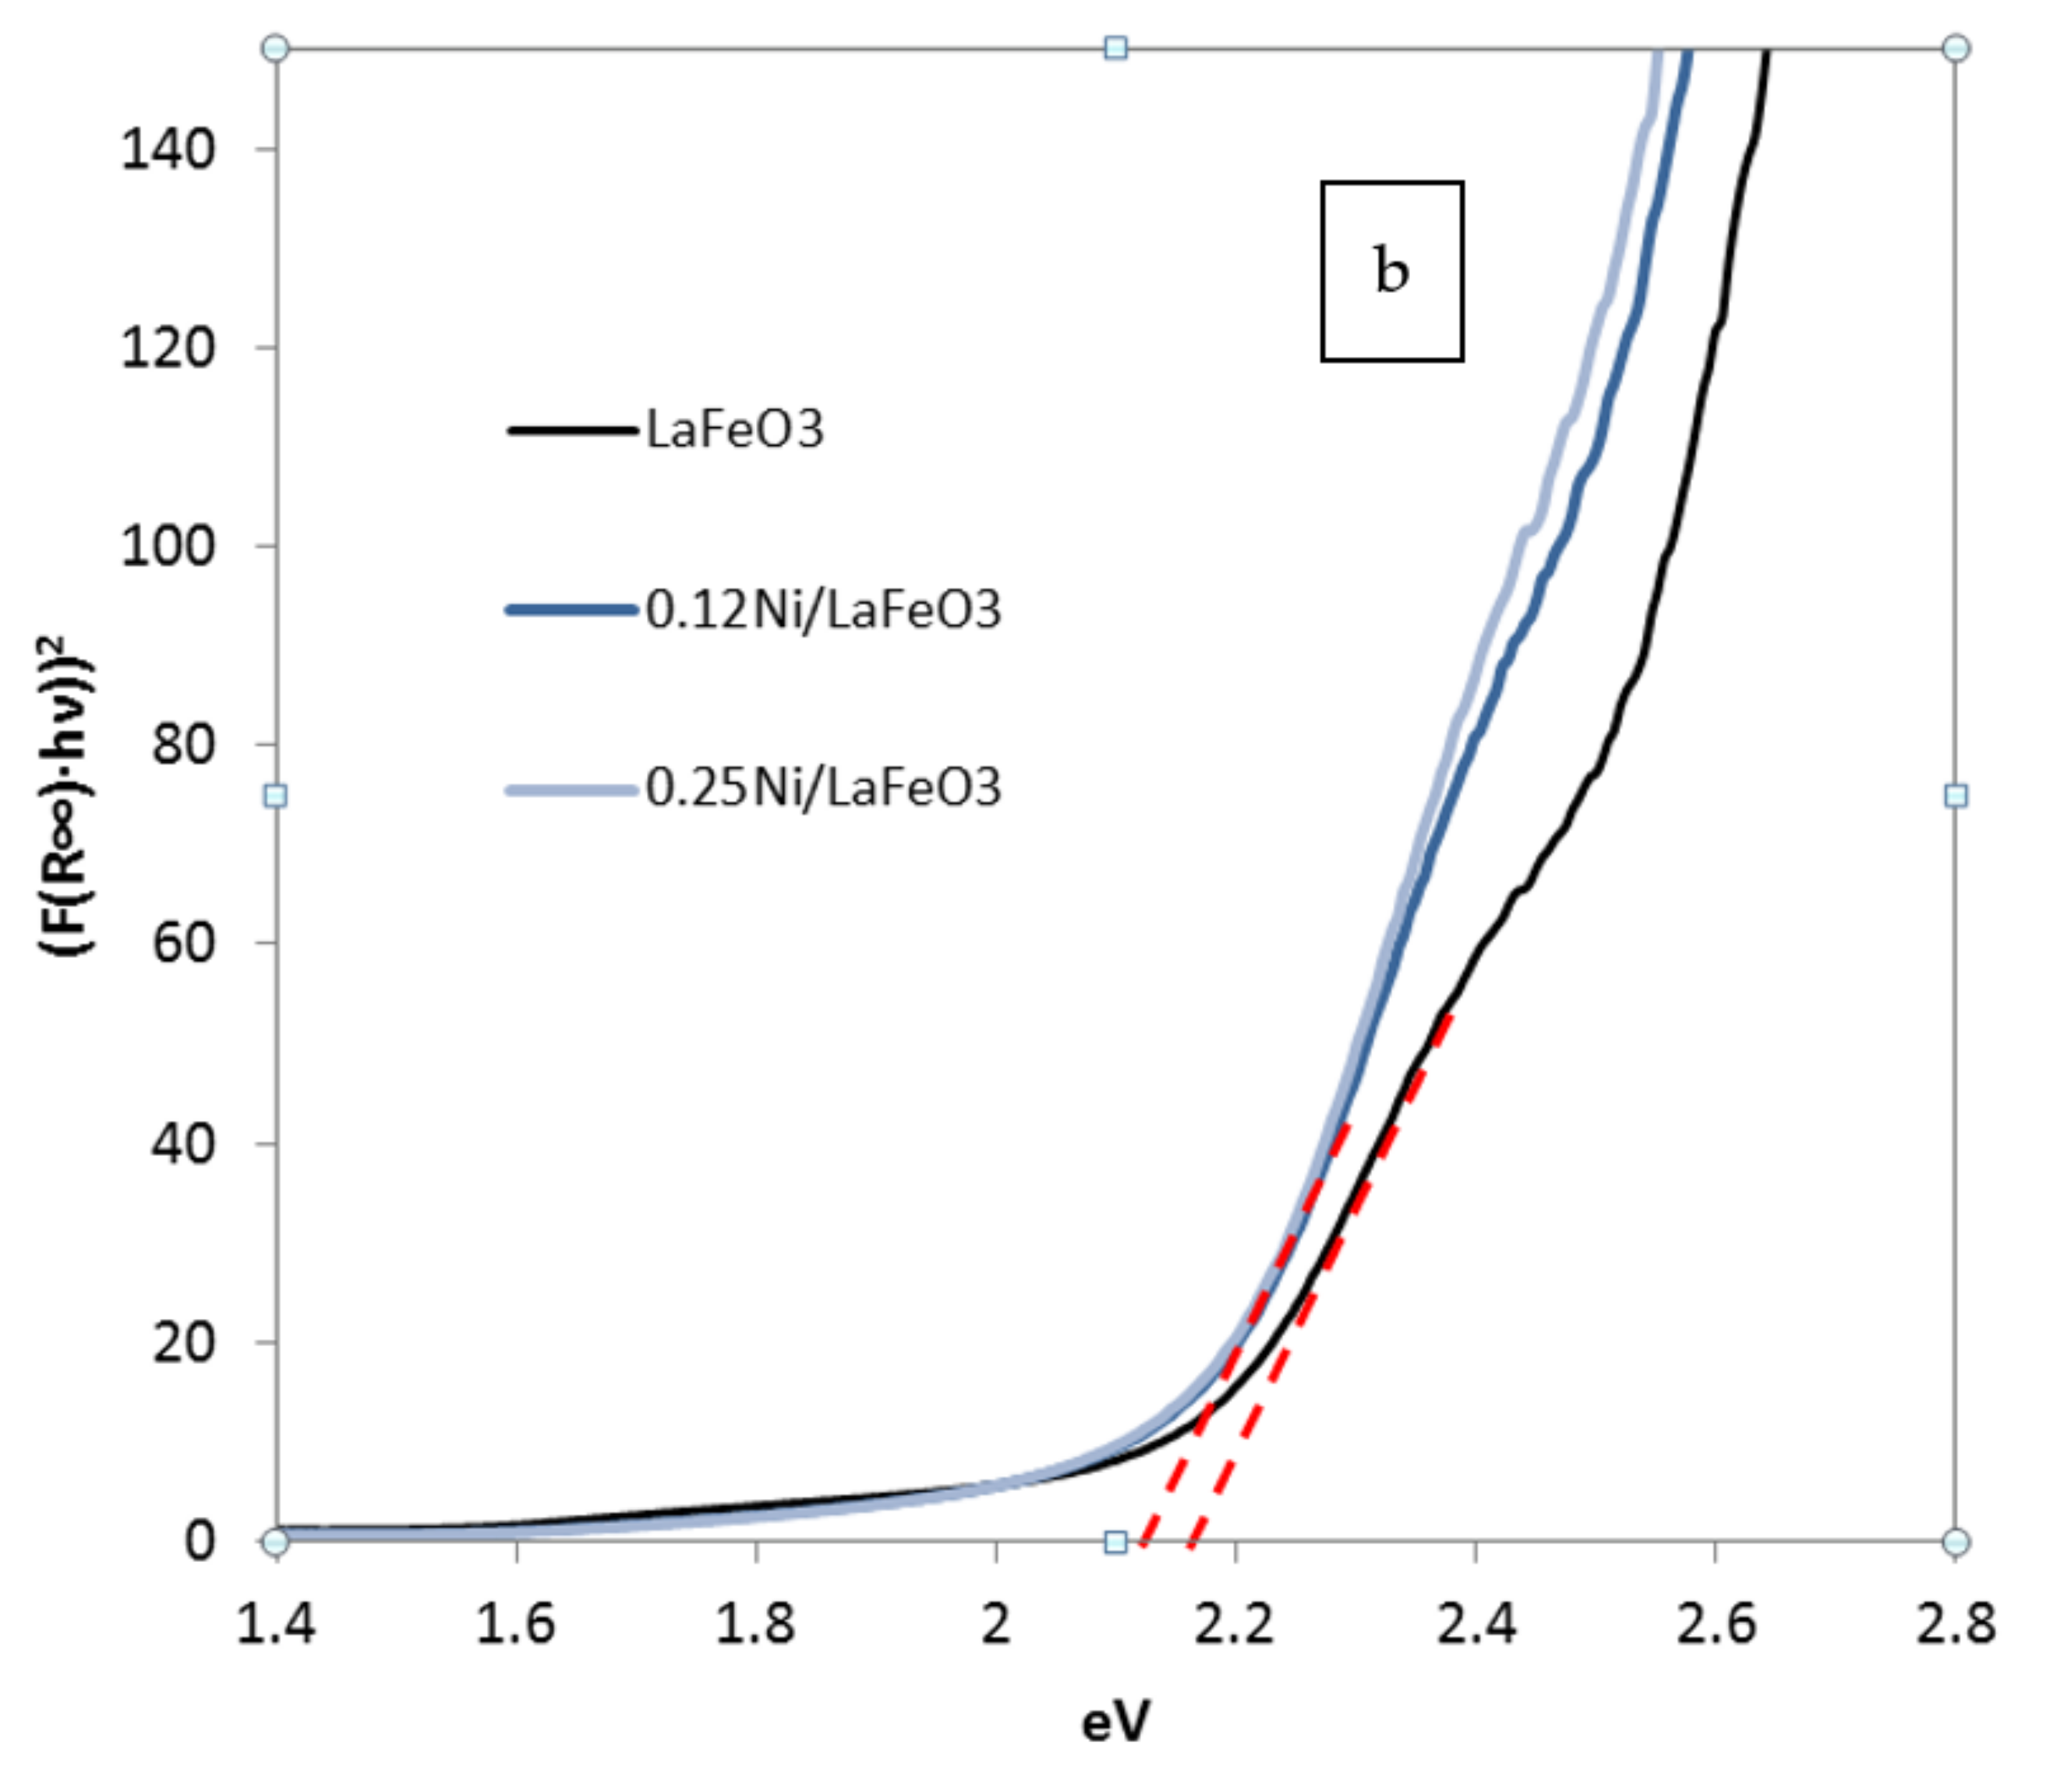
3.1.2. UV-Vis Diffuse Reflectance Spectra
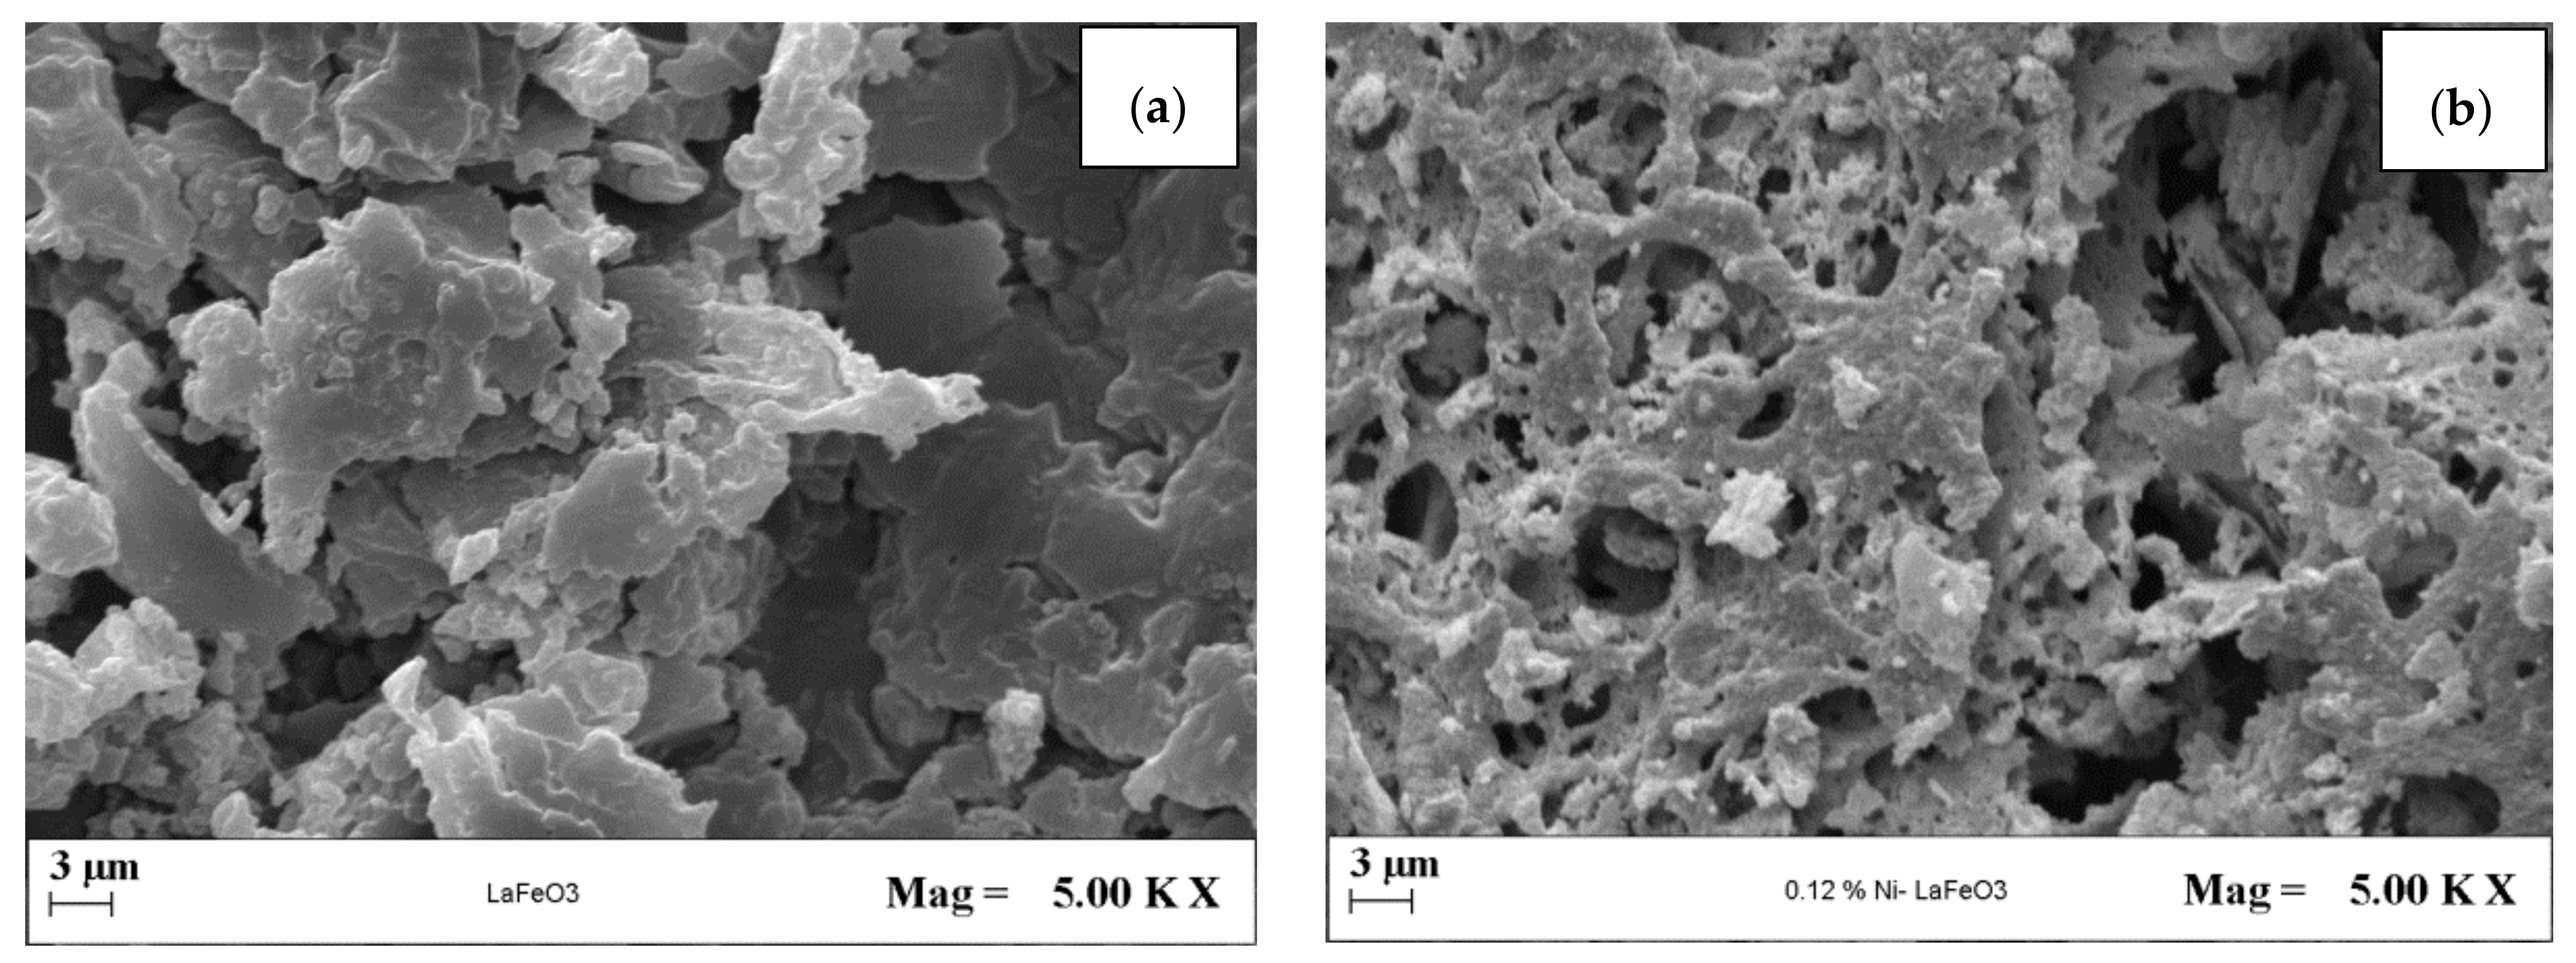
3.1.3. SEM Analysis
3.1.4. Raman Analysis
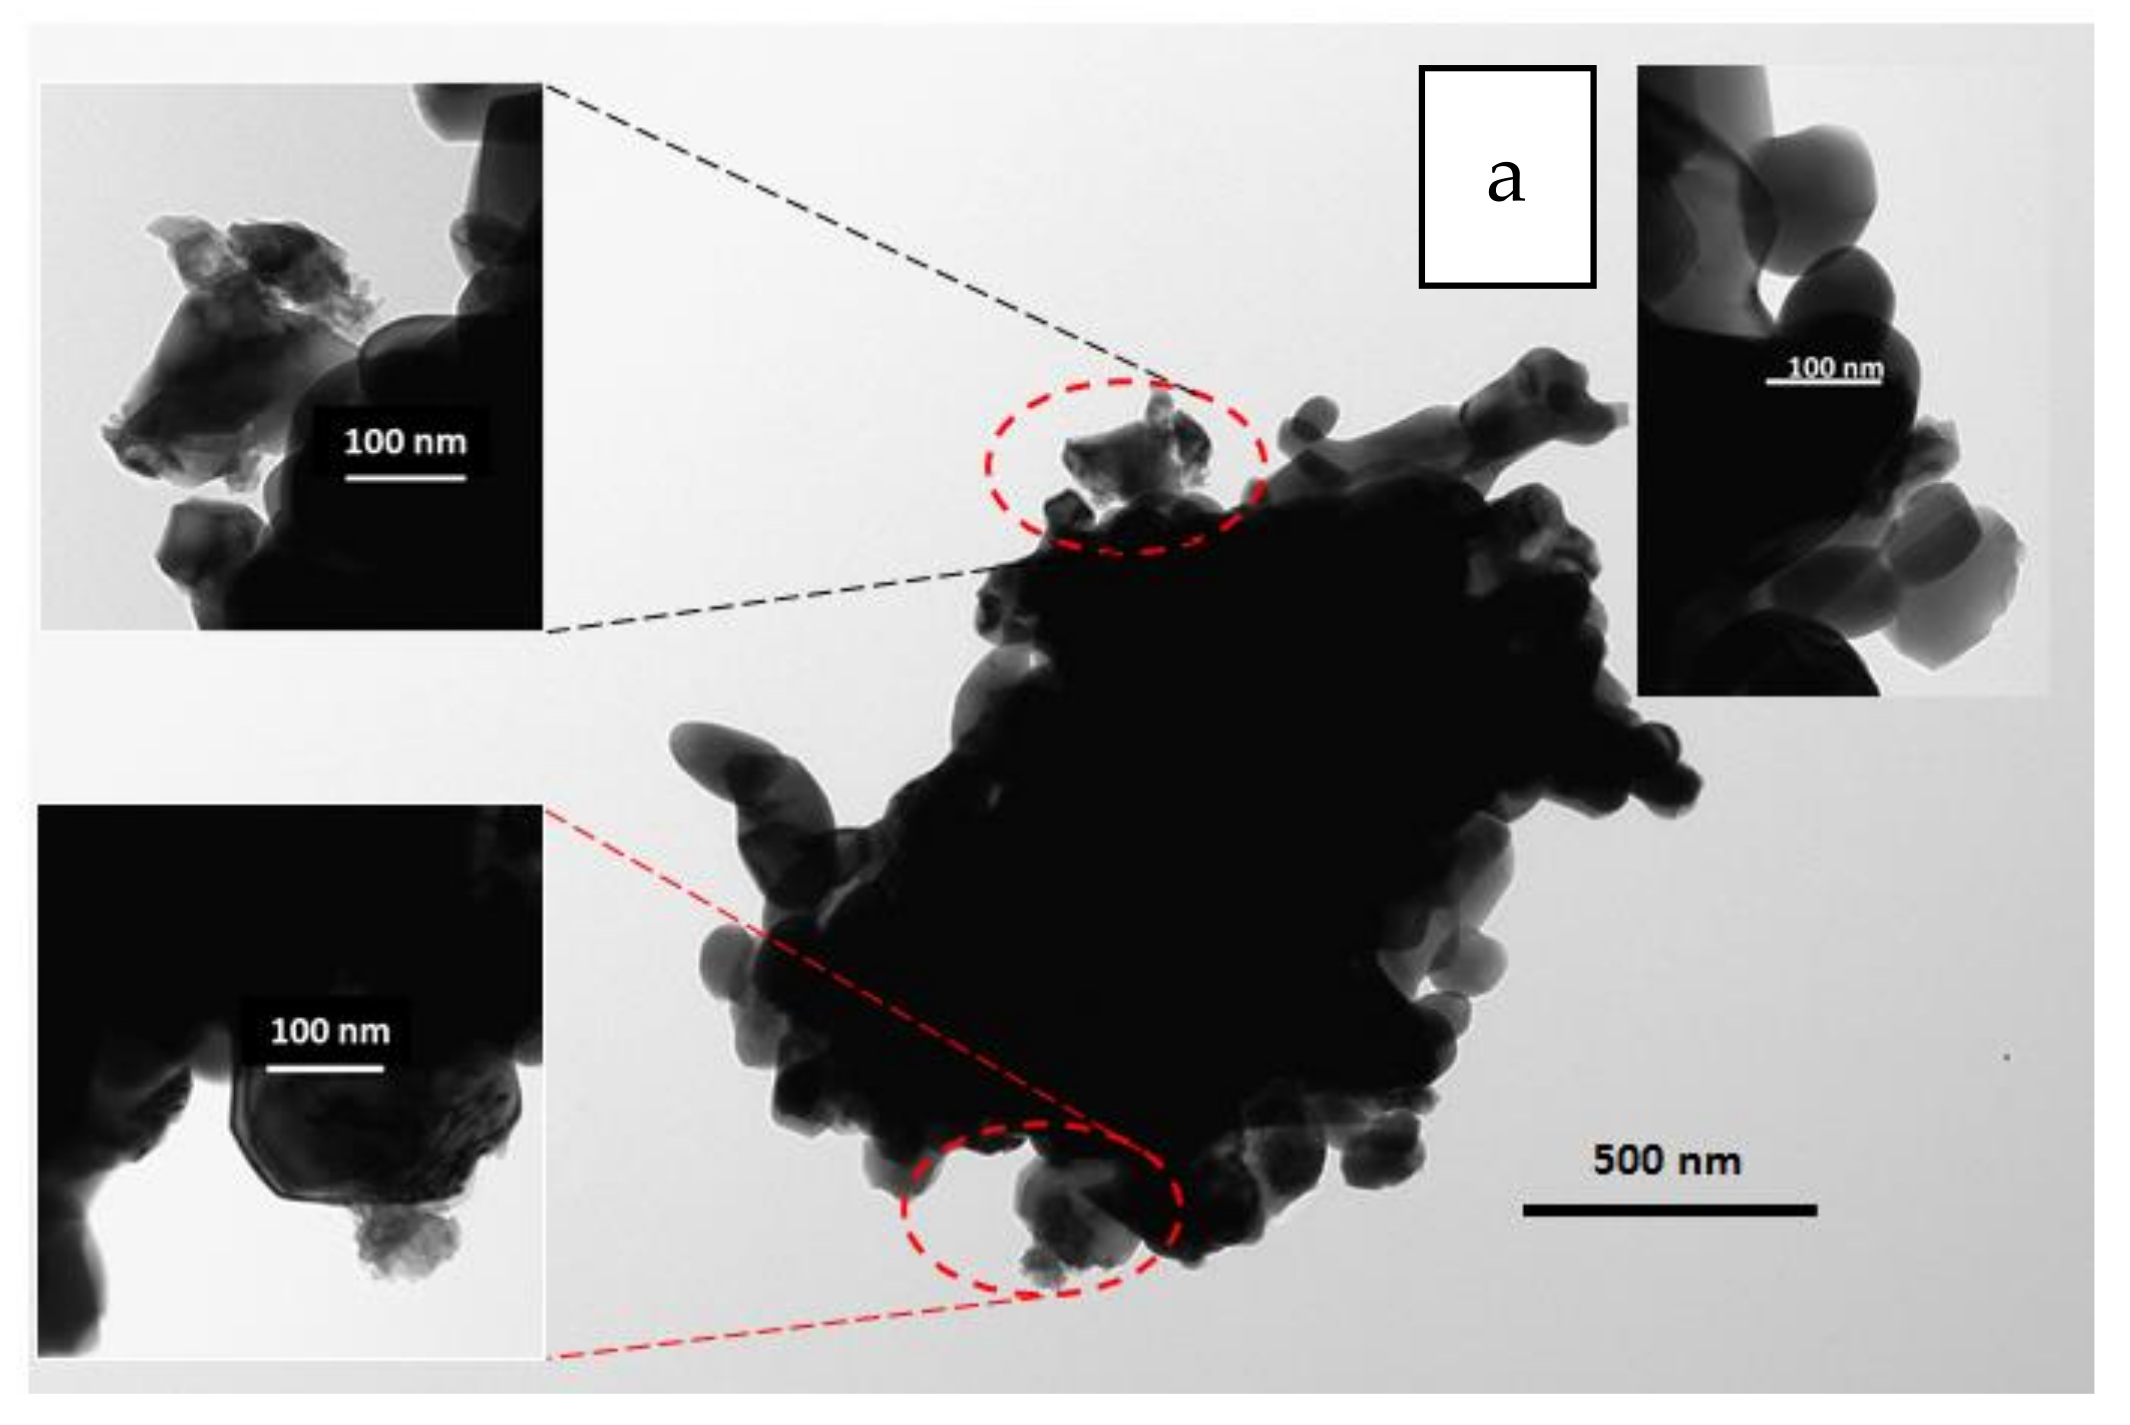
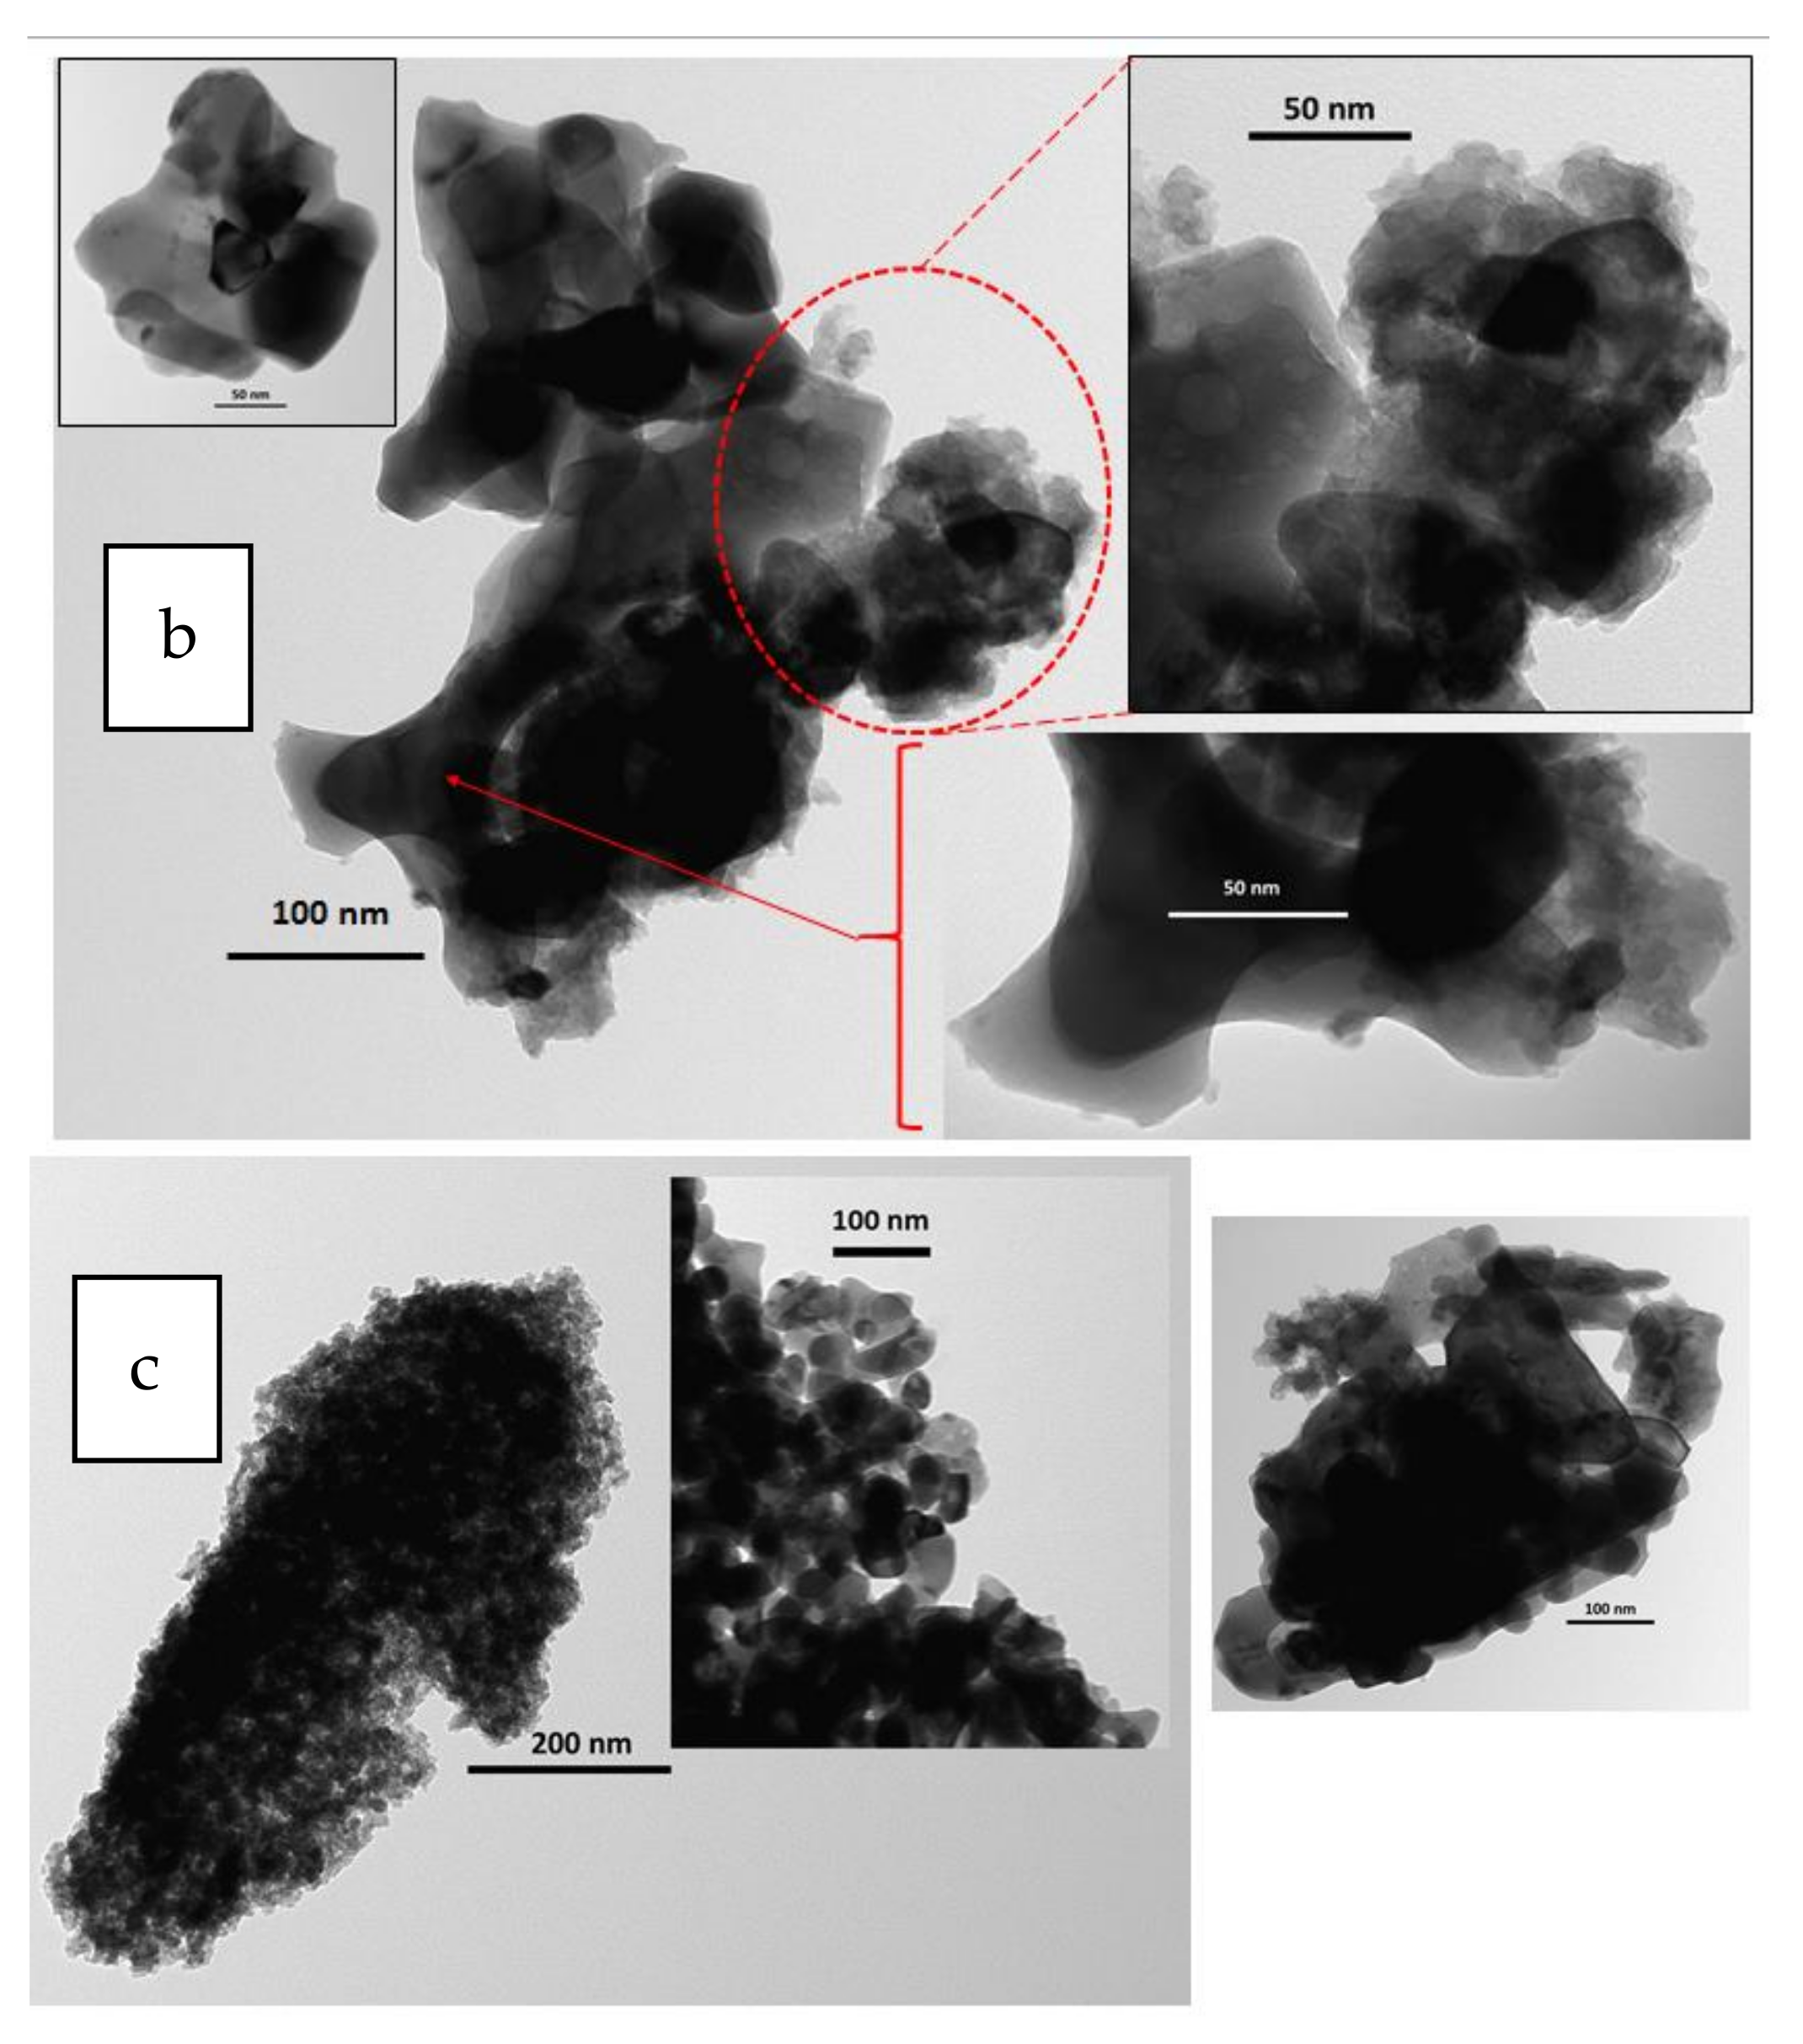
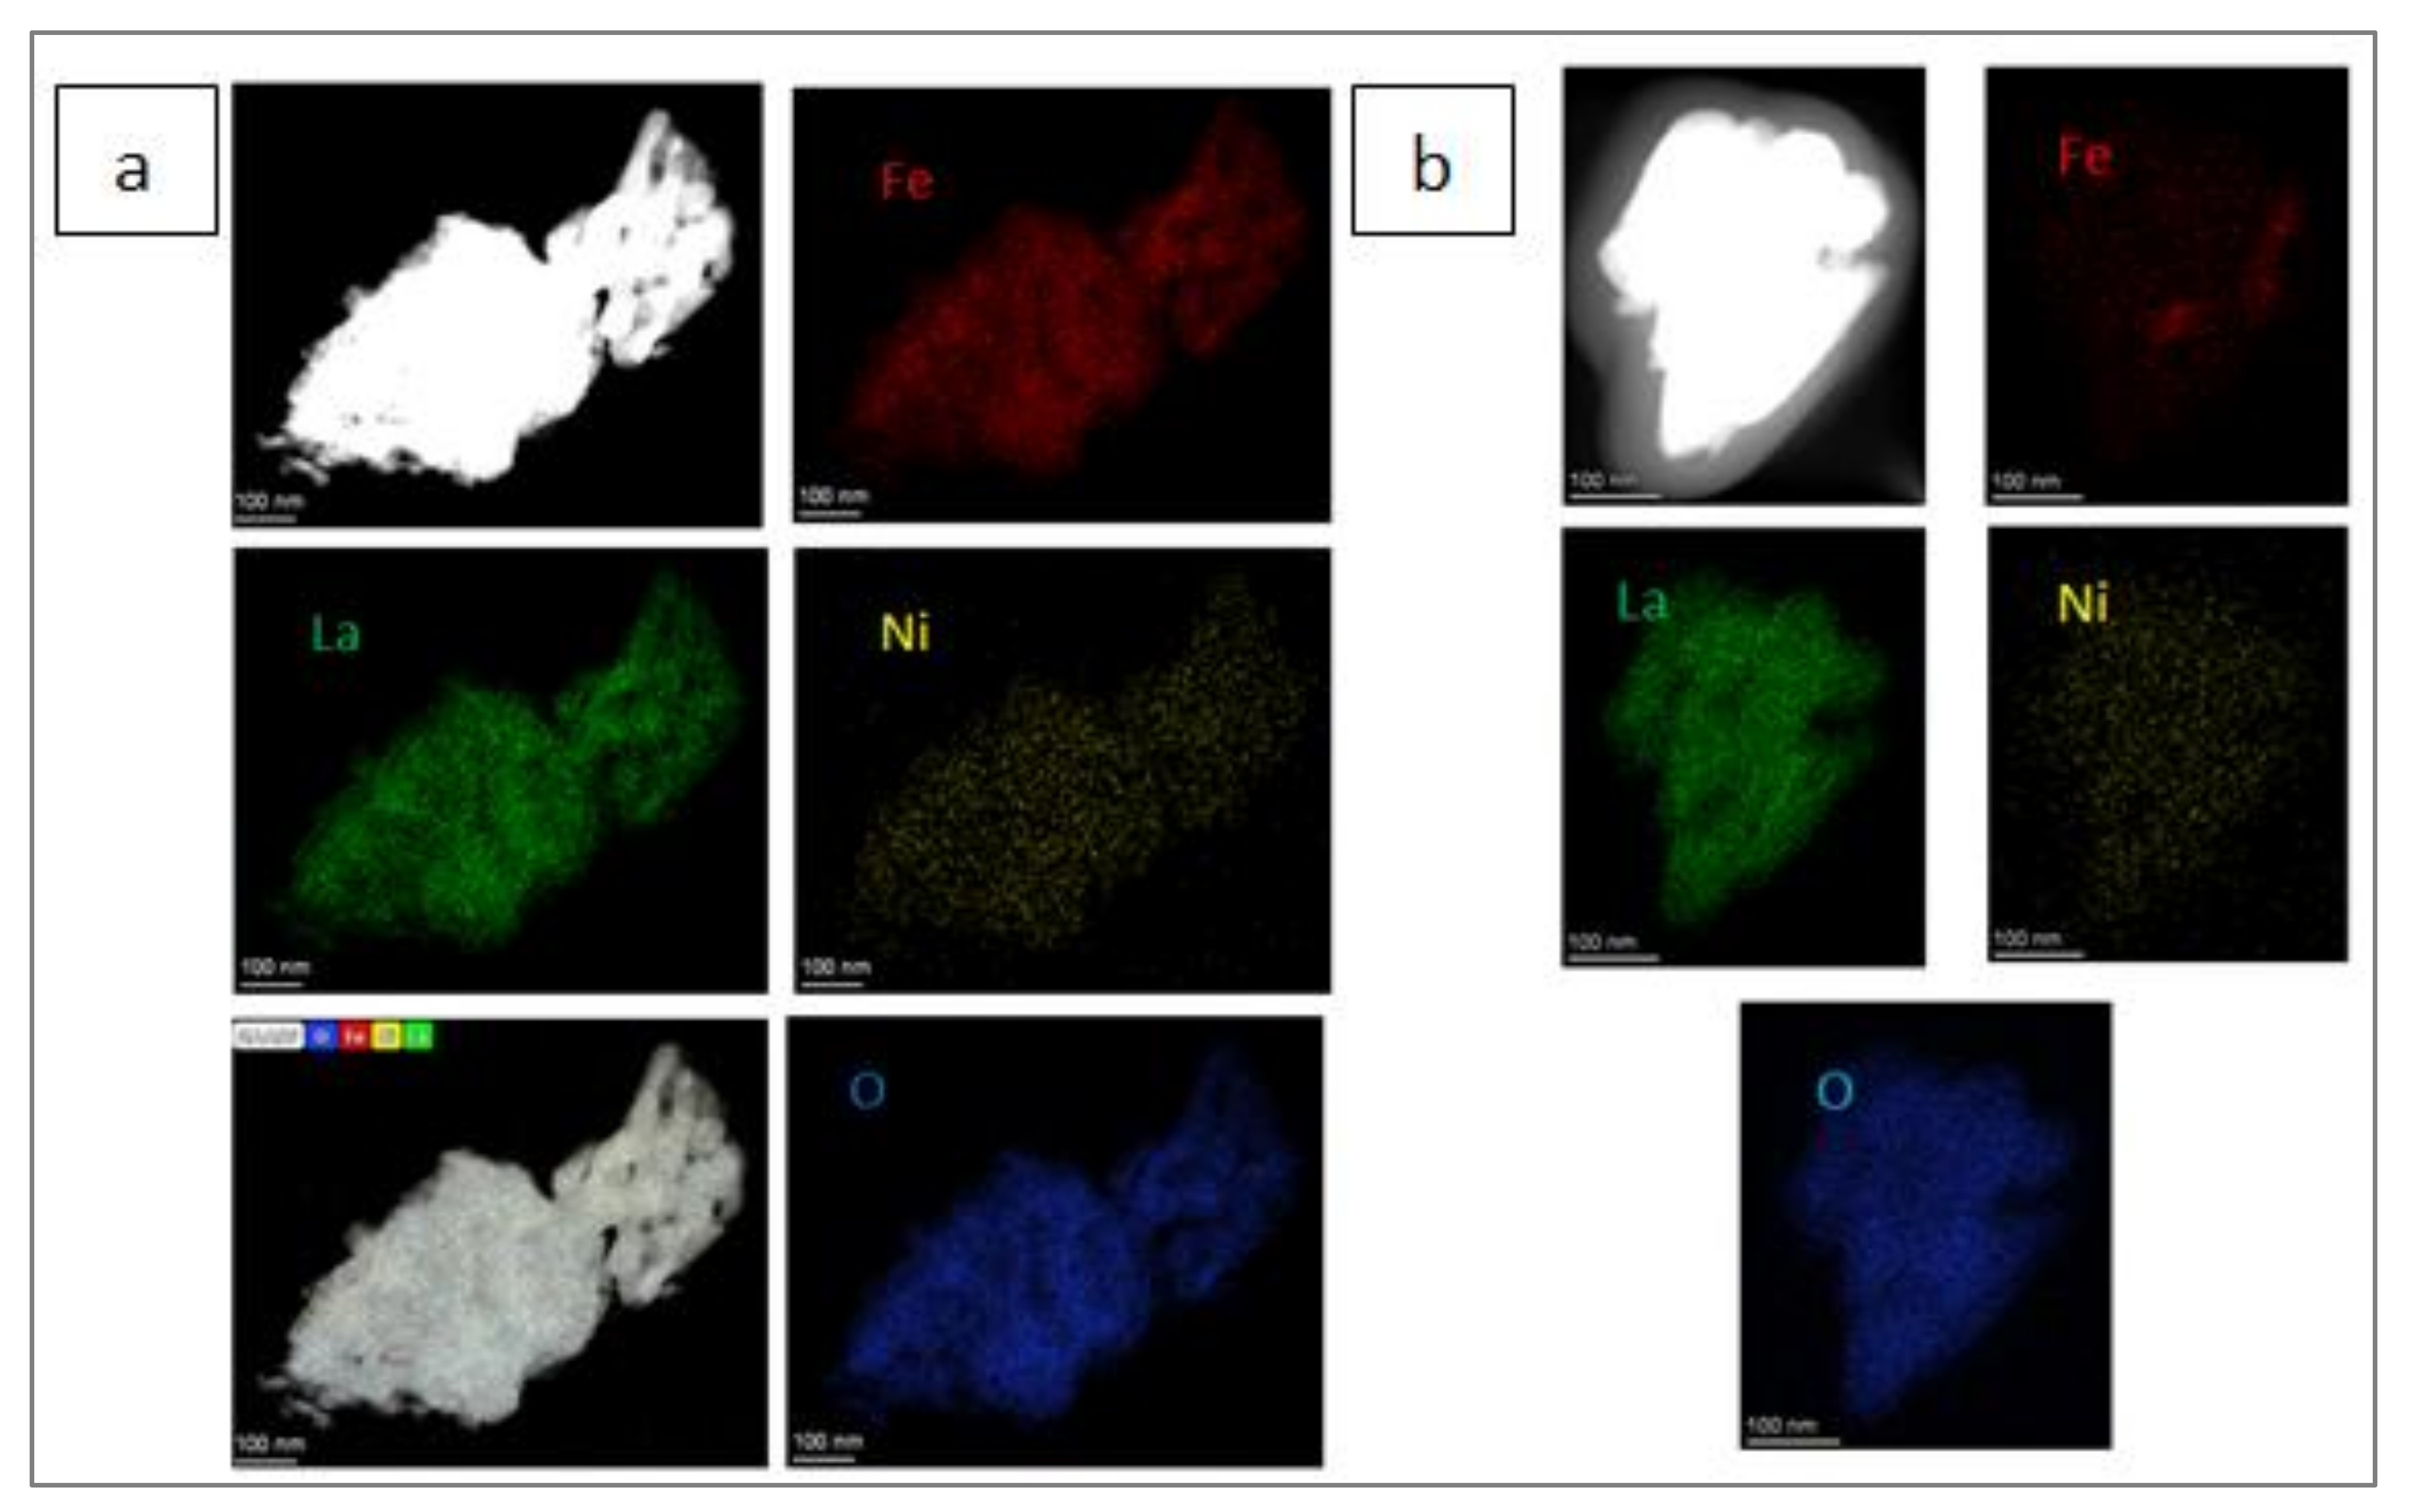
3.1.5. TEM Analysis
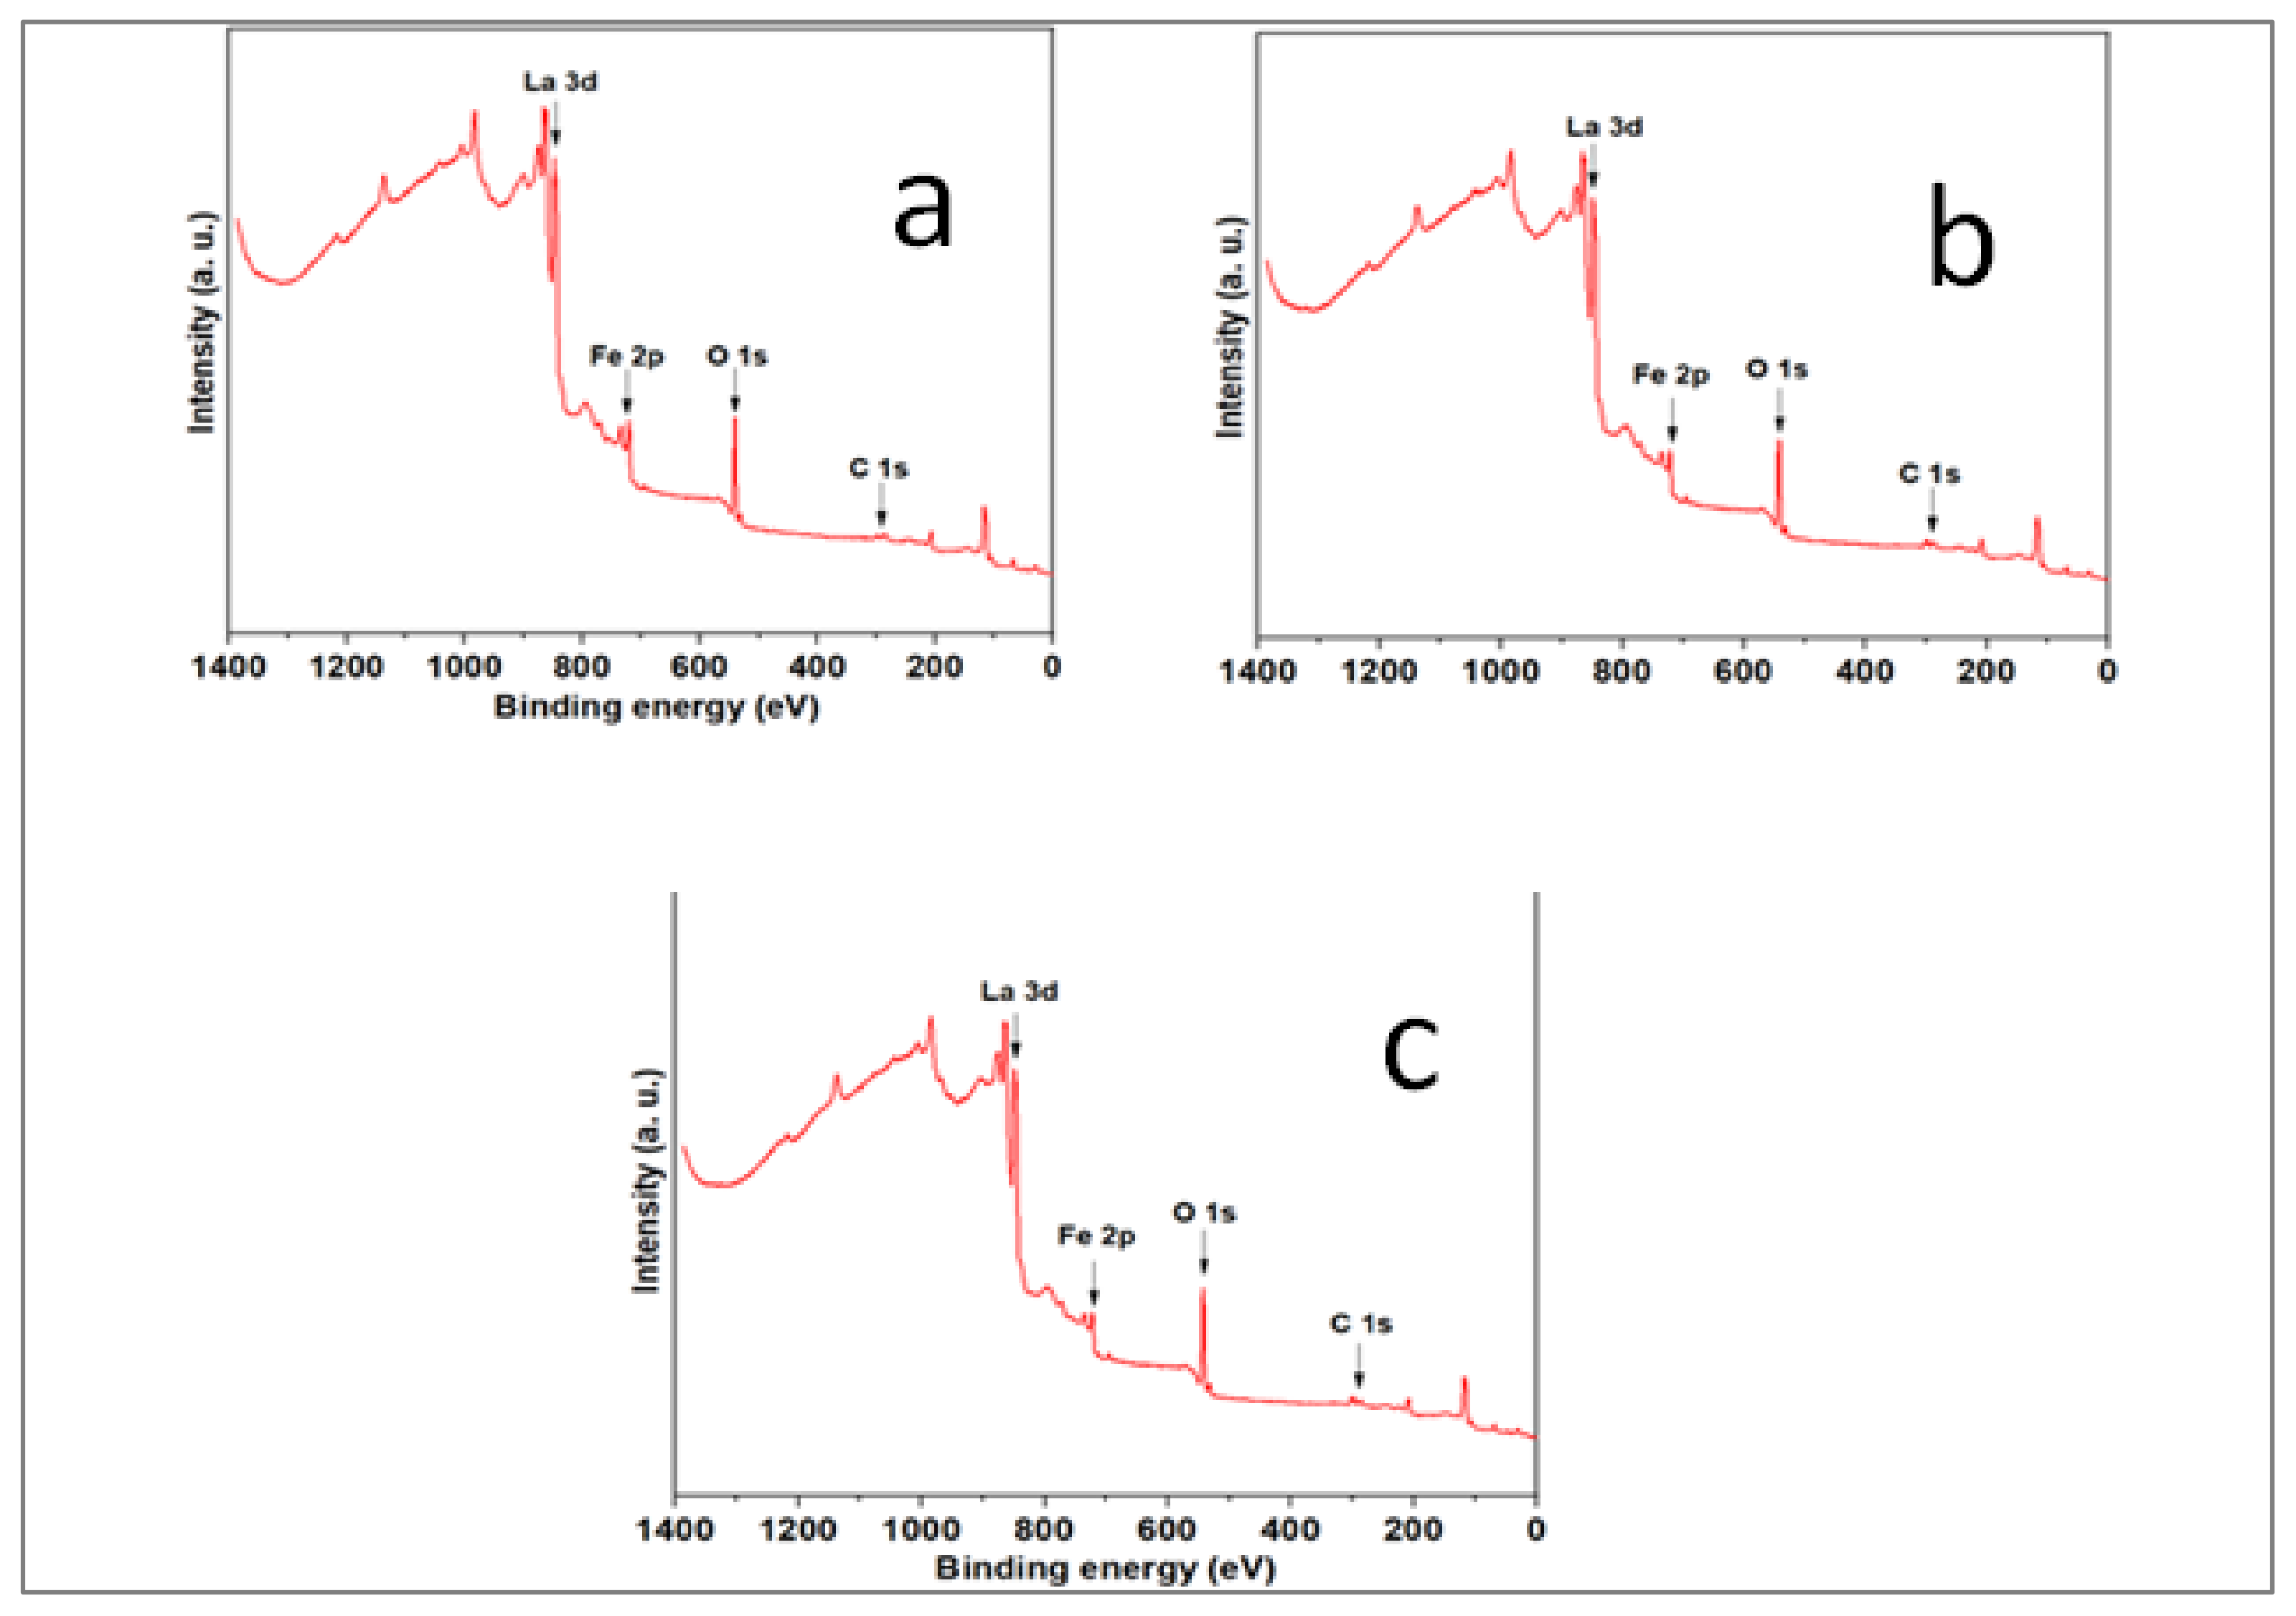
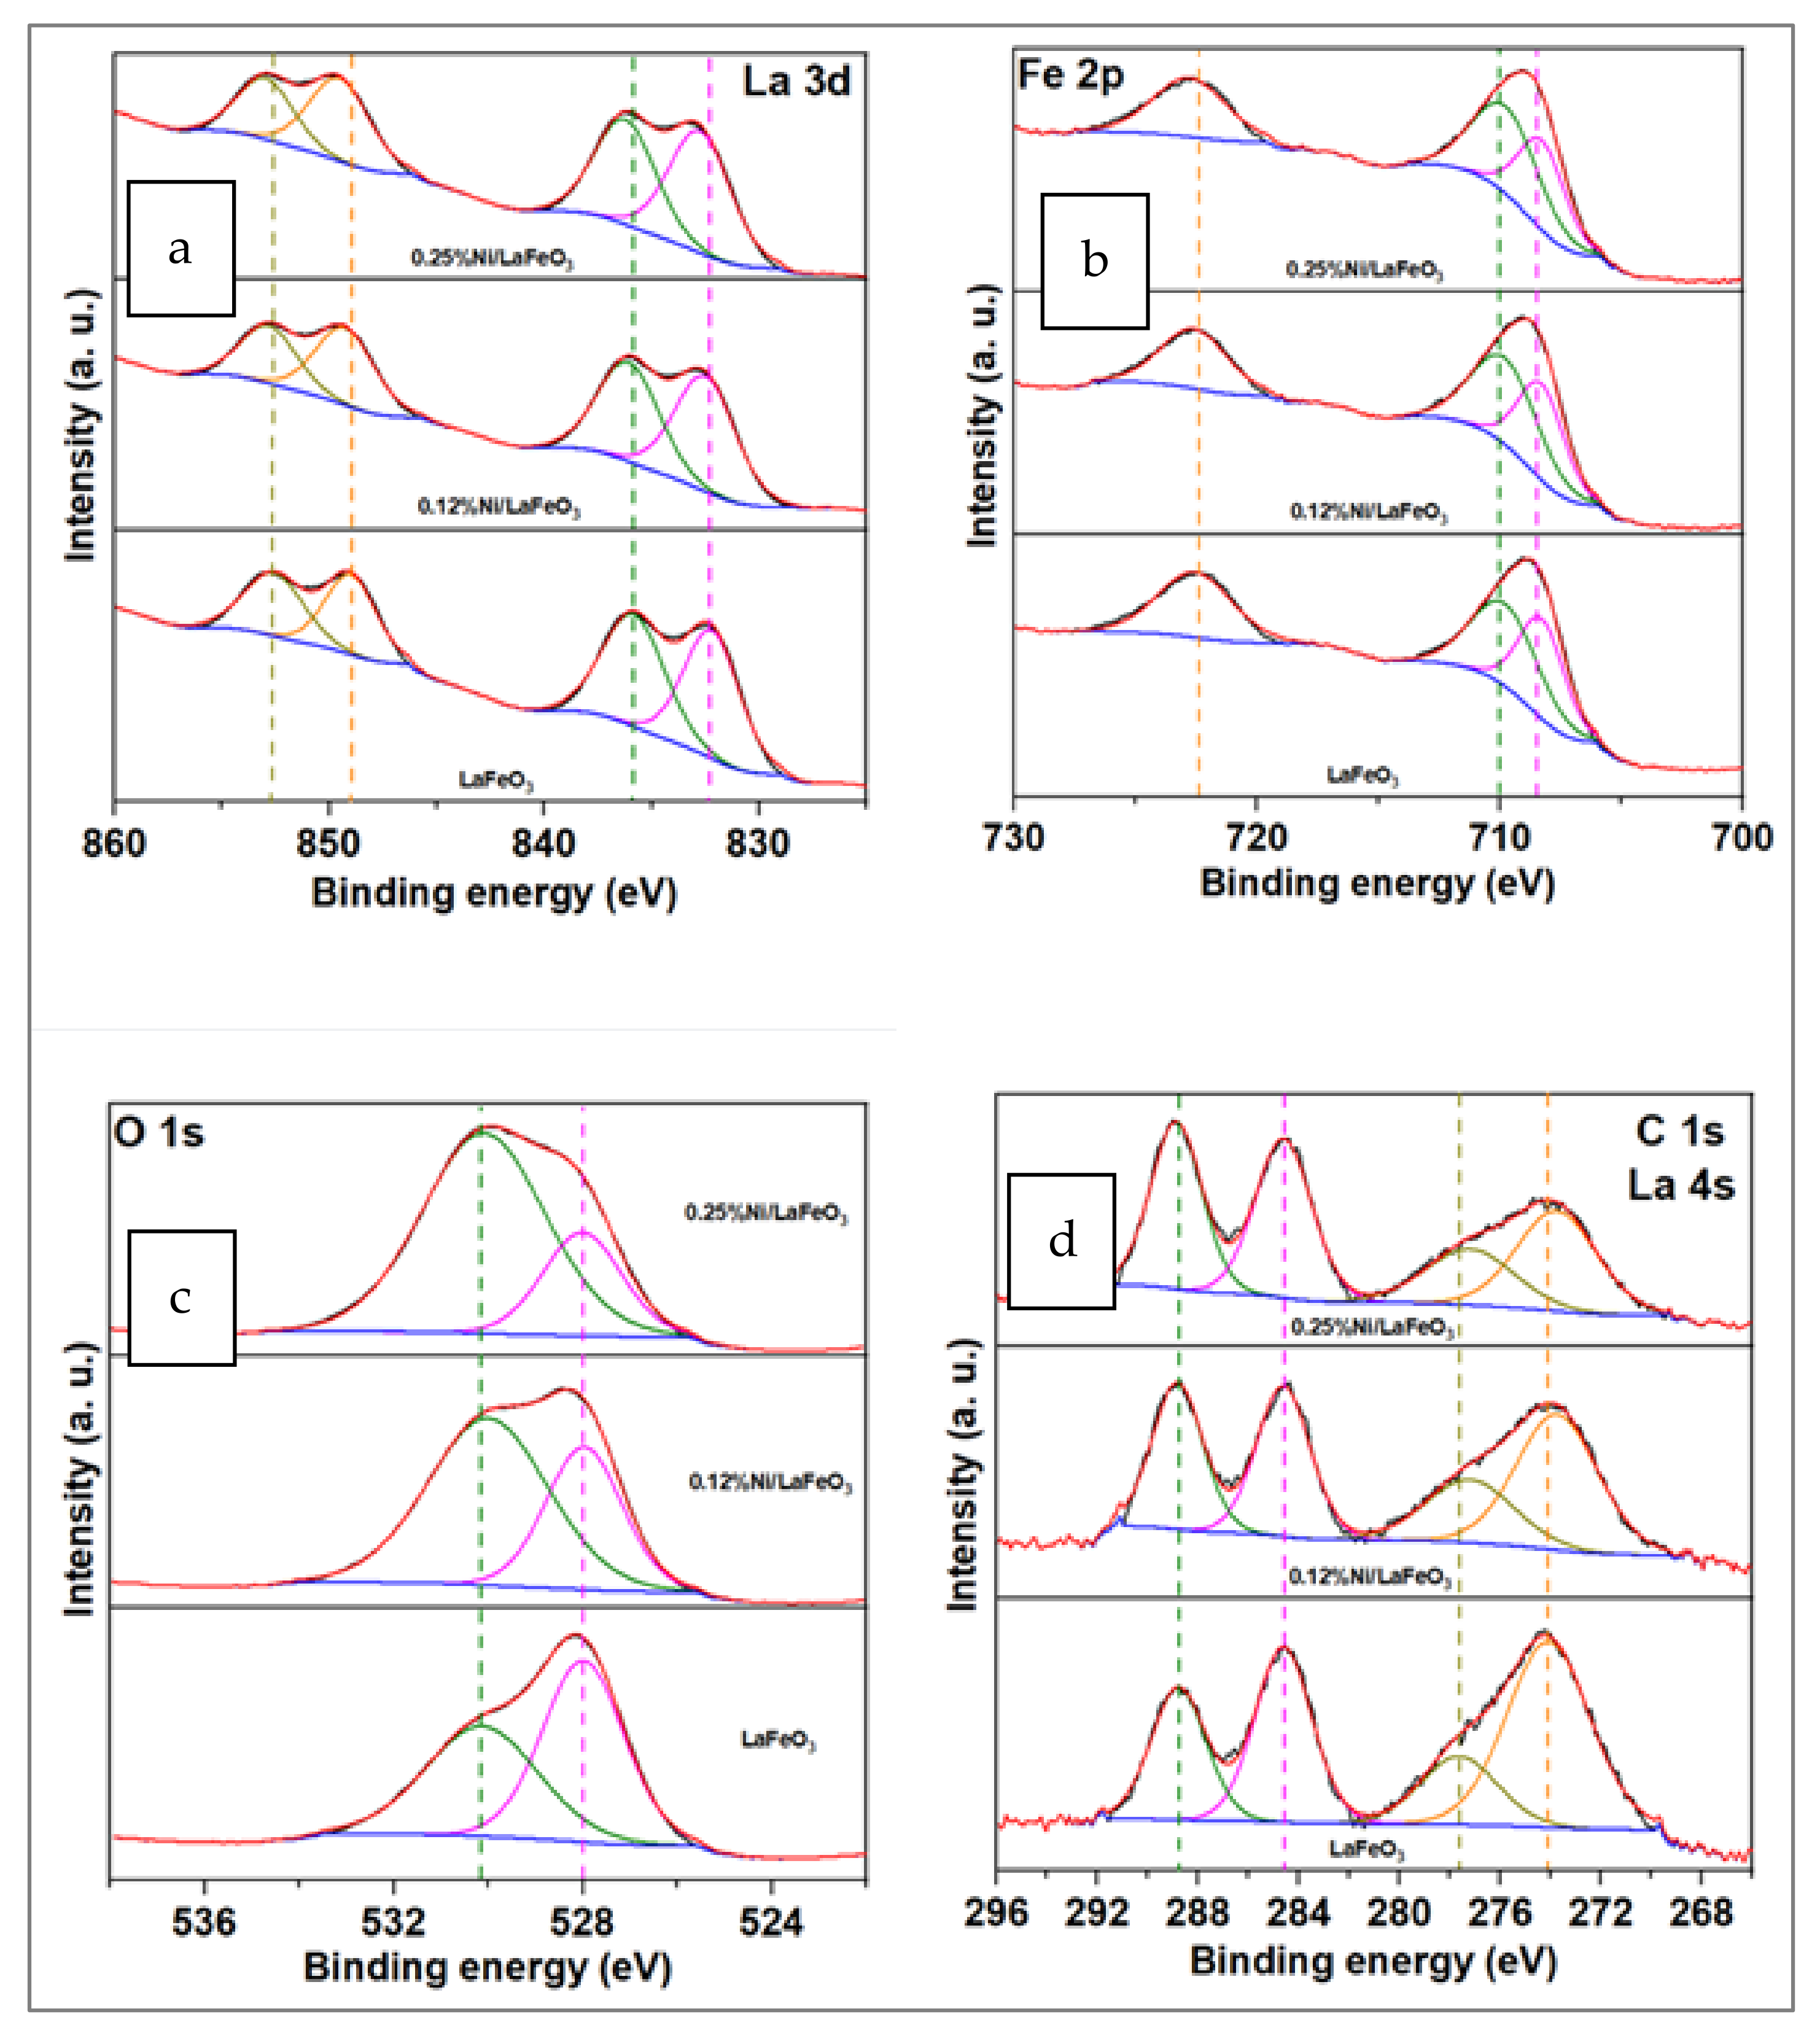
3.1.6. XPS
3.1.7. XRF
3.2. Photocatalytic Hydrogen Production from Glucose Solution
3.2.1. Effect of Ni Amount for the H2 Production
3.2.2. Effect of the Catalyst Dosage
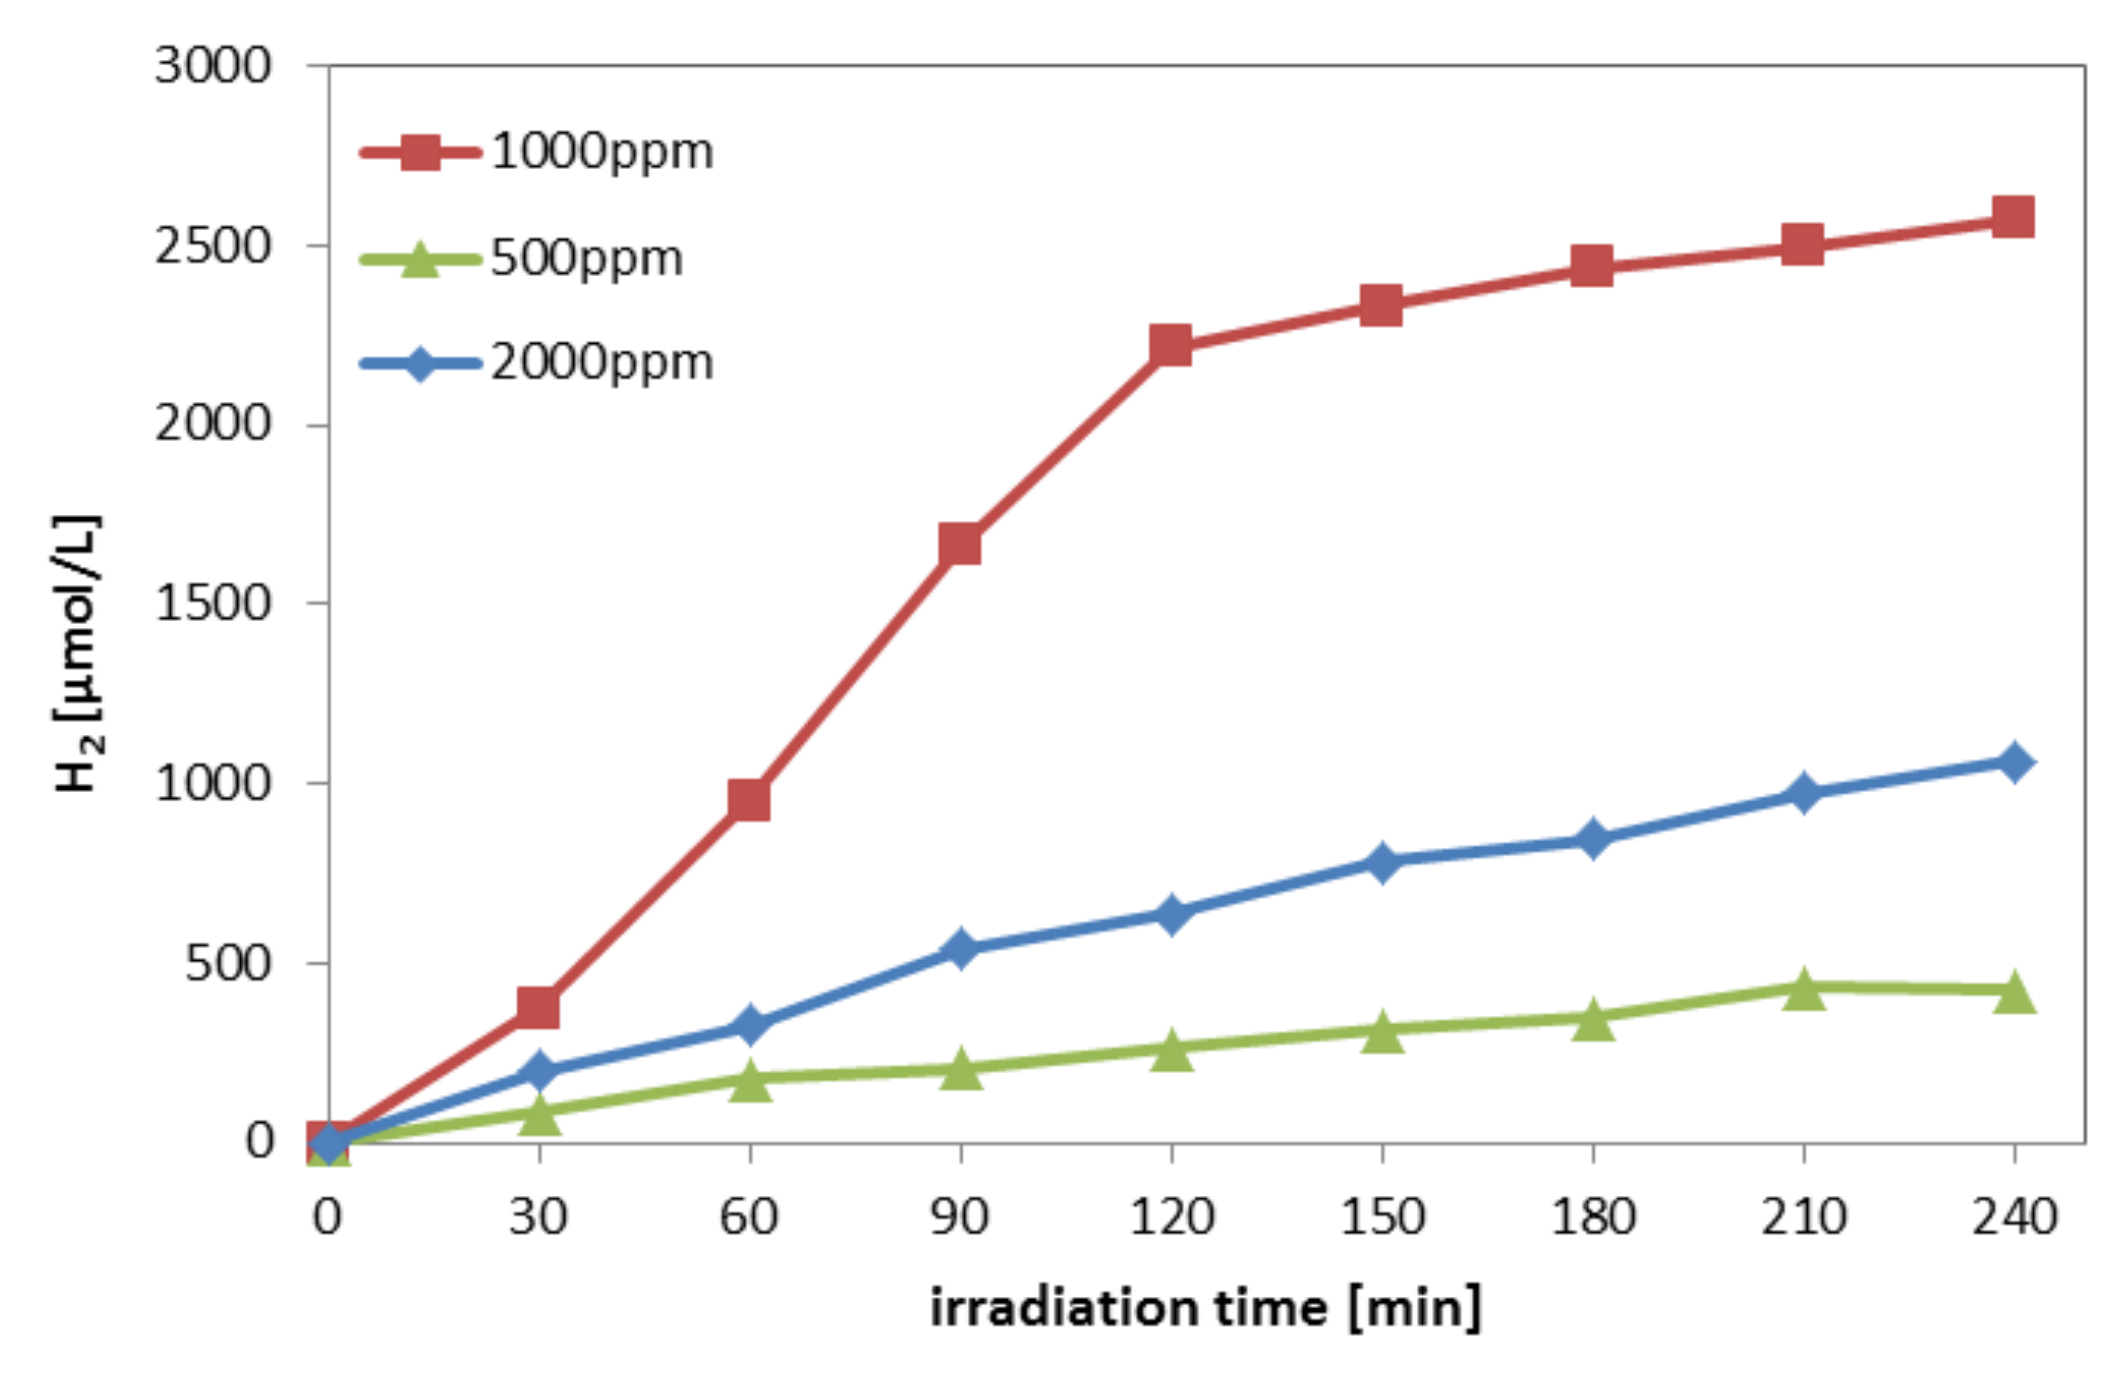
3.2.3. Influence of Initial Glucose Concentration
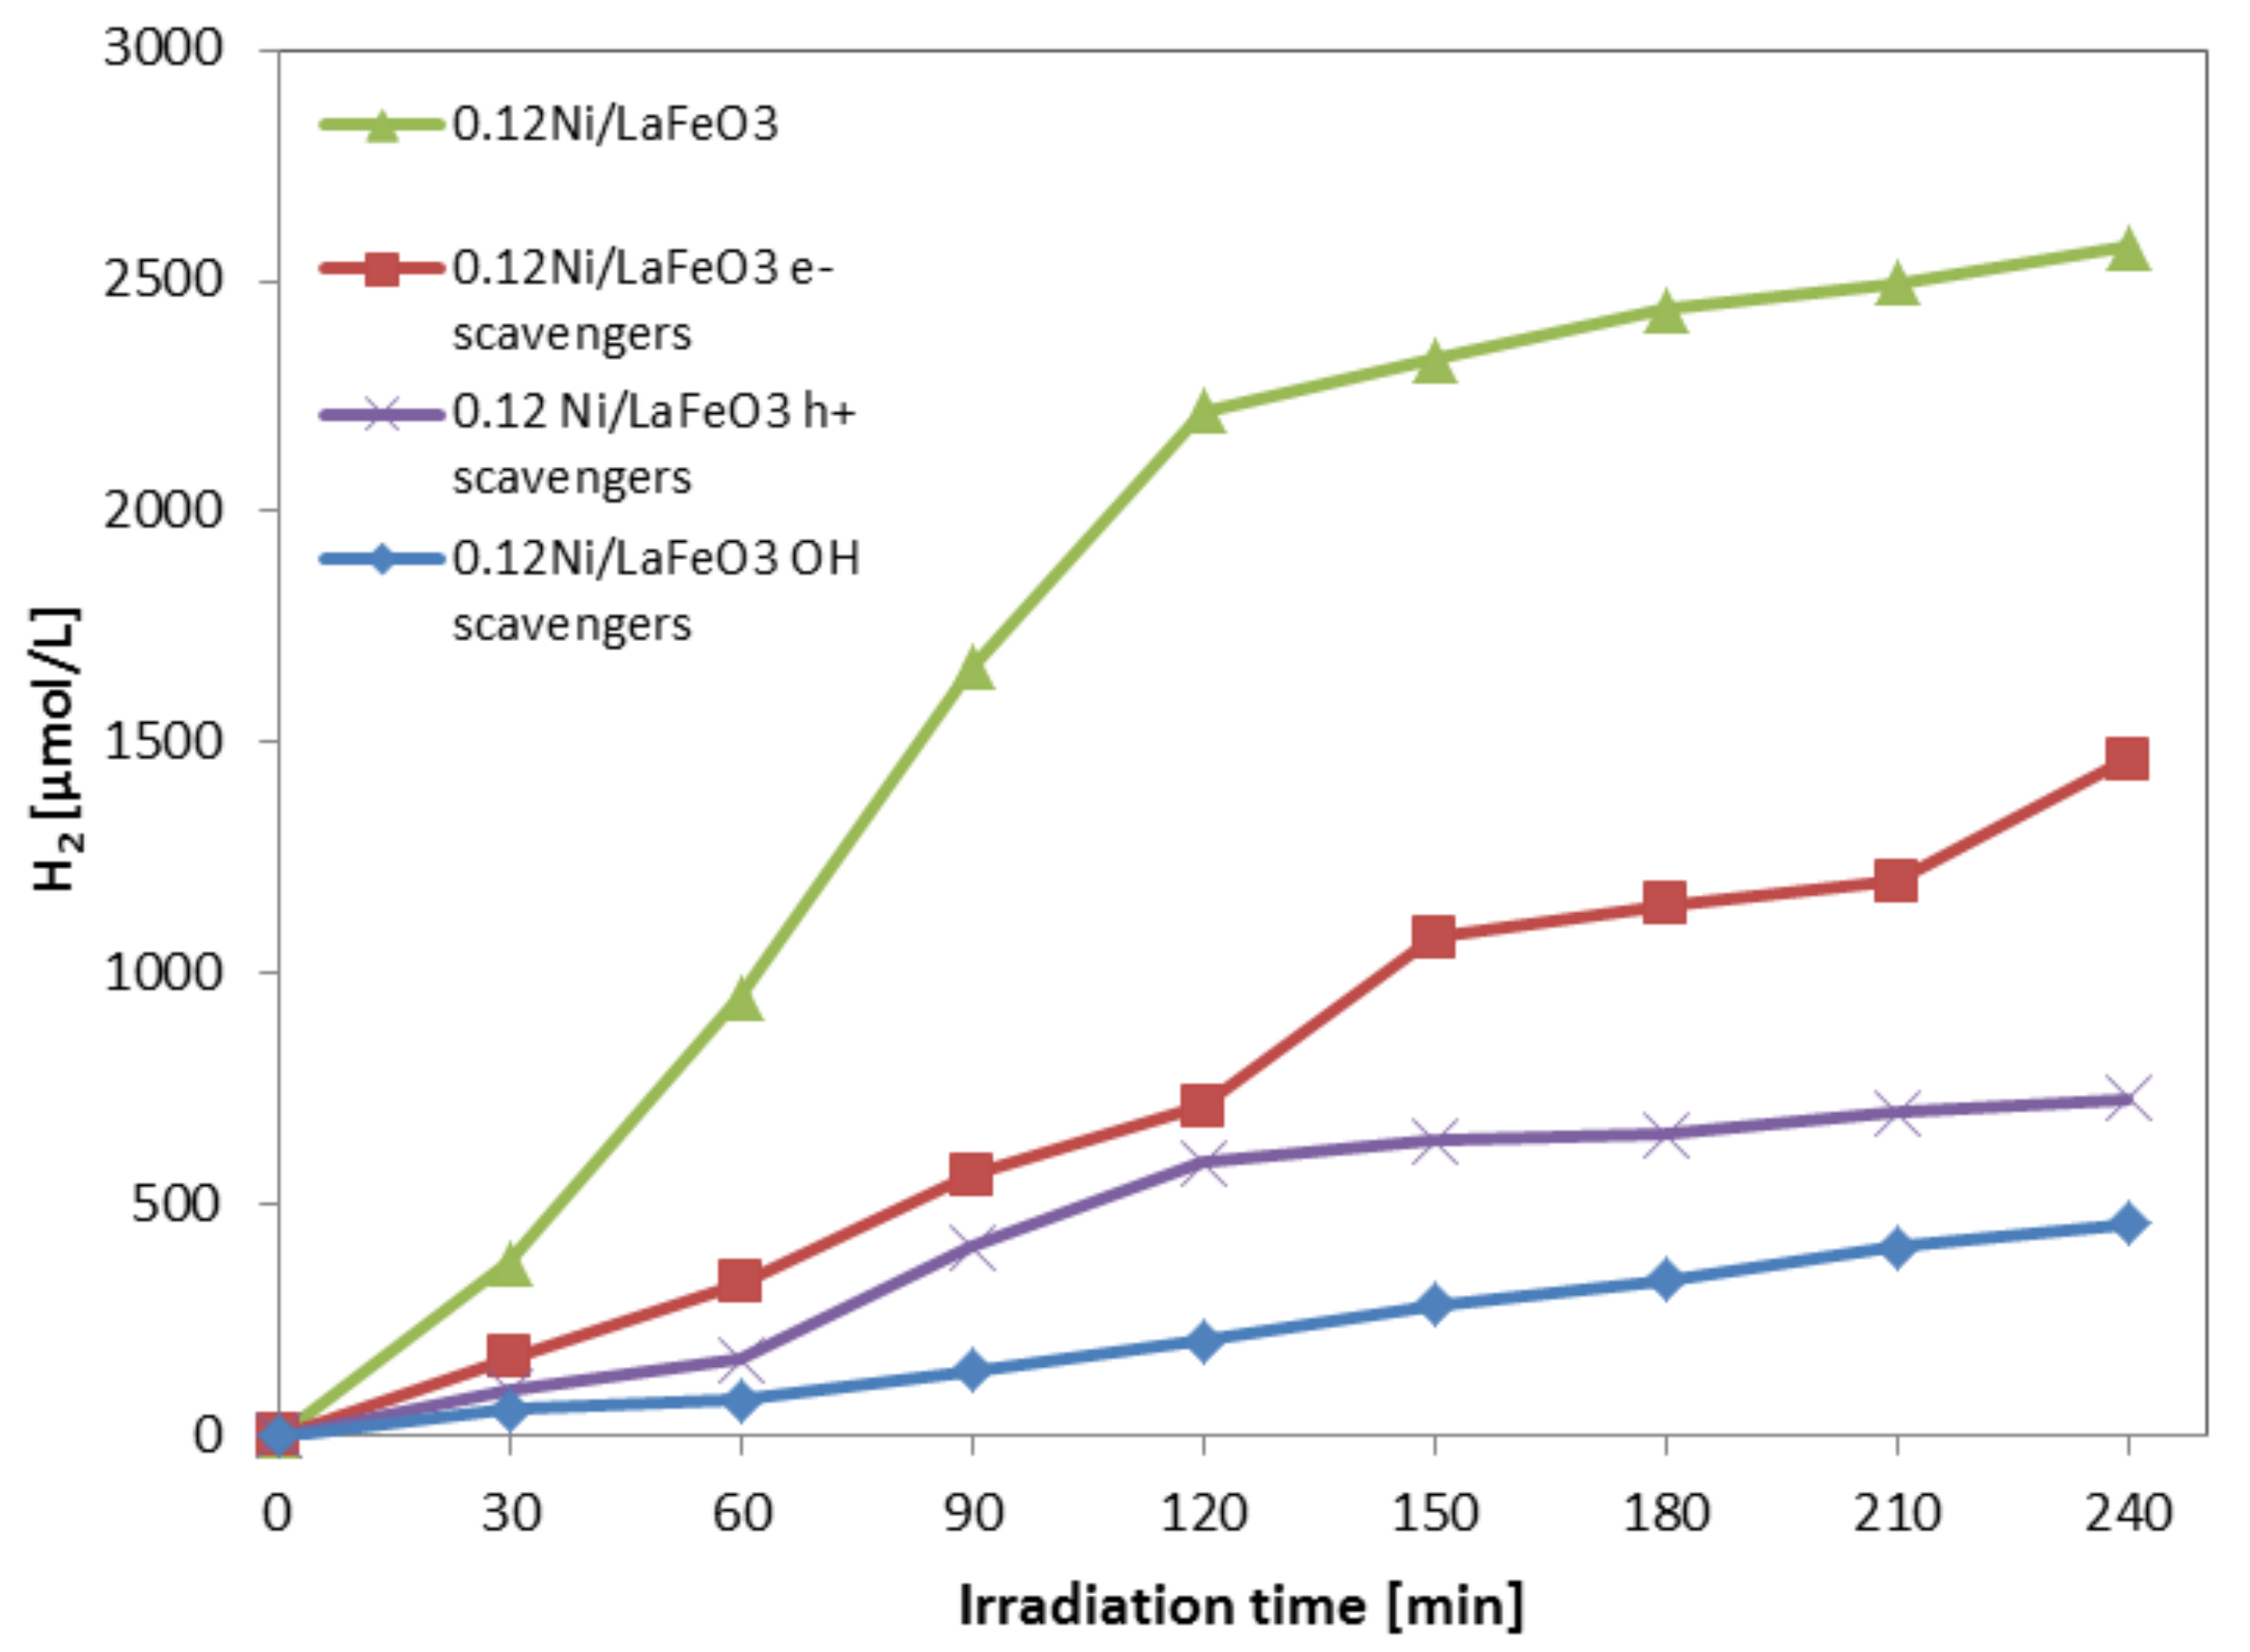
3.2.4. Effect of Radical Scavengers
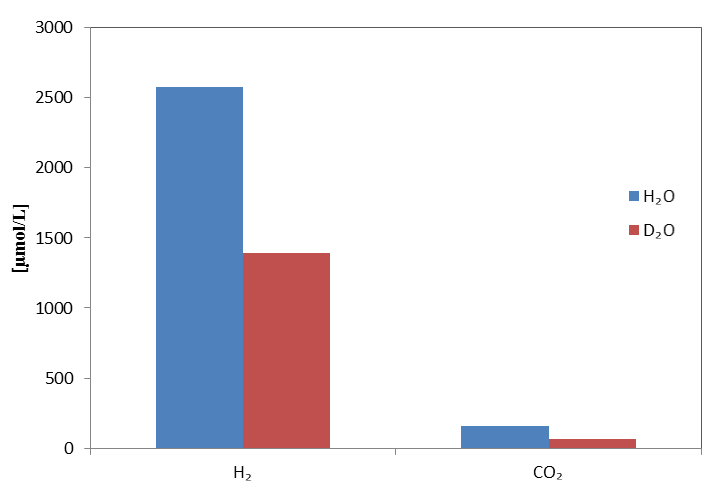
3.2.5. Role of Water in the Reaction Mechanism
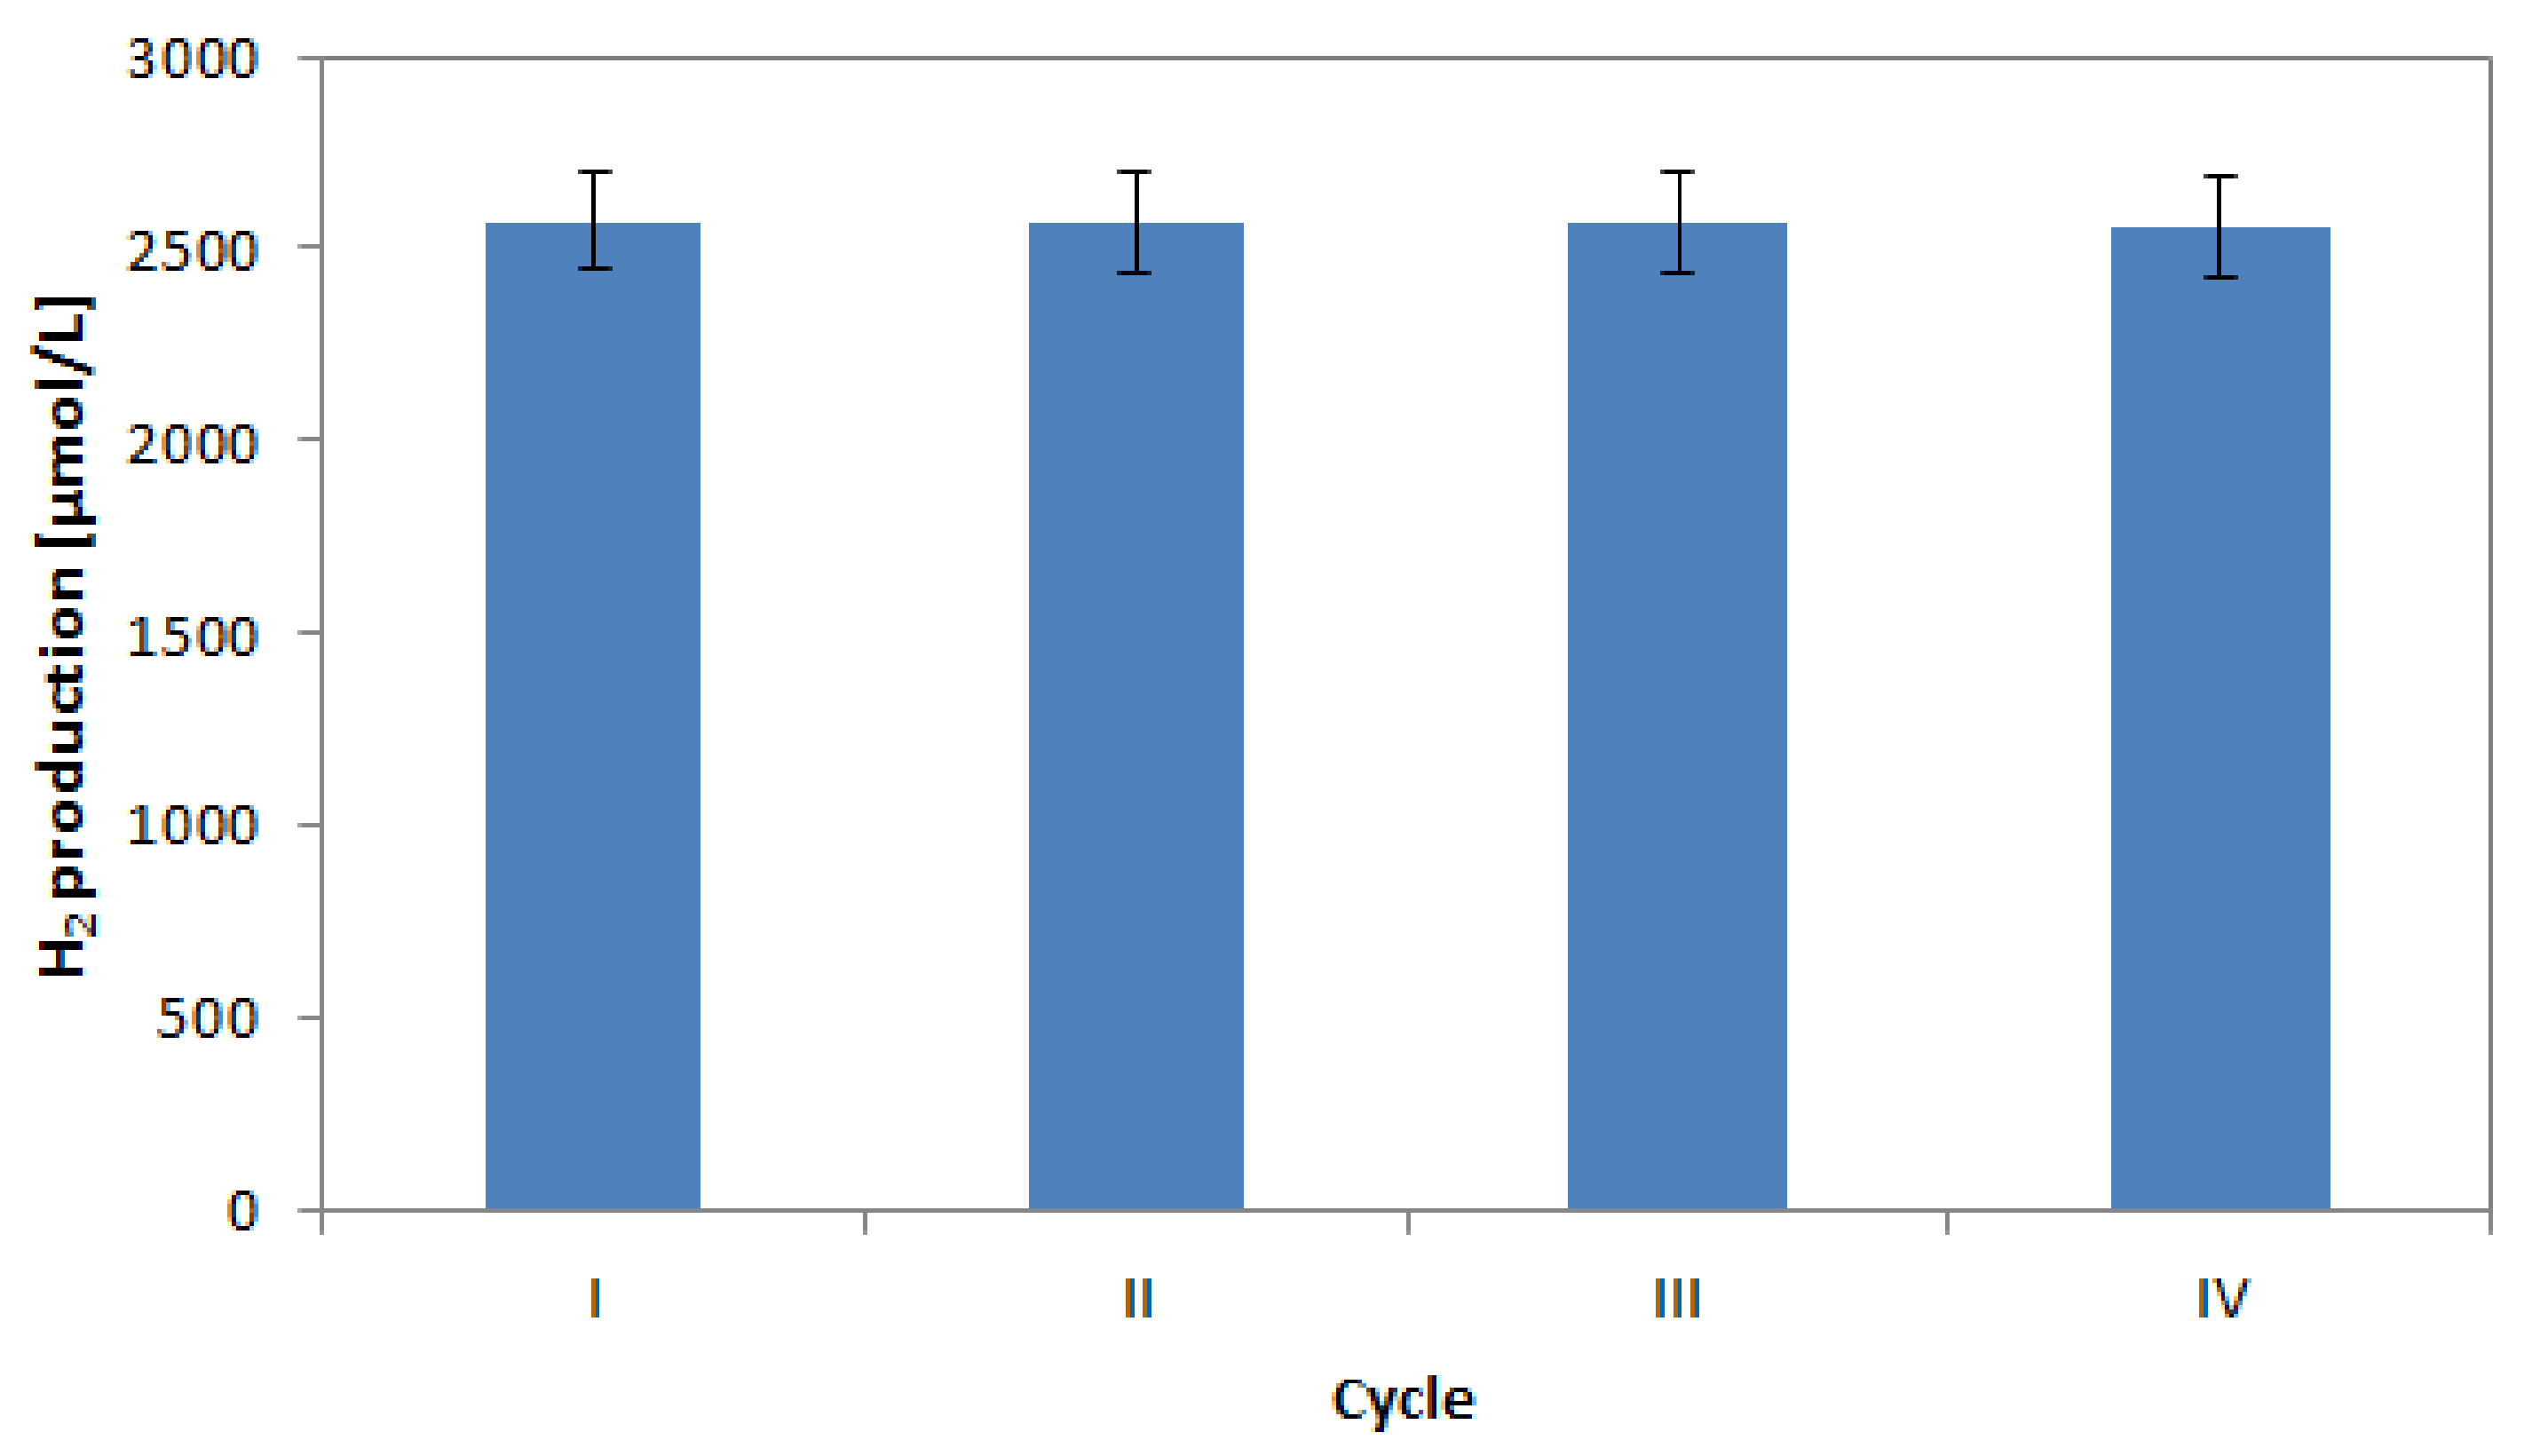
3.2.6. Stability Tests
4. Conclusions
Supplementary Materials
Author Contributions
Funding
Conflicts of Interest
References
- Moreno, V.C.; Iervolino, G.; Tugnoli, A.; Cozzani, V. Techno-economic and environmental sustainability of biomass waste conversion based on thermocatalytic reforming. Waste Manag. 2020, 101, 106–115. [Google Scholar] [CrossRef] [PubMed]
- Shahabuddin, M.; Krishna, B.B.; Bhaskar, T.; Perkins, G. Advances in the thermo-chemical production of hydrogen from biomass and residual wastes: Summary of recent techno-economic analyses. Bioresour. Technol. 2020, 299, 122557. [Google Scholar] [CrossRef] [PubMed]
- Wang, J.; Liu, H.; Fan, S.; Wang, S.; Xu, G.; Guo, A.; Wang, Z. Dehydrogenation of Cycloalkanes over N-Doped Carbon-Supported Catalysts: The Effects of Active Component and Molecular Structure of the Substrate. Nanomaterials 2021, 11, 2846. [Google Scholar] [CrossRef]
- Abdelhamid, H.; Goda, M.; Said, A. Selective dehydrogenation of isopropanol on carbonized metal–organic frameworks. Nano-Struct. Nano-Obj. 2020, 24, 100605. [Google Scholar] [CrossRef]
- Wang, Y.; Liu, X. Enhanced catalytic performance of cobalt ferrite by a facile reductive treatment for H2 release from ammonia borane. J. Mol. Liq. 2021, 343, 117697. [Google Scholar] [CrossRef]
- Abdelhamid, H.N. Zeolitic imidazolate frameworks (ZIF-8, ZIF-67, and ZIF-L) for hydrogen production. Appl. Organomet. Chem. 2021, e6319. [Google Scholar] [CrossRef]
- Puga, A.V. Photocatalytic production of hydrogen from biomass-derived feedstocks. Coord. Chem. Rev. 2016, 315, 1–66. [Google Scholar] [CrossRef]
- Davis, K.A.; Yoo, S.; Shuler, E.W.; Sherman, B.D.; Lee, S.; Leem, G. Photocatalytic hydrogen evolution from biomass conversion. Nano Converg. 2021, 8, 1–19. [Google Scholar] [CrossRef] [PubMed]
- Fujishima, A.; Honda, K. Electrochemical photolysis of water at a semiconductor electrode. Nature 1972, 238, 37–38. [Google Scholar] [CrossRef] [PubMed]
- Caravaca, A.; Jones, W.; Hardacre, C.; Bowker, M. H2 production by the photocatalytic reforming of cellulose and raw biomass using Ni, Pd, Pt and Au on titania. Proc. R. Soc. A Math. Phys. Eng. Sci. 2016, 472, 20160054. [Google Scholar]
- Iervolino, G.; Vaiano, V.; Sannino, D.; Rizzo, L.; Galluzzi, A.; Polichetti, M.; Pepe, G.; Campiglia, P. Hydrogen production from glucose degradation in water and wastewater treated by Ru-LaFeO3/Fe2O3 magnetic particles photocatalysis and heterogeneous photo-Fenton. Int. J. Hydrog. Energy 2018, 43, 2184–2196. [Google Scholar] [CrossRef]
- Toe, C.Y.; Tsounis, C.; Zhang, J.; Masood, H.; Gunawan, D.; Scott, J.; Amal, R. Advancing photoreforming of organics: Highlights on photocatalyst and system designs for selective oxidation reactions. Energy Environ. Sci. 2021, 14, 1140–1175. [Google Scholar] [CrossRef]
- Nada, A.A.; Barakat, M.H.; Hamed, H.A.; Mohamed, N.R.; Veziroglu, T.N. Studies on the photocatalytic hydrogen production using suspended modified TiO2 photocatalysts. Int. J. Hydrog. Energy 2005, 30, 687–691. [Google Scholar] [CrossRef]
- Ni, M.; Leung, M.K.H.; Leung, D.Y.C.; Sumathy, K. A review and recent developments in photocatalytic water-splitting using TiO2 for hydrogen production. Renew. Sustain. Energy Rev. 2007, 11, 401–425. [Google Scholar] [CrossRef]
- Chiarello, G.L.; Dozzi, M.V.; Selli, E. TiO2-based materials for photocatalytic hydrogen production. J. Energy Chem. 2017, 26, 250–258. [Google Scholar] [CrossRef]
- Wu, M.-C.; Huang, W.-K.; Lin, T.-H.; Lu, Y.-J. Photocatalytic hydrogen production and photodegradation of organic dyes of hydrogenated TiO2 nanofibers decorated metal nanoparticles. Appl. Surf. Sci. 2019, 469, 34–43. [Google Scholar] [CrossRef]
- Rusinque, B.; Escobedo, S.; de Lasa, H. Photocatalytic Hydrogen Production Under Near-UV Using Organic Pd-Doped Scavenger Mesoporous TiO2 and Ethanol as. Emerg. Trends TiO2 Photocatal. Appl. 2020, 299. [Google Scholar] [CrossRef] [Green Version]
- Rivero, M.J.; Iglesias, O.; Ribao, P.; Ortiz, I. Kinetic performance of TiO2/Pt/reduced graphene oxide composites in the photocatalytic hydrogen production. Int. J. Hydrog. Energy 2019, 44, 101–109. [Google Scholar] [CrossRef]
- Vaiano, V.; Lara, M.A.; Iervolino, G.; Matarangolo, M.; Navio, J.A.; Hidalgo, M.C. Photocatalytic H2 production from glycerol aqueous solutions over fluorinated Pt-TiO2 with high {001} facet exposure. J. Photochem. Photobiol. A Chem. 2018, 365, 52–59. [Google Scholar] [CrossRef]
- Iervolino, G.; Vaiano, V.; Murcia, J.; Rizzo, L.; Ventre, G.; Pepe, G.; Campiglia, P.; Hidalgo, M.; Navío, J.A.; Sannino, D. Photocatalytic hydrogen production from degradation of glucose over fluorinated and platinized TiO2 catalysts. J. Catal. 2016, 339, 47–56. [Google Scholar] [CrossRef]
- Luna, A.L.; Dragoe, D.; Wang, K.; Beaunier, P.; Kowalska, E.; Ohtani, B.; Bahena Uribe, D.; Valenzuela, M.A.; Remita, H.; Colbeau-Justin, C. Photocatalytic hydrogen evolution using Ni–Pd/TiO2: Correlation of light absorption, charge-carrier dynamics, and quantum efficiency. J. Phys. Chem. C 2017, 121, 14302–14311. [Google Scholar] [CrossRef]
- Vaiano, V.; Iervolino, G.; Sarno, G.; Sannino, D.; Rizzo, L.; Mesa, J.J.M.; Hidalgo, M.C.; Navío, J.A. Simultaneous production of CH4 and H2 from photocatalytic reforming of glucose aqueous solution on sulfated Pd-TiO2 catalysts. Oil Gas Sci. Technol. Rev. d’IFP Energ. Nouv. 2015, 70, 891–902. [Google Scholar] [CrossRef] [Green Version]
- Murdoch, M.; Waterhouse, G.; Nadeem, M.; Metson, J.; Keane, M.; Howe, R.; Llorca, J.; Idriss, H. The effect of gold loading and particle size on photocatalytic hydrogen production from ethanol over Au/TiO2 nanoparticles. Nat. Chem. 2011, 3, 489–492. [Google Scholar] [CrossRef]
- Wu, G.; Li, S.; Zhang, C.; Wang, T.; Gong, J. Glycerol steam reforming over perovskite-derived nickel-based catalysts. Appl. Catal. B Environ. 2014, 144, 277–285. [Google Scholar] [CrossRef]
- Chen, S.; Chen, X.; Jiang, Q.; Yuan, J.; Lin, C.; Shangguan, W. Promotion effect of nickel loaded on CdS for photocatalytic H2 production in lactic acid solution. Appl. Surf. Sci. 2014, 316, 590–594. [Google Scholar] [CrossRef]
- Chen, X.; Chen, W.; Gao, H.; Yang, Y.; Shangguan, W. In situ photodeposition of NiOx on CdS for hydrogen production under visible light: Enhanced activity by controlling solution environment. Appl. Catal. B Environ. 2014, 152, 68–72. [Google Scholar] [CrossRef]
- Chen, X.; Chen, S.; Lin, C.; Jiang, Z.; Shangguan, W. Nickels/CdS photocatalyst prepared by flowerlike Ni/Ni (OH)2 precursor for efficiently photocatalytic H2 evolution. Int. J. Hydrog. Energy 2015, 40, 998–1004. [Google Scholar] [CrossRef]
- Lin, C.-F.; Chen, X.-P.; Chen, S.; Shangguan, W.-F. Preparation of NiS-Modified Cd1-x Zn x S by a Hydrothermal Method and Its Use for the Efficient Photocatalytic H2 Evolution. Acta Phys. Chim. Sin. 2015, 31, 153–158. [Google Scholar]
- Chen, X.; Xiong, J.; Shi, J.; Xia, S.; Gui, S.; Shangguan, W. Roles of various Ni species on TiO2 in enhancing photocatalytic H2 evolution. Front. Energy 2019, 13, 684–690. [Google Scholar] [CrossRef]
- Hossain, A.; Roy, S.; Sakthipandi, K. The external and internal influences on the tuning of the properties of perovskites: An overview. Ceram. Int. 2019, 45, 4152–4166. [Google Scholar] [CrossRef]
- Arendt, E.; Maione, A.; Klisinska, A.; Sanz, O.; Montes, M.; Suarez, S.; Blanco, J.; Ruiz, P. Structuration of LaMnO3 perovskite catalysts on ceramic and metallic monoliths: Physico-chemical characterisation and catalytic activity in methane combustion. Appl. Catal. A Gen. 2008, 339, 1–14. [Google Scholar] [CrossRef]
- Zhang, L.; Hu, J.; Song, P.; Qin, H.; Jiang, M. Electrical properties and ethanol-sensing characteristics of perovskite La1-XPbxFeO3. Sens. Actuators B Chem. 2006, 114, 836–840. [Google Scholar] [CrossRef]
- Su, H.; Jing, L.; Shi, K.; Yao, C.; Fu, H. Synthesis of large surface area LaFeO3 nanoparticles by SBA-16 template method as high active visible photocatalysts. J. Nanopart. Res. 2010, 12, 967–974. [Google Scholar] [CrossRef]
- Thirumalairajan, S.; Girija, K.; Ganesh, I.; Mangalaraj, D.; Viswanathan, C.; Balamurugan, A.; Ponpandian, N. Controlled synthesis of perovskite LaFeO3 microsphere composed of nanoparticles via self-assembly process and their associated photocatalytic activity. Chem. Eng. J. 2012, 209, 420–428. [Google Scholar] [CrossRef]
- Das, S.; Dutta, S.; Tama, A.M.; Basith, M. Nanostructured LaFeO3-MoS2 for efficient photodegradation and photocatalytic hydrogen evolution. Mater. Sci. Eng. B 2021, 271, 115295. [Google Scholar] [CrossRef]
- Orak, C.; Yüksel, A. Graphene-supported LaFeO3 for photocatalytic hydrogen energy production. Int. J. Energy Res. 2021, 45, 12898–12914. [Google Scholar] [CrossRef]
- Li, F.T.; Liu, Y.; Liu, R.H.; Sun, Z.M.; Zhao, D.S.; Kou, C.G. Preparation of Ca-doped LaFeO3 nanopowders in a reverse microemulsion and their visible light photocatalytic activity. Mater. Lett. 2010, 64, 223–225. [Google Scholar] [CrossRef]
- Wu, H.; Hu, R.; Zhou, T.; Li, C.; Meng, W.; Yang, J. A novel efficient boron-doped LaFeO3 photocatalyst with large specific surface area for phenol degradation under simulated sunlight. CrystEngComm 2015, 17, 3859–3865. [Google Scholar] [CrossRef]
- Maity, R.; Sheikh, M.S.; Dutta, A.; Sinha, T. Visible light driven photocatalytic activity of granular Pr doped LaFeO3. J. Electron. Mater. 2019, 48, 4856–4865. [Google Scholar] [CrossRef]
- Wang, X.; Qin, H.; Pei, J.; Chen, Y.; Li, L.; Xie, J.; Hu, J. Sensing performances to low concentration acetone for palladium doped LaFeO3 sensors. J. Rare Earths 2016, 34, 704–710. [Google Scholar] [CrossRef]
- Peng, Q.; Shan, B.; Wen, Y.; Chen, R. Enhanced charge transport of LaFeO3 via transition metal (Mn, Co, Cu) doping for visible light photoelectrochemical water oxidation. Int. J. Hydrog. Energy 2015, 40, 15423–15431. [Google Scholar] [CrossRef]
- Gao, K.; Li, S. Multi-modal TiO2–LaFeO3 composite films with high photocatalytic activity and hydrophilicity. Appl. Surf. Sci. 2012, 258, 6460–6464. [Google Scholar] [CrossRef]
- Sukee, A.; Alharbi, A.A.; Staerz, A.; Wisitsoraat, A.; Liewhiran, C.; Weimar, U.; Barsan, N. Effect of AgO loading on flame-made LaFeO3 p-type semiconductor nanoparticles to acetylene sensing. Sens. Actuators B Chem. 2020, 312, 127990. [Google Scholar] [CrossRef]
- Iervolino, G.; Vaiano, V.; Sannino, D.; Rizzo, L.; Palma, V. Enhanced photocatalytic hydrogen production from glucose aqueous matrices on Ru-doped LaFeO3. Appl. Catal. B Environ. 2017, 207, 182–194. [Google Scholar] [CrossRef]
- Vaiano, V.; Iervolino, G.; Sannino, D. Enhanced photocatalytic hydrogen production from glucose on Rh-doped LaFeO3. Chem. Eng. Trans. 2017, 60, 235–240. [Google Scholar] [CrossRef]
- Chen, W.-T.; Chan, A.; Sun-Waterhouse, D.; Moriga, T.; Idriss, H.; Waterhouse, G.I. Ni/TiO2: A promising low-cost photocatalytic system for solar H2 production from ethanol–water mixtures. J. Catal. 2015, 326, 43–53. [Google Scholar] [CrossRef]
- Husin, H.; Pontas, K.; Yunardi, Y.; Salamun, A.; Alam, P.N.; Hasfita, F. Photocatalytic hydrogen production over Ni/La-NaTaO3 nanoparticles from NaCl-water Solution in the presence of glucose as electron donor. ASEAN J. Chem. Eng. 2017, 17, 27–36. [Google Scholar] [CrossRef] [Green Version]
- Vaiano, V.; Iervolino, G.; Sannino, D. Enhanced Photocatalytic Hydrogen Production from Glucose Aqueous Solution Using Nickel Supported on LaFeO3. Chem. Eng. Trans. 2021, 86, 145–150. [Google Scholar] [CrossRef]
- Iervolino, G.; Vaiano, V.; Sannino, D.; Rizzo, L.; Ciambelli, P. Production of hydrogen from glucose by LaFeO3 based photocatalytic process during water treatment. Int. J. Hydrog. Energy 2016, 41, 959–966. [Google Scholar] [CrossRef]
- Kaplan, D.; Alon, M.; Burstein, L.; Rosenberg, Y.; Peled, E. Study of core–shell platinum-based catalyst for methanol and ethylene glycol oxidation. J. Power Sources 2011, 196, 1078–1083. [Google Scholar] [CrossRef]
- Tijare, S.N.; Joshi, M.V.; Padole, P.S.; Mangrulkar, P.A.; Rayalu, S.S.; Labhsetwar, N.K. Photocatalytic hydrogen generation through water splitting on nano-crystalline LaFeO3 perovskite. Int. J. Hydrog. Energy 2012, 37, 10451–10456. [Google Scholar] [CrossRef]
- Parida, K.; Reddy, K.; Martha, S.; Das, D.; Biswal, N. Fabrication of nanocrystalline LaFeO3: An efficient sol–gel auto-combustion assisted visible light responsive photocatalyst for water decomposition. Int. J. Hydrog. Energy 2010, 35, 12161–12168. [Google Scholar] [CrossRef]
- Pawar, G.S.; Elikkottil, A.; Pesala, B.; Tahir, A.A.; Mallick, T.K. Plasmonic nickel nanoparticles decorated on to LaFeO3 photocathode for enhanced solar hydrogen generation. Int. J. Hydrog. Energy 2019, 44, 578–586. [Google Scholar] [CrossRef]
- Phokha, S.; Pinitsoontorn, S.; Maensiri, S.; Rujirawat, S. Structure, optical and magnetic properties of LaFeO3 nanoparticles prepared by polymerized complex method. J. Sol-Gel Sci. Technol. 2014, 71, 333–341. [Google Scholar] [CrossRef]
- Briggs, D. X-ray photoelectron spectroscopy (XPS). Handb. Adhes 2005, 621–622. [Google Scholar]
- Feng, Q.; Zhou, J.; Luo, W.; Ding, L.; Cai, W. Photo-Fenton removal of tetracycline hydrochloride using LaFeO3 as a persulfate activator under visible light. Ecotoxicol. Environ. Saf. 2020, 198, 110661. [Google Scholar] [CrossRef] [PubMed]
- Mohamed, R.; Aazam, E.S. H2 production with low CO selectivity from photocatalytic reforming of glucose on Ni/TiO2-SiO2. Chin. J. Catal. 2012, 33, 247–253. [Google Scholar] [CrossRef]
- Linsebigler, A.L.; Lu, G.; Yates, J.T., Jr. Photocatalysis on TiO2 surfaces: Principles, mechanisms, and selected results. Chem. Rev. 1995, 95, 735–758. [Google Scholar] [CrossRef]
- Akpan, U.G.; Hameed, B.H. Parameters affecting the photocatalytic degradation of dyes using TiO2-based photocatalysts: A review. J. Hazard. Mater. 2009, 170, 520–529. [Google Scholar] [CrossRef]
- Li, Y.; Lu, G.; Li, S. Photocatalytic hydrogen generation and decomposition of oxalic acid over platinized TiO2. Appl. Catal. A: Gen. 2001, 214, 179–185. [Google Scholar] [CrossRef]
- Wei, L.F.; Zheng, X.J.; Zhang, Z.H.; Wei, Y.J.; Xie, B.; Wei, M.B.; Sun, X.L. A systematic study of photocatalytic H2 production from propionic acid solution over Pt/TiO2 photocatalyst. Int. J. Energy Res. 2012, 36, 75–86. [Google Scholar] [CrossRef]
- Strataki, N.; Bekiari, V.; Kondarides, D.I.; Lianos, P. Hydrogen production by photocatalytic alcohol reforming employing highly efficient nanocrystalline titania films. Appl. Catal. B Environ. 2007, 77, 184–189. [Google Scholar] [CrossRef]
- Tristantini, D.; Ibadurrohman, M. Photocatalytic hydrogen production from glycerol–water mixture over Pt-N-TiO2 nanotube photocatalyst. Int. J. Energy Res. 2013, 37, 1372–1381. [Google Scholar]
- Ramis, G.; Bahadori, E.; Rossetti, I. Design of efficient photocatalytic processes for the production of hydrogen from biomass derived substrates. Int. J. Hydrog. Energy 2021, 46, 12105–12116. [Google Scholar] [CrossRef]
- Petrosyan, H.; Vanyan, L.; Trchounian, A.; Trchounian, K. Defining the roles of the hydrogenase 3 and 4 subunits in hydrogen production during glucose fermentation: A new model of a H2-producing hydrogenase complex. Int. J. Hydrog. Energy 2020, 45, 5192–5201. [Google Scholar] [CrossRef]
- Trchounian, K.; Trchounian, A. Hydrogen producing activity by Escherichia coli hydrogenase 4 (hyf) depends on glucose concentration. Int. J. Hydrog. Energy 2014, 39, 16914–16918. [Google Scholar] [CrossRef]
- Iervolino, G.; Vaiano, V.; Murcia, J.J.; Lara, A.E.; Hernández, J.S.; Rojas, H.; Navío, J.A.; Hidalgo, M.C. Photocatalytic production of hydrogen and methane from glycerol reforming over Pt/TiO2–Nb2O5. Int. J. Hydrog. Energy 2021, 46, 38678–38691. [Google Scholar] [CrossRef]
- Ribao, P.; Esteves, M.A.; Fernandes, V.R.; Rivero, M.J.; Rangel, C.M.; Ortiz, I. Challenges arising from the use of TiO2/rGO/Pt photocatalysts to produce hydrogen from crude glycerol compared to synthetic glycerol. Int. J. Hydrog. Energy 2019, 44, 28494–28506. [Google Scholar] [CrossRef] [Green Version]
- Fujita, S.-i.; Kawamori, H.; Honda, D.; Yoshida, H.; Arai, M. Photocatalytic hydrogen production from aqueous glycerol solution using NiO/TiO2 catalysts: Effects of preparation and reaction conditions. Appl. Catal. B Environ. 2016, 181, 818–824. [Google Scholar] [CrossRef]
- Belhadj, H.; Hamid, S.; Robertson, P.K.J.; Bahnemann, D.W. Mechanisms of Simultaneous Hydrogen Production and Formaldehyde Oxidation in H2O and D2O over Platinized TiO2. ACS Catal. 2017, 7, 4753–4758. [Google Scholar] [CrossRef] [Green Version]


| Photocatalyst | Ni Nominal Amount [%wt] | NiCl2.6 H2O Used in the Synthesis [g] | LaFeO3 Used in the Synthesis [g] | Band Gap Energy Value [eV] |
|---|---|---|---|---|
| LaFeO3 | 0 | 0 | 0.80 | 2.18 |
| 0.06Ni/LaFeO3 | 0.06 | 0.004 | 1.60 | 2.18 |
| 0.12Ni/LaFeO3 | 0.12 | 0.004 | 0.80 | 2.17 |
| 0.18Ni/LaFeO3 | 0.18 | 0.006 | 0.80 | 2.17 |
| 0.25Ni/LaFeO3 | 0.25 | 0.008 | 0.80 | 2.17 |
| SAMPLE | Ni [%] | Fe [%] | La [%] | O [%] | Ni [Molar Ratio] | Fe [Molar Ratio] | La [Molar Ratio] | O [Molar Ratio] |
|---|---|---|---|---|---|---|---|---|
| LaFeO3 | - | 28 | 51 | 20.9 | - | 0.5 | 0.37 | 1.31 |
| 0.12Ni/LaFeO3 | 0.05 | 31.3 | 47.1 | 21.6 | 8.5 10−4 | 0.56 | 0.34 | 1.35 |
| 0.25Ni/LaFeO3 | 0.10 | 31.3 | 47.1 | 21.6 | 1.7 10−3 | 0.56 | 0.34 | 1.35 |
Publisher’s Note: MDPI stays neutral with regard to jurisdictional claims in published maps and institutional affiliations. |
© 2021 by the authors. Licensee MDPI, Basel, Switzerland. This article is an open access article distributed under the terms and conditions of the Creative Commons Attribution (CC BY) license (https://creativecommons.org/licenses/by/4.0/).
Share and Cite
Iervolino, G.; Vaiano, V.; Sannino, D.; Puga, F.; Navío, J.A.; Hidalgo, M.C. LaFeO3 Modified with Ni for Hydrogen Evolution via Photocatalytic Glucose Reforming in Liquid Phase. Catalysts 2021, 11, 1558. https://doi.org/10.3390/catal11121558
Iervolino G, Vaiano V, Sannino D, Puga F, Navío JA, Hidalgo MC. LaFeO3 Modified with Ni for Hydrogen Evolution via Photocatalytic Glucose Reforming in Liquid Phase. Catalysts. 2021; 11(12):1558. https://doi.org/10.3390/catal11121558
Chicago/Turabian StyleIervolino, Giuseppina, Vincenzo Vaiano, Diana Sannino, Felipe Puga, Josè Antonio Navío, and María C. Hidalgo. 2021. "LaFeO3 Modified with Ni for Hydrogen Evolution via Photocatalytic Glucose Reforming in Liquid Phase" Catalysts 11, no. 12: 1558. https://doi.org/10.3390/catal11121558