Article

Enhanced Catalytic Hydrogen Peroxide Production from Hydroxylamine Oxidation on Modified Activated Carbon Fibers: The Role of Surface Chemistry

1
School of Chemical Engineering and Light Industry, Guangdong University of Technology, Guangzhou Higher Education Mega Centre, Guangzhou 510006, China
2
Analysis and Test Center, Guangdong University of Technology, Guangzhou Higher Education Mega Centre, Guangzhou 510006, China
*
Author to whom correspondence should be addressed.
Catalysts 2021, 11(12), 1515; https://doi.org/10.3390/catal11121515
Submission received: 30 October 2021 / Revised: 9 December 2021 / Accepted: 11 December 2021 / Published: 13 December 2021
(This article belongs to the Special Issue Effect of the Modification of Catalysts on the Catalytic Performance)

Abstract

:
Herein, direct production of hydrogen peroxide (H2O2) through hydroxylamine (NH2OH) oxidation by molecular oxygen was greatly enhanced over modified activated carbon fiber (ACF) catalysts. We revealed that the higher content of pyrrolic/pyridone nitrogen (N5) and carboxyl-anhydride oxygen could effectively promote the higher selectivity and yield of H2O2. By changing the volume ratio of the concentrated H2SO4 and HNO3, the content of N5 and surface oxygen containing groups on ACF were selectively tuned. The ACF catalyst with the highest N5 content and abundant carboxyl-anhydride oxygen containing groups was demonstrated to have the highest activity toward catalytic H2O2 production, enabling the selectivity of H2O2 over 99.3% and the concentration of H2O2 reaching 123 mmol/L. The crucial effects of nitrogen species were expounded by the correlation of the selectivity of H2O2 with the content of N5 from X-ray photoelectron spectroscopy (XPS). The possible reaction pathway over ACF catalysts promoted by N5 was also shown.

Graphical Abstract

1. Introduction

Hydrogen peroxide (H2O2), as a green chemical, attracts research attention in both energy and environmental related fields because it has the highest content of reactive oxygen among the common oxidants and the green by-product [1]. It has been widely used as a bleach in the paper and textile industry, an energy carrier in fuel cells, an oxidant in chemical production, wastewater treatment, hydrometallurgy and electronics industry [2]. Notwithstanding, the current industrial production of H2O2 is mainly through the anthraquinone oxidation process [3], which involves multistep reactions, massive energy consumption and waste generation. Furthermore, the cost and safety problems are also raised ineluctably by the handle, transport and storage of high concentration H2O2. Nevertheless, in many practical applications, H2O2 with only a low concentration could satisfy the demand in the reactions, such as selective oxidation, on-site degradation of dye, sewage treatment and disinfection (<30 mM) [4,5,6]. In this context, research on alternative production methods of H2O2 and it’s in situ use has been the research focus [5,7,8,9,10,11,12,13,14,15]. The direct generation of H2O2 by the reaction of molecular hydrogen (H2) and oxygen (O2) is considered the most promising method [16,17,18,19], but the industrial application is obscured by the dangers of the explosive reaction mixture and the insufficiency of catalysts with high selectivity without considering the reaction systems of O2 and H2 at high pressure [20,21,22,23,24,25]. In recent years, both photo- and electro-catalytic H2O2 production techniques are in the process of research, but the former is still suffered from a low selectivity and yield of H2O2 with affordable raw materials while the latter faces the problems of low efficiency and complicated devices accompanied with high cost [2,26,27].
Therefore, in order to avoid the risk of explosion, it would be an effective way to choose an appropriate hydrogen source replacing H2 in the direct synthesis process of H2O2. Thus, hydroxylamine (NH2OH) was viewed as an available alternative to H2 since it could be transformed into H2O2 by O2 in the conditions of room temperature and normal pressure in an aqueous solution (2NH2OH + O2 = N2 + 2H2O + H2O2) [28]. This reaction is a simple step and easy to handle procedure with two major kinds of catalytic systems. Homogeneous manganese complexes catalysts with high TOF values were firstly studied in this reaction [29,30,31], but they suffered from separating and recycling problems. Afterward, noble metal particles (Au and Pd) dispersed on different supports were reported to catalyze this system effectively [32,33,34], but the low concentration of H2O2 (0.05–0.1 wt.%) generation and the high cost of noble metal remain as the major impediment for the industrial applications.
Based on the research above, activated carbon (AC) was found to be an effective catalyst used in the direct H2O2 production process through NH2OH oxidation by O2 in our earlier research [35,36]. We found that the catalytic properties of AC were closely related to the surface oxygen-containing groups. In order to fulfill wider and higher demands in practical application, the selectivity and activity towards H2O2 formation still need to be further improved. Moreover, the reactivity usually originated from the structure of carbon materials. Considering this, nitrogen doping on carbon materials has been found to be one of the most effective ways to improve the selectivity of H2O2 in metal-free catalytic systems, although the selectivity usually depends on both oxygen- and nitrogen-doped atoms [13]. It is noteworthy that N-doping played a beneficial role for H2O2 selectivity only at a low active surface site density while becoming detrimental at higher contents in some reactions [37,38]. Meanwhile, the microporous volume content on carbon materials was also found to have proportionality with selectivity in many catalytic systems [37,39].
Considering the above factors, the easily available polyacrylonitrile-based (PAN-based) activated carbon fiber (ACF) would be an ideal candidate catalyst material. On the one hand, compared to the AC material with a large number of mesopores, PAN-based ACF has only microporous structures and the pore channels are directly open on the surface. More importantly, PAN-based ACF has an intrinsic nitrogen content without any further nitrogen-doped steps and the relatively simple surface modification process would be cost-effective [40]. In the present work, for the sake of comparative study of the generation and modification on the surface doped species, the improvements on the content and type of surface functional groups were intended by treating the PAN-based ACF with concentrated mixed acid in different volume ratios. The selectivity and yield of H2O2 in the reaction on modified ACF catalysts were well interconnected with the amounts of pyrrolic/pyridone nitrogen (N5) and desorbed carboxyl-anhydride groups from the ACF surface. The possible reaction pathway over ACF catalysts promoted by N5 was also shown.

2. Results and Discussion

2.1. Material Structure

Figure 1 shows the scanning electron microscopy (SEM) images of ACF-0 sample and the corresponding elemental mapping images, along with the SEM images of ACF samples before and after surface modification by different volume ratios of concentrated H2SO4 and HNO3 (H2SO4/HNO3 (v/v)). From Figure 1a–d, three main elements (C, N, O) were found on the ACF-0 sample which exhibited a long fiber feature with a diameter of about 15 μm. The surface roughness of the ACF samples gradually increased with the increase of H2SO4/HNO3 (v/v) from 0.5 to 4, as shown from Figure 1e–h. For the ACF-Rw sample, the surface still kept smooth similar to the ACF-0 sample, while slight surface roughness was observed on the surface of ACF-R1. By increasing the value of H2SO4/HNO3 (v/v) to 2 and 4, some auricular-like sheet protrusions were both found on the surface of ACF-R2 and ACF-R4 samples. Consequently, the surface modification caused differently morphological changes on the ACF samples through the erosion of carbon surface by different H2SO4/HNO3 (v/v), and some microporous structures on the ACF samples might be destroyed through mixed acid treatment with higher content of concentrated H2SO4.
The pore size distribution of ACF-0 and ACF-R4 samples, and nitrogen adsorption-desorption isotherms of the ACF-0 sample without surface modification is shown in Figure 2. The detailed texture parameters for the ACF samples were shown in Table 1. Moreover, the ACF-0 sample displayed the features of type I isotherm, indicating the existence of micropores. There were two types of pores on the ACF-0 sample: micropore (1.41 nm and 1.13 nm) and supermicropore (0.78 nm and 0.57 nm) [41]. As for the ACF-R4 sample, the micropore content (1.14 nm) was greatly enhanced and some micropores enlarged to 1.69 nm while the supermicropore content was decreased compared with the ACF-0 sample. As displayed in Table 1, minor changes in the pore size and surface area were found between the ACF-0 and ACF-Rw samples but obviously decrease in micropore volume and surface area were observed on the ACF-R2 and ACF-R4 samples. As for the ACF-Rw sample, the surface area of micropores (Smic.), the total surface area (SBET) and the surface area of mesoporous (Smes.) was 895, 934 and 39 m2/g, respectively. Correspondingly, the micropore volume (Vmic.), the total pore volume (Vtotal) and the micropore width (dpore.) of ACF-Rw were calculated to be 0.361, 0.395 cm3/g and 0.85 nm. These results were similar to those of the ACF-0 sample. With the increase of H2SO4/HNO3 (v/v), the values of VTotal and SBET initially reduced to 0.323 cm3/g and 686 m2/g on the ACF-R1 sample, then declined to 0.229 cm3/g and 481 m2/g on the ACF-R2 sample. Moreover, the dpore for ACF samples by mixed acid oxidation increased slightly from 0.87 to 0.95 nm, with increasing H2SO4/HNO3 (v/v) from 0.5 to 4. Notably, the mesopores of the ACF samples were not altered much through the modification by mixed acid, whereas the micropores decreased remarkably by higher values of H2SO4/HNO3 (v/v), especially in the ACF-R2 and ACF-R4 samples. This suggests that the higher content of H2SO4 caused severe destruction of the microporous structures while the higher content of HNO3 preserved the textual characteristics of the ACF sample.

2.2. Surface Properties

The Fourier transformation infrared (FTIR) spectra of ACF samples is shown in Figure 3a. According to the references, the peak at 1225 cm−1 is originated from the stretching mold of C–N and C–O in carboxylic anhydrides, ethers, lactones and phenols [42,43]. The peak at 1405 cm−1 and 1580 cm−1 is respectively related to the nitrogen groups and the double bond of C=C in quinoid structure. Meanwhile, the peak at 1730 cm−1 is owing to the stretching vibration of the C=O band in carboxyl and lactones groups attached to the aromatic rings, and the peak at 910 cm−1 is related to the anhydride groups [41,43,44]. After modification by different values of H2SO4/HNO3 (v/v), the intensities of the above peaks were wholly enhanced to different extents, suggesting the formation of large quantities of oxygen-containing species on ACF surface. For ACF-R1, ACF-R2 and ACF-R4 samples, the intensities of the peaks at 910 cm−1, 1225 cm−1, 1580 cm−1 and 1730 cm−1 were all greatly increased, indicating the enlargement in phenols, quinones, lactones, carboxyls and anhydrides. The highest peak intensity was found on ACF-R2 and ACF-R4 samples, especially at the position of 1730 cm−1, which confirms the further enrichment of anhydride and carboxylic groups by a higher content of H2SO4 in mixed acid.
As shown in Figure 3b, Raman spectroscopy detection was conducted to investigate the defects on carbon structure of ACF samples with surface modification. Usually, carbon fiber mainly has two characteristic peaks, one of which is the D peak at the position of 1350–1375 cm−1, and the other is the G peak at the position of 1580–1603 cm−1 [45]. The D peak is related to amorphous and defects of carbon structure while the G peak is related to graphite crystal structure. Generally, the calculation of ID/IG ratio from integral areas values of D and G peak was used to measure the structural defects of carbon materials [46]. It is widely known that ID/IG value increases with more structural defects generated on the carbon material. Obviously, the intensity of Raman spectra on ACF samples gradually increased, meanwhile the ID/IG values of all the ACF samples increased from 0.95 to 1.07 with increasing H2SO4/HNO3 (v/v) from 0.5 to 2. Whereas the ID/IG values of ACF-R4 decreased to 1.06 with increasing H2SO4/HNO3 (v/v) from 2 to 4. Therefore, it is believed that there were more surface defects and structural changes on the ACF carbon framework according to the surface modification with more H2SO4 contents in mixed acid. These results were well matched with the textural characteristics in ACF samples shown in Table 1.
The narrow scan of C 1s regions in X-ray photoelectron spectroscopy (XPS) of ACF samples is exhibited in Figure 4a. Moreover, the deconvolution results of the C 1s spectrum are given in Table 2. For modified carbon materials, the C 1s spectra usually involved graphitic carbon (C–graphite, Peak I), ether, alcohol or phenolic groups (C–O, Peak II), carbonyl or quinone groups (C=O, Peak III), carboxylic groups (–COO–, Peak IV) and Peak V for the satellite peak from the π–π* electron shake-up [47,48,49]. The intensities of peak I was decreased by the oxidation of mixed acid, whereas the intensities for the peaks attributed by C–O groups were increased [49]. However, the areas of peak II of all ACF samples by acid oxidation increased not so obviously compared to that of peak III or peak IV, which indicated phenolic groups may not be tailored much by adjusting different values of H2SO4/HNO3 (v/v). Similarly, the integral area of peak IV for both ACF-Rw (4.5%) and ACF-R1 sample (5.4%) was more than two times larger than that of the ACF-0 (2.0%). Notably, the area of peak IV increased to 7.9% and 8.7% on the ACF-R2 and ACF-R4 samples respectively, clearly confirming the generation of a large amount of surface carboxylic groups by the higher content of H2SO4.
Figure 4b exhibits the narrow scan of XPS spectra in O 1s regions of the ACF samples. Moreover, the deconvolution results of the O 1s spectrum are displayed in Table 3. As shown in Figure 4b, the O 1s XPS spectra can be deconvoluted into three main peaks, namely Peak I, Peak II and Peak III, which are associated with the C=O group, C–O group and adsorbed H2O or O2, respectively [42]. The adsorbed CO or CO2 in the ACF surface can be attributed to the minor Peak IV, the binding energy of which was at 536.9–537.0 eV. Obviously, the intensities of both Peak III and Peak IV decreased by surface modification, whereas the peaks corresponding to C=O groups increased evidently. As for Peak I, the intensities increased from 25.5 to 30.5% by surface modification with increasing the content of H2SO4, and similar results were obtained on ACF-R2 and ACF-R4 samples. Additionally, the atomic ratio of surface O/C in the ACF samples by acid oxidation was enhanced significantly from 21.3 to 32.9% with increasing the H2SO4/HNO3 (v/v) from 0.5 to 4. The above results suggested that more carboxylic species were generated by mixed acid oxidation with higher content of H2SO4, being consistent with the results of FTIR measurement.
For the sake of examining the crucial role of the intrinsic nitrogen doped in ACF samples, the deconvolution results of N 1s XPS profiles of ACF samples are exhibited in Figure 5. Moreover, the corresponding results of the deconvolution are displayed in detail in Table 4. According to the curve fitting results and references, five distinct types of nitrogen contained species were deconvoluted from the N 1s spectra: NX (-NO2), N4 (pyridine-N oxide), NQ (quaternary N), N5 (pyrrolic/pyridone) and N6 (pyridine) [50,51,52,53]. It was evident that the content of N6 in ACF-0 was highest among all ACFs. Moreover, the content of N5 significantly increased to 33.2%, 43.4%, 50.5% and 46.3% for the ACF-Rw, ACF-R1, ACF-R2 and ACF-R4, respectively. As shown in Table 4, the content of N6 on the ACF-0 decreased from 15.6 to 5.2% corresponding to the ACF-R2. Moreover, the content of both NQ and N4 on the ACF sample decreased nearly one half by surface modification. It was reported that −NO2 and pyridine were the main forms of the nitrogen introduced from HNO3 oxidation and different forms of nitrogen can be transformed to each other [42,54]. The content of NX initially reached the maximum (32.3%) on ACF-Rw, then decreased to 22.3%, 15.3% and 19.0% on ACF-R1, ACF-R2 and ACF-R4, respectively. No content of NX can be observed on the ACF-0 sample without surface modification. Accordingly, when the nitrogen form predominated in the ACF sample was quaternary N, the mixed acid modification transformed them to −NO2 with the higher content of HNO3. Meanwhile, more pyrrolic nitrogen species were generated by a higher content of H2SO4. In addition, the atomic ratios of surface N/C on ACF samples were gradually enhanced from 1.5 to 2.4 with the increase of H2SO4/HNO3 (v/v) from 0.5 to 2, whereas that on ACF-R4 sample decreased to 2.0 by increasing the value of H2SO4/HNO3 (v/v) to 4. These results suggest that the surface N-containing groups could be effectively tuned by mixed acid oxidation with different volume ratios of concentrated H2SO4 and HNO3.
The temperature-programmed desorption (TPD) results of the ACF samples were shown in Figure 6. After being heated, carbon oxides were the main decomposition products of surface oxygen-containing functional groups [55,56,57,58]. As shown in Figure 7, the anhydrides and carboxylic acids usually decomposed into CO2 at relatively lower temperatures while the lactones decomposed into CO2 at higher temperatures. Meanwhile, the carboxylic anhydrides, ethers, phenols, carbonyl-quinones generally decomposed into CO [58]. Only little quantities of COx were obtained on the ACF-0 sample while significant quantities of COx were obtained on the other three ACF samples. For the ACF samples modified by mixed acid, the data of COx gradually rose with increasing the H2SO4/HNO3 (v/v) from 0.5 to 4. Especially, the desorption quantity of CO from the ACF-R1 sample was almost five-fold larger than that of the ACF-0 sample, illustrating the formation of large quantities of phenol and carbonyl-quinone groups. On the flip side, the desorption amount of CO2 from the ACF-R2 sample was almost more than 15 times greater than the ACF-0 sample, primarily owing to the remarkable generation of lactones, anhydrides and carboxylic acids. The quantities of COx obtained from ACF-R4 were very similar to the ACF-R2 sample.
Table 5 and Table 6 show the detailed data of CO and CO2 desorbed from specific surface groups on ACF samples. The desorption quantities of CO and CO2 on ACF-0 sample were 244 μmol/g and 65 μmol/g, severally, and they were raised to 1008 μmol/g and 400 μmol/g on ACF-Rw sample. Upon increasing the H2SO4/HNO3 (v/v) from 0.5 to 1, the desorption quantities of CO and CO2 on the ACF-R1 sample remarkably raised to 1207 μmol/g and 678 μmol/g, respectively. Nevertheless, the amounts of CO desorbed from carbonyl-quinone groups on the ACF-R2 sample decreased to 125 μmol/g. While compared with ACF-Rw, more than two times larger amounts of CO2 desorbed from carboxyl and anhydride groups were also found on the ACF-R2 sample. The desorption quantities of CO2 and CO on the ACF-R4 sample were very similar to the ACF-R2 sample. Considering all these examinations, it could be deduced that the largest amounts of carboxyl (407 μmol/g) and anhydride (425 μmol/g) were obtained on the ACF-R2 and ACF-R4 samples while the most enrichment of phenol groups was detected on the ACF-R1 sample. This means that the moderate content of H2SO4 produced more phenol groups while the higher content of H2SO4 in the mixed acid created more carboxylic and anhydride groups. These results were consistent with the FTIR and XPS results of ACF samples.

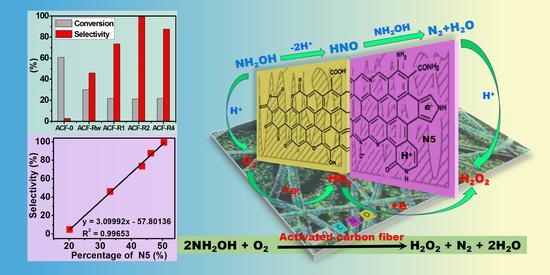
2.3. H2O2 Production

Figure 8a shows the concentration of H2O2 production from NH2OH oxidation by O2 on the ACF catalysts. For the ACF-0 catalyst without surface oxidation, the cumulative concentration of H2O2 was very low and cannot be detected after reacting for 300 min. For the ACF-Rw catalyst, the concentration of H2O2 increased to 55.9 mmol/L at 420 min and then increased slightly. Similar trends plots were observed on the ACF-R1, ACF-R2 and ACF-R4 catalysts, on which the H2O2 concentration increased gradually with the increase of reaction time. When the reaction was conducted for 660 min, the concentration of H2O2 approached 88.6 mmol/L and 112 mmol/L on the ACF-R1 and ACF-R4 catalyst, respectively. With increasing the H2SO4/HNO3 (v/v) from 1 to 2, the maximum concentration of H2O2 reached 123 mmol/L on the ACF-R2 catalyst, which clearly demonstrates more reactive species were generated on the ACF-R2 surface by an appropriately higher content of H2SO4 in mixed acid. In order to explore the stability of ACF catalysts, the recycling tests of ACF-R2 were performed as shown in Figure 8b. After three cycles, there was almost no decrease in the activity of the reused ACF-R2 catalyst with the yield of H2O2 about 49% (123 mmol/L) after reacting for 660 min.
The selectivity of H2O2 along with the NH2OH conversion on the ACF catalysts at the reaction time of 180 min was shown in Figure 9a. The selectivity of H2O2 was only 46.0% on the ACF-Rw catalyst although the higher conversion of NH2OH (30%) was observed on it, which was possibly induced by the higher surface area and more carbonyl-quinone groups generating through the surface modification. In view of similar conversion toward NH2OH (~22%) consumption, the selectivity of H2O2 was 73.6% on the ACF-R1 catalyst prepared by an equal volume of H2SO4 and HNO3. Whereas the selectivity of H2O2 was greatly enhanced to 99.3% on the ACF-R2 catalyst obtained by further increasing the content of H2SO4. However, the selectivity of H2O2 decreased to 87.6% on the ACF-R4 catalyst by the increase of the H2SO4/HNO3 (v/v) from 2 to 4. Thus, the formation of more reactive nitrogen and oxygen containing groups on the ACF catalysts greatly enhanced the selectivity toward H2O2 formation.
The activity of H2O2 decomposition over ACF catalysts was shown in Figure 9b. According to the reference [59], the activity toward H2O2 decomposition was directly related to the basic sites (chromene groups) on the AC materials surface, while the formation of surface carboxylic groups (–COOH) will accordingly retard the catalytic decomposition of H2O2. It was also found that the acidic function groups of AC materials treated by HNO3 would suppress the H2O2 decomposition rate. As shown in Figure 9b, almost no decomposition of H2O2 was detected on the ACF-R2 and ACF-R4 catalyst during the first 60 min. After reacting for 420 min, the concentration of H2O2 in the ACF-R1, ACF-R2 and ACF-R4 catalyst system only decreased to 246 mmol/L, 247 mmol/L and 248 mmol/L, respectively. As for the ACF-Rw catalyst, with the smallest amounts of carboxylic groups, the concentration of H2O2 quickly decreased to 245 mmol/L only within 180 min. Therefore, the modified ACF catalysts with large amounts of carboxylic groups by mixed acids retarded the catalytic decomposition of H2O2 and exhibited a higher activity of H2O2 generation.
The catalytic performance in the reaction of H2O2 production from NH2OH oxidation over modified ACF catalysts was listed and compared to those of previously reported catalysts in Table 7. The modified ACF catalysts showed a higher formation concentration of H2O2 than the Au/MgO and Pd/Al2O3 system with a longer reaction time. The ACF-R2 and ACF-R4 catalysts exhibited similarly catalytic performance with the ACH system but with higher selectivity toward H2O2. As for the homogeneous Mn (II/III)-complex system, both the concentration and the yield of H2O2 were higher than all heterogeneous catalysts systems without considering their separating and recycling problems. Meanwhile, the concentration of H2O2 over ACF-R2 and ACF-R4 catalysts was higher than the most reactive carbon supported Au and Pd catalysts, which were used in the direct H2O2 production process from H2 and O2 at high pressure. Thus, compared with the Au-Pd/C catalyst, the ACF catalysts system had a longer reaction time (>9 h) while the supported Au and Pd catalysts system only took 0.5 h to obtain a similar concentration of H2O2. Considering the practical application, the reaction of the ACF catalysts system was easy to handle at atmospheric pressure whereas the high pressure was necessary for the supported Au and Pd catalysts system.

2.4. Effect of Surface Nitrogen- and Oxygen-Containing Groups

Obviously, there was no direct correlation between the selectivity of H2O2 with the surface area or the microporous volume of ACF catalysts. That is, the H2O2 formation was affected little by the microporous structure. With the aim of exploring the reactivity and the surface chemistry of ACF catalysts, we correlated the selectivity of H2O2 with the percentage of N5 (pyrrolic/pyridone) from XPS spectra, and the concentration of H2O2 on the specific surface area of ACFs with the amounts of desorbed carboxyl-anhydride groups over the ACF catalysts from TPD results, as shown in Figure 10. Clearly, there was a perfectly positive correlation between the selectivity and the percentage of N5 on the ACF catalysts shown in Figure 10a. It has been considered that, for nitrogen doping, the wholeness of the π conjugate system was broken by the higher electronegativity on the N atom doped in the carbon basal framework of ACF. Moreover, this could induce charge redistribution, which changes the adsorption performance of the reactive intermediates over the carbon materials [57,58]. Thus, compared with pyridine, pyrrolic/pyridone structure in the carbon skeleton possessing more electronegativity was beneficial for the effective adsorption of reactants, which greatly enhanced the selectivity of H2O2 on ACF-R2 with higher content of N5.
On the other hand, the correlation between the concentration of H2O2 on a specific surface area of ACFs with the amounts of CO2 desorbed from carboxyl-anhydride groups demonstrated that the yield of H2O2 increased in a positive correlation way with the increment of carboxyl-anhydride groups on ACF catalysts, as shown in Figure 10b. This could be ascribed to the more hydrophilic surface on ACFs induced by the formation of large quantities of carboxyl-anhydride species, which are in favor of both effective contact with the hydrophilic reactant and maintaining the existence of H2O2. Therefore, the highest selectivity of the ACF-R2 catalyst can be sensibly and directly ascribed to the great quantity of surface oxygen-containing groups and nitrogen-containing groups, particularly the pyrrolic/pyridone nitrogen groups.
For the sake of further clarifying the crucial function of the surface nitrogen, a possible promotion mechanism is proposed. Scheme 1 shows the possible reaction pathway of H2O2 production from NH2OH and O2 on ACF catalysts promoted by N5. Similar to the reaction mechanism proposed in our previous work [60], NH2OH loses protons and electrons when contacted with the quinone species on the ACF surface, forming the HNO intermediate. Then the HNO reacts with NH2OH, producing N2 and H2O. The quinoid groups subsequently transfer the protons and electrons to O2 through the redox cycles of quinone and hydroquinone, completing a typical process of H2O2 formation. The role of N5 can be explained from two aspects, namely pyrrolic nitrogen and pyridone structure. The pyrrolic nitrogen doped on a carbon structure with more electronegativity formed in the edges of the carbon basal plane on ACF, which promotes the electrons transfer between O2 and NH2OH. Thus, the adsorbed O2 species on the ACF surface received the electrons transferred easily from the nitrogen species with extra electrons, and then formed HO2 intermediates [53]. For the pyridone structure, the NH group is considered a portion of the six-membered ring on the brink of an extended carbon basal plane. The electronic surrounding of the NH species is thought similar to that of pyrrole because the excess electrons of the N atom could be delocalized among the condensed aromatic system and entrapped at defects on the carbon basal layer [40]. Meanwhile, the pyridone structure is usually in presence of two tautomeric structures including 2-hydroxypyridine and α-pyridone. Usually, these two tautomeric forms are transformed to each other by the intramolecular proton transfer, which may facilitate the protons transfer to the HO2 intermediates, forming H2O2. Therefore, the higher selectivity of H2O2 can be attributed to the higher content of N5 on the ACF catalyst.

3. Materials and Methods

3.1. Surface Modification of ACF

Ten grams of PAN-based ACF (Jilin, Jiyan high-tech Fibers) were put into 100 mL of concentrated hydrochloric acid (HCl, 37%) and mixed for removing the possible impurities including ashes or inorganic substances. The mixtures were firstly stirred for 3 h at ambient temperature, then Cl was thoroughly removed from the filtrate by washing with hot water (detected with AgNO3). The obtained sample was put into a vacuum oven and dried at 80 °C overnight, which was christened ACF-0. Then, the ACF-0 (0.5 g) was mixed and stirred in 50 mL of concentrated sulfuric acid (H2SO4, 98%) and concentrated nitric acid (HNO3, 68%) at 60 °C for one hour with a volume ratio of 0.5, 1, 2 and 4, respectively. The oxidized ACF was washed by hot water in order to obtain nearly neutral pH of the filtrate and put into a vacuum oven, then dried at 80 °C overnight. The samples as prepared thus were noted as ACF-Rw, ACF-R1, ACF-R2 and ACF-R4, respectively.

3.2. Characterization of the ACF Catalysts

Field-emission scanning electron microscopy (FE-SEM) images were recorded on a Philips Fei Quanta 200F instrument operating at 20 kV, while elemental mapping images of ACF-0 were obtained on a Hitachi SU8220 SEM instrument working at 15 kV. Nitrogen adsorption-desorption detection was measured by a Micrometrics ASAP 2460 instrument under −196 °C. Moreover, the ACF catalysts were outgassed at 250 °C overnight before the start of measurement. The multipoint Braunauer–Emmett–Teller (BET) analysis was used to calculate the specific surface area (SBET). Fourier transformation infrared (FTIR) spectra of the ACF catalysts were conducted on an IR spectrometer (Bruker Vector 22) by making KBr pellets containing 0.5 wt.% of ACF. The Raman spectra of ACF catalysts were obtained on a Horiba LabRAM HR Evolution Raman spectrometer by using a 532 nm laser. The measurements of X-ray photoelectron spectroscopy (XPS) were carried out on an ESCALAB MK-ΙΙ spectrometer (VG Scientific Ltd., West Sussex, UK) with an Al Kα radiation source under an accelerated voltage of 20 kV. For correcting the charge effect, the binding energy (BE) of C1s was adjusted to 285.0 eV. The sensitivity factors and the peak areas of the elements were used to calculate the surface atomic ratio of O/C [61]. Temperature-programmed desorption (TPD) was accomplished in a quartz tubular reactor, which was linked to a quadrupole mass spectrometer (Omnistar, Balzers). After the ACF catalyst (40 mg) was filled in the reactor, the temperature was increased to 900 °C with a heating rate of 10 °C/min in helium flow of 30 mL/min. The mass spectrometer was used to monitor the outlet gas.

3.3. Catalyst Testing

The general reaction of NH2OH with O2 was performed in a 100 mL of jacketed glass reactor by stirring at room temperature under atmospheric pressure, as reported elsewhere [31]. In a typical reaction process, 0.15 g of ACF catalyst was put into the aqueous solution of reactant, which was made of hydroxylammonium chloride (NH2OH•HCl, 1.74 g) and 50 mL of deionized water. Before adding the ACF catalyst, the pH value of NH2OH•HCl aqueous solution was regulated to 8.6 by the solution of 1 M NaOH. Moreover, O2 was bubbled into the reaction mixtures at a constant flow rate of 25 mL/min, which was tailored by a mass flow controller. Samples of the reactants were taken out periodically in order to analyze the concentration of H2O2 by the colorimetric method, which was based on the titanium (IV) sulfate [62]. Similarly, the colorimetric method with the Fe (III)-1,10-phenanthroline complexes was used to detect the concentration of NH2OH•HCl [63]. The recycling tests of ACF catalysts were performed with the same conditions mentioned above. For each cycle, the used ACF catalyst was washed with hot water and dried at 80 °C in a vacuum oven overnight. The tests of H2O2 decomposition were carried out in similar reaction conditions only without feeding NH2OH•HCl and O2. The initial concentration of H2O2 was 0.25 M without adjusting the pH value. The dosage of ACF catalyst for each decomposition test was 0.15 g. The yield toward H2O2 formation was calculated in accordance with the stoichiometric ratio of the reaction (2NH2OH + O2= H2O2 + 2H2O + N2), as the following equation:
H2O2 Yield (%) = 2 × n(H2O2)/n(NH2OH•HCl) × 100%
where n(H2O2) is the moles of H2O2 generated in the reaction, and n(NH2OH•HCl) is the moles of NH2OH•HCl in feed.

4. Conclusions

Proper tuning of the surface chemistry of ACFs with intrinsic nitrogen content could expeditiously promote the selectivity of H2O2 production through NH2OH oxidation. Mixed acid oxidation of ACF under mild reaction conditions effectively increased the surface oxygen groups and tailored the pyrrolic/pyridone nitrogen doped on a carbon structure, which then accelerated the selectivity for H2O2 over 99.3% on ACF-R2 catalyst. The higher content of H2SO4 in the mixed acid created more pyrrolic/pyridone nitrogen, carboxyl and anhydride groups, enhancing the selectivity and yield toward H2O2 formation. In our present work, both an easy and low-priced synthetic process for H2O2 generation was described, while a new comprehension on the conception and mechanistic examination of metal-free N- and O-doped carbon materials were also provided.

Author Contributions

Conceptualization, W.S.; methodology, W.S. and L.Y.; formal analysis, R.Z.; data curation, X.X. and M.S.; writing-original draft preparation, W.S. and R.Z.; writing-review and editing, X.X. and M.S.; supervision, Y.L.; funding acquisition, W.S. and Y.L. All authors have read and agreed to the published version of the manuscript.

Funding

This research was funded by the National Natural Science Foundation of China (21603039, 51678160).

Conflicts of Interest

The authors declare no conflict of interest.

References

  1. Campos-Martin, J.M.; Blanco-Brieva, G.; Fierro, J.L.G. Hydrogen peroxide synthesis: An out- look beyond the anthraquinone process. Angew. Chem. Int. Ed. 2006, 45, 6962–6984. [Google Scholar] [CrossRef]
  2. Xue, Y.; Wang, Y.; Pan, Z.; Sayama, K. Electrochemical and photoelectrochemical water oxidation for hydrogen peroxide production. Angew. Chem. Int. Ed. 2021, 60, 2–14. [Google Scholar] [CrossRef] [PubMed]
  3. Goor, G.; Kunkel, W.; Weiberg, O. Hydrogen peroxide. In UllmannCs Encyclopedia of Industrial Chemistry, 5th ed.; Elvers, B., Hawkins, S., Ravenscroft, M., Schulz, G., Eds.; Wiley-VCH: New York, NY, USA; Basel, Switzerland; Cambridge, UK; Weinheim, Germany, 1989; Volume A13, pp. 443–466. [Google Scholar]
  4. Kholdeeva, O.; Maksimchuk, N. Metal-organic frameworks in oxidation catalysis with hydrogen peroxide. Catalysts 2021, 11, 283. [Google Scholar] [CrossRef]
  5. Puértolas, B.; Hillb, A.K.; García, T.; Solson, B.; Torrente-Murciano, L. In-situ synthesis of hydrogen peroxide in tandem with selective oxidation reactions: A mini-review. Catal. Today 2015, 248, 115–127. [Google Scholar] [CrossRef]
  6. Hu, X.; Zeng, X.; Liu, Y.; Lu, J.; Zhang, X. Carbon-based materials for photo- and electrocatalytic synthesis of hydrogen peroxide. Nanoscale 2020, 12, 16008–16027. [Google Scholar] [CrossRef] [PubMed]
  7. Chen, Q.; Beckman, E.J. One-pot green synthesis of propylene oxide using in situ generated hydrogen peroxide in carbon dioxide. Green Chem. 2008, 10, 934–938. [Google Scholar] [CrossRef]
  8. Miller, J.A.; Alexander, L.; Mori, D.I.; Ryabov, A.D.; Collins, T.J. In situ enzymatic generation of H2O2 from O2 for use in oxidative bleaching and catalysis by TAML activators. New J. Chem. 2013, 37, 3488–3495. [Google Scholar] [CrossRef]
  9. Asghar, A.; Raman, A.A.A.; Daud, W.M.A.W. Recent advances, challenges and prospects of in situ production of hydrogen peroxide for textile waste water treatment in microbial fuel cells. J. Chem. Technol. Biotechnol. 2014, 89, 1466–1480. [Google Scholar] [CrossRef]
  10. Pan, Z.; Wang, K.; Wang, Y.; Tsiakaras, P.; Song, S. In-situ electrosynthesis of hydrogen peroxide and wastewater treatment application: A novel strategy for graphite felt activation. Appl. Catal. B Environ. 2018, 237, 392–400. [Google Scholar] [CrossRef]
  11. Giorgianni, G.; Abate, S.; Centi, G.; Perathoner, S. Direct synthesis of H2O2 on Pd based catalysts: Modelling the particle size effects and the promoting role of polyvinyl alcohol. ChemCatChem 2019, 11, 550–559. [Google Scholar] [CrossRef]
  12. Freakley, S.J.; Kochius, S.; van Marwijk, J.; Fenner, C.; Lewis, R.J.; Baldenius, K.; Marais, S.S.; Susan, D.J.O.; Harrison, T.L.; Alcalde, M.; et al. A chemo-enzymatic oxidation cascade to activate C-H bonds with in situ generated H2O2. Nat. Commun. 2019, 10, 4178. [Google Scholar] [CrossRef]
  13. Van Schie, M.M.C.H.; Kaczmarek, A.T.; Tieves, F.; de Santos, P.G.; Paul, C.E.; Arends, I.W.C.E.; Alcalde, M.; Schwarz, G.; Hollmann, F. Selective oxyfunctionalisation reactions driven by sulfite oxidase-catalysed in situ generation of H2O2. ChemCatChem 2020, 12, 3186–3189. [Google Scholar] [CrossRef]
  14. Lyu, J.; Niu, L.; Shen, F.; Wei, J.; Xiang, Y.; Yu, Z.; Zhang, G.; Ding, C.; Huang, Y.; Li, X. In situ hydrogen peroxide production for selective oxidation of benzyl alcohol over a Pd@hierarchical titanium silicalite catalyst. ACS Omega 2020, 5, 16865–16874. [Google Scholar] [CrossRef]
  15. Liu, Y.; Zhao, Y.; Wang, J. Fenton/Fenton-like processes with in-situ production of hydrogen peroxide/hydroxyl radical for degradation of emerging contaminants: Advances and prospects. J. Hazard. Mater. 2021, 404, 124191–124210. [Google Scholar] [CrossRef]
  16. Samanta, C. Direct synthesis of hydrogen peroxide from hydrogen and oxygen: An overview of recent developments in the process. Appl. Catal. A Gen. 2008, 350, 133–149. [Google Scholar] [CrossRef]
  17. Edwards, J.K.; Freakley, S.J.; Carley, A.F.; Kiely, C.J.; Hutchings, G.J. Strategies for designing supported gold-palladium bimetallic catalysts for the direct synthesis of hydrogen peroxide. Acc. Chem. Res. 2014, 47, 845–854. [Google Scholar] [CrossRef] [PubMed]
  18. Edwards, J.K.; Freakley, S.J.; Lewis, R.J.; Pritchard, J.C.; Hutchings, G.J. Advances in the direct synthesis of hydrogen peroxide from hydrogen and oxygen. Catal. Today 2015, 248, 3–9. [Google Scholar] [CrossRef]
  19. Yi, Y.; Wang, L.; Li, G.; Guo, H. A review on research progress in the direct synthesis of hydrogen peroxide from hydrogen and oxygen: Noble-metal catalytic method, fuel-cell method and plasma method. Catal. Sci. Technol. 2016, 6, 1593–1610. [Google Scholar] [CrossRef]
  20. Gao, G.; Tian, Y.; Gong, X.; Pan, Z.; Yang, K.; Zong, B. Advances in the production technology of hydrogen peroxide. Chin. J. Catal. 2020, 41, 1039–1047. [Google Scholar] [CrossRef]
  21. Ntainjua, N.E.; Piccinini, M.; Pritchard, J.C.; Edwards, J.K.; Carley, A.F.; Moulijn, J.A.; Hutchings, G.J. Effect of halide and acid additives on the direct synthesis of hydrogen peroxide using supported gold–palladium catalysts. ChemSusChem 2009, 2, 575–580. [Google Scholar] [CrossRef]
  22. Pritchard, J.C.; He, Q.; Ntainjua, E.N.; Piccinini, M.; Edwards, J.K.; Herzing, A.A.; Carley, A.F.; Moulijn, J.A.; Kiely, C.J.; Hutchings, G.J. The effect of catalyst preparation method on the performance of supported Au–Pd catalysts for the direct synthesis of hydrogen peroxide. Green Chem. 2010, 12, 915–921. [Google Scholar] [CrossRef]
  23. Pritchard, J.; Kesavan, L.; Piccinini, M.; He, Q.; Tiruvalam, R.; Dimitratos, N.; Lopez-Sanchez, J.A.; Carley, A.F.; Edwards, J.K.; Kiely, C.J.; et al. Direct synthesis of hydrogen peroxide and benzyl alcohol oxidation using Au−Pd catalysts prepared by sol immobilization. Langmuir 2010, 26, 16568–16577. [Google Scholar] [CrossRef] [PubMed]
  24. Tiruvalam, R.C.; Pritchard, J.C.; Dimitratos, N.; Lopez-Sanchez, J.A.; Edwards, J.K.; Carley, A.F.; Hutchings, G.J.; Kiely, C.J. Aberration corrected analytical electron microscopy studies of sol-immobilized Au + Pd, Au {Pd} and Pd {Au} catalysts used for benzyl alcohol oxidation and hydrogen peroxide production. Faraday Discuss. 2011, 152, 63–86. [Google Scholar] [CrossRef] [PubMed]
  25. Pritchard, J.; Piccinini, M.; Tiruvalam, R.; He, Q.; Dimitratos, N.; Lopez-Sanchez, J.A.; Morgan, D.J.; Carley, A.F.; Edwards, J.K.; Kiely, C.J.; et al. Effect of heat treatment on Au–Pd catalysts synthesized by sol immobilisation for the direct synthesis of hydrogen peroxide and benzyl alcohol oxidation. Catal. Sci. Technol. 2013, 3, 308–317. [Google Scholar] [CrossRef]
  26. Hou, H.; Zeng, X.; Zhang, X. Production of hydrogen peroxide by photocatalytic processes. Angew. Chem. Int. Ed. 2020, 59, 17356–17376. [Google Scholar] [CrossRef]
  27. Song, H.; Wei, L.; Chen, L.; Zhang, H.; Su, J. Photocatalytic production of hydrogen peroxide over modifed semiconductor materials: A minireview. Top. Catal. 2020, 63, 895–912. [Google Scholar] [CrossRef]
  28. Hughes, M.N.; Nicklin, H.G. Autoxidation of hydroxylamine in alkaline solutions. J. Chem. Soc. A 1971, 1, 164–168. [Google Scholar] [CrossRef]
  29. Sheriff, T.S. Production of hydrogen peroxide from dioxygen and hydroxylamine or hydrazine catalysed by manganese complexes. J. Chem. Soc. Dalton Trans. 1992, 6, 1051–1058. [Google Scholar] [CrossRef]
  30. Sheriff, T.S.; Carr, P.; Piggott, B. Manganese catalysed reduction of dioxygen to hydrogen peroxide: Structural studies on a manganese (III)–catecholate complex. Inorg. Chim. Acta 2003, 348, 115–122. [Google Scholar] [CrossRef]
  31. Sheriff, T.S.; Carr, P.; Coles, S.J.; Hursthouse, M.B.; Lesin, J.; Light, M.E. Structural studies on manganese (III) and manganese (IV) complexes of tetrachlorocatechol and the catalytic reduction of dioxygen to hydrogen peroxide. Inorg. Chim. Acta 2004, 357, 2494–2502. [Google Scholar] [CrossRef]
  32. Choudhary, V.R.; Jana, P.; Bhargava, S.K. Reduction of oxygen by hydroxylammonium salt or hydroxylamine over supported Au nanoparticles for in situ generation of hydrogen peroxide in aqueous or non-aqueous medium. Catal. Commun. 2007, 8, 811–816. [Google Scholar] [CrossRef]
  33. Choudhary, V.R.; Jana, P. In situ generation of hydrogen peroxide from reaction of O2 with hydroxylamine from hydroxylammonium salt in neutral aqueous or non-aqueous medium using reusable Pd/Al2O3 catalyst. Catal. Commun. 2007, 8, 1578–1582. [Google Scholar] [CrossRef]
  34. Choudhary, V.R.; Jana, P. Factors influencing the in situ generation of hydrogen peroxide from the reduction of oxygen by hydroxylamine from hydroxylammonium sulfate over Pd/alumina. Appl. Catal. A Gen. 2008, 335, 95–102. [Google Scholar] [CrossRef]
  35. Song, W.; Li, J.; Liu, J.; Shen, W. Production of hydrogen peroxide by the reaction of hydroxylamine and molecular oxygen over activated carbons. Catal. Commun. 2008, 9, 831–836. [Google Scholar] [CrossRef]
  36. Song, W.; Yu, L.; Xie, X.; Hao, Z.; Sun, M.; Wen, H.; Li, Y. Effect of textual features and surface properties of activated carbon on the production of hydrogen peroxide from hydroxylamine oxidation. RSC Adv. 2017, 7, 25305–25313. [Google Scholar] [CrossRef] [Green Version]
  37. Melchionna, M.; Fornasiero, P.; Prato, M. The rise of hydrogen peroxide as the main product by metal-free catalysis in oxygen reductions. Adv. Mater. 2019, 31, 1802920–1802924. [Google Scholar] [CrossRef]
  38. Sun, Y.; Sinev, I.; Ju, W.; Bergmann, A.; Dresp, S.; Kühl, S.; Spöri, C.; Schmies, H.; Wang, H.; Bernsmeier, D.; et al. Efficient electrochemical hydrogen peroxide production from molecular oxygen on nitrogen-doped mesoporous carbon catalysts. ACS Catal. 2018, 8, 2844–2856. [Google Scholar] [CrossRef]
  39. Raymundo-Piñero, E.; Cazorla-Amorós, D.; Linares-Solano, A. Temperature programmed desorption study on the mechanism of SO2 oxidation by activated carbon and activated carbon fibres. Carbon 2001, 39, 231–242. [Google Scholar] [CrossRef]
  40. Boehm, H.P. Catalytic properties of nitrogen-containing carbons. In Carbon Materials for Catalysis, 1st ed.; Serp, P., Figueiredo, J.L., Eds.; John Wiley & Sons, Inc.: Hoboken, NJ, USA, 2009; Chapter 7; pp. 219–238. [Google Scholar]
  41. De la Puente, G.; Pis, J.J.; Menéndez, J.A.; Grange, P. Thermal stability of oxygenated functions in activated carbons. J. Anal. Appl. Pyrolysis 1997, 43, 125–138. [Google Scholar] [CrossRef]
  42. Prahas, D.; Kartika, Y.; Indraswati, N.; Ismadji, S. Activated carbon from jackfruit peel waste by H3PO4 chemical activation: Pore structure and surface chemistry characterization. Chem. Eng. J. 2008, 140, 32–42. [Google Scholar] [CrossRef]
  43. Yang, S.; Li, L.; Xiao, T.; Zheng, D.; Zhang, Y. Role of surface chemistry in modified ACF (activated carbon fiber)-catalyzed peroxymonosulfate oxidation. Appl. Surf. Sci. 2016, 383, 142–150. [Google Scholar] [CrossRef]
  44. Macías-García, A.; Díaz-Díez, M.A.; Cuerda-Correa, E.M.; Olivares-Marín, M.; Gañan-Gómez, J. Study of the pore size distribution and fractal dimension of HNO3-treated activated carbons. Appl. Surf. Sci. 2006, 252, 5972–5975. [Google Scholar] [CrossRef]
  45. Kima, M.J.; Song, E.J.; Kim, K.H.; Choi, S.S.; Lee, Y.S. The textural and chemical changes in ACFs with e-beam and their influence on the detection of nerve agent simulant gases. J. Ind. Eng. Chem. 2019, 79, 465–472. [Google Scholar] [CrossRef]
  46. Shi, M.; Bao, D.; Li, S.; Wulan, B.; Yan, J.; Jiang, Q. Anchoring PdCu amorphous nanocluster on graphene for electrochemical reduction of N2 to NH3 under ambient conditions in aqueous solution. Adv. Energy Mater. 2018, 8, 1800124–1800129. [Google Scholar] [CrossRef]
  47. Terzyk, A.P. The influence of activated carbon surface chemical composition on the adsorption of acetaminophen (paracetamol) in vitro: Part II. TG, FTIR, and XPS analysis of carbons and the temperature dependence of adsorption kinetics at the neutral pH. Colloids Surf. A 2001, 177, 23–45. [Google Scholar] [CrossRef]
  48. Swiatkowski, A.; Pakula, M.; Biniak, S.; Walczyk, M. Influence of the surface chemistry of modified activated carbon on its electrochemical behaviour in the presence of lead(II) ions. Carbon 2004, 42, 3057–3069. [Google Scholar] [CrossRef]
  49. Brazhnyk, D.V.; Zaitsev, Y.P.; Bacherikova, I.V.; Zazhigalov, V.A.; Stoch, J.; Kowal, A. Oxidation of H2S on activated carbon KAU and influence of the surface state. Appl. Catal. B Environ. 2007, 70, 557–566. [Google Scholar] [CrossRef]
  50. Fels, J.R.; Kapteijn, F.; Moulijn, J.A.; Zhu, Q.; Thomas, K.M. Evolution of nitrogen functionalities in carbonaceous materials during pyrolysis. Carbon 1995, 33, 1641–1653. [Google Scholar]
  51. Pietrzak, R. XPS study and physico-chemical properties of nitrogen-enriched microporous activated carbon from high volatile bituminous coal. Fuel 2009, 88, 1871–1877. [Google Scholar] [CrossRef]
  52. Kundu, S.; Xia, W.; Busser, W.; Kundu, S.; Xia, W.; Busser, W.; Becker, M.; Schmidt, D.A.; Havenith, M.; Muhle, M. The formation of nitrogen-containing functional groups on carbon nanotube surfaces: A quantitative XPS and TPD study. Phys. Chem. Chem. Phys. 2010, 12, 4351–4359. [Google Scholar] [CrossRef]
  53. Yang, G.; Chen, H.; Qin, H.; Yang, G.; Chen, H.; Qin, H.; Feng, Y. Amination of activated carbon for enhancing phenol adsorption: Effect of nitrogen-containing functional groups. Appl. Surf. Sci. 2014, 293, 299–305. [Google Scholar] [CrossRef]
  54. Sun, H.; Kwan, C.; Wang, S.; Sun, H.; Kwan, C.K.; Suvorova, A.; Ang, H.M.; Tadé, M.O.; Wang, S. Catalytic oxidation of organic pollutants on pristine and surface nitrogen-modifified carbon nanotubes with sulfate radicals. Appl. Catal. B Environ. 2014, 154–155, 134–141. [Google Scholar] [CrossRef]
  55. Boehm, H.P. Surface oxides on carbon and their analys is: A critical assessment. Carbon 2002, 40, 145–149. [Google Scholar] [CrossRef]
  56. Zielke, U.; Hüttinger, K.J.; Hoffman, W.P. Surface-oxidized carbon fibers: I. Surface structure and chemistry. Carbon 1996, 34, 983–998. [Google Scholar] [CrossRef]
  57. Zhang, J.; Zhang, H.; Cheng, M.; Lu, Q. Tailoring the electrochemical production of H2O2: Strategies for the rational design of high-performance electrocatalysts. Small 2020, 16, 1902845–1902861. [Google Scholar] [CrossRef]
  58. Jiang, Y.; Ni, P.; Chen, C.; Lu, Y.; Yang, P.; Kong, B.; Fisher, A.; Wang, X. Selective electrochemical H2O2 production through two-electron oxygen electrochemistry. Adv. Energy Mater. 2018, 8, 1801909–1801933. [Google Scholar] [CrossRef]
  59. Figueiredo, J.L.; Pereira, M.F.R. Carbon as Catalyst. In Carbon Materials for Catalysis, 1st ed.; Serp, P., Figueiredo, J.L., Eds.; John Wiley & Sons, Inc.: Hoboken, NJ, USA, 2009; Chapter 6; pp. 196–198. [Google Scholar]
  60. Song, W.; Li, Y.; Guo, X.; Li, J.; Huang, X.; Shen, W. Selective surface modifification of activated carbon for enhancing the catalytic performance in hydrogen peroxide production by hydroxylamine oxidation. J. Mol. Catal. Chem. 2010, 328, 53–59. [Google Scholar] [CrossRef]
  61. Figueiredo, J.L.; Pereira, M.F.R.; Freitas, M.M.A.; Órfão, J.J.M. Modification of the surface chemistry of activated carbons. Carbon 1999, 37, 1379–1389. [Google Scholar] [CrossRef]
  62. Clapp, P.A.; Evans, D.F.; Sheriff, T.S. Spectrophotometric determination of hydrogen peroxide after extraction with ethyl acetate. Anal. Chim. Acta 1989, 218, 331–334. [Google Scholar] [CrossRef]
  63. Yang, M. Hydroxylamine hydrochloride was determined by indirect spectrophotometry. Chem. Ind. Eng. (China) 1999, 16, 233–235. [Google Scholar]
Figure 1. SEM images of the ACF-0 sample and the corresponding elemental mapping images for (a) overlap, (b) C, (c) N, (d) O. The SEM images of ACF samples after surface modification (e) ACF-Rw, (f) ACF-R1, (g) ACF-R2, (h) ACF-R4.
Catalysts 11 01515 g001
Figure 2. The pore size distribution (PSD) of ACF-0 and ACF-R4 samples obtained from the density functional theory method and N2 adsorption-desorption isotherms of ACF-0 sample.
Catalysts 11 01515 g002
Figure 3. The (a) FTIR and (b) Raman spectra of ACF samples.
Catalysts 11 01515 g003
Figure 4. High resolution of XPS spectra in (a) C 1s (b) O 1s regions of ACF samples.
Catalysts 11 01515 g004
Figure 5. High resolution of XPS spectra in N 1s regions of ACF samples.
Catalysts 11 01515 g005
Figure 6. TPD profiles of ACF samples before and after surface modification.
Catalysts 11 01515 g006
Figure 7. Deconvolution of the TPD profiles for ACF samples, in which peak a, peak b, peak c from the CO2 desorption of the carboxyl, anhydride, lactone groups while peak d, peak e, peak f from the CO desorption of the anhydride, phenol, carbonyl groups on ACF samples.
Catalysts 11 01515 g007
Figure 8. (a) The concentration of H2O2 formation on the ACF catalysts, (b) the yield of H2O2 for the recycling tests of the ACF-R2 catalyst (pH = 8.6, temp. = 25 °C, the error bar calculated by STDEV method).
Catalysts 11 01515 g008
Figure 9. (a) The selectivity of H2O2 and conversion of NH2OH on the ACF catalysts (pH = 8.6, temp. = 25 °C, time = 180 min.), (b) the decomposition of H2O2 over ACF catalysts (the error bar calculated by STDEV method).
Catalysts 11 01515 g009
Figure 10. The relationship between (a) the selectivity of H2O2 and percentage of N5, (b) the concentration of H2O2 and the amounts of carboxyl-anhydride groups on the ACF catalysts (pH = 8.6, temp. = 25 °C, time = 180 min.).
Catalysts 11 01515 g010
Scheme 1. The possible reaction pathway of H2O2 production from NH2OH and O2 on ACF catalysts promoted by N5.
Catalysts 11 01515 sch001
Table 1. Textural parameters of the ACF samples before and after surface modification.
CatalystSBET[a]
(m2/g)
Smic.[b]
(m2/g)
Smes.[b]
(m2/g)
Vmic.[b] (cm3/g)VTotal[c] (cm3/g)dpore[d] (nm)
ACF-0944909350.3740.4110.87
ACF-Rw934895390.3610.3950.85
ACF-R1686601850.2610.3230.94
ACF-R24813561240.1460.2290.95
ACF-R4368322460.1320.1600.95
[a] Multipoint Braunauer-Emmett-Teller (BET). [b] Calculated by the t-plot method. [c] Estimated from the amounts of gas adsorbed at a relative pressure of 0.994. [d] Average pore diameter calculated from 2VTotal/SBET for slit pore.
Table 2. Deconvolution results of the C 1s XPS spectra for the ACF samples, values given in % of total intensity.
CatalystFunctional Groups/Binding Energy (eV)
Peak I
C–graphite 284.7–284.8
Peak II
C–O
286.0–286.3
Peak III
C=O
287.7–288.1
Peak IV –COO– 289.2–289.6Peak V
π–π*
291.2
ACF-072.518.85.72.01.0
ACF-Rw67.919.96.44.51.3
ACF-R163.423.47.85.4
ACF-R257.424.89.57.91.9
ACF-R456.523.710.38.70.8
Table 3. Deconvolution results of the O 1s XPS spectra for the ACF samples, values given in % of total intensity.
CatalystFunctional Groups/Binding Energy (eV)O/C
(%)
Peak I
C=O
531.6–531.8
Peak II
C–O
532.9–533.0
Peak III H2Oads, O2ads 534.3–534.7Peak IV CO2ads, COads 536.9–537.0
ACF-023.251.023.32.512.0
ACF-Rw25.554.220.10.721.3
ACF-R127.656.315.30.924.9
ACF-R230.756.012.90.532.2
ACF-R430.555.813.50.232.9
Table 4. Deconvolution results of the N 1s XPS spectra for the ACF samples, values given in % of total intensity.
CatalystFunctional Groups/Binding Energy (eV)N/C (%)
N6
Pyridine
398.7
N5
Pyrrolic/Pyridone 400.1–400.2
NQ
Quaternary N 401.2–401.3
N4
Pyridine-N-oxide 402.6
NX
–NO2
406.0
ACF-015.620.246.817.51.4
ACF-Rw3.233.226.05.432.31.5
ACF-R12.843.424.37.322.31.7
ACF-R25.250.522.86.215.32.4
ACF-R44.746.322.97.119.02.0
Table 5. The desorption quantities of CO2 from the ACF samples by the deconvolution of the TPD profiles.
CatalystCO2 Desorption (μmol/g)
Carboxyl [a] Anhydride [b]Lactone [c]Total
ACF-032151765
ACF-Rw19513273400
ACF-R1317245116678
ACF-R2407420136963
ACF-R4406425122953
Desorption temperatures: [a] 255–275 °C, [b] 430–451 °C, [c] 611–623 °C.
Table 6. The desorption quantities of CO from the ACF samples by the deconvolution of the TPD profiles.
CatalystCO Desorption (μmol/g)
Anhydride [d] Phenol [e]Carbonyl [f]Total
ACF-01583146244
ACF-Rw1327391371008
ACF-R12458231391207
ACF-R24206271251172
ACF-R4425551671043
Desorption temperatures: [d] 458–491 °C, [e] 630–660 °C, [f] 785–812 °C.
Table 7. Comparative performance in the production of H2O2 over ACF catalysts with reference catalysts (pH = 7.0–8.6, temp. = 2–27 °C).
Catalyst[H2O2] (mmol/L)Reaction Time (h)Hydrogen SourceConversion (%)Selectivity (%)Yield (%)Reference
ACF-Rw60.811.0NH2OH72.933.324.3This work
ACF-R188.511.0NH2OH50.570.135.4This work
ACF-R411211.0NH2OH47.494.544.8This work
ACF-R212311.0NH2OH49.210049.2This work
ACF-R2 a11711.0NH2OH56.083.646.8This work
ACF-R2533.0NH2OH21.399.321.2This work
ACH1147.0NH2OH--46.7[35]
ACP~503.0NH2OH~23~8720.0[36]
Mn2+-Tiron~2256.0NH2OH--~90[29]
Mn3+- Complex b~1850.75NH2OH--~74[30]
Au/MgO32.61.0NH2OH--81.5[32]
Pd/Al2O337.61.0NH2OH--94.0[33]
Au-Pd/C c690.5H2---[21]
AuPd/C c620.5H2---[22]
Au-Pd Catalyst c940.5H2---[23]
Au + Pd/C c790.5H2---[24]
Pd{Au}/C c77.50.5H2---[25]
a The third cycle of the ACF-R2 catalyst. b The [Na]5[Mn(3,5-(SO3)2-Cat)2]·10H2O complex with addition of Tiron as catalyst. c Reaction conditions: 10 mg catalyst in 5.6 g methanol and 2.9 g water solvent, 420 psi 5% H2/CO2 + 160 psi 25% O2/CO2, with stirring 1200 rpm at 2 °C.
Publisher’s Note: MDPI stays neutral with regard to jurisdictional claims in published maps and institutional affiliations.

