Article

Mesoporous TiO2 Implanted ZnO QDs for the Photodegradation of Tetracycline: Material Design, Structural Characterization and Photodegradation Mechanism

1
School of Chemical Sciences, Universiti Sains Malaysia, Gelugor 11800, Penang, Malaysia
2
School of Materials and Mineral Resources Engineering, Universiti Sains Malaysia, Nibong Tebal 14300, Pulau Pinang, Malaysia
3
Experimental and Theoretical Research Lab., Department of Chemistry, Kulliyyah of Science, Kuantan 25200, Pahang, Malaysia
4
School of Physics, Universiti Sains Malaysia, Gelugor 11800, Penang, Malaysia
5
Department of Chemistry, Kulliyyah of Science, International Islamic University Malaysia, Kuantan 25200, Pahang, Malaysia
6
Department of Chemistry, University of Saskatchewan, 110 Science Place–Room 165 Thorvaldson Building, Saskatoon, SK S7N 5C9, Canada
*
Authors to whom correspondence should be addressed.
Catalysts 2021, 11(10), 1205; https://doi.org/10.3390/catal11101205
Submission received: 6 September 2021 / Revised: 26 September 2021 / Accepted: 28 September 2021 / Published: 8 October 2021
(This article belongs to the Special Issue 10th Anniversary of Catalysts—Feature Papers in Photocatalysis)

Abstract

:
A sol-gel method was used to prepare a mesoporous TiO2 implanted with a ZnO quantum dot photocatalyst (TZQ) for the photodegradation of tetracycline (TC) under fluorescent light irradiation. Scanning electron microscopy (SEM) shows the presence of cavities on the photocatalyst surface due to the use of starch as a synthetic template, where the nitrogen sorption results indicate that TZQ contains mesopores with reduced size (ca. 4.3 nm) versus the pore size of the parent meso-TiO2 (ca. 7.5 nm). The addition of ZnO quantum dots (QDs) resulted in spherically-shaped binary composite particles in layers onto the surface of TiO2. The coexistence of the ZnO QDs and TiO2 phase was observed using high resolution-transmission electron microscopy (HR-TEM). The photodegradation of TC was carried out in a homemade reactor equipped with two fluorescent lights (24 W each) and within 90 min of irradiation, 94.6% of TC (40 mg L−1) was photodegraded using 250 mg L−1 of TZQ at pH 9. The major reactive oxygen species identified from the scavenging tests were O2●− followed by HO. The deconvolution of the photoluminescence spectrum of TZQ indicates the presence of a strong quantum confinement effect (QCE) of the ZnO QDs, a defect related to Ti-species and oxygen. The analysis of the intermediates detected by LC-time-of-flight/mass spectrometry (LC/TOF-MS) suggest two photodegradation pathways. The pathways were validated using the Fukui function approach and the Wheland localisation approach. This simple and efficient photocatalytic technology is anticipated to benefit small-scale animal husbandries and aquaculture operators that have limited access to sustainable water treatment technology.

Graphical Abstract

1. Introduction

Nanostructured semiconductors metal oxides have remarkable optical and electrical properties that serve important roles in many fields, especially in photocatalysis. Among the available nanostructured semiconductors metal oxides, TiO2 and ZnO have attracted academic and industrial interest due to their appealing catalytic properties: affordability, availability, non-toxicity, chemical and biological inertness, high surface-to-volume ratio and amenability for facile modification.
TiO2 and ZnO are classified as n-type semiconductors with bandgap energy values of ca. 3.6 eV and 3.37 eV, respectively [1,2]. Their large bandgap inhibits their application in photocatalysis under visible light irradiation and suffers from rapid recombination of photogenerated electron/hole pairs [3]. TiO2 and ZnO have been combined to form nanocomposites through various synthesis methods, addressing the above-noted drawbacks whilst enhancing their overall photocatalytic properties. Since TiO2 and ZnO have high melting points, specialised equipment is often required to obtained composite powders [4]. By contrast, the sol-gel synthesis method can yield nanocrystalline semiconductor powders with high purity and chemical homogeneity, even at low temperatures [5]. The water/alkoxide ratio, the presence of acid/base catalysts, solvent type, gel ageing, operating temperature, and mixing technique will influence the final physicochemical properties of the nanocrystalline semiconductor materials [6].
Bachvarova-Nedelcheva et al. [4], successfully prepared TiO2/TeO2/ZnO nanocomposite using the sol-gel method. Depending on the composition of TiO2, the amorphous phase and different crystalline phases of TiO2 (anatase), TiO2 (rutile), α-TeO2 and ZnTeO3 were formed. The Te-species that dominate the surface of the nanocomposites were Te2+, Te0, but Te6+. Despite the challenges in achieving the required properties by other synthesis methods, the nanocomposites obtained by the sol-gel method have significant potential for photocatalysis applications. Ali et al. [7], synthesised an irregular spherical-shaped ternary phase TiO2/ZnO (hexagonal wurtzite, anatase, and hexagonal ZnTiO3) nanocomposites, where the crystallite and particle size were found to decrease as the TiO2 concentration increased. The nanocomposites exhibited absorption peaks in the UV-visible regions due to TiO2 and ZnO, respectively. The presence of these absorbance peaks showed that the nanocomposites could be utilised over a wide region of the electromagnetic spectrum. In the case of nanocomposites with the smallest particle size, such catalysts were observed to give the highest removal of methylene blue during photodegradation conditions. Reduced particle size limited the resistance of charge transfer and eased the movement of electrons over the catalyst surface. Bhai et al. [8] synthesised a series of granular and flaky-shaped TiO2/ ZnO nanocomposites using sol-gel and hydrothermal methods. The combination of these two methods resulted in the formation of heterojunction, which promote the separation of generated electron-hole pairs. The nanocomposite was found to be more active (2.8 times) than pure ZnO and more active (4.8 times) over pure TiO2 for the removal of methylene blue. From the few examples quoted here, it can be seen that the sol-gel method is very robust for the synthesis of TiO2/ZnO nanocomposites and to enable tailoring of the physicochemical properties for diverse applications.
Compared to bulk semiconductors, quantum dots (QDs) with a size of less than 10 nm possess several advantages. The surface-to-volume ratio and the forbidden bandwidth noted for QDs are higher than their bulk phase counterparts. The increase in these two factors aide the movement of electrons and holes assemblage at the photocatalysts’ surface, which will enhance the photochemical driven reduction process [9]. Even though the synthesis of TiO2 QDs and ZnO QDs using the sol-gel method has been widely reported, the synthesis, characterisation, and photocatalytic potential of mesoporous nanocomposite of TiO2/ZnO QDs reported herein via the sol-gel method is poorly understood at the present time.
To the best of our knowledge, the majority of the published reports on wastewater treatment plants require a sophisticated infrastructure that employs costly and ongoing maintenance. Hence, the main objective of this research is to create an affordable yet effective wastewater treatment technology. In this study, mesoporous TiO2 was implanted with ZnO QDs to yield a binary photocatalyst material (TZQ) that was prepared via a simple sol-gel method, which was subsequently characterized using several complementary materials characterization methods. The photodegradation properties of the TZQ photocatalyst was studied using a model waterborne contaminant (tetracycline; TC) by employing a homemade reactor equipped with 48-watt fluorescent lamps. The photodegradation properties of the prepared nanocomposite is shown to be higher than other TiO2 and ZnO-based photocatalysts reported previously (vide infra; cf. Table 5). The occurrence of quantum confinement effects for ZnO QDs and structural defects of Ti and oxygen led to suppression of the photogenerated e−/h+ pairs from recombination. The photodegradation pathway of TC was proposed based on the intermediates detected by LC-TOF/MS analysis, along with validation by the Fukui function approach and the Wheland localisation approach. We anticipate that the findings reported herein with the TiO2/ZnO photocatalyst will contribute further to the development of a low-cost and sustainable photocatalytic-based technology. In contrast with other types of photocatalyst systems, the sol-gel method described herein represents a versatile approach for the facile synthesis of TiO2/ZnO nanocomposites with tailored physicochemical properties for diverse applications. The photocatalyst material described herein offers a facile point-of-use treatment for the removal of waterborne contaminants such as tetracycline (TC). We anticipate that this research study will catalyze further research and development in the field of photocatalysis and water security applications due to its widespread appeal and sustainability for advanced wastewater treatment.

2. Results and Discussion

2.1. Characterisation

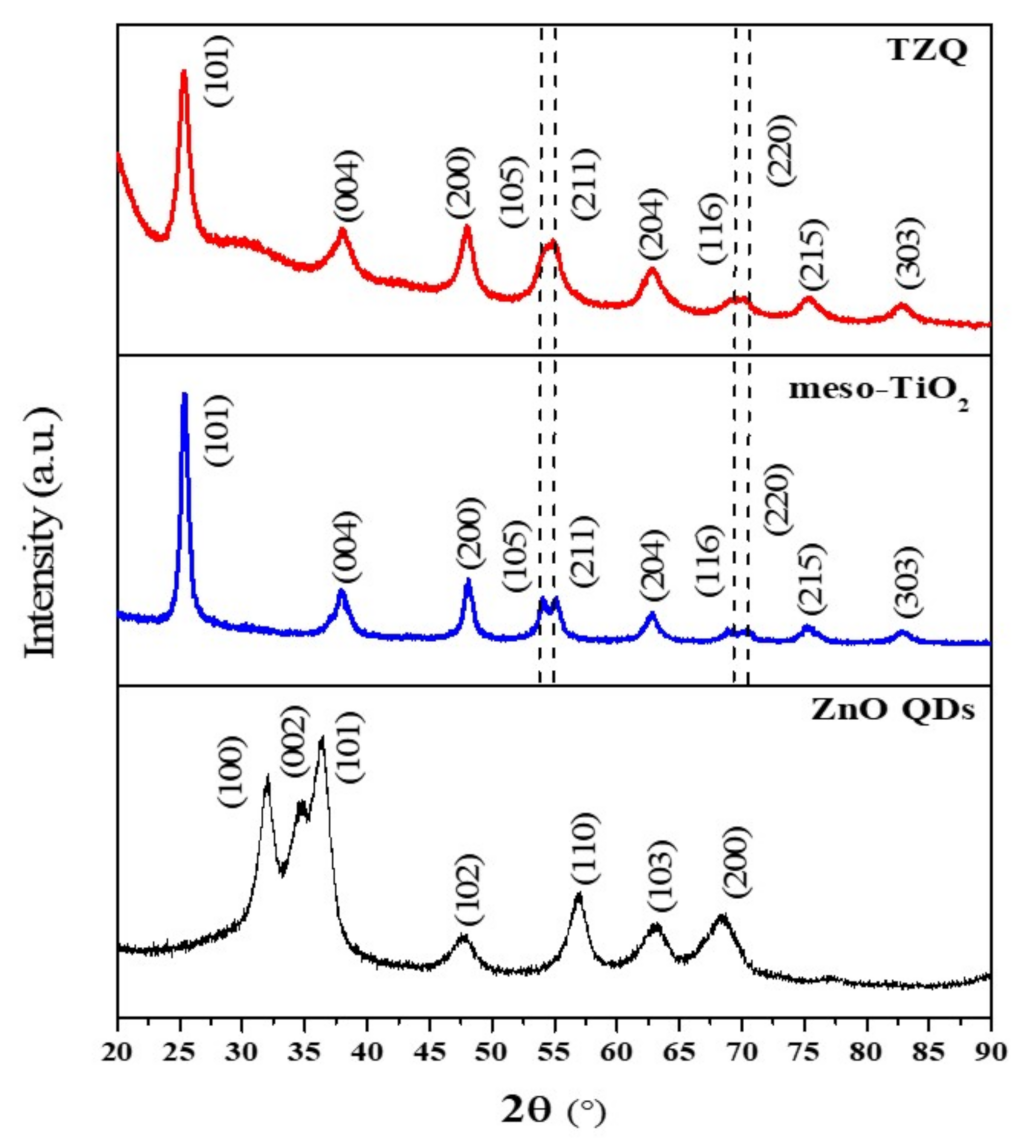
2.1.1. X-ray Diffraction Analysis
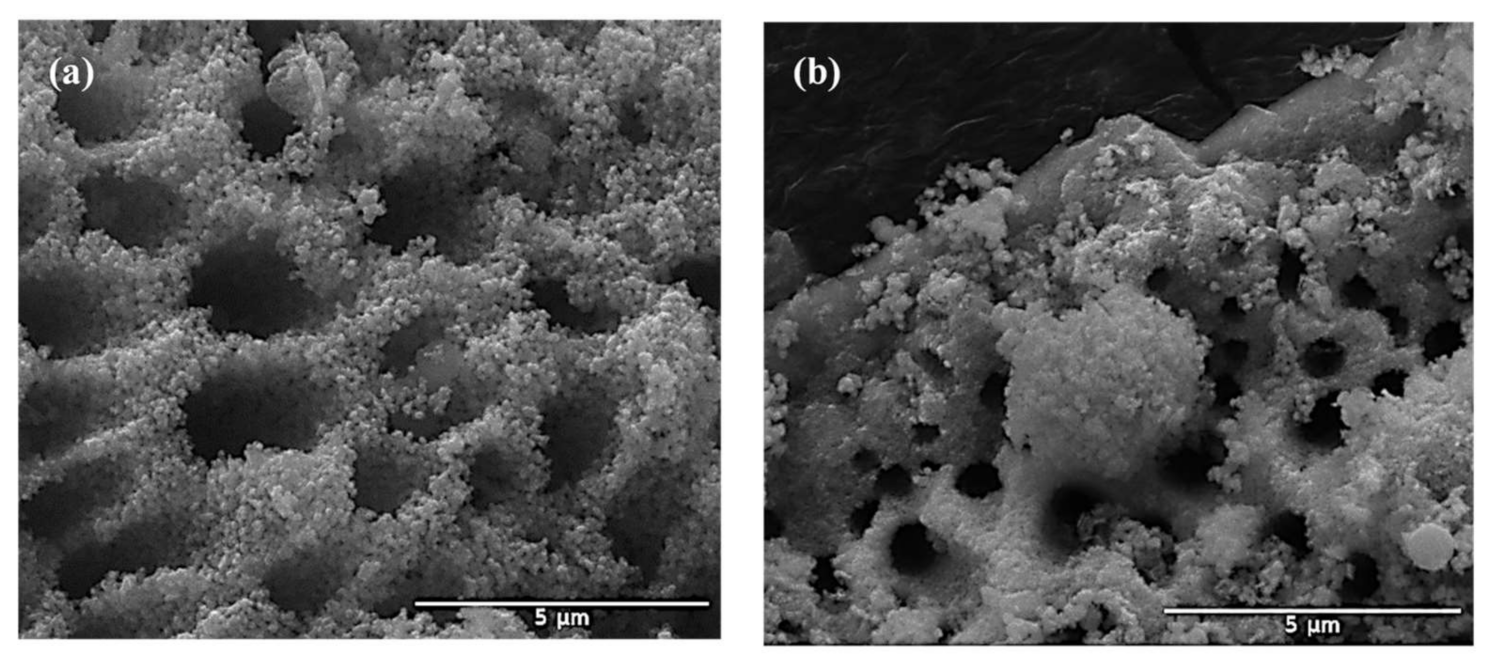
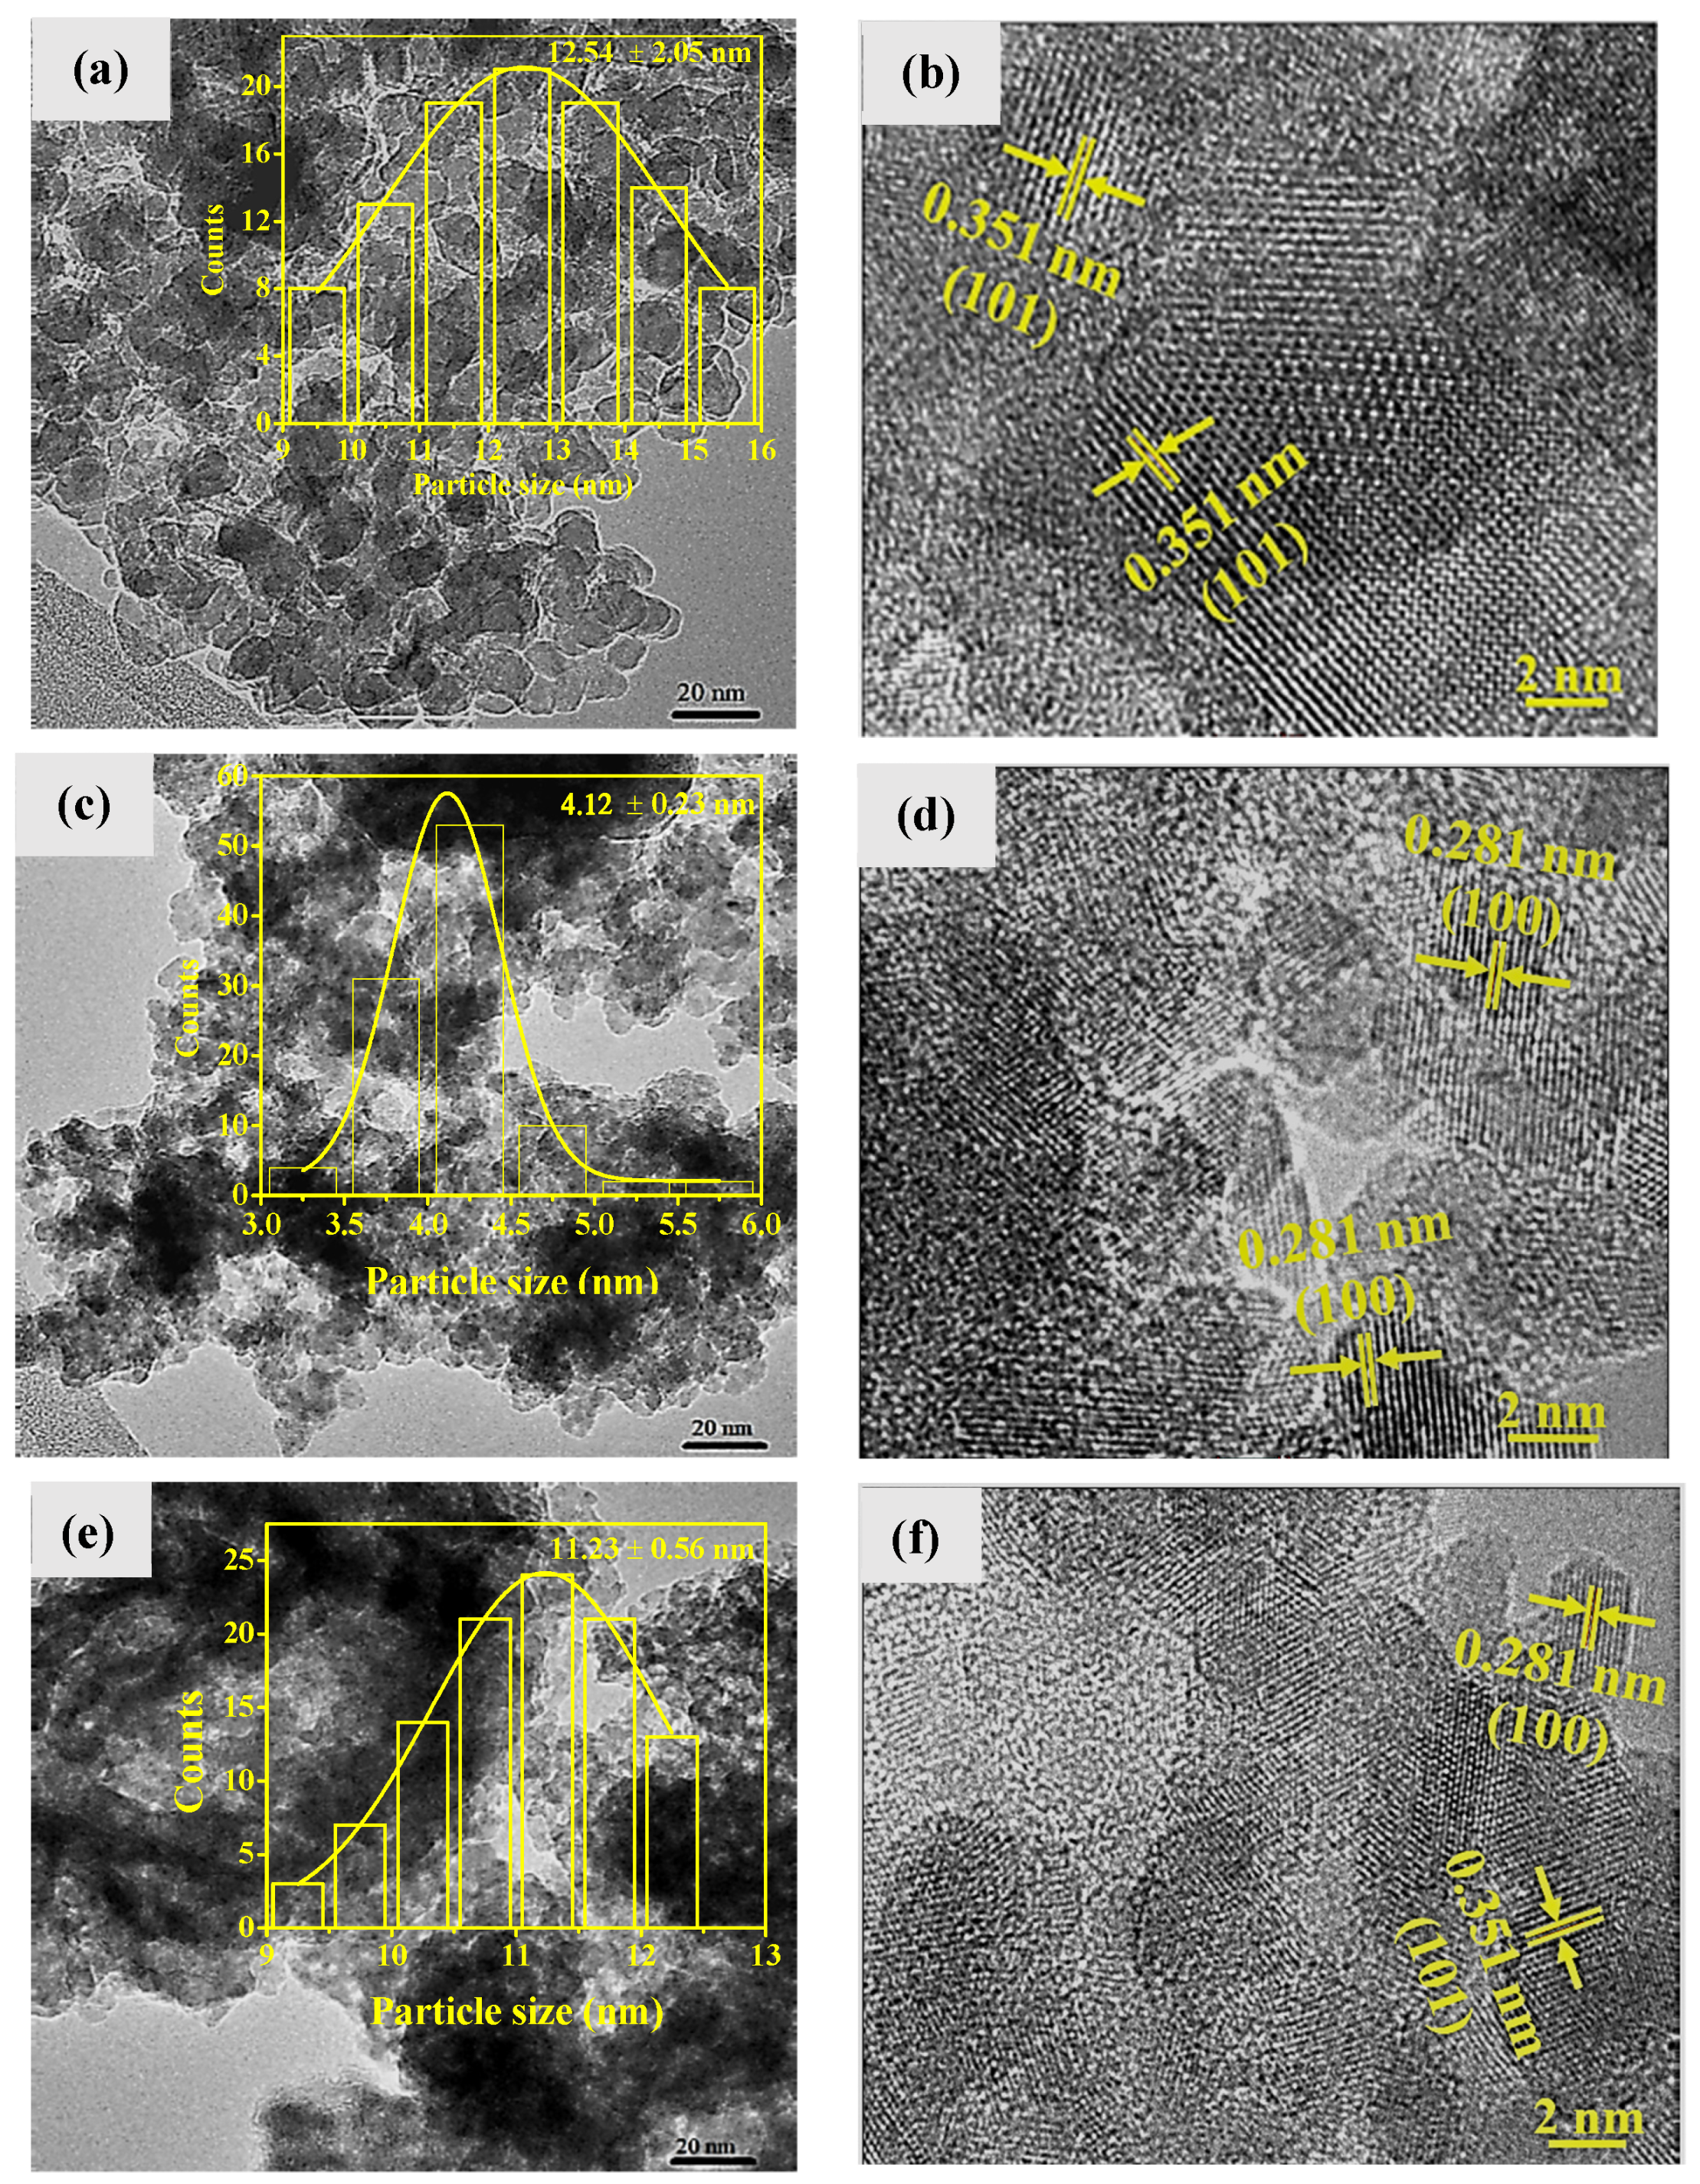
The crystal structure and phase composition of TZQ, meso-TiO2 and ZnO QDs were determined using the XRD analysis shown in Figure 1. The XRD peaks observed in the diffraction profile of ZnO QDs correspond to the crystal planes of the hexagonal Wurtzite phase (JCPDS 01-071-6424). These XRD bands of ZnO QDs are broader as compared to the ZnO nanoparticles due to their small crystallite size and reduced crystallinity [10,11]. The average crystallite size of the ZnO QDs (4.45 nm) was calculated using the Debye–Scherrer equation.
The XRD bands of TZQ at 2θ = 25.3°, 37.9°, 48.1°, 54.8°, 62.8°, 69.6°, 75.2°, and 82.8° are indexed to the crystal planes of the tetragonal structure of anatase TiO2 phase (JCPDS 00-021-1272) [12]. However, the peaks appear broader compared to meso-TiO2, which indicates a decrease in crystallinity [11]. The lower crystallinity of TiO2 may relate to the presence of Ti–O–Zn structures, which may inhibit the growth of the anatase TiO2 crystals by providing distinct grain boundaries [13]. Interestingly, the XRD signatures that relate to the hexagonal Wurtzite phase were not observed in the XRD profile of TZQ. The absence of the peaks can be due to several reasons: (1) Some of the ZnO QDs may have underwent structural strain during synthesis to favour a crystalline to amorphous structural change [14]; (2) The ZnO QDs were well dispersed within the matrix of the meso-TiO2 at relatively low concentration, which limits their analytical detection; and (3) Structural defects due to the secondary phase (ZnO QDs) due to the composition and homogeneous mixing of Ti and Zn components in TZQ [15]. This means that anatase TiO2 and ZnO QDs exist as a single-phase with amorphous character since the surface energy is directly proportional to the crystallite size. The incorporation of ZnO QDs reduce the surface charge of anatase TiO2, where a reduction in the crystallite size from ca. 11.4 nm to 9.3 nm. A broad XRD band with weak intensity around 2θ = 30° in the diffractogram of TZQ relates to the presence of amorphous silica (and amorphous ZnO) in Figure 1.

2.1.2. Morphology

The FESEM micrographs of meso-TiO2 and TZQ are shown in Figure 2. The surface of the meso-TiO2 is constructed with cavities with an average diameter of 1.67 µm (cf. Figure 2a). The hydrolysis and condensation of TTIP to form a 3D-oxide network is represented by the following reactions:
Ti OR 4 + 4 H 2 O Ti OH 4 + 4 ROH   hydrolysis
Ti OH 4 TiO 2 x H 2 O   + 2 x H 2 O   condensation
where R = isopropyl. Since the water molecules bear a positive partial charge [16], the oxolation and olation reactions can proceed simultaneously during the nucleation process to form amorphous hydrous oxides (TiO2·nH2O). The number of water molecules (n) depend on the reaction conditions [17]. Since the deoxolation reaction (O=Ti–OH2–HO–Ti–Ti–OH) took place, the condensation reaction was inferred to proceed along an apical direction that resulted in skewed chains to form a TiO2 sol. As the condensation occurs, the sol is drawn to the starch granules by attractive van der Waals interactions. In hot water, the starch granules absorb more water and undergo swelling due to structural changes of the biopolymer upon gelatinisation. During calcination, the swelled starch granules will be removed, leaving behind cavities and anatase TiO2. The ZnO QDs are implanted on the surface and in the cavities, which reduce the average diameter to 0.64 µm. The implantation of ZnO QDs also yields new ZnO QDs/TiO2 composite layers and spherical-shaped particles when the two semiconductors are fused (cf. Figure 2b). The cavity-forming process of meso-TiO2 and ZnO QDs implantation is simplified, as illustrated in Scheme 1.
Figure 3 shows the TEM and HR-TEM images of the meso-TiO2 and ZnO QDs. The TEM image of meso-TiO2 (cf. Figure 3a) indicates the presence of highly agglomerated and irregular spherical-shaped plate-like particles with an average size of 12.5 ± 2.1 nm. The lattice fringes of 0.351 nm for meso-TiO2 (Figure 3b) are ascribed to the (101) planes of anatase TiO2 [18]. From the HRTEM of ZnO QDs shown in Figure 3d, the lattice fringe with a value of 0.281 nm is attributed to ZnO phase [19]. The particle size of the ZnO QDs was determined to be 4.1 ± 0.23 nm. The existence of lattice fringes related to the anatase phase of TiO2 (0.35 nm) and ZnO QDs (0.281 nm) in the HR-TEM of TZQ (Figure 3e,f) indicate the successful formation of heterojunction between the anatase TiO2 and ZnO QDs. The average particle size of the TZQ was measured to be 11.2 ± 0.56 nm. The particle size determined from HRTEM analysis is consistent with the crystallite size estimated from the XRD results.

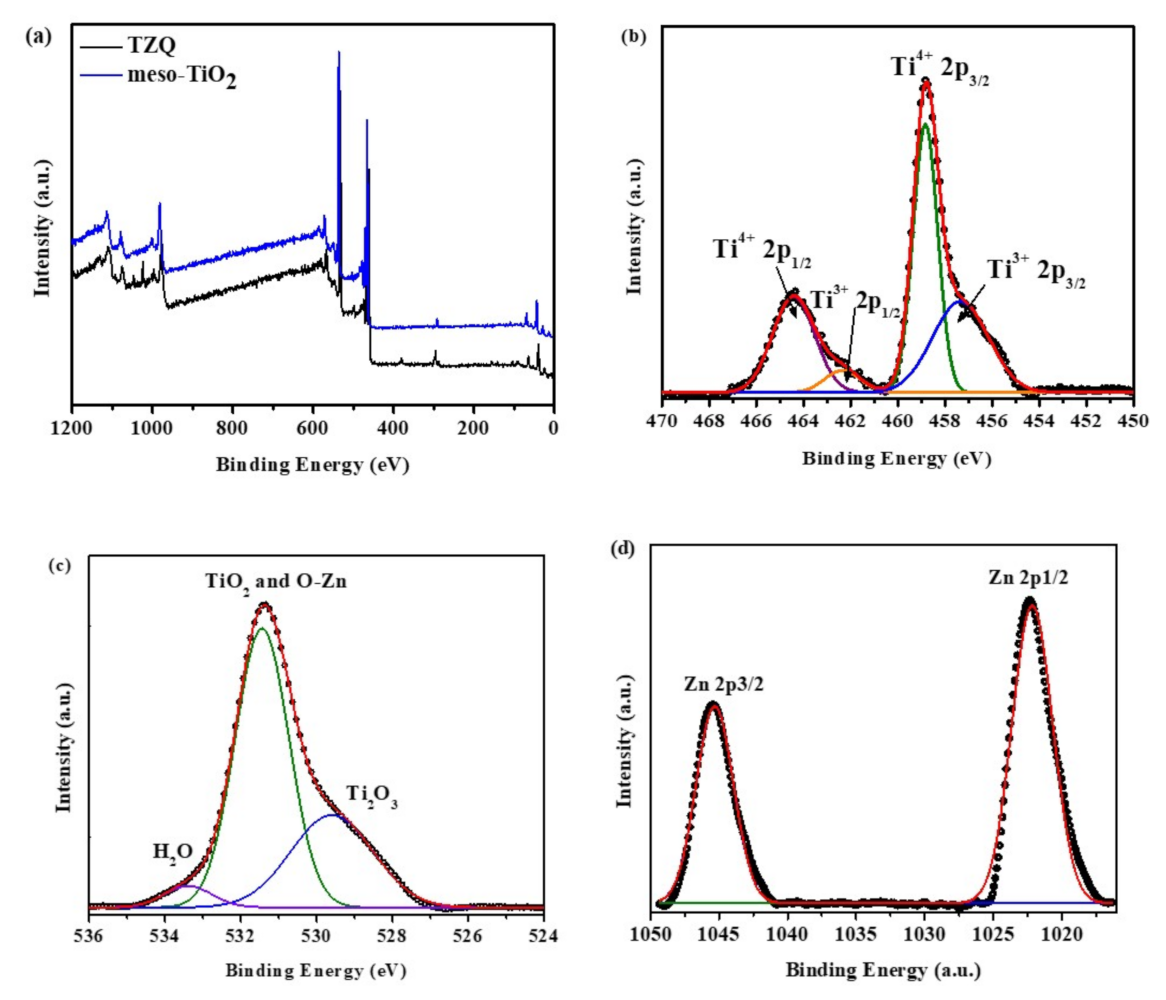
2.1.3. X-ray Photoelectron (XPS) Analysis

The elemental composition of the samples using XPS analysis is shown in Table 1. The C detected by XPS originates from the carbon material used as a reference for the calibration analysis of other binding energies [20], whereas the potassium originates from the base (KOH) used to adjust the pH during the synthesis.
The XPS survey spectra of the TZQ and meso-TiO2 are shown in Figure 4a, whereas Figure 4b–d illustrates the narrow scan spectra of Ti 2p, Zn 2p, and O 1s. The bands in the TZQ spectrum underwent a slight shift, as compared to meso-TiO2. The shifting indicates that the Ti4+ may have replaced Zn2+ to form Ti–O–Zn structures with amorphous features. Deconvolution of the Ti 2p3/2 and Ti 2p1/2 peaks resulted in two sets of bands with different intensities. The signatures centered at 458.8 eV and 464.4 eV correspond to the Ti4+ in TiO2. Another set of peaks centered at 457.2 eV and 462.6 eV is associated with Ti3+ species in Ti2O3, which indicate the existence of oxygen vacancy defects in the nanocomposite [21]. The reduction of Ti4+ to Ti3+ in this research took place during the calcination process at 500 °C. At this elevated temperature, the oxygen vacancies can transfer electrons to Ti4+ to reduce it to Ti3+. In addition, the remaining carbon from the pyrolysis of TTIP can act as a reducing agent to facilitate the reduction of Ti4+ on the surface to Ti3+ [22,23].
The deconvolution of the O1s peak resulted in three bands (Figure 4c) that are centered at 529.3 eV, 531.4 eV and 533.3 eV. The first band was assigned to the O2 deficient regions of Zn–O [24], whereas the second band was assigned to the Ti–O bonds [25] and Ti2O3-oxygen vacancies sites [26], while the third band relates to adsorbed H2O [27]. The deconvolution of the Zn 2p spectrum resulted in two bands centered at 1022.2 eV and 1045.3 eV, which relate to the Zn2p3/2 and Zn2p1/2 electronic states of ZnO [28].

2.1.4. Optical Absorption Properties

The photo-absorption characteristics of the meso-TiO2, ZnO QDs, and TZQ photocatalysts are shown in Figure S1a (cf. Supplementary Materials). The UV absorption edge is known to be influenced by particle size [29], where the particle size of TZQ (11.23 nm) is larger than ZnO QDs (4.12 nm). Hence, the optical absorption edge of the TZQ is positioned at a higher wavelength [30]. The quantum size effect (QCE) of the ZnO QDs may also affect the bandgap of the TZQ [9]. The QCE is observed when the particle size of the bulk material is reduced to a value of 10 nm or less. At this small particle size, the random movement of electrons will be restricted to a specific energy level, which affects the optical and electronic properties of the materials. The optical absorption edge of meso-TiO2 (12.54 nm) is positioned at the highest wavelength, as compared to ZnO QDs and TZQ, due to its larger particle size [31].
The bandgap energy of the photocatalyst systems were estimated from the Tauc plot of (αhν)1/2 versus hν (Figure S1b; Supplementary Materials). The anatase TiO2 is an indirect semiconductor (where n = 2), whereas ZnO is a direct semiconductor (where n = ½). Since the major component in the nanocomposite is TiO2, a value of n = 2 was used [32]. The calculated bandgap energy of the photocatalysts is given in Table 2. The calculated band gap energy concurs with the shifting of the optical absorption edges. The Mulliken electronegativity theory was used to calculate the potentials of the valence band (cf. Equation (1)) and the conduction band (cf. Equation (2)) edges [33]:
E v b = X E e + 0.5 E g
E C B = E V B E g
The EVB is the valence band edge potential, ECB is the conduction band potential, Eg is the bandgap of the semiconductor, E e represents the energy of free electrons on the hydrogen scale (̴4.5 eV) and X is the electronegativity of the semiconductor, which is 5.79 eV and 5.81 eV for ZnO and TiO2, respectively [34]. The CB and VB potentials were estimated using Equations (2) and (3), and are listed in Table 2. The calculated VB potential was 2.87 eV for pristine ZnO QDs, 2.95 eV for meso-TiO2, and 3.07 eV for TZQ. The values are higher than the standard redox potentials of several oxidising agents; OH/HO− (1.99 eV), H2O2 (1.77 eV), and O3 (2.07 eV). These results suggest that the prepared TZQ may possess stronger oxidising ability [35], where the calculated CB potential for the meso-TiO2 was more positive as compared to ZnO QDs. The CB potential becomes more negative due to the QCE, which also shifts the CB to more negative potentials (on NHE scale) with a decreasing particle size. In turn, this leads to the generation of species with higher oxidation ability.

2.1.5. Specific Surface Area and Pore Structure

Figure S2 (cf. Supplementary Materials) display the N2 sorption isotherms and pore size distribution (PSD) curves (inset) of the meso-TiO2 and TZQ. The mesoporosity of the photocatalyst is supported by the presence of Type IV adsorption-desorption isotherms. The H3 hysteresis loop indicates the presence of non-rigid aggregates of plate-like particles [36]. The SEM analysis provides an account of cavities on the outer surface of a material. By contrast, the N2 sorption analysis results may indicate a combined effect of adsorption at outer surface sites and at the pores embedded within the internal matrix of the material, which provides a more accurate description of the pore structure of the system. Hence, the PSD determined by N2 sorption analysis was used to assess the mesoporous character of the photocatalyst.
The Barrett–Joyner–Halenda (BJH) PSD of meso-TiO2 is broadly centered at 74.9 Å, whereas the pore size distribution of TZQ is broadly centered at 34.4 Å. The BET surface area of the TZQ was higher compared to the meso-TiO2. The greater BET surface area and textural properties of the photocatalysts determined from N2 sorption analysis are listed in Table 3.

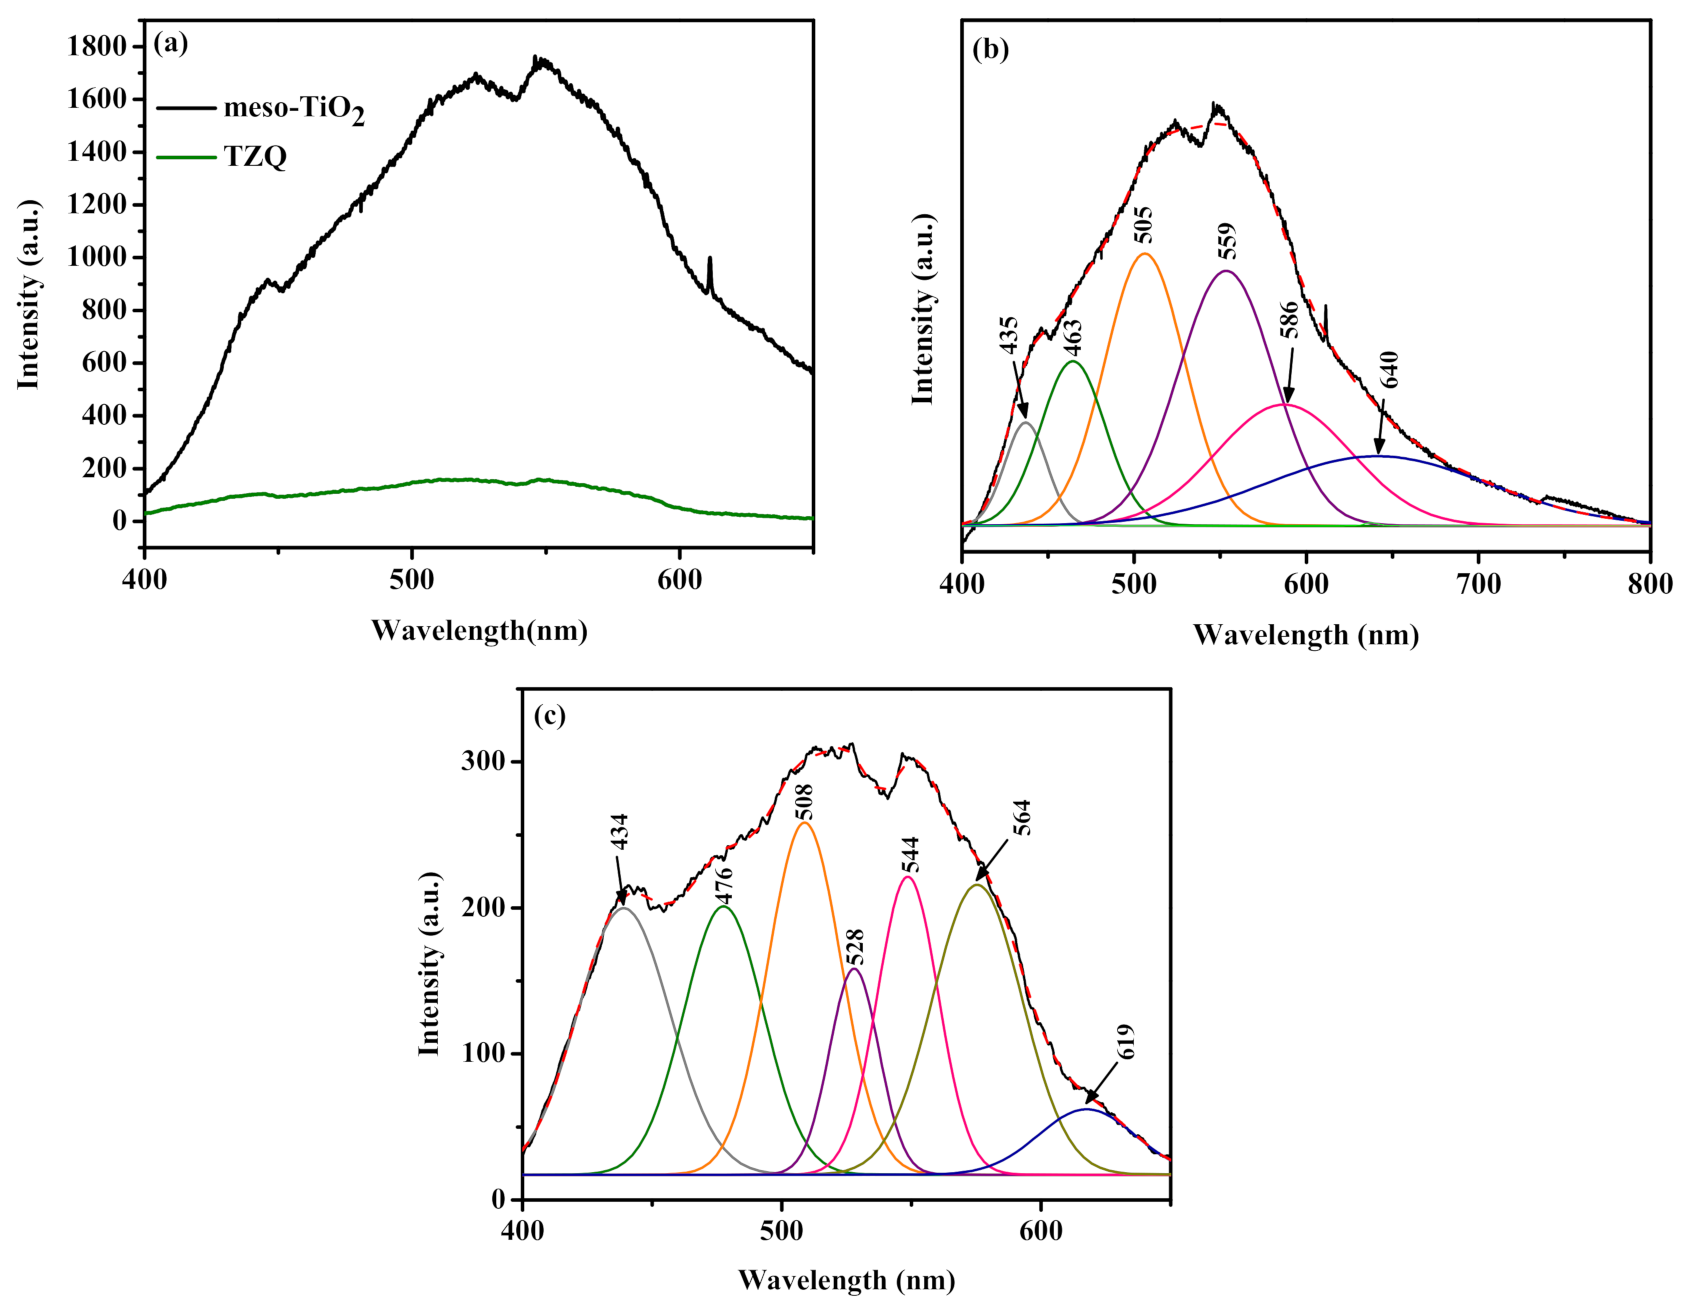
2.1.6. Photoluminescence Studies

The photoluminescence (PL) spectrum of the meso-TiO2 and TZQ is shown in Figure 5a. A lower PL intensity often indicates the higher photocatalytic activity of a semiconductor due to a lower rate of photogenerated e/h+ pair’s recombination [35]. Hence, the separation of photogenerated e/h+ pairs in TZQ is more favourable over meso-TiO2. The deconvolution of the broad PL spectrum of meso-TiO2 resulted in four Gaussian bands (cf. Figure 5b). The Gaussian band at 435 nm is attributed to the self-trapped excitons of TiO6 octahedra [37]. The shallow trap due to the Ti3+ states just below the conduction band gave rise to the Gaussian band at 463 nm, whereas the band at 505 nm is due to the deep trap state associated with the single electron trapped oxygen vacancy [37]. The Gaussian band at 559 nm is associated with transitions of electrons from the conduction band edge to deep trap holes related to oxygen vacancies [38]. The intrinsic defects in the meso-TiO2 framework may relate to the Gaussian band at 586 nm. The presence of surface oxygen of hydroxyl species can create an acceptor level above the VB of the meso-TiO2 that contribute to the Gaussian band at 640 nm [39]. Six Gaussian bands were formed when the PL spectrum of TZQ was deconvoluted (cf. Figure 5c), indicating the formation of new defects. The Gaussian band at 434 nm is attributed to the strong quantum confinement of the ZnO QDs [40]. The second Gaussian band at 476 nm is associated with the shallow trap assigned to the Ti3+ states lies just below the conduction band [37]. Vanheusden et al. [41] suggest that the Gaussian band at 508 nm is due to the non-radiative electron capture from the CB by a singly charged oxygen (VO+) vacancy, which led to an unstable state that recombines with photogenerated holes in the VB. The transition from CB to an oxygen anti-site, OZn is responsible for the Gaussian band at 528 nm [42]. The Gaussian band at 544 nm is proposed by Ahn et al. [43] and Cao et al. [44], attributed to a CB → Oi transition. The deeply trapped double-charged oxygen (VO++) vacancy state, which undergoes recombination with a CB electron, gives rise to the Gaussian band at 564 nm and 619 nm [37].

2.2. Photocatalytic Activity

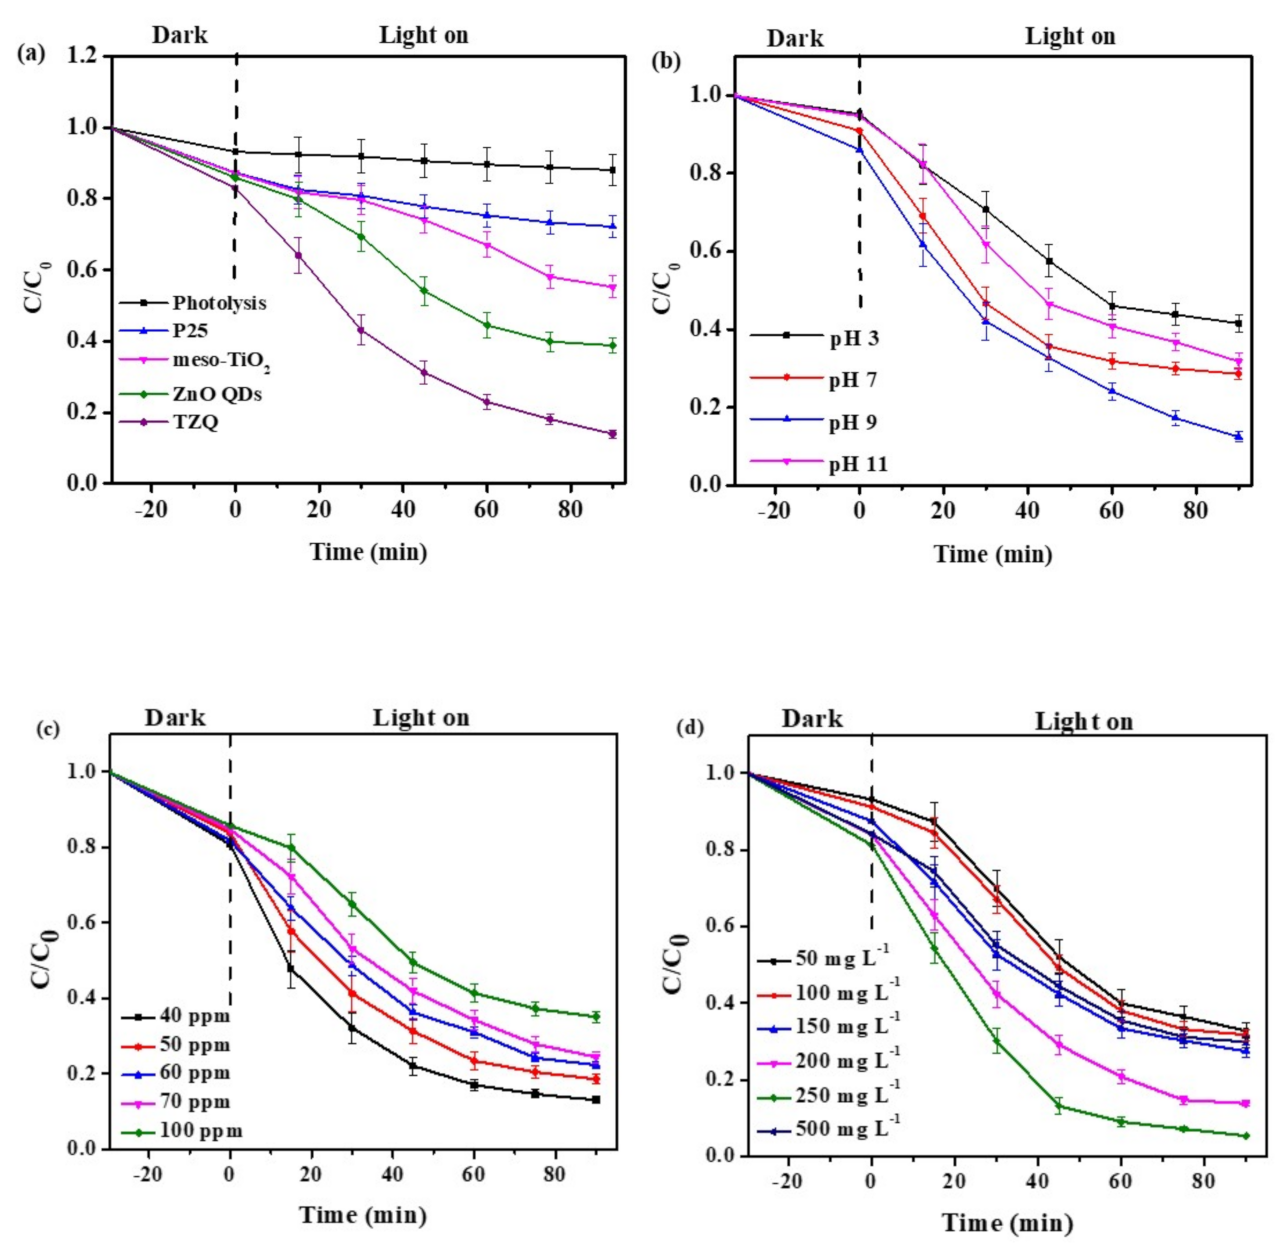
2.2.1. The Effect of Different Types of Photocatalyst

The photocatalytic activity of the photocatalysts were evaluated for the photodegradation of TC in an aqueous solution under fluorescent light irradiation at room temperature, where the results are shown in Figure 6a. Under the fluorescent light irradiation, the removal of TC was insignificant without any photocatalysts (photolysis). The commercial TiO2 Degussa P25 resulted in removal of 20% of TC after 90 min of irradiation, whereas meso-TiO2 led to removal of 35% of TC. The higher efficiency of meso-TiO2 was attributed to the higher surface area and the presence of mesopore sites. The ZnO QDs are capable of photodegrading 61.8% of the TC, where this photocatalyst material was not efficiently recovered due to its fine particle size. The photodegradation of TC reached 82.2% when TZQ was used. In addition to having various types of defects as indicated in the PL analysis, the superior photocatalytic activity of TZQ was compared to P25 and meso-TiO2, which relates to the QCE of the QDs. In the presence of the QCE, the recombination rate of photogenerated e−/h+ pairs will be further suppressed. In addition, the photogenerated e−/h+ pairs will have higher energy to carry out the photodegradation of pollutants effectively at a faster rate.
The photodegradation of TC was found to adhere to the pseudo-first-order kinetic model (cf. Table 4) [45,46]. The order of photocatalytic degradation efficiency of TC adopts the following order: TZQ (20.52 × 10⁻³ min−1) > ZnO QDs (11.24 × 10⁻³ min−1) > meso-TiO2 (6.91 × 10⁻³ min−1) > P25 (3.21 × 10⁻³ min−1), where the bracketed values represent the pseudo-first-order rate constant (k). The incorporation of ZnO QDs to the matrix of meso-TiO2 led to higher pseudo-first-order rate constants for TC degradation, as compared to that observed for pristine meso-TiO2 and P25, respectively.

2.2.2. The Effect of the Initial pH of the Solution

The ability of TZQ in photodegradation of TC was investigated at pH 3, 7, 9, and 11. The TC removal profile is shown in Figure 6b. After 90 min of irradiation, 56.1%, 72.5%, 82.2% and 78.1% of TC was removed at pH 3, 7, 9 and 11, respectively. The presence of dimethyl ammonium, tricarbonyl, and phenolic diketone functional groups results in TC with three different pKa values at various pH environments in aqueous media. The pKa values of TC were determined to be 3.30, 7.68, and 9.69. At pH values below 4, TC exists mainly in its protonated form, whereas TZQ adopts a surface charge at Ph ~ 4 at pH conditions below the point-of-zero-charge (PZC = 6.9), and TC is adsorbed to a lesser extent due to the role of repulsive interactions. In turn, the positive surface charge on TZQ results in a lower TC removal [45,46]. The TC removal at pH 3 was 56.1%. At pH conditions between 7.5 to 10 (7.5 < pH < 10) TC exists in its anionic form from neutral to alkaline pH values. Even though the surface of the photocatalyst was negatively charged, the positive charge of the dimethylamine group compensates for the negative charge, which led to improved adsorption and TC removal (%) [45]. The removal at pH 7 (72.5%) reached a maximum at pH 9 (82.2%). In basic and neutral media, the reaction between the hydroxide ions and holes will generate more hydroxyl radical species (OH), where only the holes contribute in acidic media [47]. By contrast, more OH can be produced by increasing the pH of the solution [45]. As well, the negatively charged TC tends to attract OH due to their high electrical density on the ring system, which would result in greater removal efficiency of TC in basic media [47,48]. However, the degradation rate of TC is inhibited at pH values >10. The inhibition is driven by competition between OH and TC for the surface adsorption sites on the photocatalyst surface. Hence, pH 9 was chosen as the optimum pH, and for optimisation of other reaction parameters.

2.2.3. The Effect of the Initial Concentration of TC Solution

The effects of variable initial TC concentration was studied in the range of 40 to 100 ppm. From Figure 6c, the photodegradation of TC decreased with an increase in the initial TC concentration. More intermediates from the photodegradation process were formed at higher TC levels and these intermediates compete with TC for the active sites. Hence, fewer active sites will be available for the adsorption of TC. Besides, light penetration to the surface of the photocatalyst will also be inhibited in the presence of a higher TC concentration [49]. The optimum initial TC concentration was fixed at 40 mg L−1, where it was held constant throughout the analysis.

2.2.4. The Effect of Photocatalyst Dosage

The removal (%) of TC also depends on the dosage of the photocatalyst, where the TC removal (%) at variable photocatalyst dosage is shown in Figure 6d. The TC removal increased as the dosage varied from 50 mg L−1 (67.3%) to 250 mg L−1 (94.6%). More active sites are available at higher dosages for the adsorption and photon absorption of the generation of reactive oxygen species (ROS). Increasing the dosage to 500 mg L−1 reduces the removal to 70.1%. Hence, 250 mg L−1 is considered as the optimum dosage. Above this level, particle aggregation occurs and causes a significant fraction of the photocatalyst to be inaccessible for TC adsorption or photon absorption, resulting in reduced photodegradation [49].

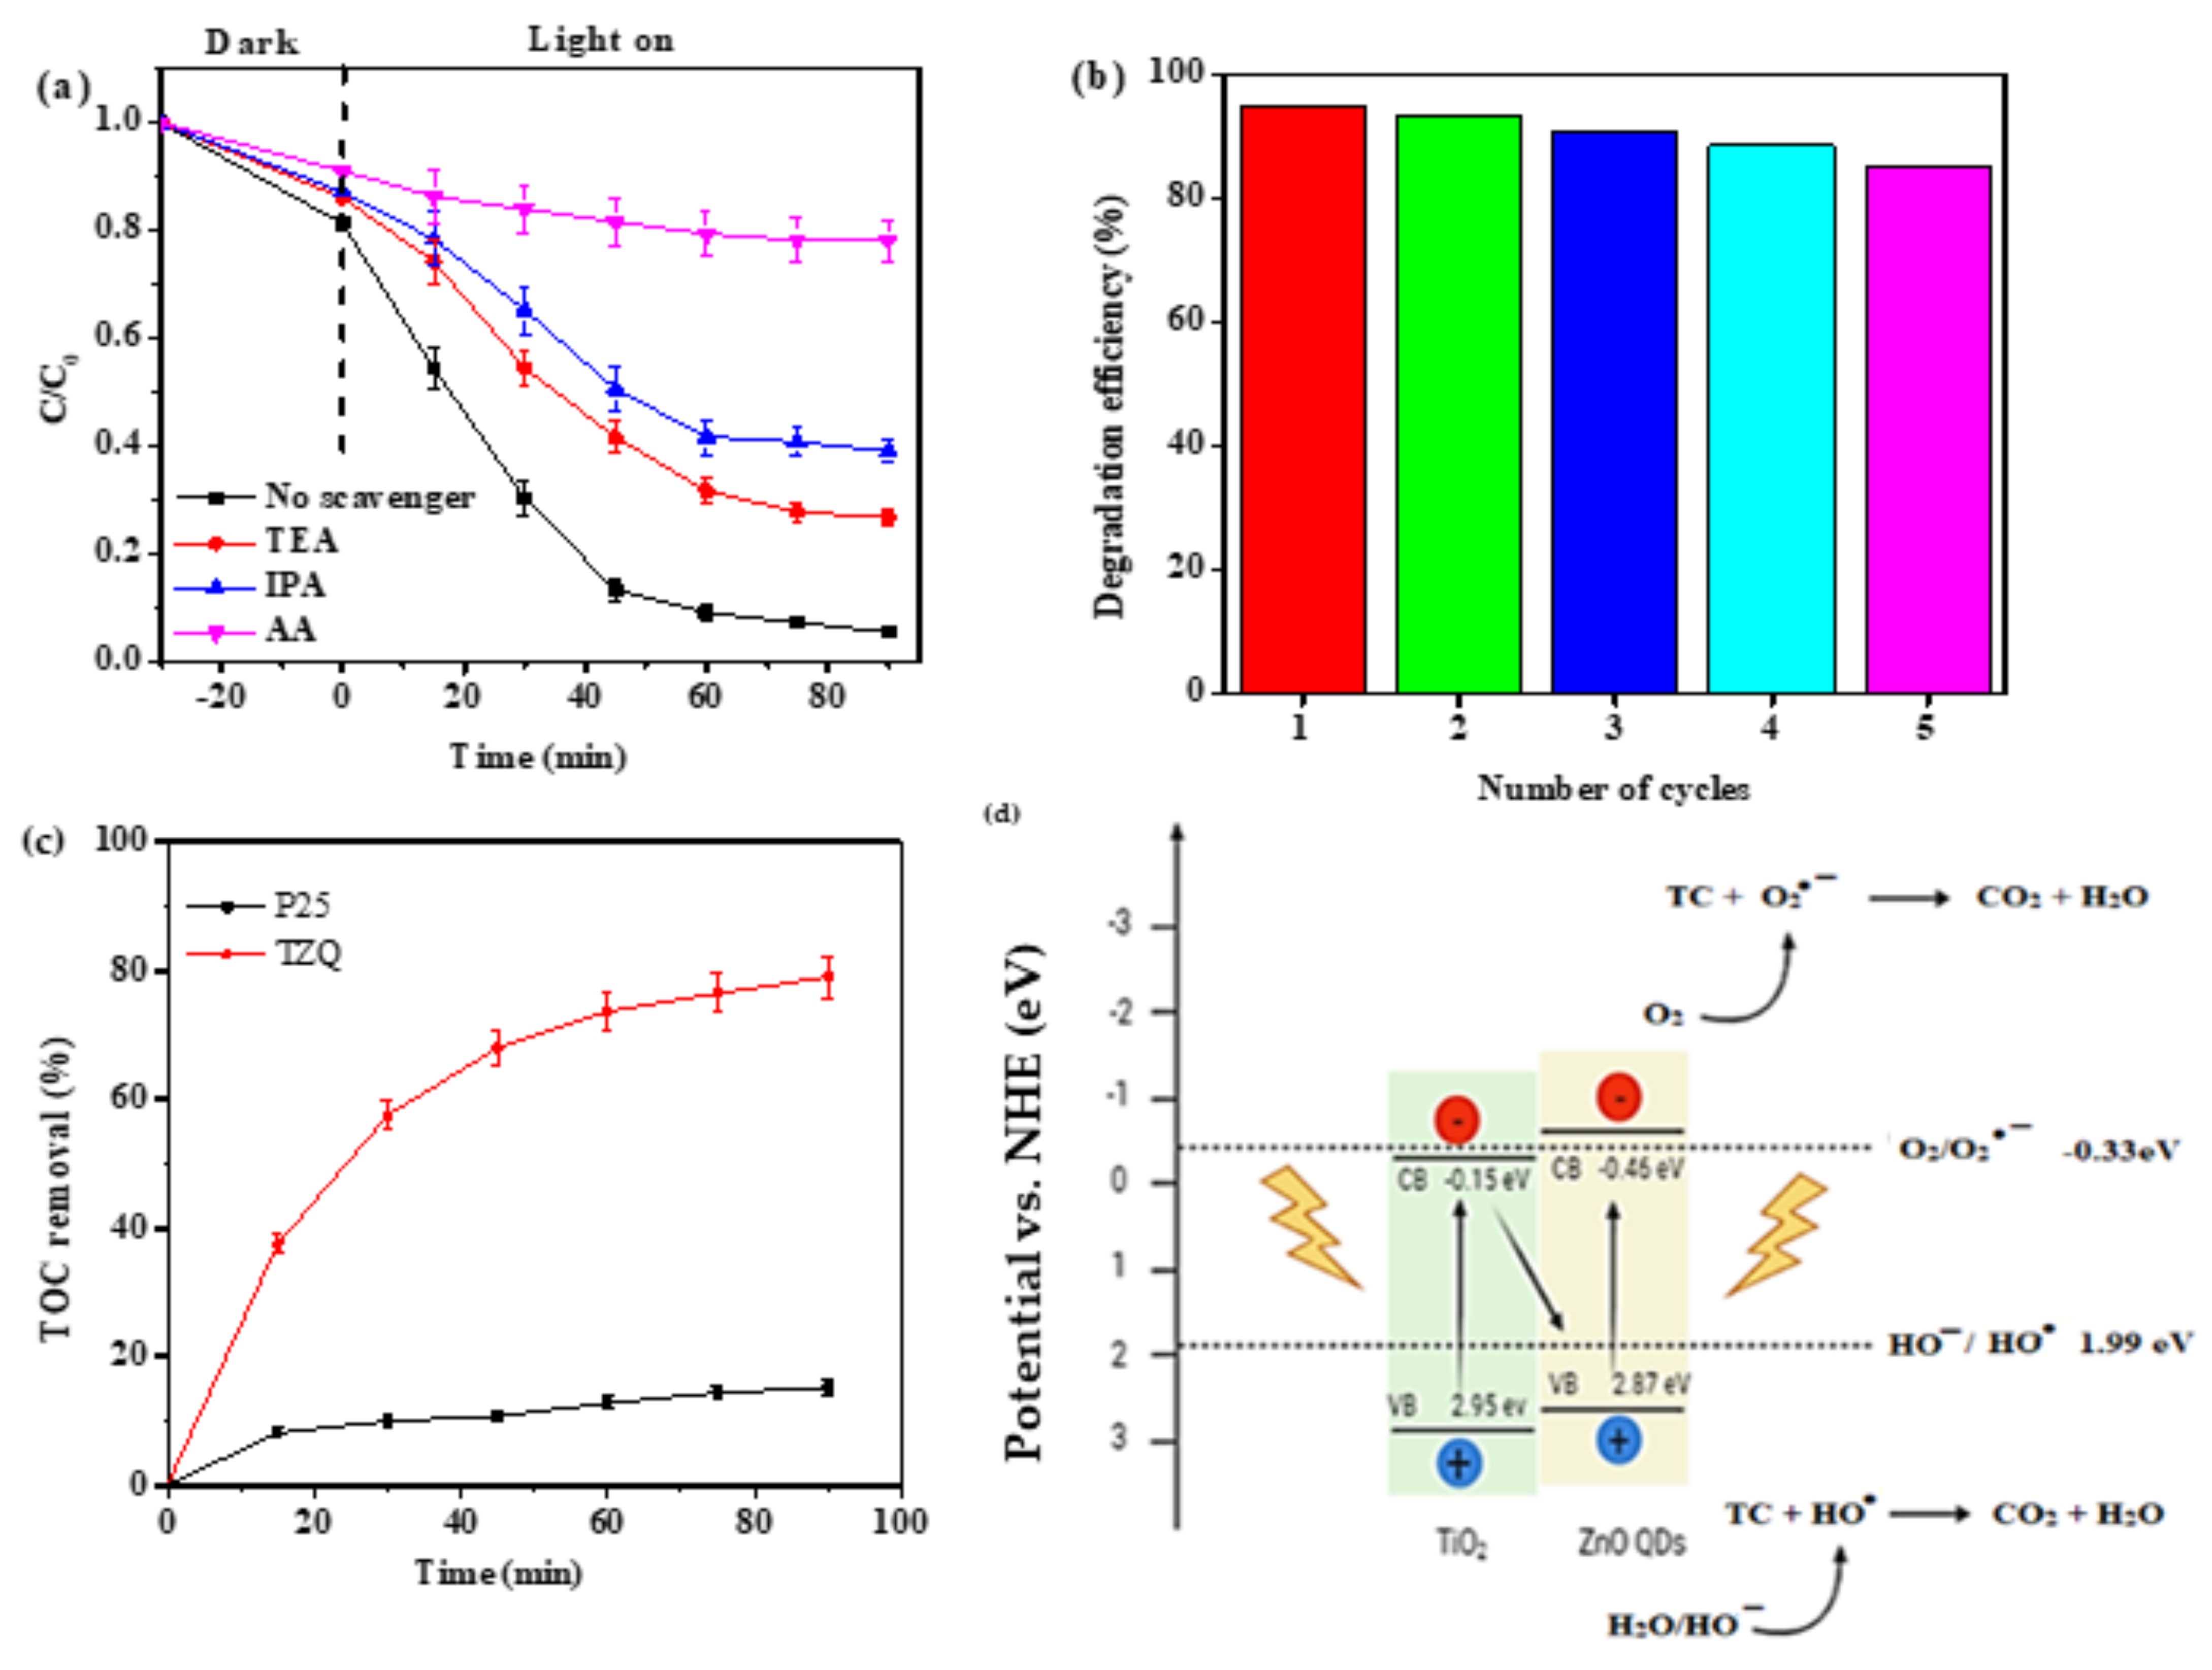
2.2.5. Scavenging Test

Scavenging tests were conducted to identify the active species responsible for the photodegradation of TC. Ascorbic acid (AA), triethanolamine (TEA), and isopropanol (IPA) were used as scavenging agents for O2●−, h+, and OH, respectively [45,46,47,48]. From the TC removal profile shown in Figure 7a, the TC removal dropped to 21.9% and 60.9% when AA and IPA were added, whereas the presence of TEA resulted in greater TC removal (73.3%). Hence, the major species involved during photodegradation were O2●− followed by OH and h+.

2.2.6. Reusability and Mineralisation Studies

Figure 7b shows the reusability profile of TZQ photocatalyst for the TC photodegradation. After five consecutive cycles, the TZQ photocatalyst underwent ~9% loss in its photocatalytic activity. The small degree of loss indicates that ZnO QDs did not leach into the solution. A mineralisation study was performed to identify the total organic carbon (TOC) content. As illustrated in Figure 7c, the TOC removal by the TZQ nanocomposite was 62.9%, which is ca. 3.8-fold higher than P25.
The photodegradation efficiency of TZQ was compared with several ZnO and TiO2 based photocatalysts reported in the literature. The reported photocatalysts and the conditions required to achieve maximum TC removal are given in Table 5. Based on the survey, it can be observed that TZQ does not require specialised and expensive equipment for effective TC removal. Since TZQ can be prepared readily and the equipment requirements for photolysis are affordable, the process reported herein is likely to have wide appeal for wastewater treatment and in small-scale animal husbandry or aquaculture operators.

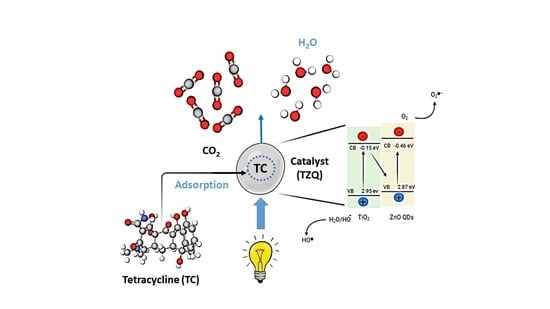
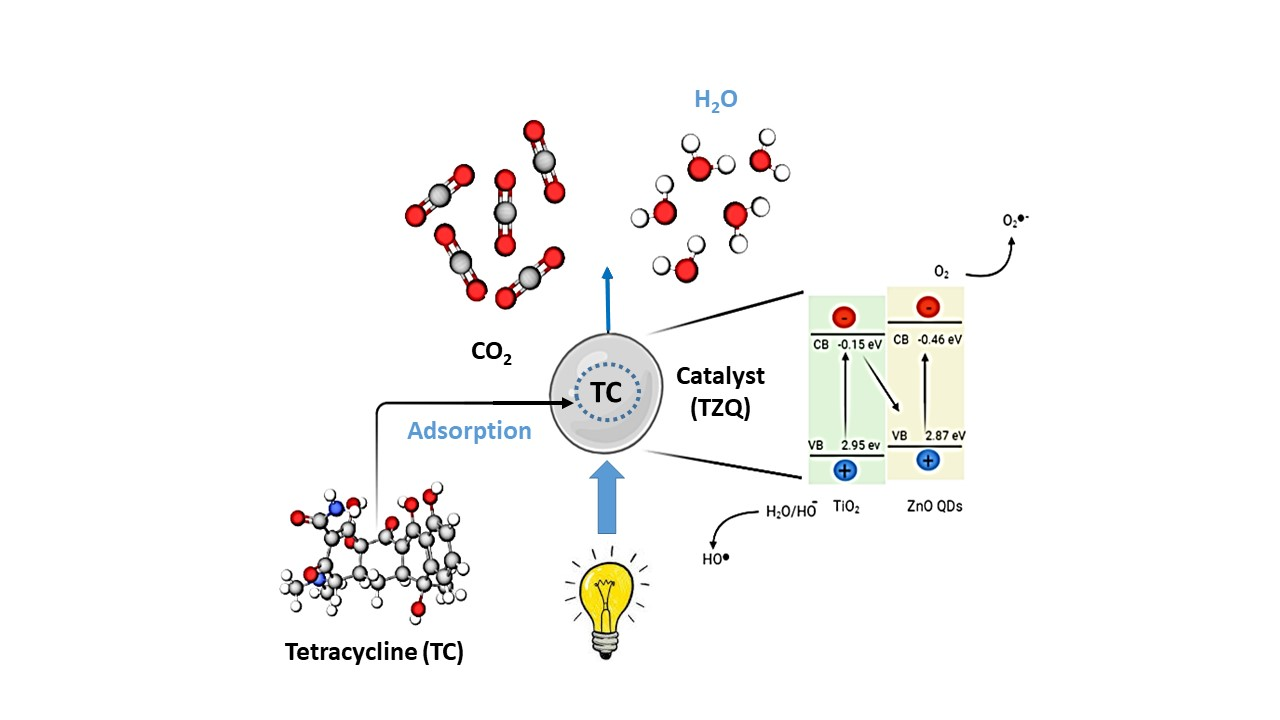
2.2.7. Photocatalytic Degradation Mechanism

In Table 2, the conduction band (CB) and valence band (VB) potential of meso-TiO2 is 2.95 eV and −0.15 eV, respectively. By comparison, the CB and VB potential of ZnO QDs is 2.87 eV and −0.46 eV, respectively. The electrons in the VB band of ZnO QDs and meso-TiO2 will be excited to their respective CB upon irradiation with the fluorescent light. The reduction potential of oxygen (E0(O2/O2●–) = −0.33 eV/NHE) is more negative than the CB potential of meso-TiO2; the system did not have sufficient reduction ability to generate O2●− species from dissolved O2. For the case of a conventional Type-II heterojunction, the VB band of meso-TiO2 should be able to produce OH radicals. Since the CB potential of ZnO QDs can generate O2●− species, a Z-scheme heterojunction is proposed. The potential of the photogenerated holes in the VB of meso-TiO2 was positive enough to oxidise OH to OH (E0 (OH/OH = +1.99 eV) and H2O to OH (E0 (H2O/OH = +2.34 eV). The photogenerated electrons in the CB of meso-TiO2 will migrate to the VB band of ZnO QDs to recombine with the photogenerated holes. Consideration of the Z-scheme model, the photogenerated electrons will remain accumulated in the VB of ZnO QDs, whereas the holes will remain in the CB of the meso-TiO2. Hence, they can be separated effectively. The generated O2●− and OH radicals can effectively degrade the TC into CO2 and H2O.

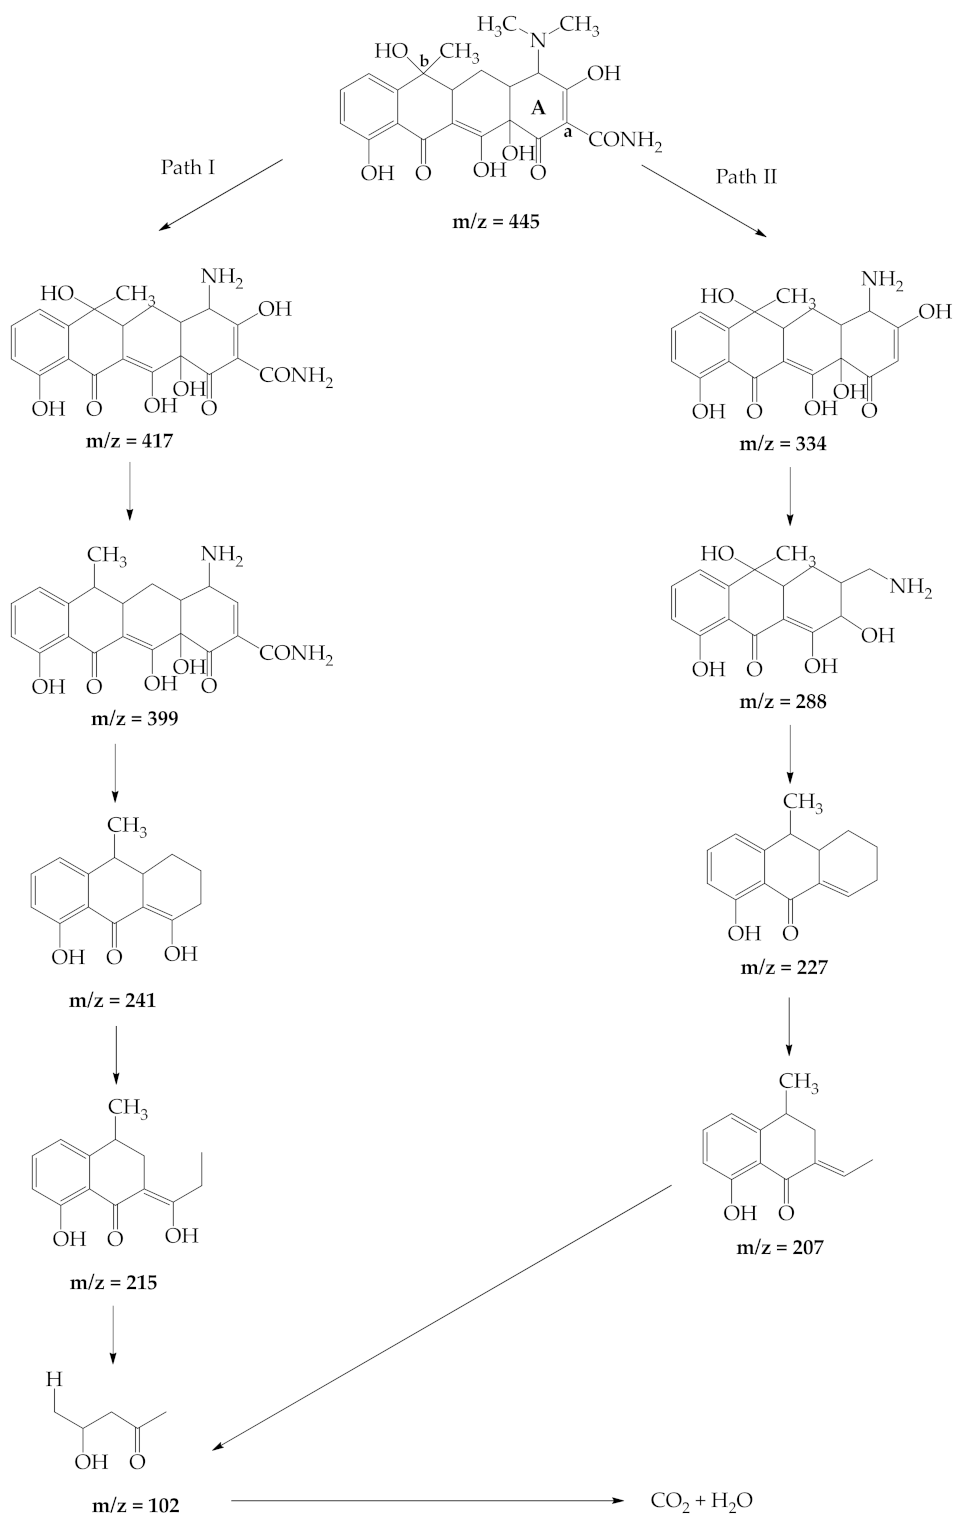
2.2.8. Identification of TC Photodegradation Intermediates

The MS profiles of the intermediates detected using LC-TOF/MS are shown in Figure S3 (cf. Supplementary Materials). The intermediates can be generated by loss of functional group(s), the ring-opening reactions, and the complete oxidation process toward harmless products [56,57]. In Figure 8, two possible pathways of TC photodegradation are shown, where the main reaction mechanisms include N-demethylation, hydroxylation, dehydration, deamination, and functional group destruction [58,59].
After 90 min of irradiation, the single peak m/z = 445 of the deprotonated TC diminished in the first pathway. The intermediate with m/z = 417 was formed from TC (m/z = 445) via demethylation reaction at carbon a (cf. Figure 8) [60]. Dehydration of product with m/z = 417 resulted in the formation of an intermediate with m/z = 399 [58,61]. The removal of the CO–NH2 group is followed by ring breakage from the compound with m/z = 399, gives intermediate with m/z = 241, which further undergoes dihydroxylation to give a compound with m/z = 215. Demethylation followed by ring cleavage of the compound with m/z = 215, which yields the compound with m/z = 102.
The second photodegradation pathway for TC involved dihydroxylation reaction at carbon b of TC molecule (cf. Figure 8), followed by the removal of CONH2 group gives rise to an intermediate with m/z = 344 [61]. Breakage of ring A on intermediate with m/z = 344 yields an intermediate with m/z = 288 (cf. Figure 8). Further cleavage of the intermediates led to the compound with m/z = 227. While the intermediate with m/z = 227 was transformed into product m/z = 202 via ring cleavage [56]. The electron-hole pair effect would result in the breakdown of the carbon rings and conversion of TC into CO2 and H2O [58].

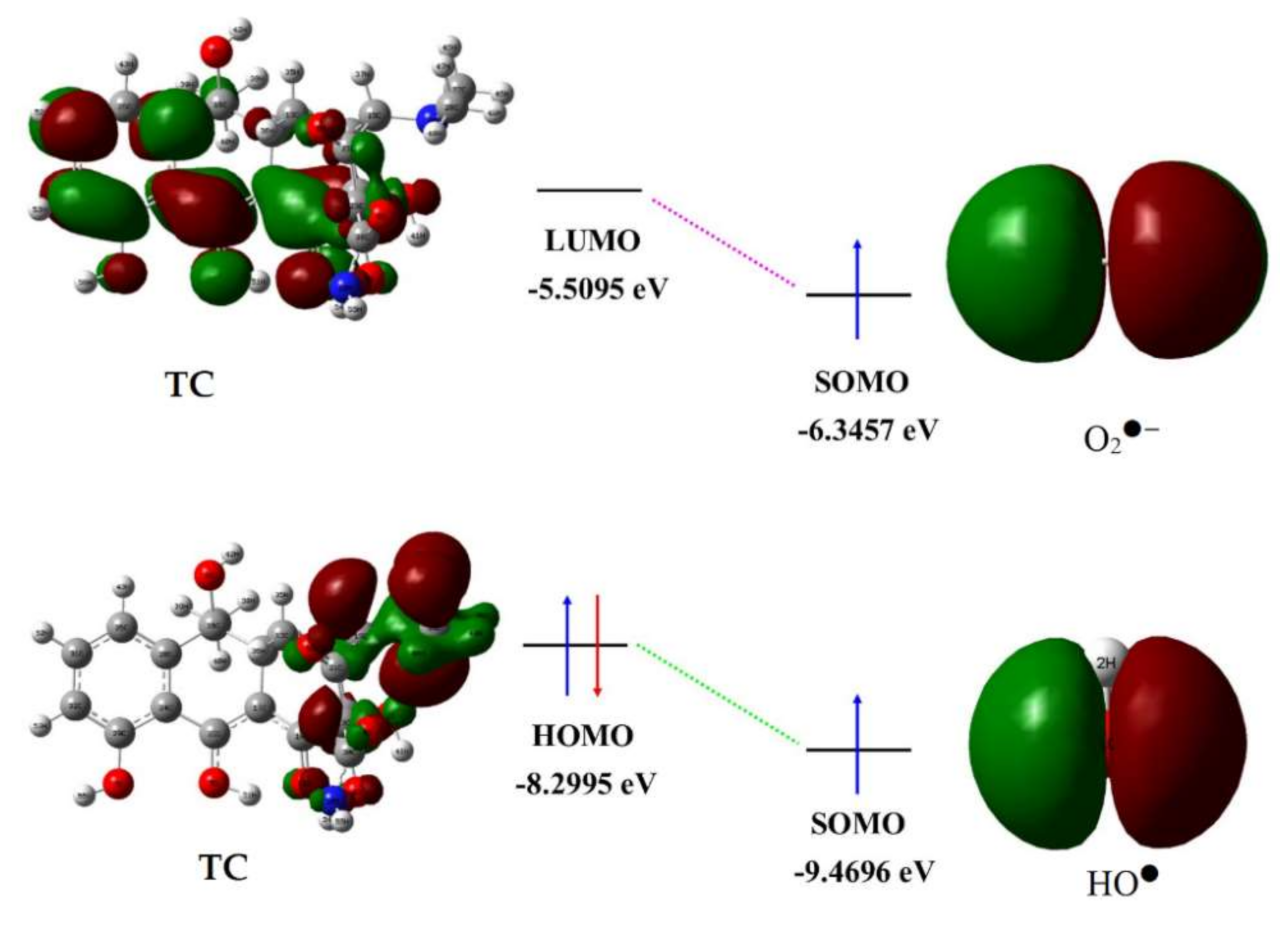
2.3. Theoretical Prediction of Tetracycline Degradation Using DFT Calculations

The Fukui function is a critical concept based on the delocalisation of Frontier Molecular Orbital (FMO), which has been widely used to determine the photocatalytic degradation reaction mechanism, in accordance with the reactivity of atomic species [62,63]. In this study, the Fukui function was calculated to predict the atoms that were attacked by the O2●− and HO. Therefore, the Fukui index (𝑓𝑘0) can provide an indication of a radical attack on the selected TC atoms. Table S1 and Figure S4 show the distribution of the Fukui index and four highest Fukui index values (𝑓𝑘0) in TC atoms, respectively. The Fukui index (𝑓𝑘0) in Table S1 revealed that C13, N5, C17, and C19 are the most reactive sites for the radical attack during degradation pathways 1 and 2. This finding is in-line with the LC-TOF/MS results. The TC (445 m/z) and the intermediate products for paths 1 and 2 were generated when the radicals attack N2 (445 m/z), C19 (417 and 344 m/z), and C17 (391 and 288 m/z). Although C13 was found to have the highest Fukui Index value, it is difficult to attack due to protection provided by the intramolecular hydrogen bond that occurs between the hydroxyl (O54H55) and carbonyl (C18O56) groups.
In addition to the Fukui function approach, the Wheland localisation approach was used to predict the interaction between radicals and TC. This approach is based on the localisation energy of Wheland intermediates [64]. Figure 9 represents the HOMO and LUMO energy levels of TC and the SOMO of O2●− and HO. The HOMO orbital of TC is primarily located on the amine, hydroxyl, and amide groups; whereas the LUMO is located on the aromatic group. Typically, the HOMO orbital, from which electrons can easily escape, is the preferred location for radical attacks [65]. However, in this study, the possible interactions appear to depend on whether the radicals attacking are superoxide or hydroxyl radicals. According to Figure 9, the photodegradation of TC can occur smoothly through two possible interactions: SOMO-HOMO (the HO attacks TC) and SOMO-LUMO (the O2●− HO attacks TC). In the SOMO-HOMO interaction, the HO (electron-poor free radical, −9.4696 eV) acts as an electrophile that interacts with the HOMO of TC (−8.2995 eV). By contrast, for the case of the SOMO-LUMO interaction, the SOMO of O2●− (electron-rich free radical, −6.3457 eV) acts as a nucleophile that interacts with the LUMO of TC (−5.5095 eV). Conversely, the interaction between the SOMO of the O2●− and HO and the HOMO and LUMO of TC, respectively, which could not be performed because the activation energy required for the electron transfer is too high.

3. Materials and Methods

3.1. Materials

Titanium(IV) tetra isopropoxide (TTIP, >98%), tetracycline (TC, >99%), and tetraethylorthosilicate (TEOS, 98%) were purchased from Acros Organics (Morris Plains, NJ, USA). Zinc acetate dihydrate (99.8%), and soluble starch from Fisher Scientific UK (Leicestershire, UK), ethanol (>99.7%), methanol, and potassium hydroxide (>95%) were purchased from QReC (Bangkok, Thailand). The chemicals and reagents used for the synthesis were of analytical grade and used without further purification.

3.2. Synthesis of ZnO QDs

The ZnO QDs synthesis method that was previously reported was adopted and modified Mahjoub et al. [24]. The concentration of zinc acetate solution, synthesis pH and catalyst storage used in this research differs from that of Mahjoub et al. A zinc acetate solution was prepared by dissolving 1.1 g of zinc acetate dihydrate in 100 mL of ethanol. Potassium hydroxide solution (1 M) was added dropwise to the zinc acetate solution to reduce the pH to 14. The resulting solution was stirred continuously using a magnetic stirrer for 45 min. TEOS (0.25 mL) was added to suppress the growth of ZnO QDs to larger ZnO particles, followed by 0.5 mL of distilled water to initiate the hydrolysis and condensation reactions of TEOS on the surface of the ZnO QDs to form Si–O–Si linkages. The mixture was centrifuged to separate the ZnO QDs from the mother liquor and rinsed thrice with methanol and distilled water to remove the unreacted precursors. The ZnO QDs precipitate was dried at 100 °C for 24 h.

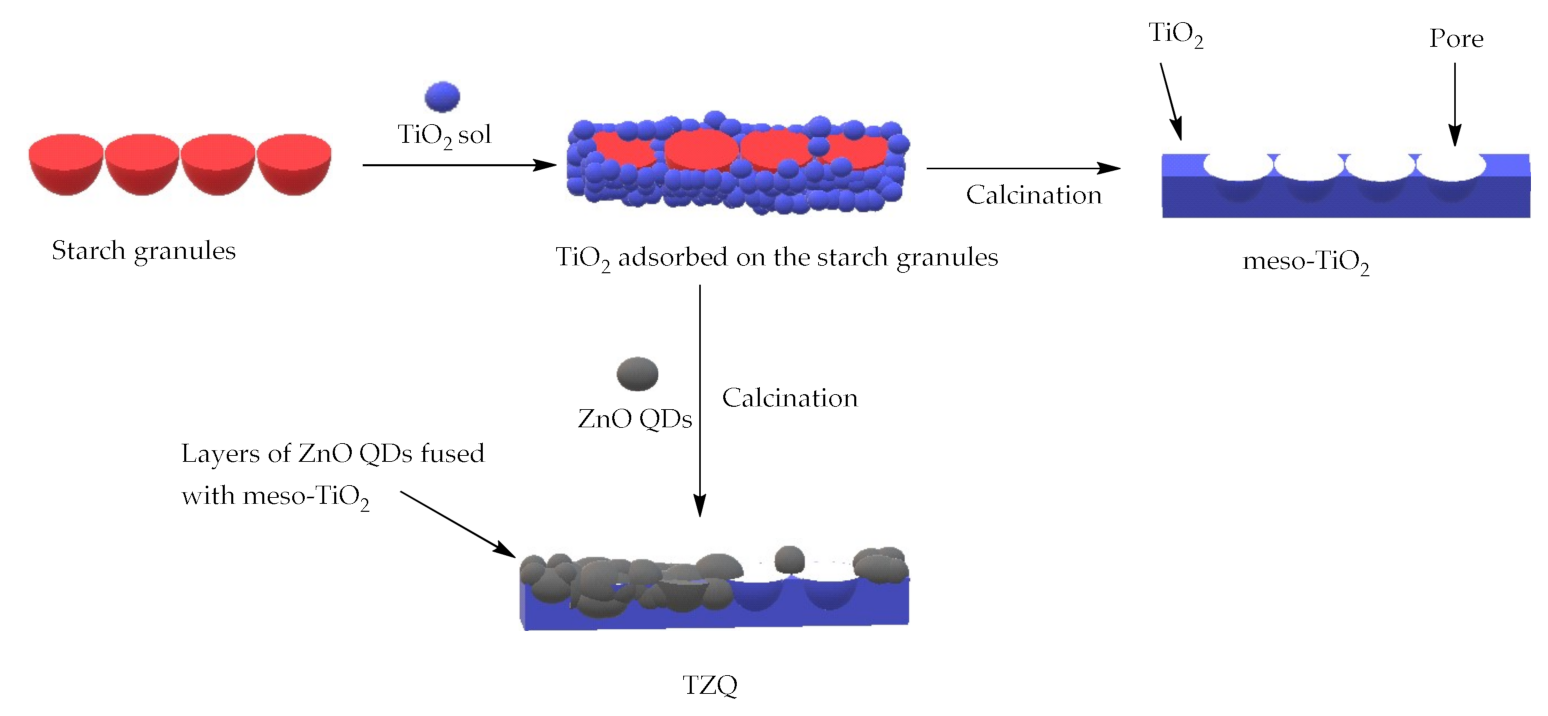
3.3. Synthesis of Mesoporous TiO2 Implanted ZnO QDs

The method reported by Muniandy et al. [66] was adapted and modified for the synthesis of the mesoporous TiO2 implanted ZnO QDs nanocomposite. Soluble starch (2 g) was dissolved in 200 mL of hot distilled water followed by the addition of 5.92 mL of TTIP. The mixture was stirred for 10 min at 65 °C. The ammonium hydroxide solution was used to increase the pH of the solution to pH 9 and stirred for 30 min. The ZnO QDs (351 mg) was added to the solution and stirred at 85 °C for an additional 1 h. The precipitate was washed thrice with methanol followed by distilled water to remove any unreacted precursors. The precipitate was dried at 100 °C for 24 h and calcined at 500 °C for 2 h. The final product was labelled as TZQ. The TZQ contains 8 wt.% of ZnO QDs corresponding to the mass fraction of ZnO QDs in the composite. The pristine mesoporous TiO2 was prepared similarly without the addition of ZnO QDs, and was denoted as meso-TiO2.

3.4. Characterisation

Powder X-ray diffraction (XRD) was employed for identification of crystalline phases and crystallite size. The (XRD) patterns were recorded on a BRUKER AXS D8 advanced X-ray diffractometer with Cu–Kα radiation (λ = 0.15478 nm). The 2θ range was set between 20° to 90°. The morphology of the photocatalyst was analysed by high-resolution transmission electron microscopy (HR-TEM, HR-TEM 200 kV with Field Emission, TECNAI G2 20 S-TWIN, and FEI) and field emission scanning electron microscope (FESEM, SEM Leica Cambridge 360). The nitrogen adsorption-desorption isotherms were recorded using an N2 adsorption analyser (Micromeritics ASAP 2020 Surface Adsorption Porosimeter). The specific surface area was calculated using the Brunauer-Emmett-Teller (BET) equation, and the Barret-Joyner-Halenda (BJH) pore size distribution was determined from the adsorption branch. The ultraviolet-visible diffuse reflectance spectra (UV-Vis DRS) were taken using Perkin Elmer Lambda 35 spectrometer, UV-visible spectrophotometer. Shimadzu XPS Axis Ultra DLD instrument was used in conducting surface composition analysis, and the results were further deconvoluted using OriginPro 8.5, OriginLab Corporation, Northampton, MA, USA. The photoluminescence (PL) spectra were measured at room temperature using PerkinElmer LS 55, fluorescence spectrophotometer at an excitation wavelength of 325 nm. The total organic carbon (TOC) was measured with Shimadzu 5000 TOC Analyzer equipped with an autosampler.

3.5. Photodegradation of Tetracycline (TC)

The photodegradation of TC was investigated by monitoring the degradation of TC in an aqueous solution using a custom-built reactor equipped with two fluorescent lights (24 W each), as shown schematically in Figure S5. The light intensity was determined to be 104.4 W/m2, whereas the residual UV leakage of the visible light was detected to be 0.40 W/m2. The measurement was carried out using a Dual-Input Data Logging Radiometer (Model PMA2100) equipped with visible, and UVA + UVB detectors. In each experiment, 250 mg of the photocatalyst was dispersed in 200 mL of TC solution (40 mg L−1). Before the light irradiation, the suspension was stirred in the dark for 30 min to reach the adsorption-desorption equilibrium. At every 15 min interval, an aliquot (10 mL) was collected and centrifuged at 4000 rpm for 5 min to separate any photocatalyst particles. Then, the UV-vis absorption spectrum of the solution was recorded using a UV-vis spectrophotometer (UV2600, Shimadzu). The degradation (%) of the TC was calculated using Equation (3):
R = 1 C t C 0
C0 represents the initial concentration before the visible light irradiation, C is the concentration at a time interval, and R is the degradation (%) of the TC. Past studies have suggested that the pseudo-first-order kinetics model accounts for the photodegradation of various organic compounds [24]. Generally, the rate of the heterogeneous catalytic reaction is described using the Langmuir-Hinshelwood (Equation (4)) kinetic model:
r =     d c d t =   k K C 1 + K C
where r represents the initial rate of photodegradation, C is the concentration of the TC, t is the irradiation time, k is the rate constant, and K is the absorption coefficient of the organic compound. For a solution of antibiotics with a low concentration K << 1, the L-H equation is simplified into pseudo-first-order kinetics as follows (Equations (5) and (6)):
d C d T = k C
ln ( C C 0 ) = k t   6 ln
where k is the reaction rate (min−1), t is the irradiation time, C0 and C are the initial and final concentrations of the antibiotic, respectively.

3.6. Analytical Method

Tetracycline intermediates were analysed using liquid chromatography/time-of-flight/mass spectrometer (LC/TOF/MS) reverse-phase Agilent Poroshell 120, (2.7 µm particle size, 4-µm id × 100 mm) by Waters Acquity UPLC System coupled with LCT Premier XE mass spectrometer system with a binary pump and an autosampler. The mobile phase consists of 0.1% formic acid in water (mobile phase A) and methanol (mobile phase B) following isocratic elution technique at a ratio of 35:65 at a flow rate of 0.2 µL min−1, injection volume 5 µL, and column temperature 27 °C for 15 min. The flow from the LC column was transferred to a mass spectrometer equipped with an ESI source. The positive polarity mode was used for the analysis of all samples. Instrument control, data acquisition, and evaluation were made with MassLynxTM software, Version 4.1, Waters Corporation, Milford, MA, USA.

3.7. Density Functional Theory (DFT) Calculations

DFT is becoming an effective theoretical method for the determination and validation of photodegradation products. The molecular structures of tetracycline (TC, ID: 10257122), superoxide (ID: 4514331), and hydroxyl (ID: 138477) radicals were obtained from the ChemSpider website (https://www.chemspider.com, accessed on 5 October 2021) and fully optimised using the DFT B3LYP 6-311 ++ (d,p) Gaussian 09 (Gaussion Inc., Wallingford, CT, USA) suite of programs due to their efficiencies. The B3LYP refers to a hybrid function that combines the gradient function with the Hartree-Fock local exchange function. The highest occupied molecular orbital (HOMO), the lowest unoccupied molecular orbital (LUMO), the singly occupied molecular orbital (SOMO), and Fukui function (𝑓𝑘0, 𝑓𝑘+, and 𝑓𝑘) were calculated to predict mechanistic insights into the photocatalytic degradation of TC due to the radical attack.

4. Conclusions

A mesoporous TiO2 photocatalyst was implanted with ZnO QDs (TZQ) via a sol-gel synthetic method. The TZQ photocatalyst was subsequently characterized by several complementary methods (XRD, electron microscopy, gas adsorption, XPS, and photoluminescence spectroscopy) to support the conceptual structure proposed in Scheme 1. TZQ was identified to be active in the photodegradation of tetracycline (TC) under low intensity UV-visible light irradiation, where 94.6% of TC (40 mg L−1) was photodegraded by using 250 mg L−1 of the photocatalyst at pH 9 within 90 min. The enhancement of the photocatalytic activity of TZQ is attributed to the quantum confinement effect of ZnO QDs and the presence of various types of defects. The Z-scheme heterojunction model further suppressed the recombination of photogenerated electron-hole pairs, which enabled the continuous generation of reactive oxygen species. The scavenging tests detected that O2●− and HO are the major reactive oxygen species responsible for the photodegradation process. Two different photodegradation pathways were proposed based on the LC-TOF/MS analysis, which were confirmed using the Fukui function and the Wheland localisation approaches.

Supplementary Materials

The following are available online at https://www.mdpi.com/article/10.3390/catal11101205/s1, Figure S1: UV-Vis absorbance spectra (a) and (b) the corresponding Tauc’s plot of (αhν)1/2 versus E (eV) of meso-TiO2, TZQ and ZnO QDs, Figure S2: N2 sorption isotherms and (inset: BJH pore size distribution) of (a) meso-TiO2 and (b) TZQ, Figure S3: (a) Mass spectra of TC (a) and its intermediates during photodegradation in the presence of TZQ (b–h), Figure S4: The chemical structure of TC and its distribution of Fukui index (𝑓𝑘0) for the radical attack, Figure S5: Schematic diagram of the photocatalytic degradation reaction system under fluorescent light irradiation, Table S1: Fukui index of TC atoms.

Author Contributions

Conceptualisation, A.I., U.S. and S.S. Methodology, A.I., U.S. and S.S. Validation, A.I., M.N.A., M.R., N.M.A. and S.S. Formal analysis, A.I., U.S., M.N.A., M.R., N.M.A. and S.S. Investigation, A.I., U.S., M.N.A., M.R., N.M.A., W.H.D. and S.S. Resources, A.I., U.S., M.N.A., M.R., N.M.A., W.H.D., S.S. and L.D.W. Data curation, A.I., U.S., M.N.A., M.R., N.M.A., W.H.D., S.S., and L.D.W. Writing—original draft preparation, A.I., U.S., M.N.A., S.S., M.R., N.M.A., W.H.D. and L.D.W. Writing—review and editing, A.I., U.S., M.N.A., S.S. and L.D.W. Visualization, A.I. and U.S. Supervision, A.I. and S.S. Project administration, A.I. Funding acquisition, A.I., L.D.W., M.R., N.M.A., W.H.D. and S.S. All authors have read and agreed to the published version of the manuscript.

Funding

This research was funded by the Ministry of Education Malaysia (Higher Education) through the Fundamental Research Grant Scheme (FRGS/1/2019/STG01/USM/02/7).

Data Availability Statement

Not applicable.

Acknowledgments

Usman Saidu acknowledges Sule Lamido University Kafin Hausa, Nigeria, for the Ph.D. sponsorship awarded to him through the Tertiary Education Trust Fund (TETFund).

Conflicts of Interest

The authors declare no conflict of interest. The funders had no role in the design of the study; in the collection, analyses, or interpretation of data; in the writing of the manuscript, or in the decision to publish the results.

References

  1. Pang, Y.L.; Lim, S.; Ong, H.C.; Chong, W.T. A critical review on the recent progress of synthesising techniques and fabrication of TiO2-based nanotubes photocatalysts. Appl. Catal. A Gen. 2014, 481, 127–142. [Google Scholar] [CrossRef]
  2. Ong, C.B.; Ng, L.Y.; Mohammad, A.W. A review of ZnO nanoparticles as solar photocatalysts: Synthesis, mechanisms and applications. Renew. Sustain. Energy Rev. 2018, 81, 536–551. [Google Scholar] [CrossRef]
  3. Aramendía, M.A.; Borau, V.; Colmenares, J.C.; Marinas, A.; Marinas, J.M.; Navío, J.A.; Urbano, F.J. Modification of the photocatalytic activity of Pd/TiO2 and Zn/TiO2 systems through different oxidative and reductive calcination treatments. Appl. Catal. B Environ. 2008, 80, 88–97. [Google Scholar] [CrossRef]
  4. Bachvarova-Nedelcheva, A.; Iordanova, R.; Kostov, K.L.; Gegova, R. Sol-gel powder synthesis in the TiO2-TeO2-ZnO system: Structural characterisation and properties. Arab. J. Chem. 2020, 13, 7132–7146. [Google Scholar] [CrossRef]
  5. Upadhyay, G.K.; Rajput, J.K.; Pathak, T.K.; Kumar, V.; Purohit, L.P. Synthesis of ZnO:TiO2 nanocomposites for photocatalyst application in visible light. Vacuum 2018, 160, 154–163. [Google Scholar] [CrossRef]
  6. D’Arienzo, M.; Scotti, R.; Di Credico, B.; Redaelli, M. Synthesis and Characterisation of Morphology-Controlled TiO2 Nanocrystals. Morphological, Compositional, and Shape Control of Materials for Catalysis. Stud. Surf. Sci. Catal. 2017, 177, 477–540. [Google Scholar]
  7. Ali, M.M.; Haque, J.; Kabir, M.H.; Kaiyum, M.A.; Rahman, M. Nano synthesis of ZnO–TiO2 composites by sol-gel method and evaluation of their antibacterial, optical and photocatalytic activities. Results Mater. 2021, 11, 100199. [Google Scholar] [CrossRef]
  8. Bai, N.; Liu, X.; Li, Z.; Ke, X.; Zhang, K.; Wu, Q. High-efficiency TiO2/ZnO nanocomposites photocatalysts by sol–gel and hydrothermal methods. J. Sol-Gel Sci. Technol. 2021, 99, 92–100. [Google Scholar] [CrossRef]
  9. Zalfani, M.; van der Schueren, B.; Mahdouani, M.; Bourguiga, R.; Yu, W.-B.; Wu, M.; Deparis, O.; Li, Y.; Su, B.-L. ZnO quantum dots decorated 3DOM TiO2 nanocomposites: Symbiose of quantum size effects and photonic structure for highly enhanced photocatalytic degradation of organic pollutants. Appl. Catal. B Environ. 2016, 199, 187–198. [Google Scholar] [CrossRef]
  10. Patra, M.; Manoth, M.; Singh, V.; Gowd, G.S.; Choudhry, V.; Vadera, S.R.; Kumar, N. Synthesis of stable dispersion of ZnO quantum dots in aqueous medium showing visible emission from bluish green to yellow. J. Lumin. 2009, 129, 320–324. [Google Scholar] [CrossRef]
  11. Huang, W.; Lv, X.; Tan, J.; Huang, Q.; Cheng, H.; Feng, J.; Li, L. Regulable preparation of the oxygen vacancy of ZnO QDs and their fluorescence performance. J. Mol. Struct. 2019, 1195, 653–658. [Google Scholar] [CrossRef]
  12. Zhang, N.; Liu, S.; Fu, X.; Xu, X.J. Synthesis of M@ TiO2 (M= Au, Pd, Pt) core–shell nanocomposites with tunable photo-reactivity. J. Phys. Chem. C 2011, 115, 9136–9145. [Google Scholar] [CrossRef]
  13. Pirzada, B.M.; Mir, N.A.; Qutub, N.; Mehraj, O.; Sabir, S.; Muneer, M. Synthesis, characterisation and optimisation of photocatalytic activity of TiO2/ZrO2 nanocomposite heterostructures. Mater. Sci. Eng. C 2015, 193, 137–145. [Google Scholar] [CrossRef]
  14. Iqbal, A.; Saidu, U.; Adam, F.; Sreekantan, S.; Yahaya, N.; Ahmad, M.; Ramalingam, R.; Wilson, L.D. Floating ZnO QDs-Modified TiO2/LLDPE Hybrid Polymer Film for the Effective Photodegradation of Tetracycline under Fluorescent Light Irradiation: Synthesis and Characterisation. Molecules 2021, 26, 2509. [Google Scholar] [CrossRef] [PubMed]
  15. Yuan, Z.Y.; Ren, T.Z.; Vantomme, A.; Su, B.L. Facile and generalised preparation of hierarchically mesoporous−macroporous binary metal oxide materials. Chem. Mater. 2004, 16, 5096–5106. [Google Scholar] [CrossRef]
  16. Sanchez, C.; Livage, J.; Henry, M.; Babonneau, F. Chemical modification of alkoxide precursors. J. Non-Cryst. Solids 1988, 100, 65–76. [Google Scholar] [CrossRef]
  17. Mahshid, S.; Askari, M.; Ghamsari, M.S. Synthesis of TiO2 nanoparticles by hydrolysis and peptisation of titanium iso-propoxide solution. J. Mater. Process. Technol. 2007, 189, 296–300. [Google Scholar] [CrossRef]
  18. Lin, M.; Jing, G.; Shen, H.; Yuan, C.S.; Huang, Z.; Wu, X.; Liu, C.W. Mechanism of enhancement of photodegradation of Hg0 by CeO2-TiO2: Effect of band structure on the formation of free radicals. Chem. Eng. J. 2020, 382, 122827. [Google Scholar] [CrossRef]
  19. Rai, P.; Jo, J.N.; Lee, I.H.; Yu, Y.T. Fabrication of flower-like ZnO microstructures from ZnO nanorods and their photo-luminescence properties. Mater. Chem. Phys. 2010, 124, 406–412. [Google Scholar] [CrossRef]
  20. Ahmad, R.; Tripathy, N.; Khan, M.Y.; Bhat, K.S.; Ahn, M.S.; Hahn, Y.B. Ammonium ion detection in solution using ver-tically grown ZnO nanorod based field-effect transistor. RSC Adv. 2016, 6, 54836–54840. [Google Scholar] [CrossRef]
  21. Zhang, R.; Zhong, Q.; Zhao, W.; Yu, L.; Qu, H. Promotional effect of fluorine on the selective catalytic reduction of NO with NH3 over CeO2-TiO2 catalyst at low temperature. Appl. Surf. Sci. 2014, 289, 237–244. [Google Scholar] [CrossRef]
  22. Xiao-Quan, C.; Huan-Bin, L.; Guo-Bang, G. Preparation of nanometer crystalline TiO2 with high photocatalytic activity by pyrolysis of titanyl organic compounds and photo-catalytic mechanism. Mater. Chem. Phys. 2005, 91, 317–324. [Google Scholar] [CrossRef]
  23. Rajeena, U.; Akbar, M.; Raveendran, P.; Ramakrishnan, R.M. Graphene reduction of P25 titania: Ti3+-doped titania/graphene nanohybrids for enhanced photocatalytic hydrogen production. Int. J. Hydrogen Energy 2020, 26, 9564–9574. [Google Scholar] [CrossRef]
  24. Mahjoub, M.A.; Monier, G.; Robert-Goumet, C.; Réveret, F.; Echabaane, M.; Chaudanson, D.; Petit, M.; Bideux, L.; Gruzza, B. Synthesis and Study of Stable and Size-Controlled ZnO–SiO2 Quantum Dots: Application as a Humidity Sensor. J. Phys. Chem. C 2016, 120, 11652–11662. [Google Scholar] [CrossRef]
  25. Xie, W.; Li, R.; Xu, Q. Enhanced photocatalytic activity of Se-doped TiO2 under visible light irradiation. Sci. Rep. 2018, 8, 1–10. [Google Scholar] [CrossRef] [PubMed]
  26. Mekasuwandumrong, O.; Chaitaworn, S.; Panpranot, J.; Praserthdam, P. Photocatalytic liquid-phase selective hydrogenation of 3-Nitrostyrene to 3-vinylaniline of various treated-TiO2 without use of reducing gas. Catalysts 2019, 9, 329. [Google Scholar] [CrossRef] [Green Version]
  27. Zhang, Y.; Dong, K.; Liu, Z.; Wang, H.; Ma, S.; Zhang, A.; Li, M.; Yu, L.; Li, Y. Sulfurized hematite for photo-Fenton catalysis. Prog. Nat. Sci. 2017, 27, 443–451. [Google Scholar] [CrossRef]
  28. He, Y.; Wang, Y.; Zhang, L.; Teng, B.; Fan, M. High-efficiency conversion of CO2 to fuel over ZnO/g-C3N4 photocatalyst. Appl. Catal. B 2015, 168, 1–8. [Google Scholar]
  29. Liu, G.; Sun, C.; Yang, H.G.; Smith, S.C.; Wang, L.; Lu, G.Q.(M.); Cheng, H.-M. Nanosized anatase TiO2 single crystals for enhanced photocatalytic activity. Chem. Commun. 2010, 46, 755–757. [Google Scholar] [CrossRef]
  30. Hassanien, A.; Akl, A.A. Effect of Se addition on optical and electrical properties of chalcogenide CdSSe thin films. Superlattices Microstruct. 2016, 89, 153–169. [Google Scholar] [CrossRef]
  31. Rocha, J.; Ananias, D.; Paz, F. Photoluminescent Zeolite-Type Lanthanide Silicates. In Comprehensive Inorganic Chemistry II; Elsevier BV: Amsterdam, The Netherlands, 2013; pp. 87–110. [Google Scholar]
  32. Reinosa, J.J.; Docio, C.M.Á.; Ramírez, V.Z.; Lozano, J.F.F. Hierarchical nano ZnO-micro TiO2 composites: High UV protection yield lowering photodegradation in sunscreens. Ceram. Int. 2018, 44, 2827–2834. [Google Scholar] [CrossRef]
  33. Suyana, P.; Ganguly, P.; Nair, B.N.; Mohamed, A.P.; Warrier, K.G.K.; Hareesh, U.S. Co3O4–C3N4 p–n nano-heterojunctions for the simultaneous degradation of a mixture of pollutants under solar irradiation. Environ. Sci. Nano 2017, 4, 212–221. [Google Scholar] [CrossRef]
  34. Zheng, Z.; Xie, W.; Lim, Z.S.; You, L.; Wang, J. CdS sensitised 3D hierarchical TiO2/ZnO heterostructure for efficient solar energy conversion. Sci. Rep 2014, 4, 1–6. [Google Scholar]
  35. Imam, S.S.; Adnan, R.; Kaus, N.H.M. Influence of yttrium doping on the photocatalytic activity of bismuth oxybromide for ciprofloxacin degradation using indoor fluorescent light illumination. Res. Chem. Intermed. 2018, 44, 5357–5376. [Google Scholar] [CrossRef]
  36. Thommes, M.; Kaneko, K.; Neimark, A.V.; Olivier, J.P.; Rodriguez-Reinoso, F.; Rouquerol, J.; Sing, K.S.W. Physisorption of gases, with special reference to the evaluation of surface area and pore size distribution (IUPAC Technical Report). Pure Appl. Chem. 2015, 87, 1051–1069. [Google Scholar] [CrossRef] [Green Version]
  37. Paul, K.K.; Giri, P.K. Role of surface plasmons and hot electrons on the multi-Step photocatalytic decay by detect enriched Ag@TiO2 nanorods under visible light. J. Phys. Chem. C 2017, 121, 20016–20030. [Google Scholar] [CrossRef]
  38. Khan, H.; Swati, I.K. Fe3+-doped anatase TiO2 with d–d transition, oxygen vacancies and Ti3+ centers: Synthesis, characterisation, uv–vis photocatalytic and mechanistic studies. Ind. Eng. Chem. Res. 2016, 55, 6619–6633. [Google Scholar] [CrossRef]
  39. Santara, B.; Giri, P.K.; Imakita, K.; Fujii, M. Evidence of oxygen vacancy induced room temperature ferromagnetism in solvothermally synthesised undoped TiO2 nanoribbons. Nanoscale 2013, 12, 5476–5488. [Google Scholar] [CrossRef]
  40. Ghorai, A.; Bayan, S.; Gogurla, N.; Midya, A.; Ray, S.K. Highly Luminescent WS2 Quantum Dots/ZnO Heterojunctions for Light Emitting Devices. ACS Appl. Mater. Interfaces 2017, 9, 558–565. [Google Scholar] [CrossRef] [PubMed]
  41. Vanheusden, K.; Warren, W.L.; Seager, C.H.; Tallant, D.R.; Voigt, J.A.; Gnade, B.E. Mechanisms behind green photo-luminescence in ZnO phosphor powders. J. Appl. Phys. 1996, 79, 7983–7990. [Google Scholar] [CrossRef]
  42. Vempati, S.; Mitra, J.; Dawson, P. One-step synthesis of ZnO nanosheets: A blue-white fluorophore. Nanoscale Res. Lett. 2012, 7, 470. [Google Scholar] [CrossRef] [Green Version]
  43. Ahn, C.H.; Kim, Y.Y.; Kim, D.C.; Mohanta, S.K.; Cho, H.K. A comparative analysis of deep level emission in ZnO layers deposited by various methods. J. Appl Phys. 2009, 105, 1–6. [Google Scholar] [CrossRef]
  44. Cao, B.; Cai, W.; Zeng, H. Temperature-dependent shifts of three emission bands for ZnO nanoneedle arrays. Appl. Phys. Lett. 2006, 88, 161101. [Google Scholar] [CrossRef]
  45. Nasseh, N.; Panahi, A.H.; Esmati, M.; Daglioglu, N.; Asadi, A.; Rajati, H.; Khodadoost, F. Enhanced photocatalytic degradation of tetracycline from aqueous solution by a novel magnetically separable FeNi3/SiO2/ZnO nanocomposite under simulated sunlight: Efficiency, stability, and kinetic studies. J. Mol. Liq. 2020, 301, 112434. [Google Scholar] [CrossRef]
  46. Zhang, H.; Wu, W.; Li, Y.; Wang, Y.; Zhang, C.; Zhang, W.; Wang, L.; Niu, L. Enhanced photocatalytic degradation of ciprofloxacin using novel C-dot@Nitrogen deficient g-C3N4: Synergistic effect of nitrogen defects and C-dots. Appl. Surf. Sci. 2019, 465, 450–458. [Google Scholar] [CrossRef]
  47. Nasseh, N.; Taghavi, L.; Barikbin, B.; Nasseri, M.A. Synthesis and characterisations of a novel FeNi3/SiO2/CuS magnetic nanocomposite for photocatalytic degradation of tetracycline in simulated wastewater. J. Clean. Prod. 2018, 179, 42–54. [Google Scholar] [CrossRef]
  48. Xue, Z.; Wang, T.; Chen, B.; Malkoske, T.; Yu, S.; Tang, Y. Degradation of Tetracycline with BiFeO3 Prepared by a Simple Hydrothermal Method. Materials 2015, 8, 6360–6378. [Google Scholar] [CrossRef] [PubMed]
  49. Safari, G.; Hoseini, M.; Seyedsalehi, M.; Kamani, H.; Jaafari, J.; Mahvi, A.H. Photocatalytic degradation of tetracycline using nanosized titanium dioxide in aqueous solution. Int. J. Environ. Sci. Technol. 2014, 12, 603–616. [Google Scholar] [CrossRef] [Green Version]
  50. Wu, S.; Hu, H.; Lin, Y.; Zhang, J.; Hu, Y.H. Visible light photocatalytic degradation of tetracycline over TiO2. Chem. Eng. J. 2020, 382, 122842. [Google Scholar] [CrossRef]
  51. Hou, C.; Xie, J.; Yang, H.; Chen, S.; Liu, H. Preparation of Cu2O@TiOF2/TiO2 and its photocatalytic degradation of tetra-cycline hydrochloride wastewater. RSC Adv. 2019, 9, 37911–37918. [Google Scholar] [CrossRef] [Green Version]
  52. Ma, S.; Gu, J.; Han, Y.; Gao, Y.; Zong, Y.; Ye, Z.; Xue, J. Facile Fabrication of C–TiO2 Nanocomposites with Enhanced Photocatalytic Activity for Degradation of Tetracycline. ACS Omega 2019, 4, 21063–21071. [Google Scholar] [CrossRef] [PubMed] [Green Version]
  53. Semeraro, P.; Bettini, S.; Sawalha, S.; Pal, S.; Licciulli, A.; Marzo, F.; Lovergine, N.; Valli, L.; Giancane, G. Photocatalytic Degradation of Tetracycline by ZnO/γ-Fe2O3 Paramagnetic Nanocomposite Material. Nanomaterials 2020, 10, 1458. [Google Scholar] [CrossRef]
  54. Kumar, K.V.A.; Lakshminarayana, B.; Suryakala, D.; Subrahmanyam, C. Reduced graphene oxide supported ZnO quantum dots for visible light-induced simultaneous removal of tetracycline and hexavalent chromium. RSC Adv. 2020, 10, 20494–20503. [Google Scholar] [CrossRef]
  55. Mohamed, R.; Ismail, A.A.; Kadi, M.W.; Alresheedi, A.S.; Mkhalid, I.A. Facile Synthesis of Mesoporous Ag2O−ZnO Hetero-junctions for Efficient Promotion of Visible Light Photodegradation of Tetracycline. ACS Omega 2020, 5, 33269–33279. [Google Scholar] [CrossRef] [PubMed]
  56. Cao, M.; Wang, P.; Ao, Y.; Wang, C.; Hou, J.; Qian, J. Visible light activated photocatalytic degradation of tetracycline by a magnetically separable composite photocatalyst: Graphene oxide/magnetite/cerium-doped titania. J. Colloid Interface Sci. 2016, 467, 129–139. [Google Scholar] [CrossRef] [Green Version]
  57. Thi, V.H.T.; Lee, B.-K. Great improvement on tetracycline removal using ZnO rod-activated carbon fiber composite prepared with a facile microwave method. J. Hazard. Mater. 2017, 324, 329–339. [Google Scholar] [CrossRef]
  58. Zhu, Y.; Liu, K.; Muhammad, Y.; Zhang, H.; Tong, Z.; Yu, B.; Sahibzada, M. Effects of divalent copper on tetracycline degradation and the proposed transformation pathway. Environ. Sci. Pollut. Res. 2019, 27, 5155–5167. [Google Scholar] [CrossRef]
  59. Olivera, S.; Hu, C.; Nagananda, G.S.; Reddy, N.; Venkatesh, K.; Muralidhara, H.B.; Asiri, A.M. The adsorptive removal of Cr(VI) ions and antibacterial activity studies on hydrothermally synthesised iron oxide and zinc oxide nanocomposite. J Taiwan Inst. Chem. Eng. 2018, 93, 342–349. [Google Scholar] [CrossRef]
  60. Xiong, H.; Zou, D.; Zhou, D.; Dong, S.; Wang, J.; Rittmann, B.E. Enhancing degradation and mineralisation of tetracycline using intimately coupled photocatalysis and biodegradation (ICPB). Chem. Eng. J. 2017, 316, 7–14. [Google Scholar] [CrossRef]
  61. Ji, Y.; Shi, Y.; Dong, W.; Wen, X.; Jiang, M.; Lu, J. Thermo-activated persulfate oxidation system for tetracycline antibiotics degradation in aqueous solution. Chem. Eng. J. 2016, 298, 225–233. [Google Scholar] [CrossRef] [Green Version]
  62. Fan, G.; Ning, R.; Yan, Z.; Luo, J.; Du, B.; Zhan, J.; Liu, L.; Zhang, J. Double photoelectron-transfer mechanism in Ag−AgCl/WO3/g-C3N4 photocatalyst with enhanced visible-light photocatalytic activity for trimethoprim degradation. J. Hazard. Mater. 2021, 403, 123964. [Google Scholar] [CrossRef] [PubMed]
  63. Bekbolet, M.; Çınar, Z.; Kılıç, M.; Uyguner, C.S.; Minero, C.; Pelizzetti, E. Photocatalytic oxidation of dinitronaphthalenes: Theory and experiment. Chemosphere 2009, 75, 1008–1014. [Google Scholar] [CrossRef] [PubMed]
  64. Wahab, H.S.; Koutselos, A.D. A computational study on the adsorption and OH initiated photochemical and photo-catalytic primary oxidation of aniline. Chem. Phys. 2009, 358, 171–176. [Google Scholar] [CrossRef]
  65. Zhang, Z.; Zhao, Y.; Shen, J.; Pan, Z.; Guo, Y.; Wong, P.K.; Yu, H. Synthesis of 1D BiI2O17ClxBr2-x nanotube solid solu-tions with rich oxygen vacancies for highly efficient removal of organic pollutants under visible light. Appl. Catal. B 2009, 269, 1–16. [Google Scholar] [CrossRef]
  66. Muniandy, S.S.; Kaus, N.H.M.; Jiang, Z.T.; Altarawneh, M.; Lee, H.L. Green synthesis of mesoporous anatase TiO2 nanoparticles and their photocatalytic activities. RSC Adv. 2017, 7, 48083–48094. [Google Scholar] [CrossRef] [Green Version]
Figure 1. The XRD profiles of ZnO QDs, meso-TiO2 and TZQ.
Catalysts 11 01205 g001
Figure 2. The FESEM images of (a) meso-TiO2 and (b) TZQ.
Catalysts 11 01205 g002
Scheme 1. An illustrative view of the formation of cavities and the deposition of ZnO QDs on the surface and within the cavities of meso-TiO2.
Catalysts 11 01205 sch001
Figure 3. The TEM and HR-TEM images of meso-TiO2 (a,b), ZnO QDs (c,d) and TZQ (e,f). Panels (c,d) were reprinted with per-mission from [14].
Catalysts 11 01205 g003
Figure 4. The (a) XPS survey spectra of TZQ photocatalysts and the narrow scan spectra of (b) Ti2p, (c) O 1s and (d) Zn 2p of TZQ.
Catalysts 11 01205 g004
Figure 5. The PL spectra of meso-TiO2 and TZQ (a), and the deconvoluted PL spectra meso-TiO2 (b) and TZQ (c).
Catalysts 11 01205 g005
Figure 6. (a) Photocatalytic degradation of TC in absence (blank) and in the presence of the photocatalysts ([TC] = 40 ppm; catalyst = 250 mg L−1; pH 9), (b) the effect of the solution pH ([TC] = 40 ppm; catalyst = 250 mg L−1), (c) the effect of TC initial concentration (catalyst = 250 mg L−1; pH 9) and (d) the effect of the amount of catalyst dosage ([TC] = 40 ppm; pH 9).
Catalysts 11 01205 g006
Figure 7. (a) The effect of scavengers on the photocatalytic degradation of TC over TZQ, (b) Recycling efficiency for the as prepared composite catalyst (TC = 40 mg L−1; pH 9; scavenger = 5 mM; catalyst dosage = 250 mg L−1; irradiation time = 90 min), (c) TOC removal by P25 and TZQ and (d) electron–hole pairs separation and the possible reaction mechanism for the photodegradation of TC over TZQ.
Catalysts 11 01205 g007
Figure 8. The proposed possible pathways of photodegradation of TC in the presence of TZQ.
Catalysts 11 01205 g008
Figure 9. The Frontier Molecular Orbital (FMO) of the TC, O2 and HO.
Catalysts 11 01205 g009
Table 1. The composition (wt.%) of elements in photocatalysts detected by XPS and analysis.
SamplesXPS (wt.%)
C 1sO 1sSi 2pK 2pTi 2pZn 2p3
meso-TiO23.1742.80--54.02-
TZQ1.3341.502.713.6945.655.12
Table 2. The VB and CB potentials of the ZnO QDs, m-TiO2, and TZQ.
SamplesEg (eV)VB Edge (eV)CB Edge (eV)
ZnO QDs3.502.87−0.46
meso-TiO23.102.95−0.15
TZQ 3.333.07−0.26
Table 3. Physicochemical properties of meso-TiO2 and TZQ.
CatalystBET Surface Area
(m2g−1)
Pore Size
(Å)
Pore Volume
(cm3g−1)
meso-TiO244.074.90.165
TZQ89.334.40.182
Table 4. The pseudo-first-order rate constant (k) and regression coefficient (R2) for the degradation of TC with different photocatalyst systems.
Catalyst
System
Degradation
(%)
k
(min−1)
R2
P2519.93.21 × 10−30.967
meso-TiO235.06.91 × 10−30.994
ZnO QDs61.811.24 × 10−30.993
TZQ 82.220.52 × 10−30.999
Table 5. Comparison of ZnO and TiO2 based photocatalysts reported in the literature.
PhotocatalystDosage (g L−1)[TC]
(mg L−1)
Light SourceResultsRef.
N doped TiO20.210300 W xenon lamp visible light (420 nm)87.0% removal after 120 min, 46.8% mineralization[50]
Cu2O@TiOF2/TiO20.310500 W Xe lamp96.83% removal after 180 min[51]
C doped TiO20.210visible light90.8% removal after 160 min[52]
ZnO/γ–Fe2O30.0530stimulated solar light using a Solar S class A halogen lamp (100 mW cm−2 light intensity)88.52% removal after 150 min[53]
ZnO QDs/reduced graphene oxide0.052024 V, 250 W halogen lamps68% removal after 120 min, 70% mineralization.[54]
Ag2O/ZnO1.820300 W Xenon lamp with air as oxygen source100% after 120 min.[55]
TZQ0.254048 W compact fluorescent lamp 94.6% after 90 min of irradiation, 79% TOC removal.Present study
Publisher’s Note: MDPI stays neutral with regard to jurisdictional claims in published maps and institutional affiliations.

