Article

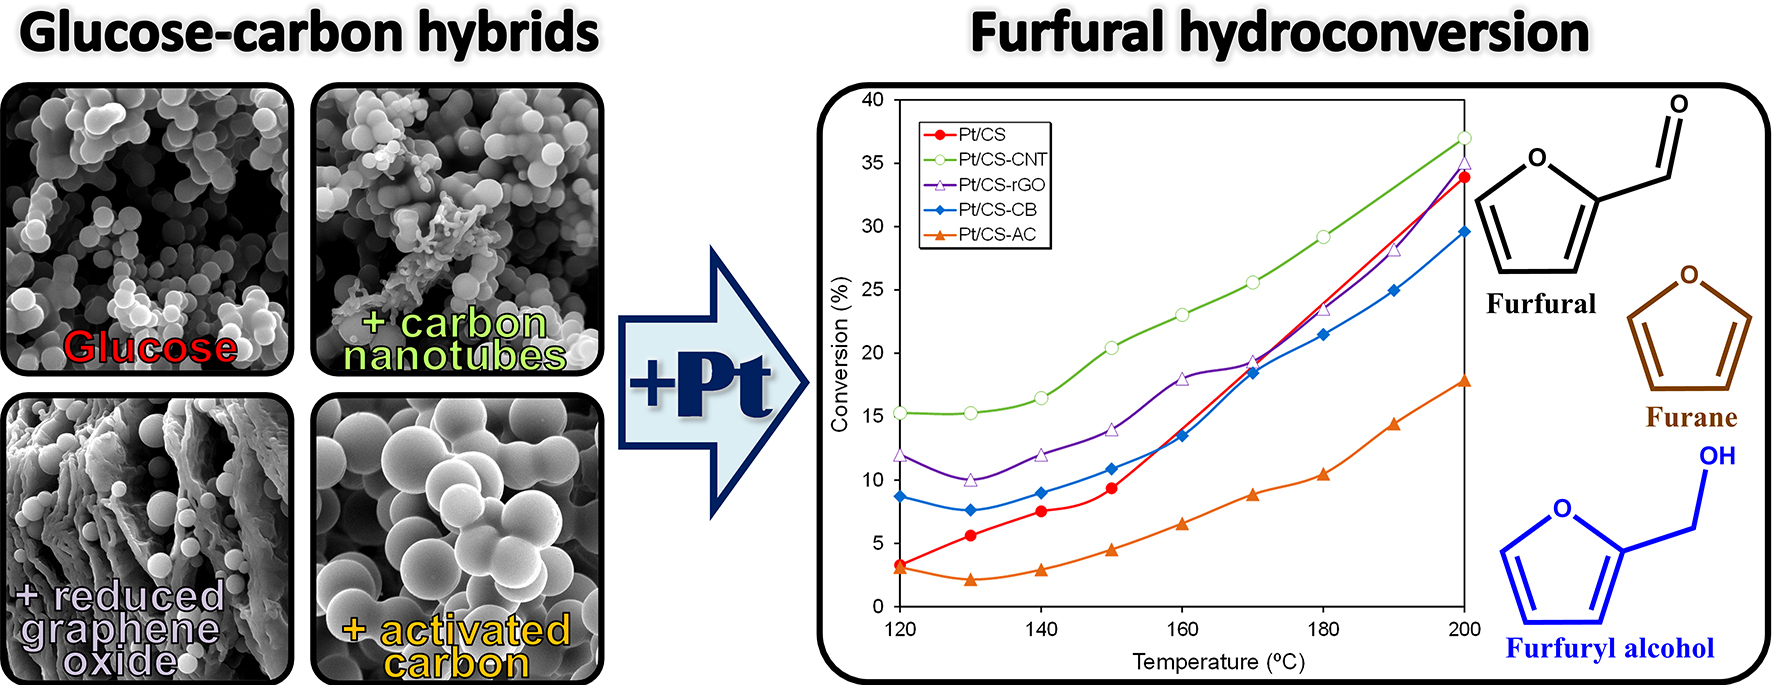
Glucose–Carbon Hybrids as Pt Catalyst Supports for the Continuous Furfural Hydroconversion in Gas Phase

by
Sergio Morales-Torres
*,
Luisa M. Pastrana-Martínez
,
Juan A. Pérez-García
and
Francisco J. Maldonado-Hódar
Department of Inorganic Chemistry, Faculty of Sciences, University of Granada, Avda. Fuente Nueva s/n, ES-18071 Granada, Spain
*
Author to whom correspondence should be addressed.
Catalysts 2021, 11(1), 49; https://doi.org/10.3390/catal11010049
Submission received: 25 November 2020 / Revised: 11 December 2020 / Accepted: 18 December 2020 / Published: 1 January 2021
(This article belongs to the Special Issue Green Chemistry and Environmental Processes)

Abstract

:
Glucose–carbon hybrids were synthetized with different carbon materials, namely carbon nanotubes, reduced graphene oxide, carbon black and activated carbon by a hydrothermal treatment. These carbon hybrids were used as Pt-supports (1 wt.%) for the furfural (FUR) hydroconversion in the gas phase at mild operating conditions (i.e., P = 1 atm and T = 200 °C). The physicochemical properties (porosity, surface chemistry, Pt-dispersion, etc.) were analyzed by different techniques. Glucose–carbon hybrids presented apparent surface areas between 470–500 m2 g−1, a neutral character and a good distribution of small Pt-nanoparticles, some large ones with octahedral geometry being also formed. Catalytic results showed two main reaction pathways: (i) FUR hydrogenation to furfuryl alcohol (FOL), and (ii) decarbonylation to furane (FU). The products distribution depended on the reaction temperature, FOL or FU being mainly produced at low (120–140 °C) or high temperatures (170–200 °C), respectively. At intermediate temperatures, tetrahydrofurfuryl alcohol was formed by secondary FOL hydrogenation. FUR hydroconversion is a structure-sensitive reaction, rounded-shape Pt-nanoparticles producing FU, while large octahedral Pt-particles favor the formation of FOL. Pt-catalysts supported on glucose–carbon hybrids presented a better catalytic performance at low temperature than the catalyst prepared on reference material, no catalyst deactivation being identified after several hours on stream.

Graphical Abstract

1. Introduction

Alternative feedstocks for chemical/pharmaceutical industries are progressively demanded to attend the increasing employ of chemicals and fuels properly, as well to simultaneously reduce the dependence of fossil fuels, i.e., coal and petroleum. Abundant biomass is well-accepted as a sustainable alternative [1,2] for the transformation of polymeric lignocellulosic materials (composed of cellulose, hemicellulose and lignin) into simpler molecules, which are suitable as raw materials in synthetic processes of valuable products. Furfural (FUR; C5H4O2) is commonly obtained by fast pyrolysis of biomass or acid-catalyzed hydrolysis of hemicellulose [3,4], and has been classified as one of the most promising chemical platforms connecting biomass and value-added chemicals [5]. FUR is a highly reactive molecule because of its two functionalities: the aldehyde group (C=O) and the conjugated aromatic ring (furan ring). Most of the FUR produced is transformed into furfuryl alcohol (FOL) by hydrogenation of the C=O group, although a vast list of valuable products may be also obtained directly or indirectly from FUR [6,7] by different processes, including tetrahydrofurfuryl alcohol (THFOL), 2-methylfuran (2-MFU), furan (FU) or tetrahydrofuran (THF), among others. All of these chemicals have a high economic and environmental impact for the production of green fuels, additives, lubricants, polymers (e.g., polyester, polyurethane, polyamides), flavors, drugs, solvents and so on.
The FUR transformation to value-added chemicals can be achieved in both liquid or gas phases using a large variety of catalysts, including combinations of active metal phases, supports and dopants, as well as several experimental conditions, which in turn determines the product yield and distribution. The catalytic hydrogenation of FUR to FOL has been traditionally studied using copper chromite catalysts [8], with a good FOL yield being achieved. The two main drawbacks of this system are: (i) the high pressures (70–100 bar) required, and (ii) the toxicity related to chromium species. The high selectivity of Cu-catalysts is based on the fact that the FUR adsorption on the Cu-surface is preferentially produced through the carbonyl group (configuration η1(O)), thus favoring the conversion to FOL and the repulsion of the aromatic ring [9]. In contrast, the decarbonylation of FUR to FU is industrially achieved using Pd catalysts [10]; however, deactivation may occur due to the sintering and coke deposition [7]. In this case, decarbonylation is favored because FUR is adsorbed on the Pd-surface with configuration η2(C,O) [7]. Sitthisa et al. pointed out that Ni-based catalysts lead to the formation of linear compounds (e.g., butane, butanal and butanol, among others) from furanic ring-opening reactions [11]. In other studies, the use of promoters as alkali and alkali-earth metals [12], or bimetallic catalysts [13], have been used to improve the selectivity to FOL or FU, respectively. An et al. [14] studied the influence of Pt-particle size into mesoporous oxides during the FUR hydrogenation, small Pt-particles favoring the decarbonylation, while Pt-particles larger than 7.1 nm yielded FOL as the main product.
Biomass has been traditionally used as raw material for the production of porous carbon materials for different applications; namely, adsorbents, molecular sieves, catalysts or catalysts supports [15,16,17,18]. Compared to other typical supports, such as silica or alumina, carbon materials are good candidates for developing FUR hydrogenation catalysts. In this way, Nguyen-Huy et al. studied Pd-catalysts on different supports and concluded that the material containing a carbon support (i.e., Pd/C) showed the highest conversion and selectivity to THFOL, while Pd-catalysts containing silica or alumina (i.e., Pd/SiO2 or Pd/Al2O3, respectively) rendered only the hydrogenation of the carbonyl group, i.e., to FOL [19]. On the other hand, the catalytic performance of metals supported on carbon materials is also directly related with the carbon microstructure [20]. Thus, Pd-catalysts on carbon blacks (Pd/CB) demonstrated a high selectivity to FOL (99%) for the hydrogenation of FUR in the liquid phase, while those supported on carbon nanotubes (Pd/CNT) yielded THFOL at more severe experimental conditions [20]. Recently Stucchi et al. [21] reported the use of an activated carbon (AC) obtained from birch sawdust to develop bimetallic Pt-Mo/AC catalysts with a 10–40% of Mo and 1% of Pt for the hydrogenation of FUR (at 150 °C and 3 bar of H2) using ethanol as solvent. The results showed that the catalytic performance of the bimetallic Pt-Mo/AC catalysts was higher than that obtained of the corresponding monometallic catalysts (Pt/AC and Mo/AC). The presence of Mo increased the Pt-dispersion and distribution, improving the hydrogen spillover, and FUR converted into furfuryl ethyl ether (FEE) with 99% selectivity by reaction of FUR with the solvent [21]. Taylor et al. [22] studied Pt-Cu bimetallic catalysts for the hydrogenation of FUR in liquid-phase, obtaining promising results compared to monometallic Pt catalysts. Kosydar et al. [23] developed Pd/C catalysts for hydrogenation of FUR using nanostructured carbon supports prepared by hard-templating from SBA-15 or nanostructured SiO2, as templates, and furfuryl alcohol or sucrose, as carbon sources. Pure and mesoporous carbon materials obtained after removing the silica subtracts by fluorhydric acid treatment, were oxidized with H2O2 or HNO3 to incorporate oxygenated surface groups (OSG). Hydrogenation of FUR was carried out into 2-propanol at 35 °C and 6 bar H2, FOL and THFOL being obtained as main products [23]. The oxidation of the carbon supports decreased the activity of Pd-nanoparticles and modified the product distribution, favoring the hydrogenation of the aromatic ring and avoiding other secondary reactions. Similar results were also reported by other authors using different types of oxidized carbon supports [24,25], the presence of OSG into Pt/Pd catalysts leading to a decrease of their activity and a higher selectivity to THFOL. The surface chemistry of carbon materials can be modified by inducing different types of surface groups. For instance, nitrogen-containing functionalities are more electronegative than C-atoms, modifying the electronic structure with enhanced π-binding abilities and increased basicity [26]. N-doping of carbon support promotes the catalytic performance of Pd/C catalysts towards FUR hydrogenation, because of the electronic activation of Pd-nanoparticles [27]. For the case of Ni/C catalysts, the optimization of carbon supports by N-doping with melamine allowed to convert selectively FUR to THFOL in propanol solutions, due to the synergistic effect between active metal phases and suitable N-functionalities [28]. Recently, the mechanism of direct decarbonylation of FUR to FU over Pt-graphene has been investigated by density functional theory (DFT), the rate determining step being the FU formation step on the Pt site of graphene structure [29].
An interesting and environmental-friendly approach to obtain carbon materials is by hydrothermal carbonization (HTC) of monosaccharides solutions [30]. This procedure allows obtaining nanostructured carbons with spherical shapes at low temperatures and without additional chemicals, scaffold materials or surfactants, although an activation process can be required to enhance the material porosity. Moreover, the surface chemistry of carbon spheres can also be tailored by introducing different species during the one-pot HTC synthesis. Thus, carbon spheres from glucose can be enriched with different heteroatoms during the synthesis using acrylic acid [31] and urea or aminourea [32,33] for generating carboxylic groups or N-doping, respectively. Functionalities were also introduced by a specific HTC treatment [34] followed by sulfonation treatment yielding acidic functionalized carbon spheres, which were used as self-catalysts for cellulose hydrolysis and fructose dehydration reactions [34]. The aim of this manuscript was to prepare low loading Pt-catalysts on carbon spheres obtained from glucose by HTC synthesis for conversion of FUR. Glucose–carbon hybrids were synthesized using different carbon materials, including CB, CNT, AC and reduced graphene oxide (rGO). The influence of the type of carbon material on the HTC process and the physicochemical properties of the resulting materials is presented. Pt-catalysts were prepared by incipient wetness impregnation on the corresponding glucose–carbon hybrids, and their activity and selectivity evaluated for the continuous conversion of FUR in the gas phase using fixed bed reactors at mild operating conditions (pressure and temperature).

2. Results and Discussion

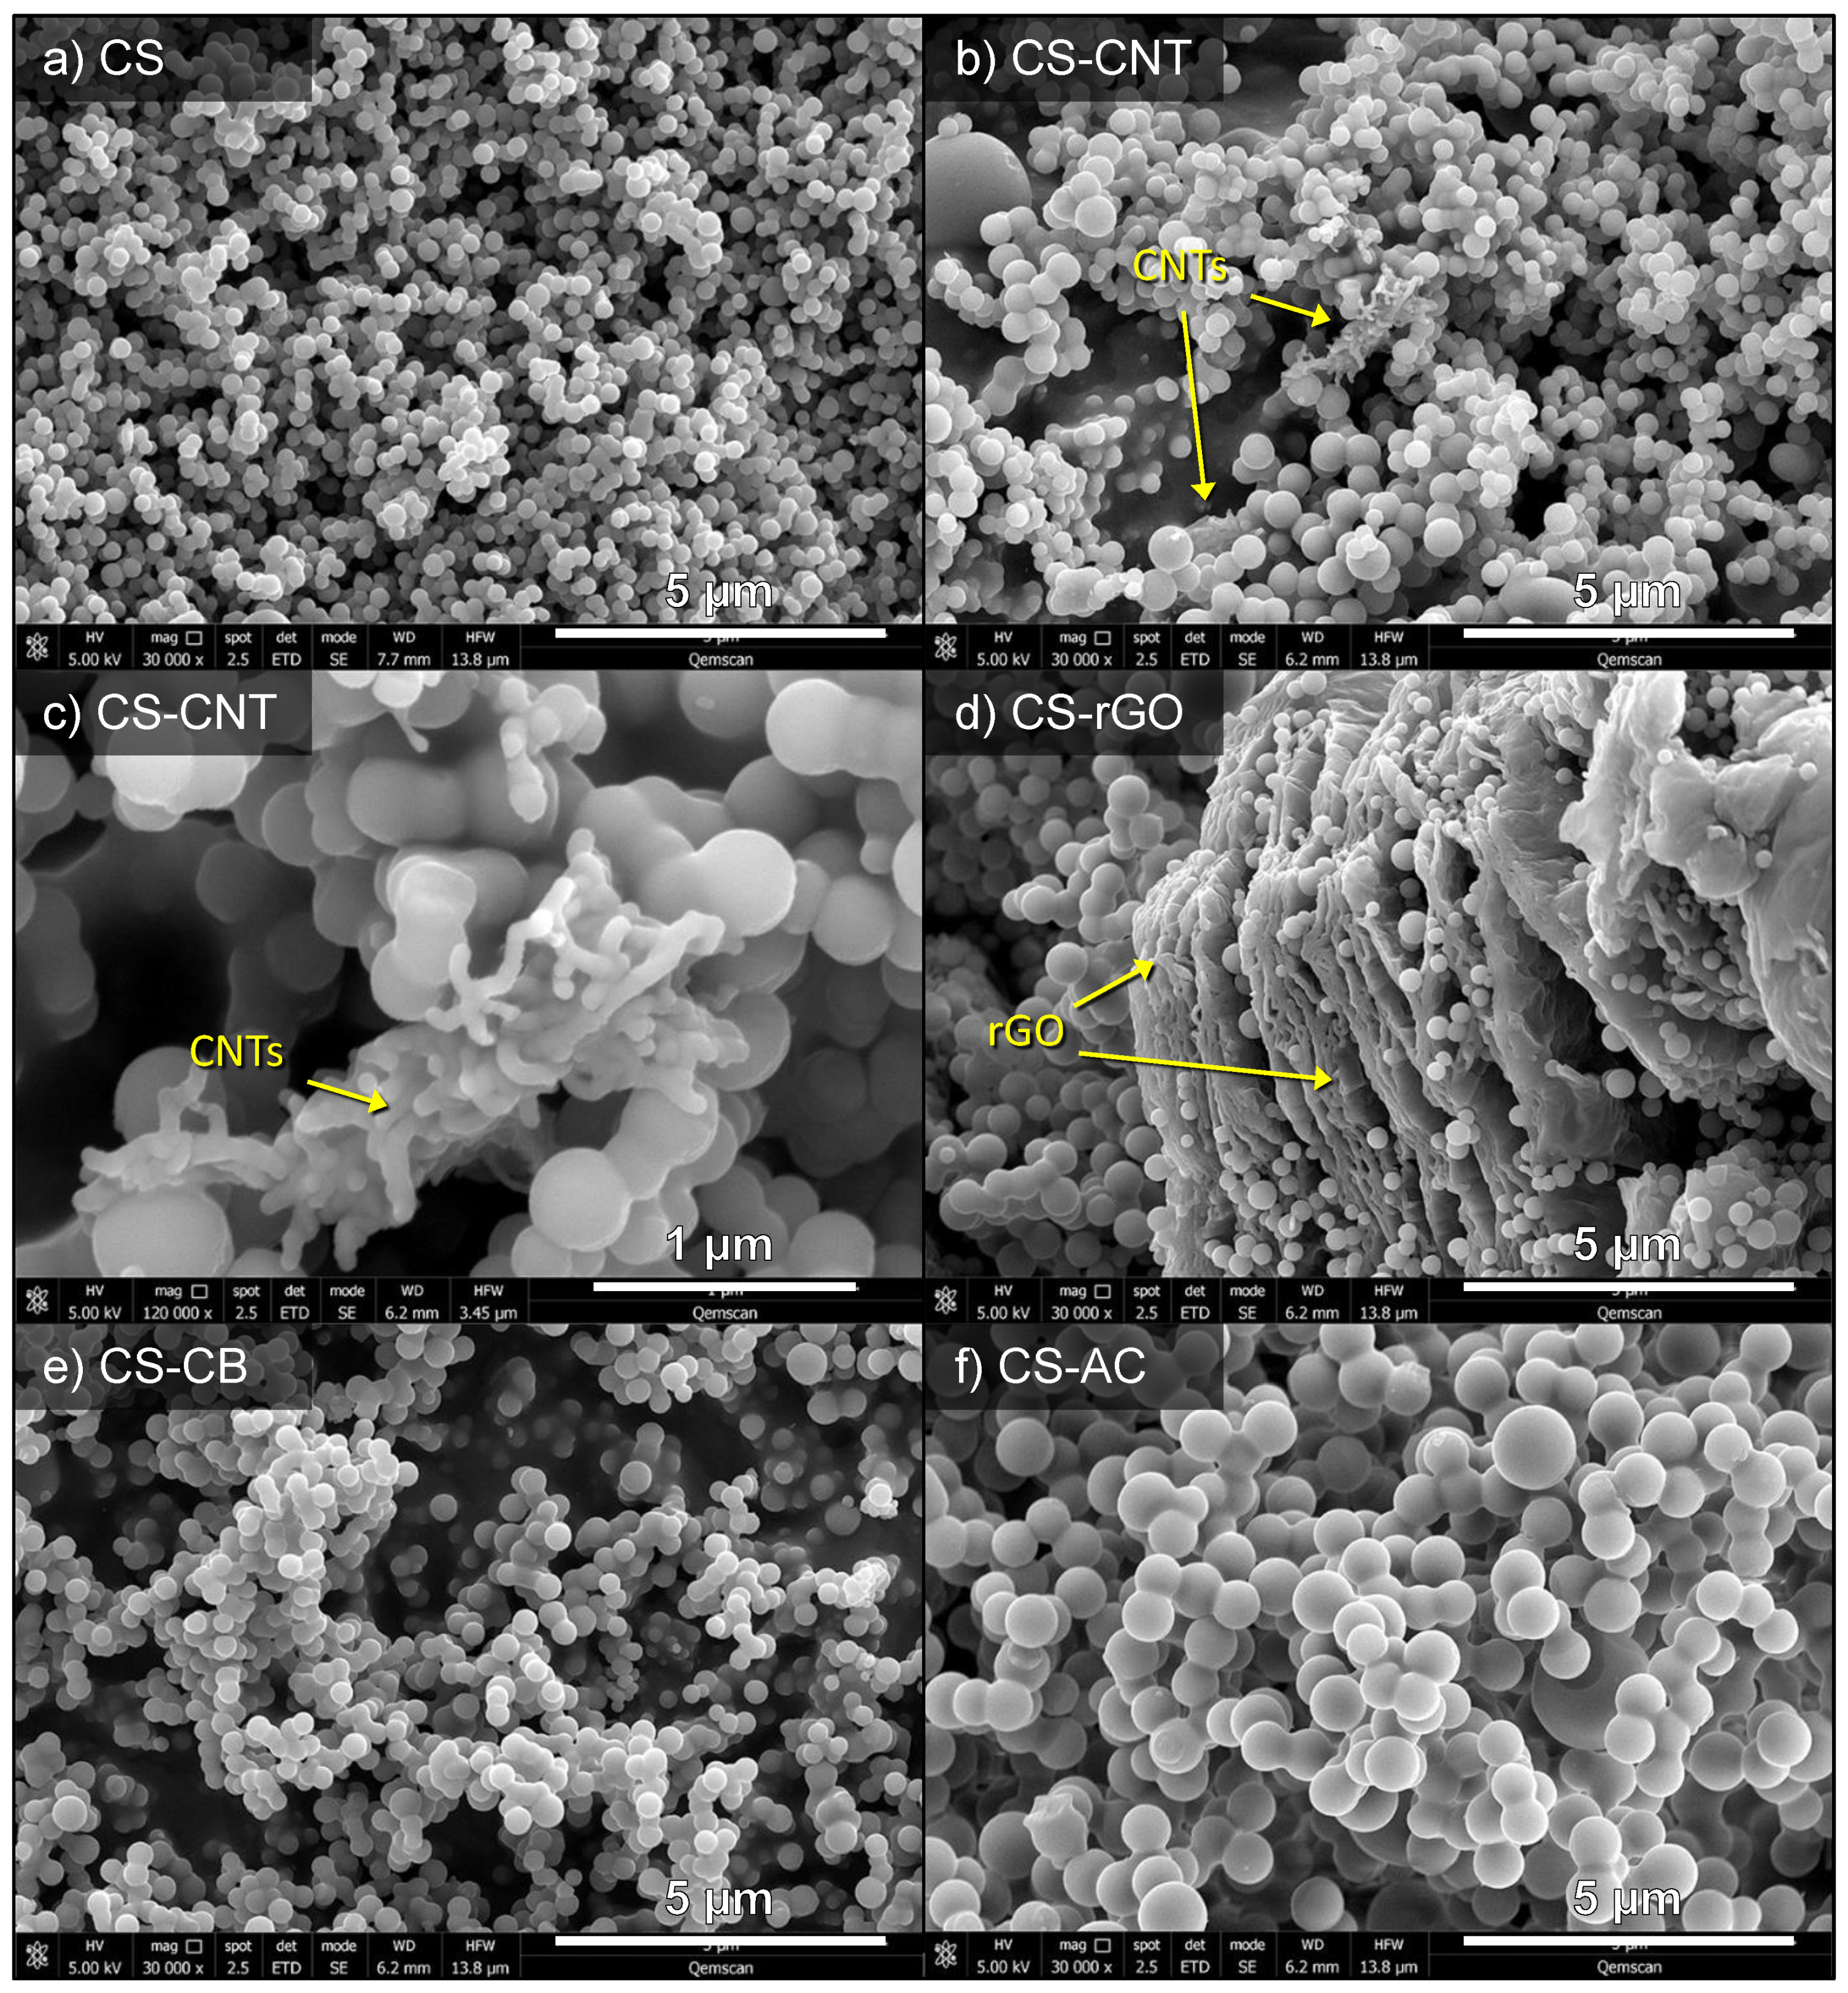
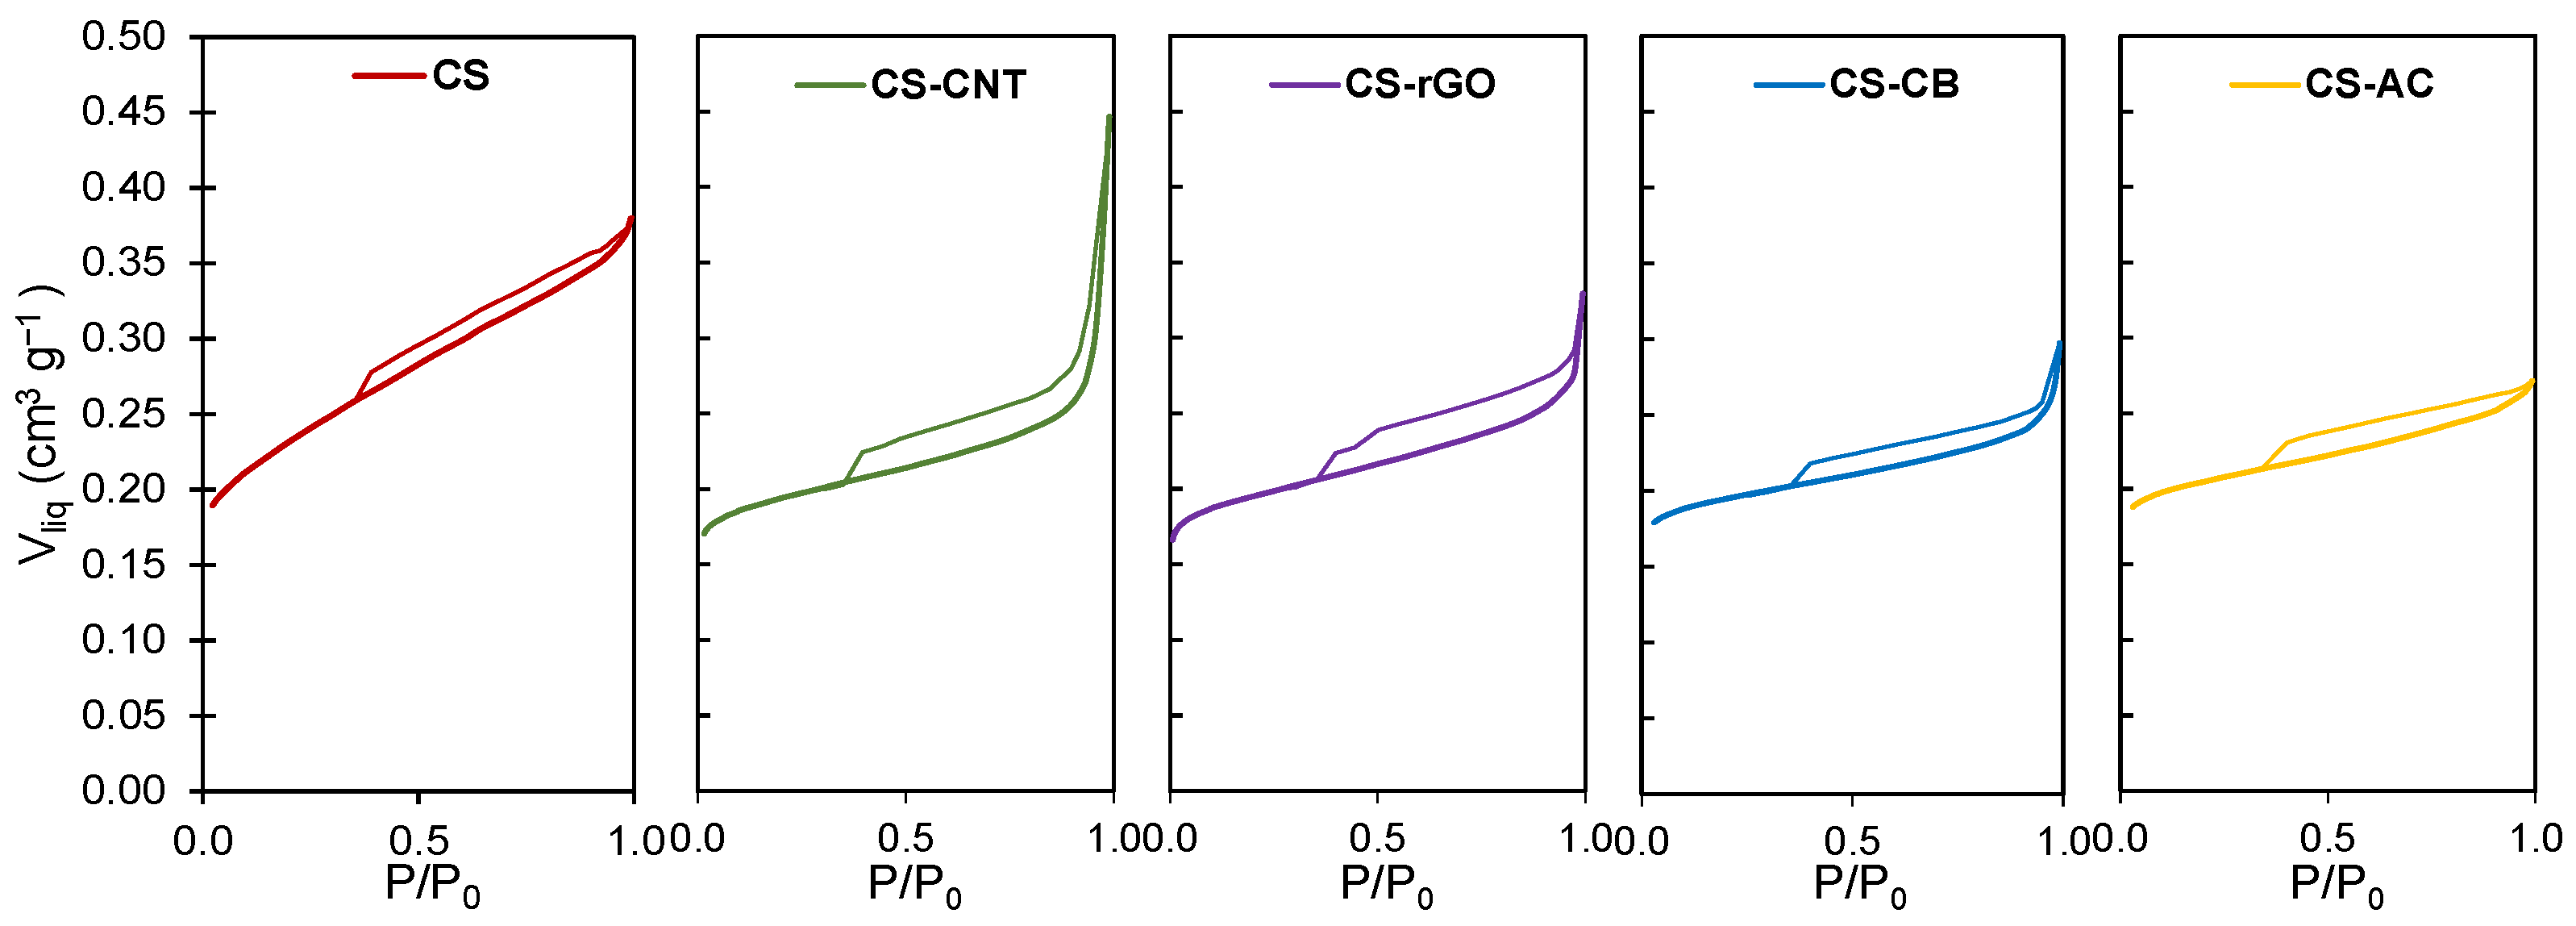
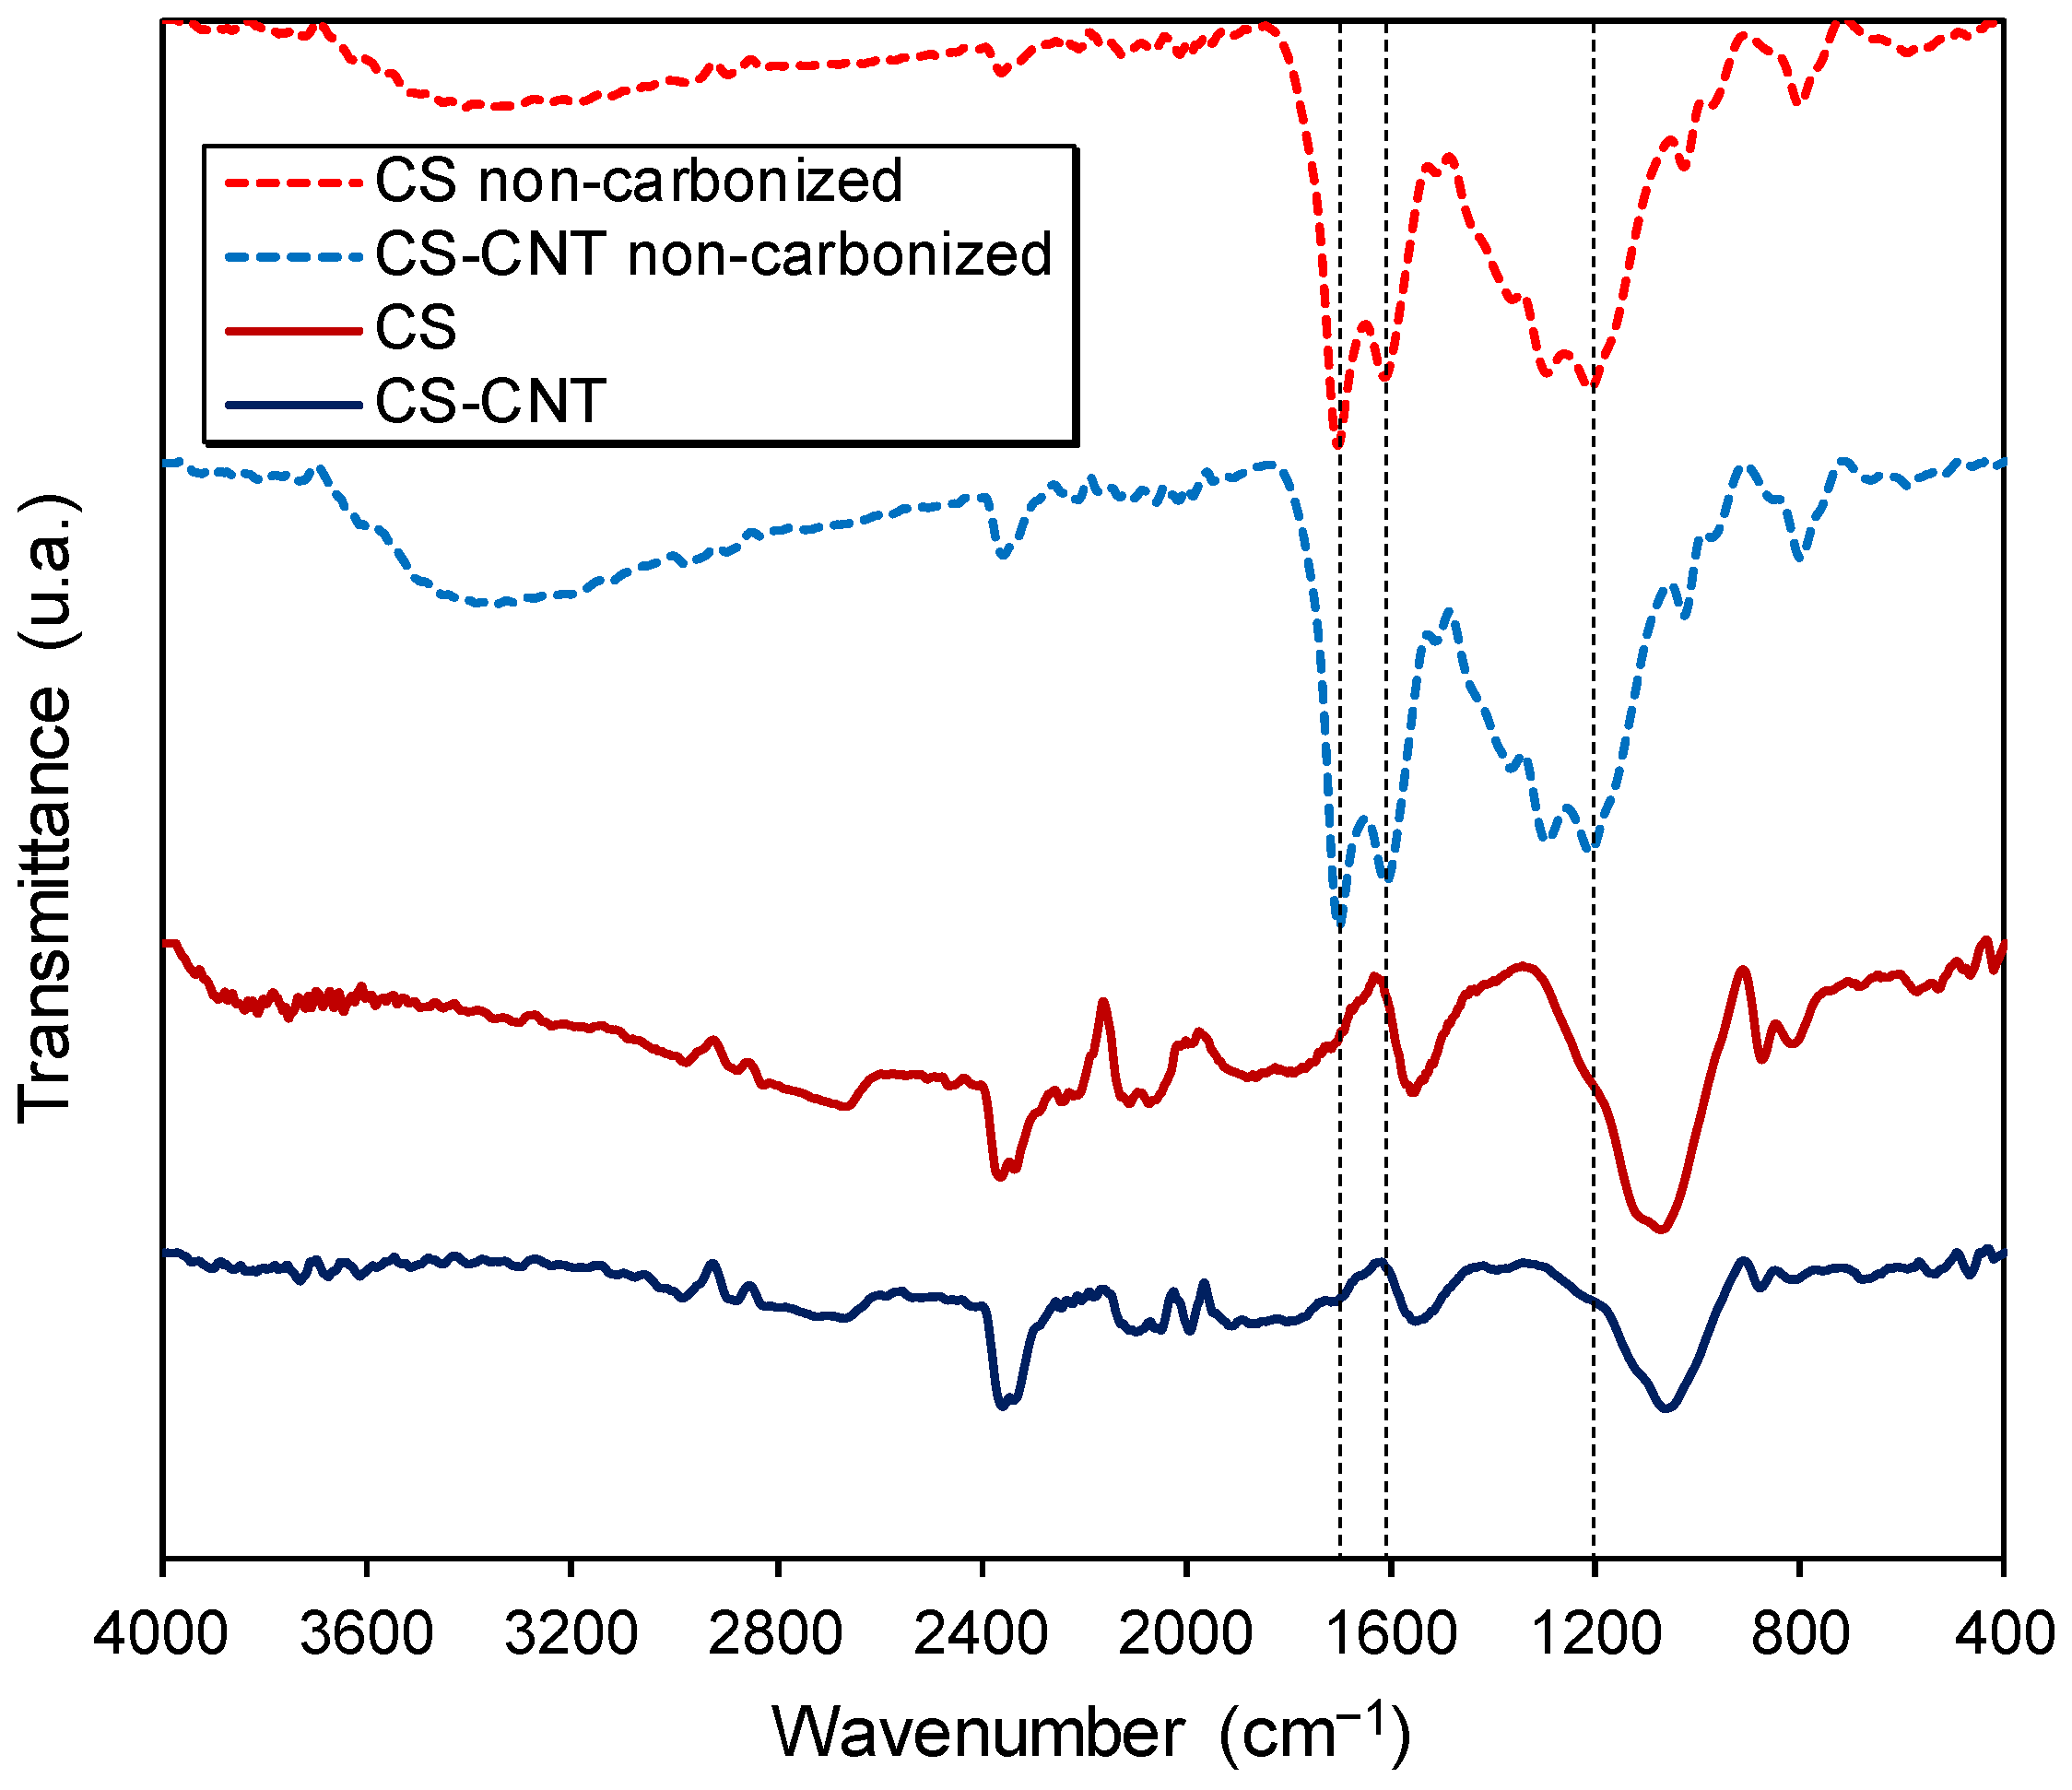
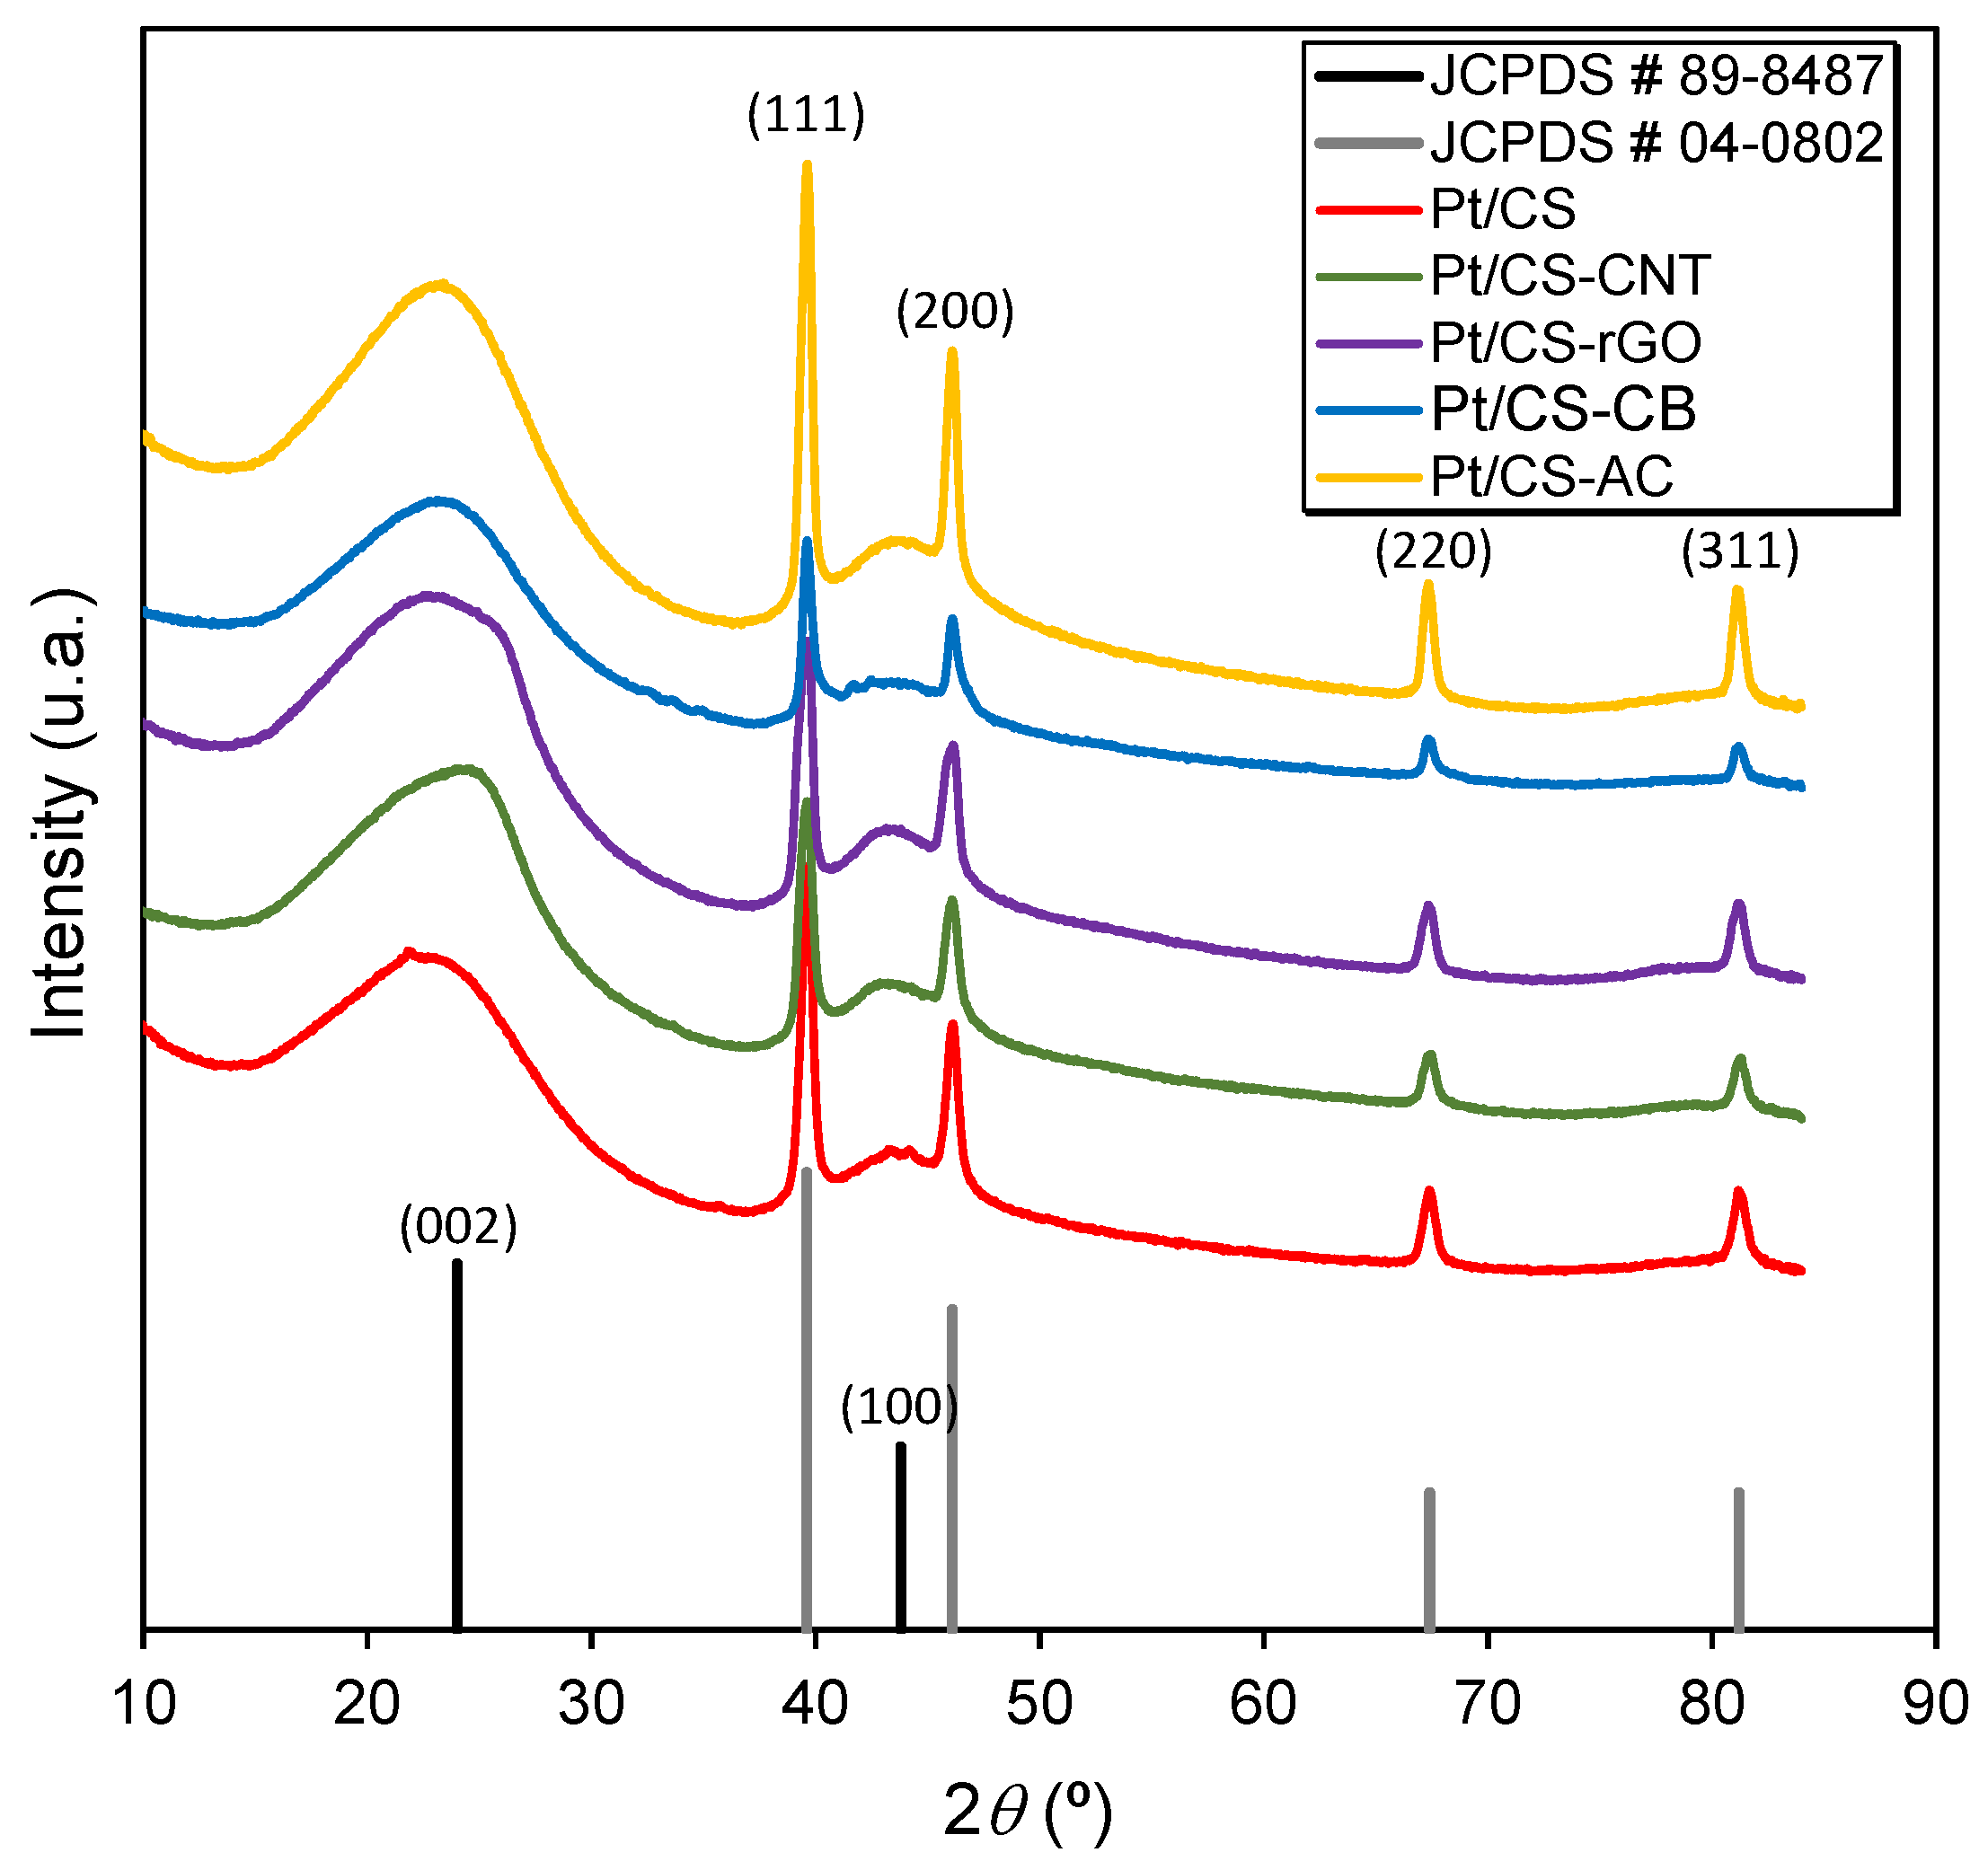
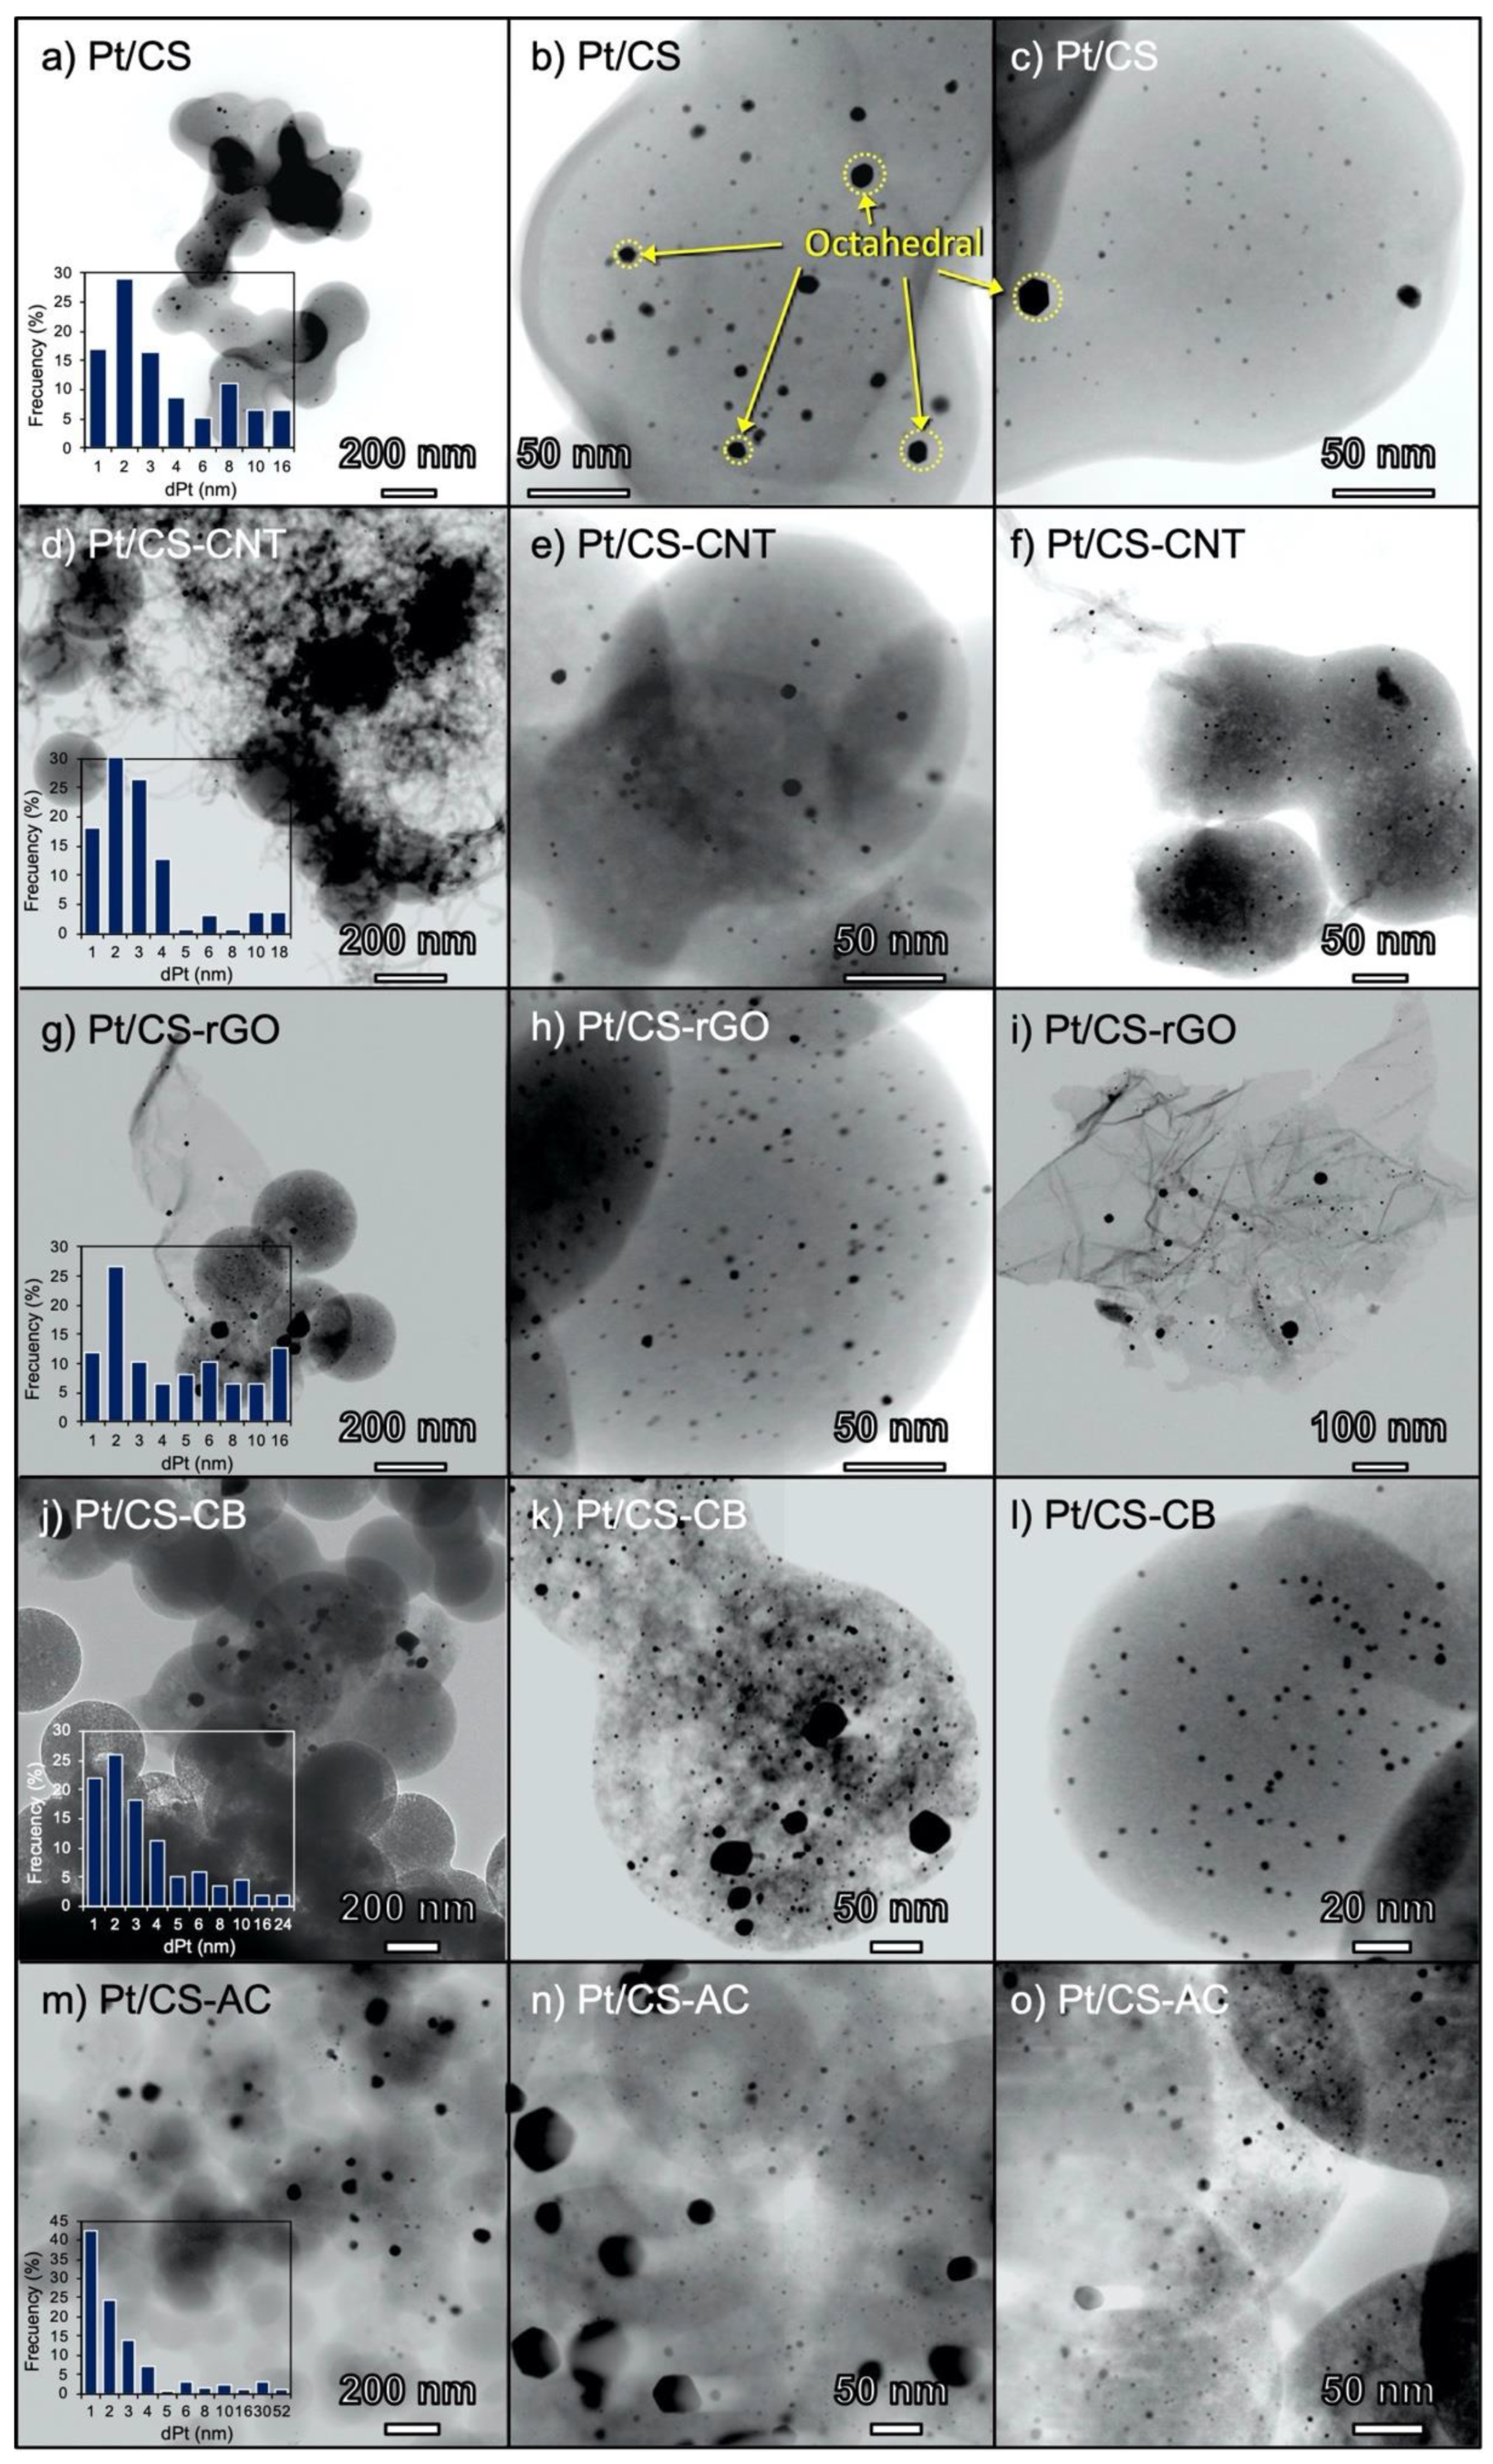
2.1. Characterization of the Carbon Supports and Pt/Carbon Catalysts

The morphology of the reference material prepared from only glucose (i.e., CS) and glucose–carbon hybrids (i.e., CS-CNT, CS-rGO, CS-CB, CS-AC) was maintained after thermal carbonization, as observed in Figure 1a–f. The hydrothermal treatment of only glucose (i.e., CS) leads to a carbon material formed by microspheres (Figure 1a). In the case of glucose–carbon hybrids prepared by doping with different types of carbon materials, a spherical morphology was also predominantly obtained (Figure 1b–f). This fact can be attributed to the high amount of glucose used in the preparation in comparison with the carbon dopant (i.e., 5 wt.%), this low loading of dopant being used to avoid its sedimentation inside the autoclave during the synthesis. On the other hand, the size of the microspheres depended on the type of carbon material employed. Thus, the CS material (without any dopant) presented the narrowest distribution of spheres with particle sizes around 250–300 nm (Figure 1a), while an increase of the sphere size was observed for all glucose–carbon hybrids, the largest spheres of around 700–-800 nm being formed for CS-AC (Figure 1f). The spheres size decreased as follows: CS < CS-CNT < CS-CB < CS-rGO < CS-AC. In the case of CS-CNT and CS-rGO samples, a coupled structure of carbon nanotubes or graphene oxide flakes with spherical particles was obtained (Figure 1c,d, respectively).
Although the morphology of materials was defined during the HTC process, the apparent surface area (SBET) of the initial samples was only around 20 m2 g−1, and thereby, a subsequent thermal carbonization was required to develop the carbon porosity. The textural properties of the carbon supports are summarized in Table 1 and the corresponding N2 adsorption-desorption isotherms at -196 °C are shown in Figure 2. The thermal carbonization significantly increased the porosity of the carbon supports, SBET values being increased up to 541 m2 g−1 for the CS sample (Table 1). Interestingly, the carbon doping led to a SBET reduction of ca. 12% compared to the reference material (CS) and regardless of the type of carbon material used in the hybrids (e.g., 541 and 473 m2 g−1 for CS and CS-CNT, respectively). These results can be related with the growing size of the carbon spheres, which progressively enlarged the mesoporosity transforming the mesopores into macropores, since only a clear increase in the mesopore volume (Vmeso) was observed after doping with CNT (i.e., 0.14 and 0.21 cm3 g−1 for CS and CS-CNT, respectively). This fact was pointed out by the change in the shape of the N2 adsorption isotherms (Figure 2). The slope of these isotherms significantly decreased after carbon doping, with an increase of N2 adsorption at high relative pressure (P/P0), indicating the presence of larger pores and a decrease on the narrowest mesoporosity range. Regarding the microporosity of the glucose–carbon hybrids, the micropore volume (Vmicro) also slightly decreased compared to CS (e.g., 0.22 and 0.19 cm3 g−1 for CS and CS-CNT, respectively), although the mean micropore width (L0) becomes narrower (e.g., L0 = 1.3 and 0.8 nm for CS and CS-CNT, respectively), leading to an increase of the surface associated to this porosity range (e.g., Smicro = 323 and 439 m2 g−1 for CS and CS-CNT, respectively), in contrast to the decrease of SBET observed after carbon doping.
Raw materials obtained from glucose by only HTC showed an acidic character with point of zero charge (pHPZC) values of ca. 3.4. The thermal carbonization performed on all samples not only led to an enhanced porosity, but also to a strong reduction of the oxygenated functionalities, mainly those evolved as CO and CO2. Thus, the release of oxygenated surface groups was pointed out by the lower intensity of FTIR bands placed in the region of 1200 cm−1 (C–O bonds) and 1700 cm−1 (C=O bonds) for carbonized samples (Figure 3) [35,36]. Therefore, neutral pHPZC values in the range 7.0–7.6 were determined for glucose–carbon hybrids after thermal carbonization (Table 1).
The nature and dispersion of Pt-nanoparticles in the Pt/carbon catalysts were determined by both X-ray powder diffraction (XRD) and transmission electron microscopy (TEM) analysis (Figure 4 and Figure 5, respectively). All XRD patterns showed a wide band at around 23° corresponding to the (002) lattice of graphite (JCPDS Card 89-8487), showing that carbon supports present a certain structural ordering in spite of being mainly amorphous materials. Regarding the oxidation state of Pt-phase (Figure 4), only Pt0 was detected in the catalysts after reduction, as pointed out by XRD peaks placed at 2θ = 39.7°, 46.2°, 67.2° and 81.0° associated to the (111), (200), (220) and (311) crystal planes of Pt0 (JCPDS Card 04-0802). The most intense diffraction peaks were observed for Pt/CS-AC.
TEM micrographs of the Pt/carbon catalysts are shown in Figure 5. The images show a good distribution of Pt-nanoparticles deposited on the carbon surfaces taking into account the low metal loading used (Figure 5a,d,g,j,m). Furthermore, large Pt-particles responsible for XRD peaks in Figure 4 were formed together with a high concentration of very small Pt-nanoparticles (sizes around 1–3 nm), corroborating a Pt-heterogeneous dispersion on the carbon supports. In general, small Pt-nanoparticles had rounded shapes, while the largest Pt-crystallites tended to present an octahedral configuration (e.g., Figure 5b,c). On the other hand, Pt-nanoparticles were deposited not only on the carbon spheres formed from glucose (Figure 5 b,e,h,k,n), but also on the dopant structure, as clearly pointed out for Pt/CS-CNT and Pt/CS-rGO (Figure 5f,i, respectively). Small Pt-nanoparticles are concentrated on the carbon spheres, while the formation of larger particles is favored on the interstitial voids. In this context, the highest concentration of large Pt-particles exceeding 50 nm was observed on the Pt/CS-AC catalyst (Figure 5n).
The average Pt-particle size (dPt) was determined by applying the Scherrer equation to XRD data and analyzing TEM micrographs with Image J software. The results are summarized in Table 2. As previously discussed, the formation of two types of Pt-particles was obtained on carbon supports: (i) very small nanoparticles with sizes around 1–3 nm and highly concentrated on the carbon spheres, which are unable to produce XRD peaks; and (ii) large particles formed in the carbon interstices, some of them exceeding 50 nm as for Pt/CS-AC, but statistically in a short number. This heterogeneous distribution leads to the differences of Pt-particle sizes determined by both techniques, in which dPt (XRD) was higher than dPt (TEM), because the main limitation of XRD is related to the progressive line broadening as the crystallite size decreases, which typically avoids the detection of particle size below 4 nm [37]. HRTEM analysis allows an accurate observation of very small nanoparticles. Therefore, the average Pt-particle size obtained by XRD was larger because small particles were not quantified with this technique. In general, Pt-catalysts supported on glucose–carbon hybrids seem to favor smaller Pt-particle sizes than that obtained on the reference material, i.e., Pt-CS. In a previous work, we described the influence of the porosity and surface chemistry of carbon aerogels on the Pt-dispersion. Thus, basic materials led to very small Pt-particle sizes, while a high external surface area (or mesoporous volume) allowed obtaining also Pt-particles around 2–3 nm for acidic carbons [38]. Since glucose–carbon hybrids presented neutral pHPZC values, the porosity, and in particular, the mesoporous volume should be the factor influencing the Pt-dispersion, which was high enough to achieve good Pt-distributions on the carbon surface.

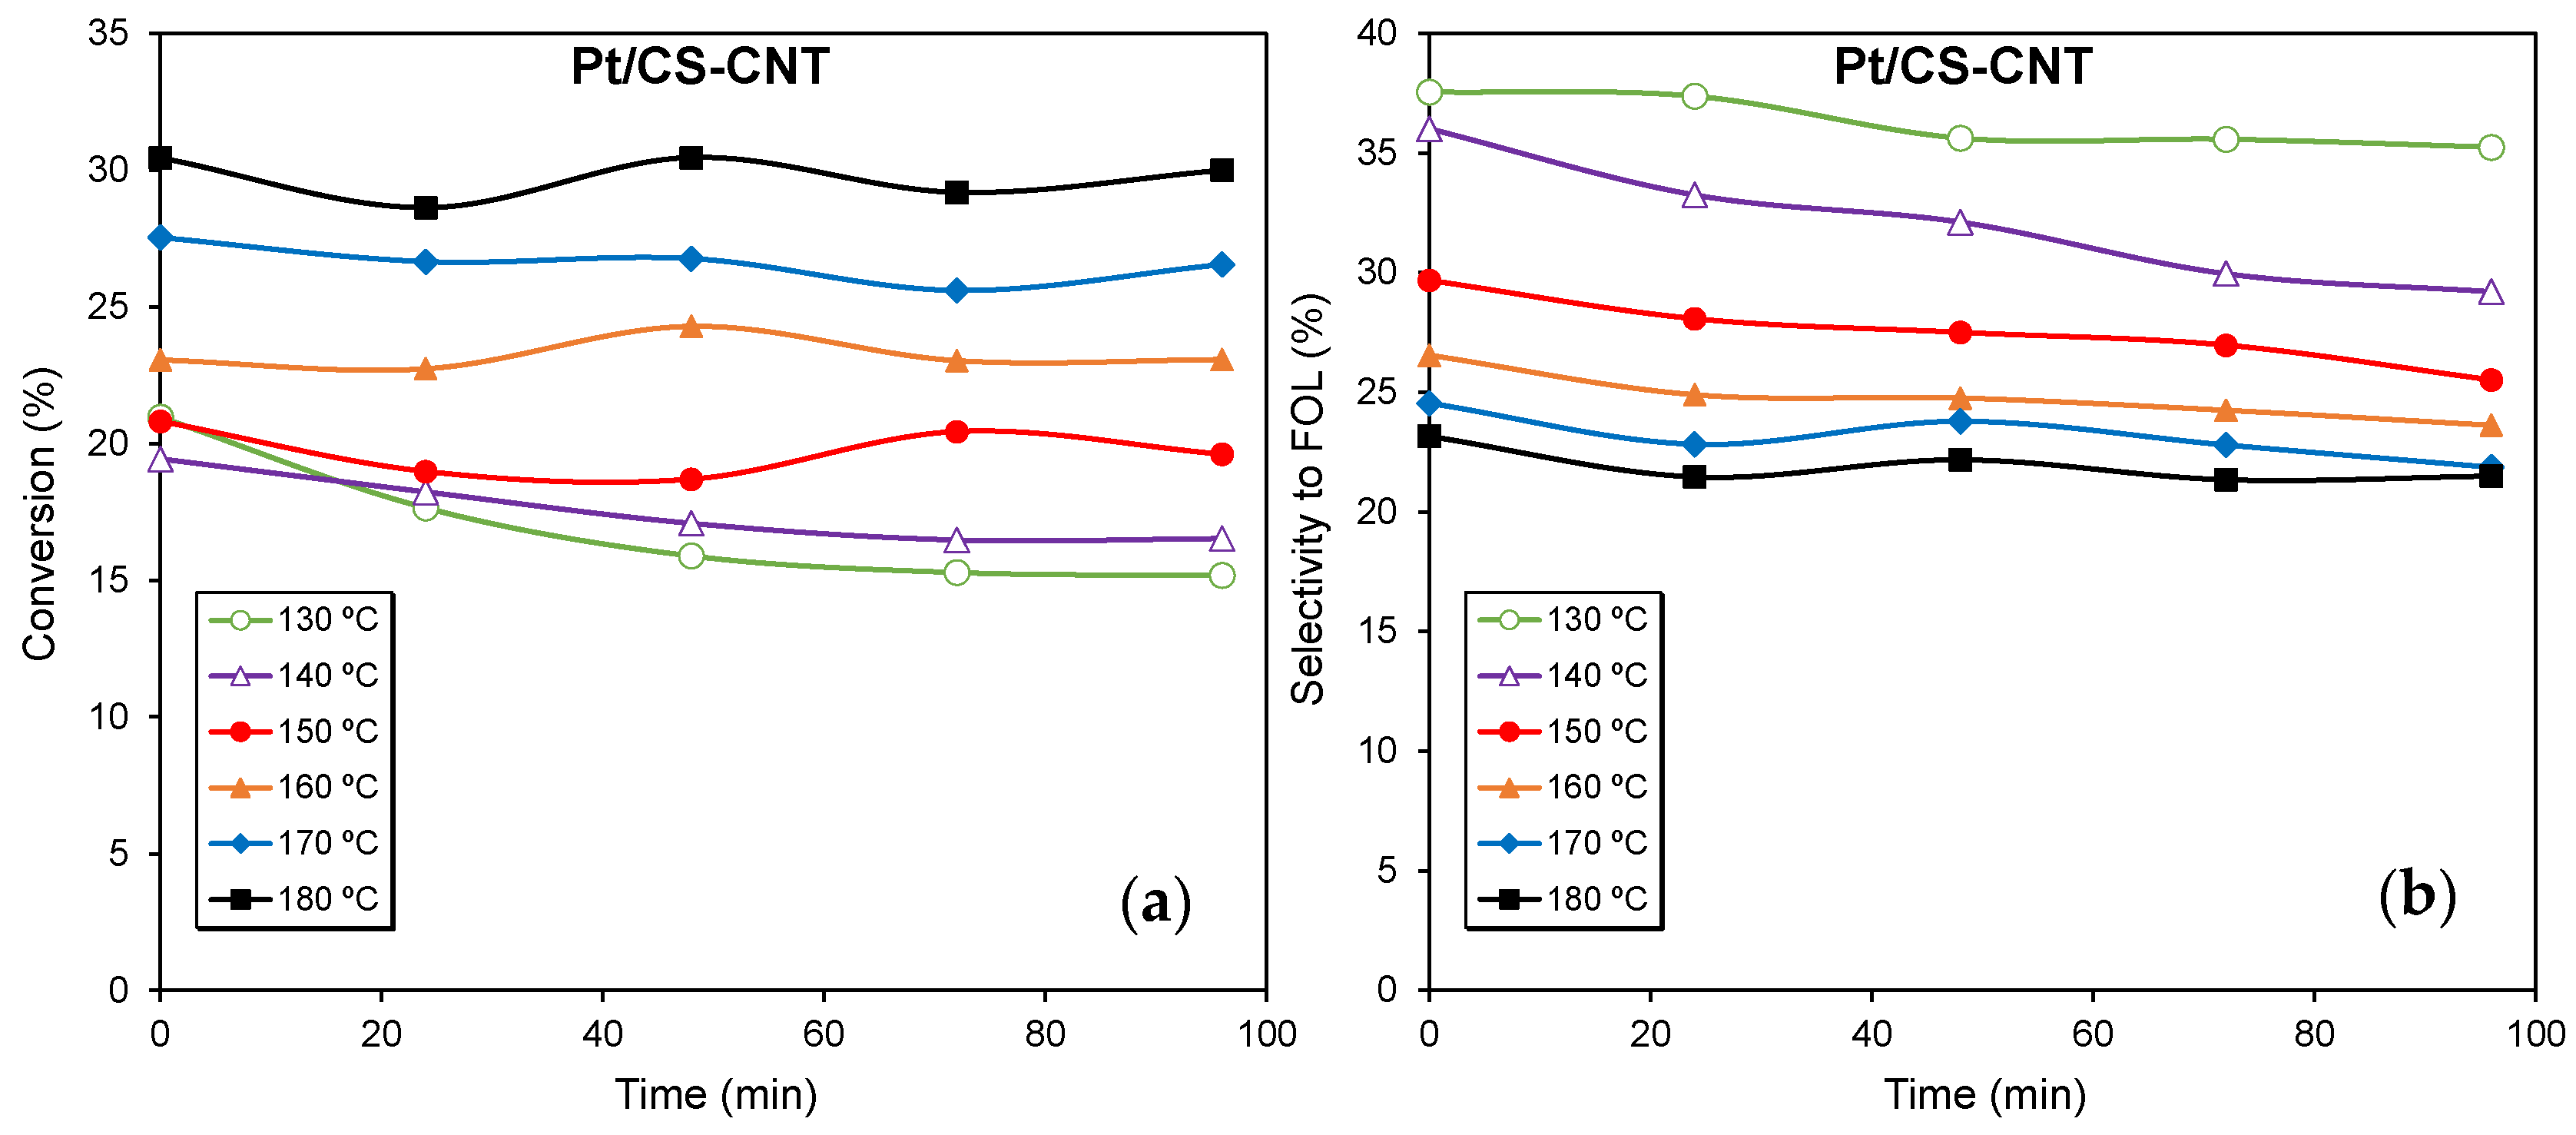
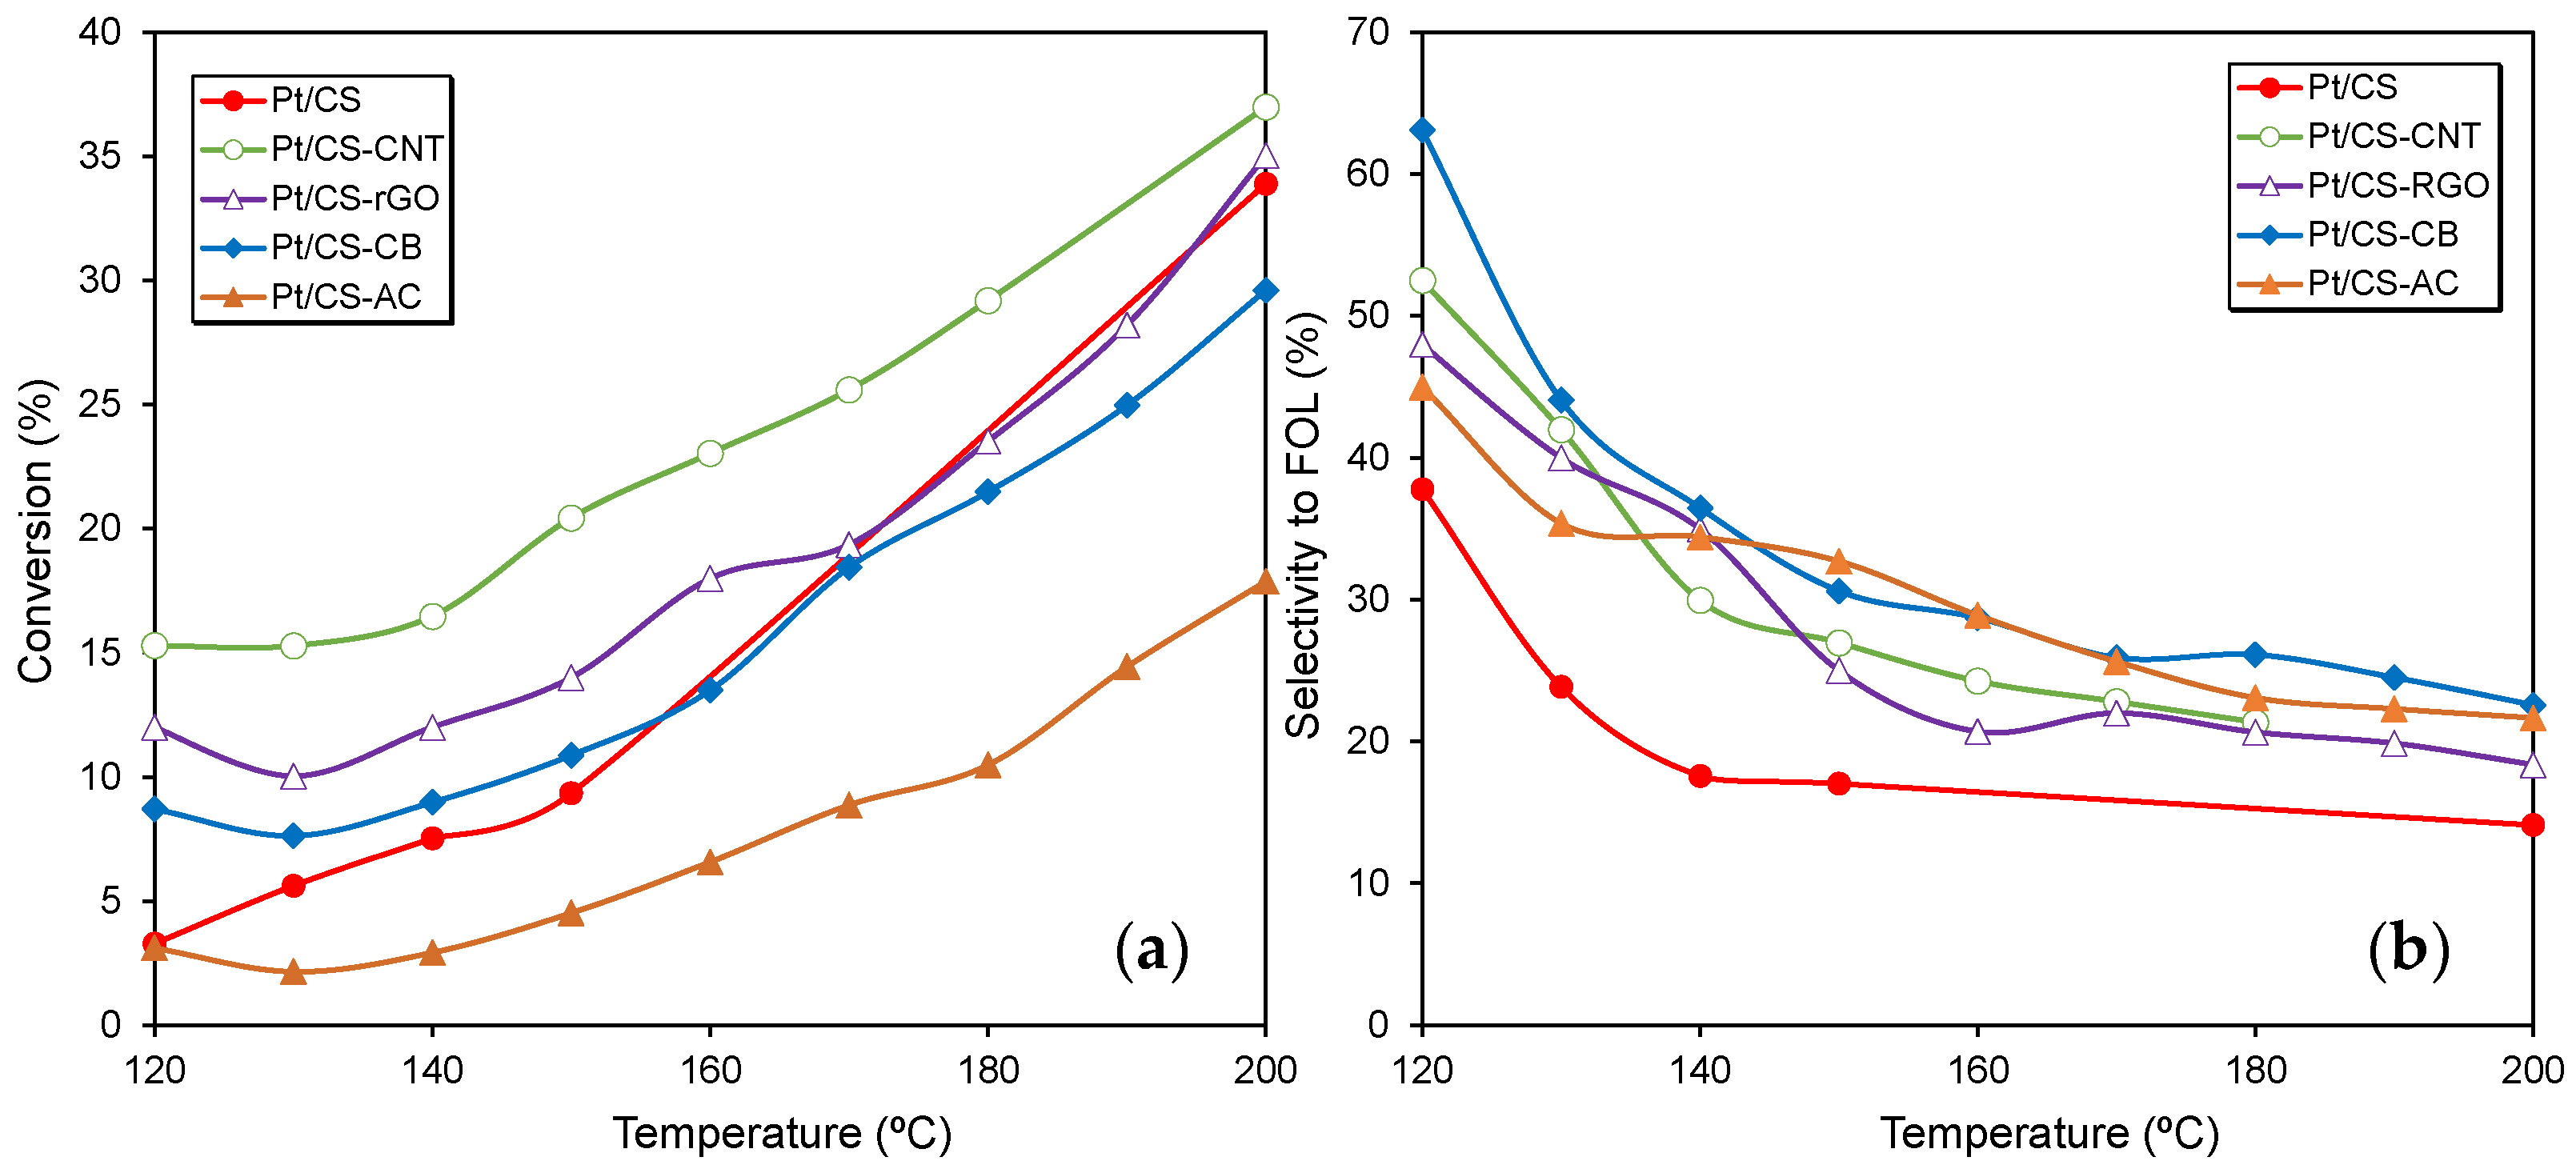
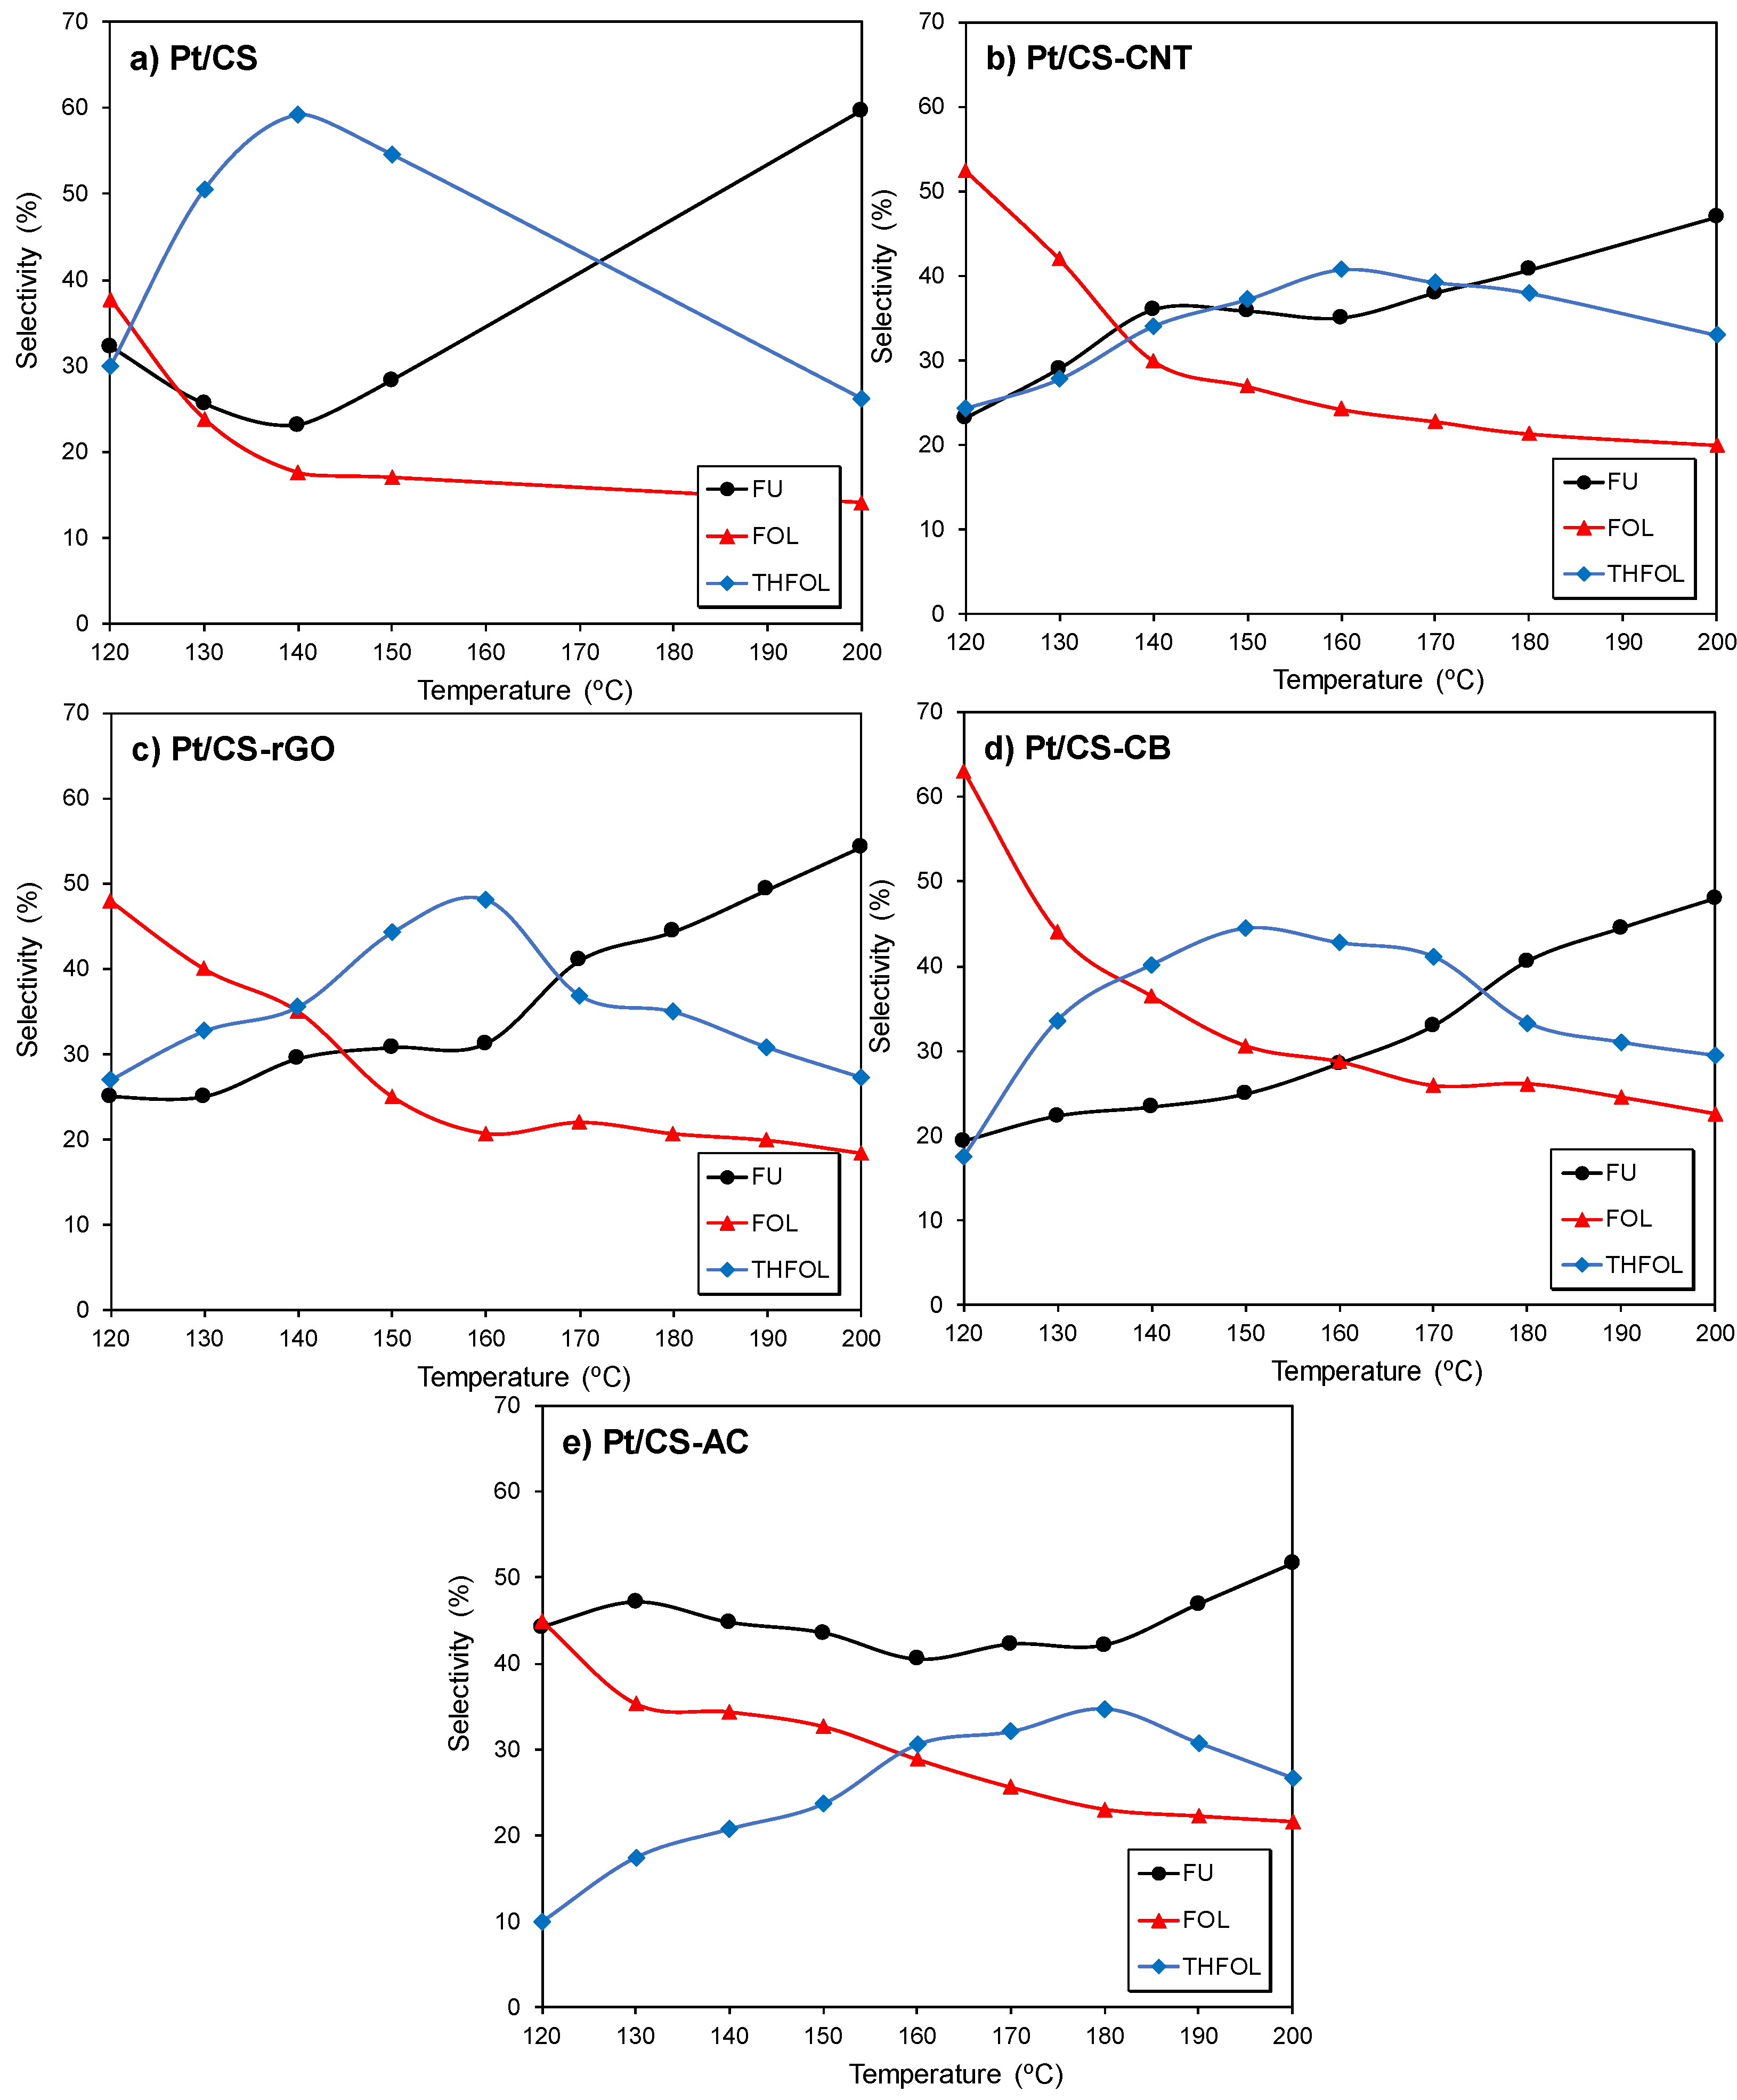
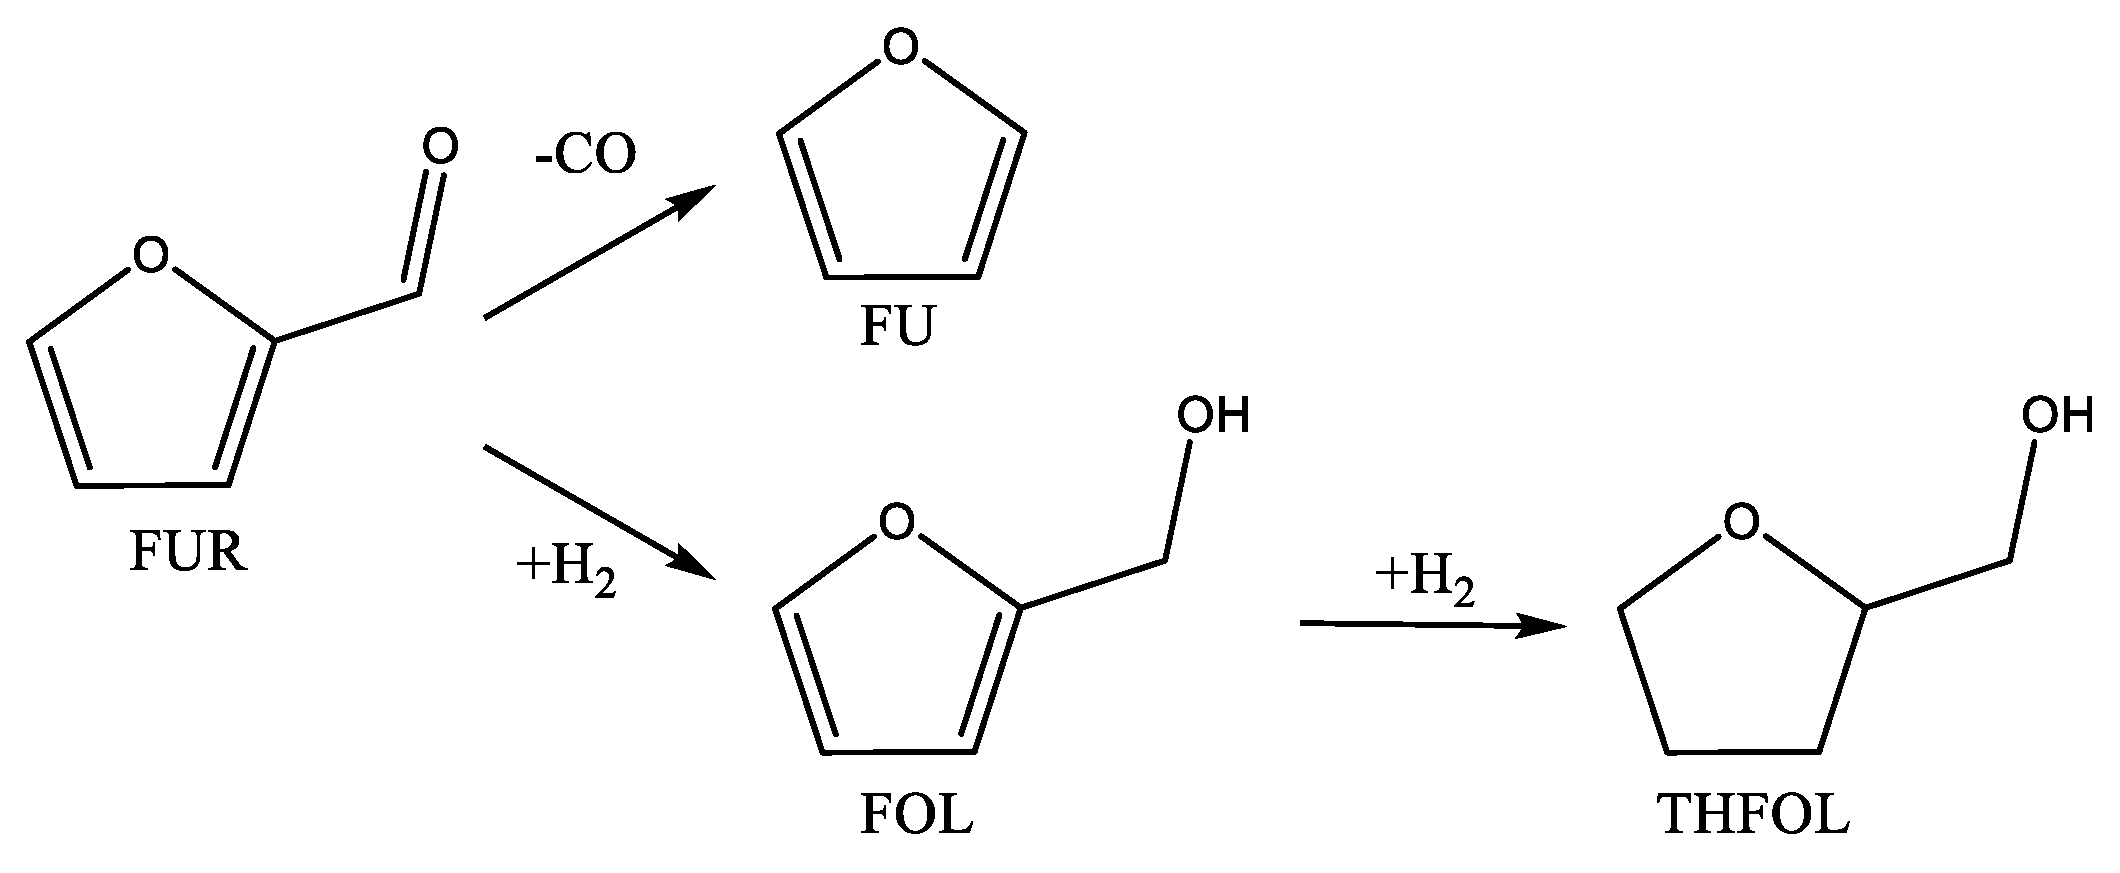
2.2. Catalytic Performance

The performance of all Pt-catalysts was studied in the hydroconversion (Scheme 1) of FUR with time on stream (TOS) at different temperatures and using the same amount of catalyst until reaching the stationary state (stable conversion values). As an example, Figure 6a,b shows the conversion of FUR and selectivity to FOL over Pt/CS-CNT, respectively. The results showed that the conversion was maintained through the time of reaction without significant changes to the product distribution (selectivity to FOL), indicating the absence of catalyst deactivation. Results showed in Figure 6 are obtained progressively increasing reaction temperature, but additional tests were randomly carried out repeating the temperature previously checked to analyze the possible catalyst deactivation, and the results were always comparable to those previously obtained. Similar results were obtained for the other Pt/carbon catalysts (results not shown).
After reaching the stationary state, the performance of the different Pt-catalysts in the hydroconversion of FUR was compared as a function of the reaction temperature (Figure 7). In general, the conversion of FUR increased linearly at high temperatures ranging from 140 to 200 °C (Figure 7a). Nevertheless, the selectivity to FOL (SFOL) decreased very quickly at low temperatures (120–140 °C) with increasing conversion (Figure 7b). In general, all Pt-catalysts supported on glucose–carbon hybrids showed a higher SFOL than that obtained for the reference material (i.e., Pt/CS) regardless of the reaction temperature. Regarding the conversion of FUR, only Pt-catalysts prepared on CNT, a mesoporous material, presented a clear better performance than Pt/Cs, since Pt/CS-rGO, Pt/CS-CB and Pt/CS-AC presented intermediate or worse conversion, respectively. On the other hand, the catalytic results indicate larger differences between the catalysts at low reaction temperatures (Figure 7). Thus, the conversion for the different catalysts tends to conversion values around 30–35%, while SFOL decreases down to ca. 25% at 200 °C. Overall, the most active Pt-catalyst was that obtained after CNT doping (Pt/CS-CNT).
Figure 8 shows the complete products distribution over all Pt-catalysts. FUR decarbonylation to FU and hydrogenation to FOL or THFOL were the only processes identified (Scheme 1). In general, FOL was the predominant product at low reaction temperatures (120–140 °C), while the formation of THFOL was favored at temperatures between 140 and 170 °C, and FU was always produced at temperatures ranging from 170 to 200 °C. Previous works [7,12,14,39,40] reported that the FUR decarbonylation is thermodynamically favored regarding the hydrogenation to FOL; however, hydrogenation is kinetically preferred. Thus, FOL is usually the main product obtained at low temperatures in many catalytic systems, while the formation of FU is favored at high reaction temperatures.
Both activity and product distribution have been also associated with the Pt-particle size [14,39]. In this context, small Pt-nanoparticles favored the decarbonylation reaction path, while the hydrogenation to FOL is achieved on large Pt-particles with dense (111) layers or octahedral morphology. It is noteworthy that the product distribution depends on the FUR adsorption mode on the catalysts surface. Most catalysts used in the gas phase for the hydrogenation of FUR to FOL are based on Cu and SiO2, as active phase and support, respectively [7], although there is still a certain controversy regarding the nature of active sites, namely Cu+ or Cu0. The high FOL yield obtained is due to the preferential FUR adsorption carried out using the electrons of the oxygen of the aldehyde group; thus, the FUR molecule is positioned perpendicularly to the catalysts surface (configuration oxygen (η1(O)), avoiding the repulsions of aromatic ring with the Cu 3d band of the catalyst surface [9].
This repulsion between the aromatic ring and the catalyst surface does not occur with metals such as Pt, Pd or Ni, and thereby, the FUR adsorption mode changes, the molecule allowing to be adsorbed parallelly to the catalyst surface (configuration (η2(C,O)). This configuration together with the formation of FOL may also evolve other reaction pathways, namely dehydration to 2-MFU or decarbonylation to FU [7]. Nakagawa et al. [41] studied the direct hydrogenation of FUR to THFOL on Ni/SiO2 catalysts, suggesting that the reaction occurred in two steps, FOL being the intermediary product. They proposed that strongly chemisorbed FUR reacted with adsorbed hydrogen and after that, the hydrogenation of FOL to THFOL took place (Scheme 1). The FUR adsorption is stronger than that of FOL and the hydrogenation of FUR to FOL is also less-structure sensitive, i.e., independent of the Ni-particle size. However, the hydrogenation of FOL to THFOL is favored on small Ni-nanoparticles. Tsatsos et al. [42] reported the electronic interactions of FUR with Pt(111), concluding that FUR chemisorbs nondissociatively on Pt(111) at low temperatures (175 K), and the hybridization of the aromatic ring π orbitals is involved with the Pt d band. At higher temperatures, the decomposition of the adsorbed FUR from clean Pt(111) leads to the decarbonylation to FU, CO, H2, and graphite-like species. In addition, the interaction of the metal with FUR influences the yield and product distribution, a strong interaction between the metal surface and FUR ring favoring decomposition products, while FU production is mostly obtained with weak ring interaction [43].
These conclusions are in agreement with our catalytic results. In a first step, FUR might be strongly adsorbed on the Pt-surface mainly producing FOL over the most active catalytic sites at low temperature. The increase of the reaction temperature leads to the progressive activation of more active sites, which enhances the hydrogenation rate and that FOL is transformed into THFOL. Thus, SFOL decreases and STHFOL increases until temperatures of ca. 170 °C. These results indicate that the hydrogenation rate decreased favoring the decarbonylation reaction path, which is in accordance with the thermodynamic-kinetic balance previously described [7,12,14,39]. Therefore, THFOL is considered a secondary product, in which the formation is favored in the temperature range where FUR hydrogenation is preferential and thereafter, decreased at the expense of decarbonylation.
It is noteworthy that catalysts are able to operate under a continuous flow system in the absence of any solvent and catalyst deactivation, being active at temperatures lower than those typically reported in the literature. The advantages of these continuous systems were recently reviewed [44], including a better control of the experimental conditions, simplicity, easy-scaling, product separation, catalyst recovering or regeneration, among others. The different activities of materials achieved at low temperatures significantly decreased with increasing reaction temperature because of the activation of a large amount of very small Pt-particles, which produced FU [39]. Furthermore, the results showed that experimental conditions can be fitted in order to obtain the desired product, i.e., FOL at low temperature, THFOL at intermediate and FU at temperatures higher than 170 °C. Additional experiments will be required to fit the characteristics of the catalyst (e.g., dopant concentration, HTC/thermal carbonization or activation variables), as well as the operating conditions, such as contact time, FUR/H2 ratio, total flow or higher temperatures, which would allow enhancing the catalytic performance and the specificity of the reaction.
Overall, the catalysts prepared presented good activity taking into account our experimental conditions and the low metal loading used when compared to other materials reported in the literature (Table 3).

3. Materials and Methods

3.1. Preparation of Glucose–Carbon Hybrids and Pt/Carbon Catalysts

The synthesis of the glucose–carbon hybrid was carried out by following a hydrothermal method adapted from elsewhere [30]. Briefly, a certain amount (5 wt.%) of a carbon material, namely CNT, rGO, AC or CB, was added to an aqueous solution of 0.3 M glucose and sonicated for 30 min to yield a homogeneous suspension. The above mixture was transferred into a polytetrafluoroethylene (PTFE) vessel and positioned in a stainless-steel autoclave (Parr Instruments, Moline, IL, USA Mod. 4748), which was sealed and placed in an oven at 190 °C for 8h for the HTC process to take place. The resulting glucose–carbon hybrids were filtered and washed with distilled water, ethanol and acetone to remove possible oligosaccharides or other macromolecules formed from glucose during HTC. Finally, the materials were carbonized using a horizontal tubular furnace at 800 °C under 150 cm3 min−1 N2 flow for 3 h. The material hybrids were labeled as CS-X, where “X” refers to the carbon material added during the synthesis, i.e., CNT, rGO, CB or AC. Furthermore, a reference material, labeled as CS, was prepared following the same procedure but without addition of any carbon material. Pt-catalysts with a 1 wt.% of metal loading were prepared by incipient wetness impregnation on the carbon supports using a Pt(NH3)4(NO3)2 aqueous solution. The catalysts were dried in an oven at 110 °C and treated at 400 °C under 60 cm3 min−1 H2 flow for 2h prior characterization or reaction. The catalysts were denoted by adding “Pt” to the carbon support, i.e., Pt/CS, Pt/CS-CNT, Pt/CS-rGO, Pt/CS-CB and PT/CS-AC.

3.2. Materials Characterisation

Textural characterization of materials was carried out by physical adsorption of N2 at −196 °C using a Quadrasorb SI (Quantachrome, Boston Beach, FL, USA). The apparent surface area (SBET) was calculated applying the BET equation [52] to N2 adsorption isotherms, while Dubinin–Radushkevich and Stoeckli equations [53,54] were used to determine the micropore volume (Vmicro), the micropore surface area (Smicro) and the mean micropore width (L0). The Barrett, Joyner, and Halenda (BJH) method [55] was applied to the desorption branch of the N2 adsorption isotherms to obtain the pore size distribution (PSD) and the mesopore volume (Vmeso). The acidity of the samples was evaluated by measuring the point of zero charge (pHPZC) [35]. The morphology of the supports was examined by scanning electron microscopy (SEM) using an AURIGA (FIB-FESEM) microscope from Carl Zeiss SMT (Oberkochen, Germany) equipped with an EDAX (Oxford Instruments, Abingdon, UK) microanalysis system. The Pt-particle size (dPt) was estimated from transmission electron microscopy (TEM) using an Titan G2 60-300 microscope (FEI, Hillsboro, OR, USA) equipped with a high brightness electron gun (X-FEG) operated at 300 kV and a Cs image corrector (CEOS). FTIR spectra for carbon supports were recorded with a Nicolet 20SXB spectrometer (Thermo Fisher Scientific, Waltham, MA, USA). X-ray powder diffraction (XRD) patterns were recorded using a Bruker D8 Advance diffractometer with a Cu Kα radiation source (Bruker, Rivas-Vaciamadrid, Spain). JCPDS files were searched to assign the observed diffraction lines, and the average crystal size was determined using the Scherrer equation.

3.3. Catalytic Performance and Products Analysis

Hydrogenation reactions were carried out in the gas phase and at atmospheric pressure using a fixed bed reactor equipped with a thermocouple located close to the catalyst for an accurate temperature control. After in-situ reduction, 0.1 g of the selected catalyst was placed into the reactor and temperature and flows were fitted to the selected experimental conditions. The reactant consisted in 40 cm3 min−1 of H2 flow controlled by an electronic flowmeter and saturated with FUR vapor obtained by bubbling the total flow through a saturator filled with FUR and placed into a thermostatic water bath at 25 °C (Pvapor, FUR = 2.21 Torr). The concentration of FUR was monitored before and during the experiments, as well as the reaction products were determined by on-line gas chromatography (GC) using a gas chromatograph (Varian, model Chrompack CP-3800, Palo Alto, CA, USA) equipped with a flame ionization detector (FID) and a Carbopack 80/120 column (Sigma-Aldrich, St. Louis, MO, USA). The products were identified and quantified by previous calibration with appropriate standards. The reaction was performed at different temperatures ranging from 120 to 200 °C. Conversion and selectivity values were calculated by Equations (1) and (2), according the fraction of reactant transformed or the amount of each product formed, respectively, and allowing the calculation of the carbon balance along the reaction.
C o n v e r s i o n   ( % ) =   [ F U R ] i     [ F U R ] f [ F U R ] i   × 100
S e l e c t i v i t y   t o   X ( % ) =     [ X ] f [ F U R ] i     [ F U R ] f   × 100
where [FUR]i and [FUR]f are the initial and final concentrations of FUR, respectively and [X]f is the final concentration of the “X” formed product.

4. Conclusions

The conversion of glucose into a carbon biochar structured by microspheres was studied by the hydrothermal carbonization (HTC) process. Different carbon materials were used as nucleation centers to lead glucose–carbon hybrids. A dual structure was obtained for the hybris with sphere sizes depending on the nature of the dopant. An additional thermal carbonization was required to develop the porous texture. Doping led to glucose–carbon hybrids with a narrower microporosity and a neutral surface chemistry (pHPZC ~ 7), in comparison with the reference material synthetized with only glucose.
Pt-catalysts with low metal loading (1 wt.%) were prepared by incipient wetness impregnation on the carbon–glucose hybrids, a good dispersion of small Pt-nanoparticles being achieved on both carbon spheres and the corresponding dopant. Pt-particles possessed a rounded shape, but some large particles with octahedral geometry were also formed. In general, Pt-particle size for hybrid supports was smaller than that for the reference material.
FUR hydroconversion in the gas phase was studied below 200 °C and P = 1 atm. The process is strongly dependent on the reaction temperature. Thus, the main reaction pathway was the FUR hydrogenation, with FOL being produced at a low temperature (~120 °C) and THFOL at an intermediate temperature (~160 °C), while decarbonylation to FU was favored at higher temperatures. In general, Pt-catalysts supported on glucose–carbon hybrids enhanced the activity of the FUR hydrogenation and selectivity to FOL at low temperature. The lack of acidic sites on the catalysts and the low reaction temperature avoided the coke formation and the particle sintering, respectively, with no catalyst deactivation being detected.

Author Contributions

Conceptualization, F.J.M.-H.; methodology, L.M.P.-M. and S.M.-T.; investigation, J.A.P.-G.; writing—original draft preparation, J.A.P.-G. and F.J.M.-H.; writing—review and editing, L.M.P.-M. and S.M.-T.; supervision, S.M.-T., and F.J.M.-H.; funding acquisition, L.M.P.-M., S.M.-T. and F.J.M.-H. All authors have read and agreed to the published version of the manuscript.

Funding

This work was supported by the Spanish Project ref. RTI 2018-099224-B100 funded by ERDF/Ministry of Science, Innovation and Universities—State Research Agency.

Acknowledgments

S.M.-T. (RYC-2019-026634-I I/AEI/10.13039/501100011033) and L.M.P.-M. (RYC-2016-19347) acknowledge the Spanish Ministry of Economy and Competitiveness (MINECO), the State Re-search Agency and the European Social Found for their Ramón y Cajal research contracts. “Uni-dad de Excelencia Química Aplicada a Biomedicina y Medioambiente” of the University of Gra-nada (UEQ-UGR) is gratefully acknowledged for the technical assistance.

Conflicts of Interest

The authors declare no conflict of interest.

References

  1. Opia, A.C.; Hamid, M.K.B.A.; Syahrullail, S.; Rahim, A.B.A.; Johnson, C.A.N. Biomass as a potential source of sustainable fuel, chemical and tribological materials—Overview. Mater. Today Proc. 2020. [Google Scholar] [CrossRef]
  2. Perkins, G.; Batalha, N.; Kumar, A.; Bhaskar, T.; Konarova, M. Recent advances in liquefaction technologies for production of liquid hydrocarbon fuels from biomass and carbonaceous wastes. Renew. Sustain. Energy Rev. 2019, 115, 109400. [Google Scholar] [CrossRef]
  3. He, R.; Ye, X.P.; English, B.C.; Satrio, J.A. Influence of pyrolysis condition on switchgrass bio-oil yield and physicochemical properties. Bioresour. Technol. 2009, 100, 5305–5311. [Google Scholar] [CrossRef] [PubMed]
  4. Sankar, M.; Dimitratos, N.; Miedziak, P.J.; Wells, P.P.; Kiely, C.J.; Hutchings, G.J. Designing bimetallic catalysts for a green and sustainable future. Chem. Soc. Rev. 2012, 41, 8099–8139. [Google Scholar] [CrossRef] [PubMed]
  5. Li, X.; Jia, P.; Wang, T. Furfural: A Promising Platform Compound for Sustainable Production of C4and C5Chemicals. ACS Catal. 2016, 6, 7621–7640. [Google Scholar] [CrossRef]
  6. Yan, K.; Wu, G.S.; Lafleur, T.; Jarvis, C. Production, properties and catalytic hydrogenation of furfural to fuel additives and value-added chemicals. Renew. Sustain. Energy Rev. 2014, 38, 663–676. [Google Scholar] [CrossRef]
  7. Mariscal, R.; Maireles-Torres, P.; Ojeda, M.; Sadaba, I.; Granados, M.L. Furfural: A renewable and versatile platform molecule for the synthesis of chemicals and fuels. Energy Environ. Sci. 2016, 9, 1144–1189. [Google Scholar] [CrossRef]
  8. Homer, A.; Ralph, C. Method of hydrogenation of furfural to furfuryl alcohol. U.S. Patent 2094975A, 5 October 1937. [Google Scholar]
  9. Sitthisa, S.; Sooknoi, T.; Ma, Y.G.; Balbuena, P.B.; Resasco, D.E. Kinetics and mechanism of hydrogenation of furfural on Cu/SiO2 catalysts. J. Catal. 2011, 277, 1–13. [Google Scholar] [CrossRef]
  10. Li, K.; Ozer, R. Vapor phase decarbonylation process. WO2010080290A1, 31 August 2010. [Google Scholar]
  11. Sitthisa, S.; Resasco, D.E. Hydrodeoxygenation of Furfural Over Supported Metal Catalysts: A Comparative Study of Cu, Pd and Ni. Catal. Lett. 2011, 141, 784–791. [Google Scholar] [CrossRef]
  12. Zhang, W.; Zhu, Y.L.; Niu, S.; Li, Y.W. A study of furfural decarbonylation on K-doped Pd/Al2O3 catalysts. J. Mol. Catal. A Chem. 2011, 335, 71–81. [Google Scholar] [CrossRef]
  13. Merlo, A.B.; Vetere, V.; Ruggera, J.F.; Casella, M.L. Bimetallic PtSn catalyst for the selective hydrogenation of furfural to furfuryl alcohol in liquid-phase. Catal. Commun. 2009, 10, 1665–1669. [Google Scholar] [CrossRef]
  14. An, K.; Musselwhite, N.; Kennedy, G.; Pushkarev, V.V.; Robert Baker, L.; Somorjai, G.A. Preparation of mesoporous oxides and their support effects on Pt nanoparticle catalysts in catalytic hydrogenation of furfural. J. Colloid Interface Sci. 2013, 392, 122–128. [Google Scholar] [CrossRef] [PubMed]
  15. Baçaoui, A.; Yaacoubi, A.; Dahbi, A.; Bennouna, C.; Phan Tan Luu, R.; Maldonado-Hodar, F.J.; Rivera-Utrilla, J.; Moreno-Castilla, C. Optimization of conditions for the preparation of activated carbons from olive-waste cakes. Carbon 2001, 39, 425–432. [Google Scholar] [CrossRef]
  16. Morales-Torres, S.; Silva, A.M.T.; Maldonado-Hodar, F.J.; Machado, B.F.; Perez-Cadenas, A.F.; Faria, J.L.; Figueiredo, J.L.; Carrasco-Marin, F. Pt-catalysts supported on activated carbons for catalytic wet air oxidation of aniline: Activity and stability. Appl. Catal. B Environ. 2011, 105, 86–94. [Google Scholar] [CrossRef]
  17. Vivo-Vilches, J.F.; Bailon-Garcia, E.; Perez-Cadenas, A.F.; Carrasco-Marin, F.; Maldonado-Hodar, F.J. Tailoring activated carbons for the development of specific adsorbents of gasoline vapors. J. Hazard. Mater. 2013, 263 Pt 2, 533–540. [Google Scholar] [CrossRef]
  18. Esteves, B.M.; Morales-Torres, S.; Maldonado-Hodar, F.J.; Madeira, L.M. Fitting Biochars and Activated Carbons from Residues of the Olive Oil Industry as Supports of Fe- Catalysts for the Heterogeneous Fenton-Like Treatment of Simulated Olive Mill Wastewater. Nanomaterials 2020, 10, 876. [Google Scholar] [CrossRef] [PubMed]
  19. Nguyen-Huy, C.; Kim, J.S.; Yoon, S.; Yang, E.; Kwak, J.H.; Lee, M.S.; An, K. Supported Pd nanoparticle catalysts with high activities and selectivities in liquid-phase furfural hydrogenation. Fuel 2018, 226, 607–617. [Google Scholar] [CrossRef]
  20. Mironenko, R.M.; Belskaya, O.B.; Gulyaeva, T.I.; Nizovskii, A.I.; Kalinkin, A.V.; Bukhtiyarov, V.I.; Lavrenov, A.V.; Likholobov, V.A. Effect of the nature of carbon support on the formation of active sites in Pd/C and Ru/C catalysts for hydrogenation of furfural. Catal. Today 2015, 249, 145–152. [Google Scholar] [CrossRef]
  21. Stucchi, M.; Alijani, S.; Manzoli, M.; Villa, A.; Lahti, R.; Galloni, M.G.; Lassi, U.; Prati, L. A Pt-Mo hybrid catalyst for furfural transformation. Catal. Today 2020, 357, 122–131. [Google Scholar] [CrossRef]
  22. Taylor, M.J.; Beaumont, S.K.; Islam, M.J.; Tsatsos, S.; Parlett, C.A.M.; Issacs, M.A.; Kyriakou, G. Atom efficient PtCu bimetallic catalysts and ultra dilute alloys for the selective hydrogenation of furfural. Appl. Catal. B Environ. 2020, 284, 119737. [Google Scholar] [CrossRef]
  23. Kosydar, R.; Szewczyk, I.; Natkanski, P.; Duraczynska, D.; Gurgul, J.; Kustrowski, P.; Drelinkiewicz, A. New insight into the effect of surface oxidized groups of nanostructured carbon supported Pd catalysts on the furfural hydrogenation. Surf Interfaces 2019, 17, 100379. [Google Scholar] [CrossRef]
  24. Liu, L.J.; Lou, H.; Chen, M. Selective hydrogenation of furfural over Pt based and Pd based bimetallic catalysts supported on modified multiwalled carbon nanotubes (MWNT). Appl. Catal. A Gen. 2018, 550, 1–10. [Google Scholar] [CrossRef]
  25. Liu, L.J.; Guo, H.M.; Xue, B.; Lou, H.; Chen, M. Hydrogenation in supercritical conditions catalyzed by palladium supported on modified activated carbon. RSC Adv. 2015, 5, 66704–66710. [Google Scholar] [CrossRef]
  26. Deng, D.; Novoselov, K.S.; Fu, Q.; Zheng, N.; Tian, Z.; Bao, X. Catalysis with two-dimensional materials and their heterostructures. Nat. Nanotechnol. 2016, 11, 218–230. [Google Scholar] [CrossRef] [PubMed]
  27. Xu, X.; Li, Y.; Gong, Y.; Zhang, P.; Li, H.; Wang, Y. Synthesis of palladium nanoparticles supported on mesoporous N-doped carbon and their catalytic ability for biofuel upgrade. JACS 2012, 134, 16987–16990. [Google Scholar] [CrossRef]
  28. Gong, W.B.; Chen, C.; Zhang, H.M.; Zhang, Y.; Zhang, Y.X.; Wang, G.Z.; Zhao, H.J. Highly selective liquid-phase hydrogenation of furfural over N-doped carbon supported metallic nickel catalyst under mild conditions. Mol. Catal. 2017, 429, 51–59. [Google Scholar] [CrossRef]
  29. Fellah, M.F. Direct decarbonylation of furfural to furan: A density functional theory study on Pt-graphene. Appl. Surf. Sci. 2017, 405, 395–404. [Google Scholar] [CrossRef]
  30. Li, M.; Li, W.; Liu, S. Hydrothermal synthesis, characterization, and KOH activation of carbon spheres from glucose. Carbohydr. Res. 2011, 346, 999–1004. [Google Scholar] [CrossRef]
  31. Han, B.; Zhang, E.; Cheng, G.; Zhang, L.; Wang, D.; Wang, X. Hydrothermal carbon superstructures enriched with carboxyl groups for highly efficient uranium removal. Chem. Eng. J. 2018, 338, 734–744. [Google Scholar] [CrossRef]
  32. Shao, C.F.; Qiu, S.J.; Chu, H.L.; Zou, Y.J.; Xiang, C.L.; Xu, F.; Sun, L.X. Nitrogen-doped porous microsphere carbons derived from glucose and aminourea for high-performance supercapacitors. Catal. Today 2018, 318, 150–156. [Google Scholar] [CrossRef]
  33. Zhu, J.J.; Yin, H.Y.; Gong, J.Y.; Al-Furjan, M.S.H.; Nie, Q.L. Easy one pot synthesis of NiO/Nitrogen doped carbon spheres for highly sensitive enzyme free amperometric glucose sensors. Appl. Surf. Sci. 2018, 444, 56–64. [Google Scholar] [CrossRef]
  34. Wataniyakul, P.; Boonnoun, P.; Quitain, A.T.; Sasaki, M.; Kida, T.; Laosiripojana, N.; Shotipruk, A. Preparation of hydrothermal carbon as catalyst support for conversion of biomass to 5-hydroxymethylfurfural. Catal. Commun. 2018, 104, 41–47. [Google Scholar] [CrossRef]
  35. Pastrana-Martínez, L.M.; Morales-Torres, S.; Likodimos, V.; Falaras, P.; Figueiredo, J.L.; Faria, J.L.; Silva, A.M.T. Role of oxygen functionalities on the synthesis of photocatalytically active graphene–TiO2 composites. Appl. Catal. B Environ. 2014, 158–159, 329–340. [Google Scholar] [CrossRef]
  36. Morales-Torres, S.; Pastrana-Martínez, L.M.; Figueiredo, J.L.; Faria, J.L.; Silva, A.M.T. Graphene oxide-P25 photocatalysts for degradation of diphenhydramine pharmaceutical and methyl orange dye. Appl. Surf. Sci. 2013, 275, 361–368. [Google Scholar] [CrossRef]
  37. Zhang, Y.J.; Maroto-Valiente, A.; Rodriguez-Ramos, I.; Xin, Q.; Guerrero-Ruiz, A. Synthesis and characterization of carbon black supported Pt–Ru alloy as a model catalyst for fuel cells. Catal. Today 2004, 93–95, 619–626. [Google Scholar] [CrossRef]
  38. Morales-Torres, S.; Maldonado-Hodar, F.J.; Perez-Cadenas, A.F.; Carrasco-Marin, F. Design of low-temperature Pt-carbon combustion catalysts for VOC’s treatments. J. Hazard. Mater. 2010, 183, 814–822. [Google Scholar] [CrossRef]
  39. Pushkarev, V.V.; Musselwhite, N.; An, K.; Alayoglu, S.; Somorjai, G.A. High structure sensitivity of vapor-phase furfural decarbonylation/hydrogenation reaction network as a function of size and shape of Pt nanoparticles. Nano Lett. 2012, 12, 5196–5201. [Google Scholar] [CrossRef]
  40. Vorotnikov, V.; Mpourmpakis, G.; Vlachos, D.G. DFT Study of Furfural Conversion to Furan, Furfuryl Alcohol, and 2-Methylfuran on Pd(111). ACS Catal. 2012, 2, 2496–2504. [Google Scholar] [CrossRef]
  41. Nakagawa, Y.; Nakazawa, H.; Watanabe, H.; Tomishige, K. Total Hydrogenation of Furfural over a Silica-Supported Nickel Catalyst Prepared by the Reduction of a Nickel Nitrate Precursor. Chemcatchem 2012, 4, 1791–1797. [Google Scholar] [CrossRef]
  42. Tsatsos, S.; Ladas, S.; Kyriakou, G. Electronic Properties and Reactivity of Furfural on a Model Pt(111) Catalytic Surface. J. Phys. Chem. C 2020, 124, 26268–26278. [Google Scholar] [CrossRef]
  43. Xiong, K.; Chen, J.G. Correlating furfural reaction pathways with interactions between furfural and monometallic surfaces. Catal. Today 2020, 339, 289–295. [Google Scholar] [CrossRef]
  44. Wang, Y.T.; Zhao, D.Y.; Rodriguez-Padron, D.; Len, C. Recent Advances in Catalytic Hydrogenation of Furfural. Catalysts 2019, 9, 796. [Google Scholar] [CrossRef] [Green Version]
  45. Liu, X.; Zhang, B.; Fei, B.; Chen, X.; Zhang, J.; Mu, X. Tunable and selective hydrogenation of furfural to furfuryl alcohol and cyclopentanone over Pt supported on biomass-derived porous heteroatom doped carbon. Faraday Discuss. 2017, 202, 79–98. [Google Scholar] [CrossRef]
  46. Wang, C.; Luo, J.; Liao, V.; Lee, J.D.; Onn, T.M.; Murray, C.B.; Gorte, R.J. A comparison of furfural hydrodeoxygenation over Pt-Co and Ni-Fe catalysts at high and low H2 pressures. Catal. Today 2018, 302, 73–79. [Google Scholar] [CrossRef]
  47. Wang, G.; Yao, R.; Xin, H.; Guan, Y.; Wu, P.; Li, X. At room temperature in water: Efficient hydrogenation of furfural to furfuryl alcohol with a Pt/SiC–C catalyst. RSC Adv. 2018, 8, 37243–37253. [Google Scholar] [CrossRef] [Green Version]
  48. Chen, X.; Zhang, L.; Zhang, B.; Guo, X.; Mu, X. Highly selective hydrogenation of furfural to furfuryl alcohol over Pt nanoparticles supported on g-C3N4 nanosheets catalysts in water. Sci. Rep. 2016, 6, 28558. [Google Scholar] [CrossRef]
  49. Wu, J.; Zhang, X.; Chen, Q.; Chen, L.; Liu, Q.; Wang, C.; Ma, L. One-Pot Hydrogenation of Furfural into Tetrahydrofurfuryl Alcohol under Ambient Conditions over PtNi Alloy Catalyst. Energy Fuels 2020, 34, 2178–2184. [Google Scholar] [CrossRef]
  50. Xu, L.; Nie, R.; Lyu, X.; Wang, J.; Lu, X. Selective hydrogenation of furfural to furfuryl alcohol without external hydrogen over N-doped carbon confined Co catalysts. Fuel Process. Technol. 2020, 197, 106205. [Google Scholar] [CrossRef]
  51. Hu, D.; Xu, H.; Yi, Z.; Chen, Z.; Ye, C.; Wu, Z.; Garces, H.F.; Yan, K. Green CO2-Assisted Synthesis of Mono- and Bimetallic Pd/Pt Nanoparticles on Porous Carbon Fabricated from Sorghum for Highly Selective Hydrogenation of Furfural. ACS Sustain. Chem. Eng. 2019, 7, 15339–15345. [Google Scholar] [CrossRef]
  52. Brunauer, S.; Emmett, P.H.; Teller, E. Adsorption of gases in multimolecular layers. JACS 1938, 60, 309–319. [Google Scholar] [CrossRef]
  53. Stoeckli, F. Characterization of microporous carbons by adsorption and immersion techniques. In Porosity in Carbons: Characterization and Applications; Patrick, J.W., Ed.; Edward Arnold: London, UK, 1995; pp. 66–97. [Google Scholar]
  54. Bansal, R.C.; Donnet, J.B.; Stoeckli, F. Active Carbon; Marcel Dekker: New York, NY, USA, 1988. [Google Scholar]
  55. Barrett, E.P.; Joyner, L.G.; Halenda, P.P. The Determination of Pore Volume and Area Distributions in Porous Substances. I. Computations from Nitrogen Isotherms. JACS 1951, 73, 373–380. [Google Scholar] [CrossRef]
Figure 1. Morphology of the pure glucose and glucose–carbon hybrids: (a) CS, (b,c) CS-CNT, (d) CS-rGO, (e) CS-CB and (f) CS-AC.
Catalysts 11 00049 g001
Figure 2. N2 adsorption-isotherms obtained at −196 °C for pure glucose and glucose–carbon hybrids.
Catalysts 11 00049 g002
Figure 3. FTIR-spectra before and after thermal carbonization of some selected samples.
Catalysts 11 00049 g003
Figure 4. XRD patterns of the Pt-catalysts supported on glucose–carbon hybrids. JCPDS cards used in the peak’s assignment are also included for clarification.
Catalysts 11 00049 g004
Figure 5. TEM images and histograms (inset) of Pt-catalysts supported on glucose–carbon hybrids: (ac) Pt/CS, (df) Pt/CS-CNT, (gi) Pt/CS-rGO, (jl) Pt/CS-CB and (mo) Pt/CS-AC.
Catalysts 11 00049 g005
Scheme 1. Reactions and products involved in the hydroconversion of furfural (FUR) over Pt/carbon catalysts. The reaction products included furan (FU) from FUR decarbonylation and furfuryl alcohol (FOL) and tetrahydrofurfuryl alcohol (THFOL) from hydrogenation of the carbonyl group and/or aromatic ring.
Catalysts 11 00049 sch001
Figure 6. Evolution of the catalytic performance as a function of time on stream over the Pt-catalyst supported on the glucose-carbon nanotube hybrid (Pt/CS-CNT): (a) conversion of FUR and (b) selectivity to FOL.
Catalysts 11 00049 g006
Figure 7. Catalytic performance as a function of reaction temperature over all Pt/carbon catalysts: (a) conversion of FUR and (b) selectivity to FOL.
Catalysts 11 00049 g007
Figure 8. Products distribution obtained as a function of reaction temperature over all Pt/carbon catalysts: (a) Pt/CS, (b) Pt/CS-CNT, (c) Pt/CS-rGO, (d) Pt/CS-CB and (e) Pt/CS-AC.
Catalysts 11 00049 g008
Table 1. Textural parameters and pHPZC for the different carbon supports.
SampleSBETSmicroVmicroL0VmesopHPZC
(m2 g−1)(m2 g−1)(cm3 g−1)(nm)(cm3 g−1)
CS5413230.221.30.147.5
CS-CNT4734390.190.80.217.6
CS-rGO4785040.190.70.157.3
CS-CB4734330.190.90.087.0
CS-AC4964420.200.90.057.1
SBET = apparent surface area; Smicro = micropore surface area; Vmicro = micropore volume; L0 = mean micropore width; Vmeso = mesopore volume; pHPZC = point of the zero charge.
Table 2. Pt-particle size (dPt) estimated by X-ray powder diffraction (XRD) and transmission electron microscopy (TEM) analysis.
CatalystdPt (XRD)dPt (TEM)
(nm)(nm)
Pt/CS14.94.5
Pt/CS-CNT12.73.5
Pt/CS-rGO11.75.5
Pt/CS-CB13.64.1
Pt/CS-AC15.93.3
Table 3. Hydrogenation of FUR over different Pt-catalysts supported on carbon materials.
CatalystOperating ConditionsConversionSelectivityRef.
(%)(%)
1%Pt-40%Mo/AC150 °C, 3 bar H2, EtOH~80% at 2 h~80% FEE[21]
1%Pt/AC~75% at 2 h
0.5%Pt/CNT130 °C, 30 bar H2, EtOH64.5% at 5 h~55% FDA[24]
5%Pt/AC100 °C, 10 bar H2, water99% at 4 h99% FOL[45]
10%Pt/CB180 °C, 1 bar H2, 1-propanol80.7% at 10 min g/g49.4% FU[46]
5%Pt/C *25 °C, 10 bar H2, water~50% at 5 h~95% FOL[47]
5%Pt/C3N4100 °C, 10 bar H2, water60.9% at 5 h>99% FOL[48]
3%Pt/AC35 °C, 20 bar H2, water99% at 12 h89% FOL[49]
Pt/C150 °C, 5 bar H2, 1,4-dioxane~39.3% at 6 h~89% FOL[50]
5%Pt/C *140 °C, 60 bar H2, octane~10% at 3 h~55% FOL[51]
3%Pt/C~58% at 3 h~50% THFOL
1%Pt/CS200 °C, 1 bar, 40 cm3 min−1 H232%-This work
1%Pt/CS-CNT37%47% FU
AC = activated carbon; CNT = carbon nanotubes; CB = carbon black; C * = commercial catalyst; FU = furan; FEE= furfuryl ethyl ether; FDA = 2-furaldehyde diethyl acetal; FOL = furfuryl alcohol; THFOL = tetrahydrofurfuryl alcohol.
Publisher’s Note: MDPI stays neutral with regard to jurisdictional claims in published maps and institutional affiliations.

