Microkinetic Modeling of the Oxidation of Methane Over PdO Catalysts—Towards a Better Understanding of the Water Inhibition Effect


Abstract
:
1. Introduction
2. Results and Discussion
2.1. Experimental Results
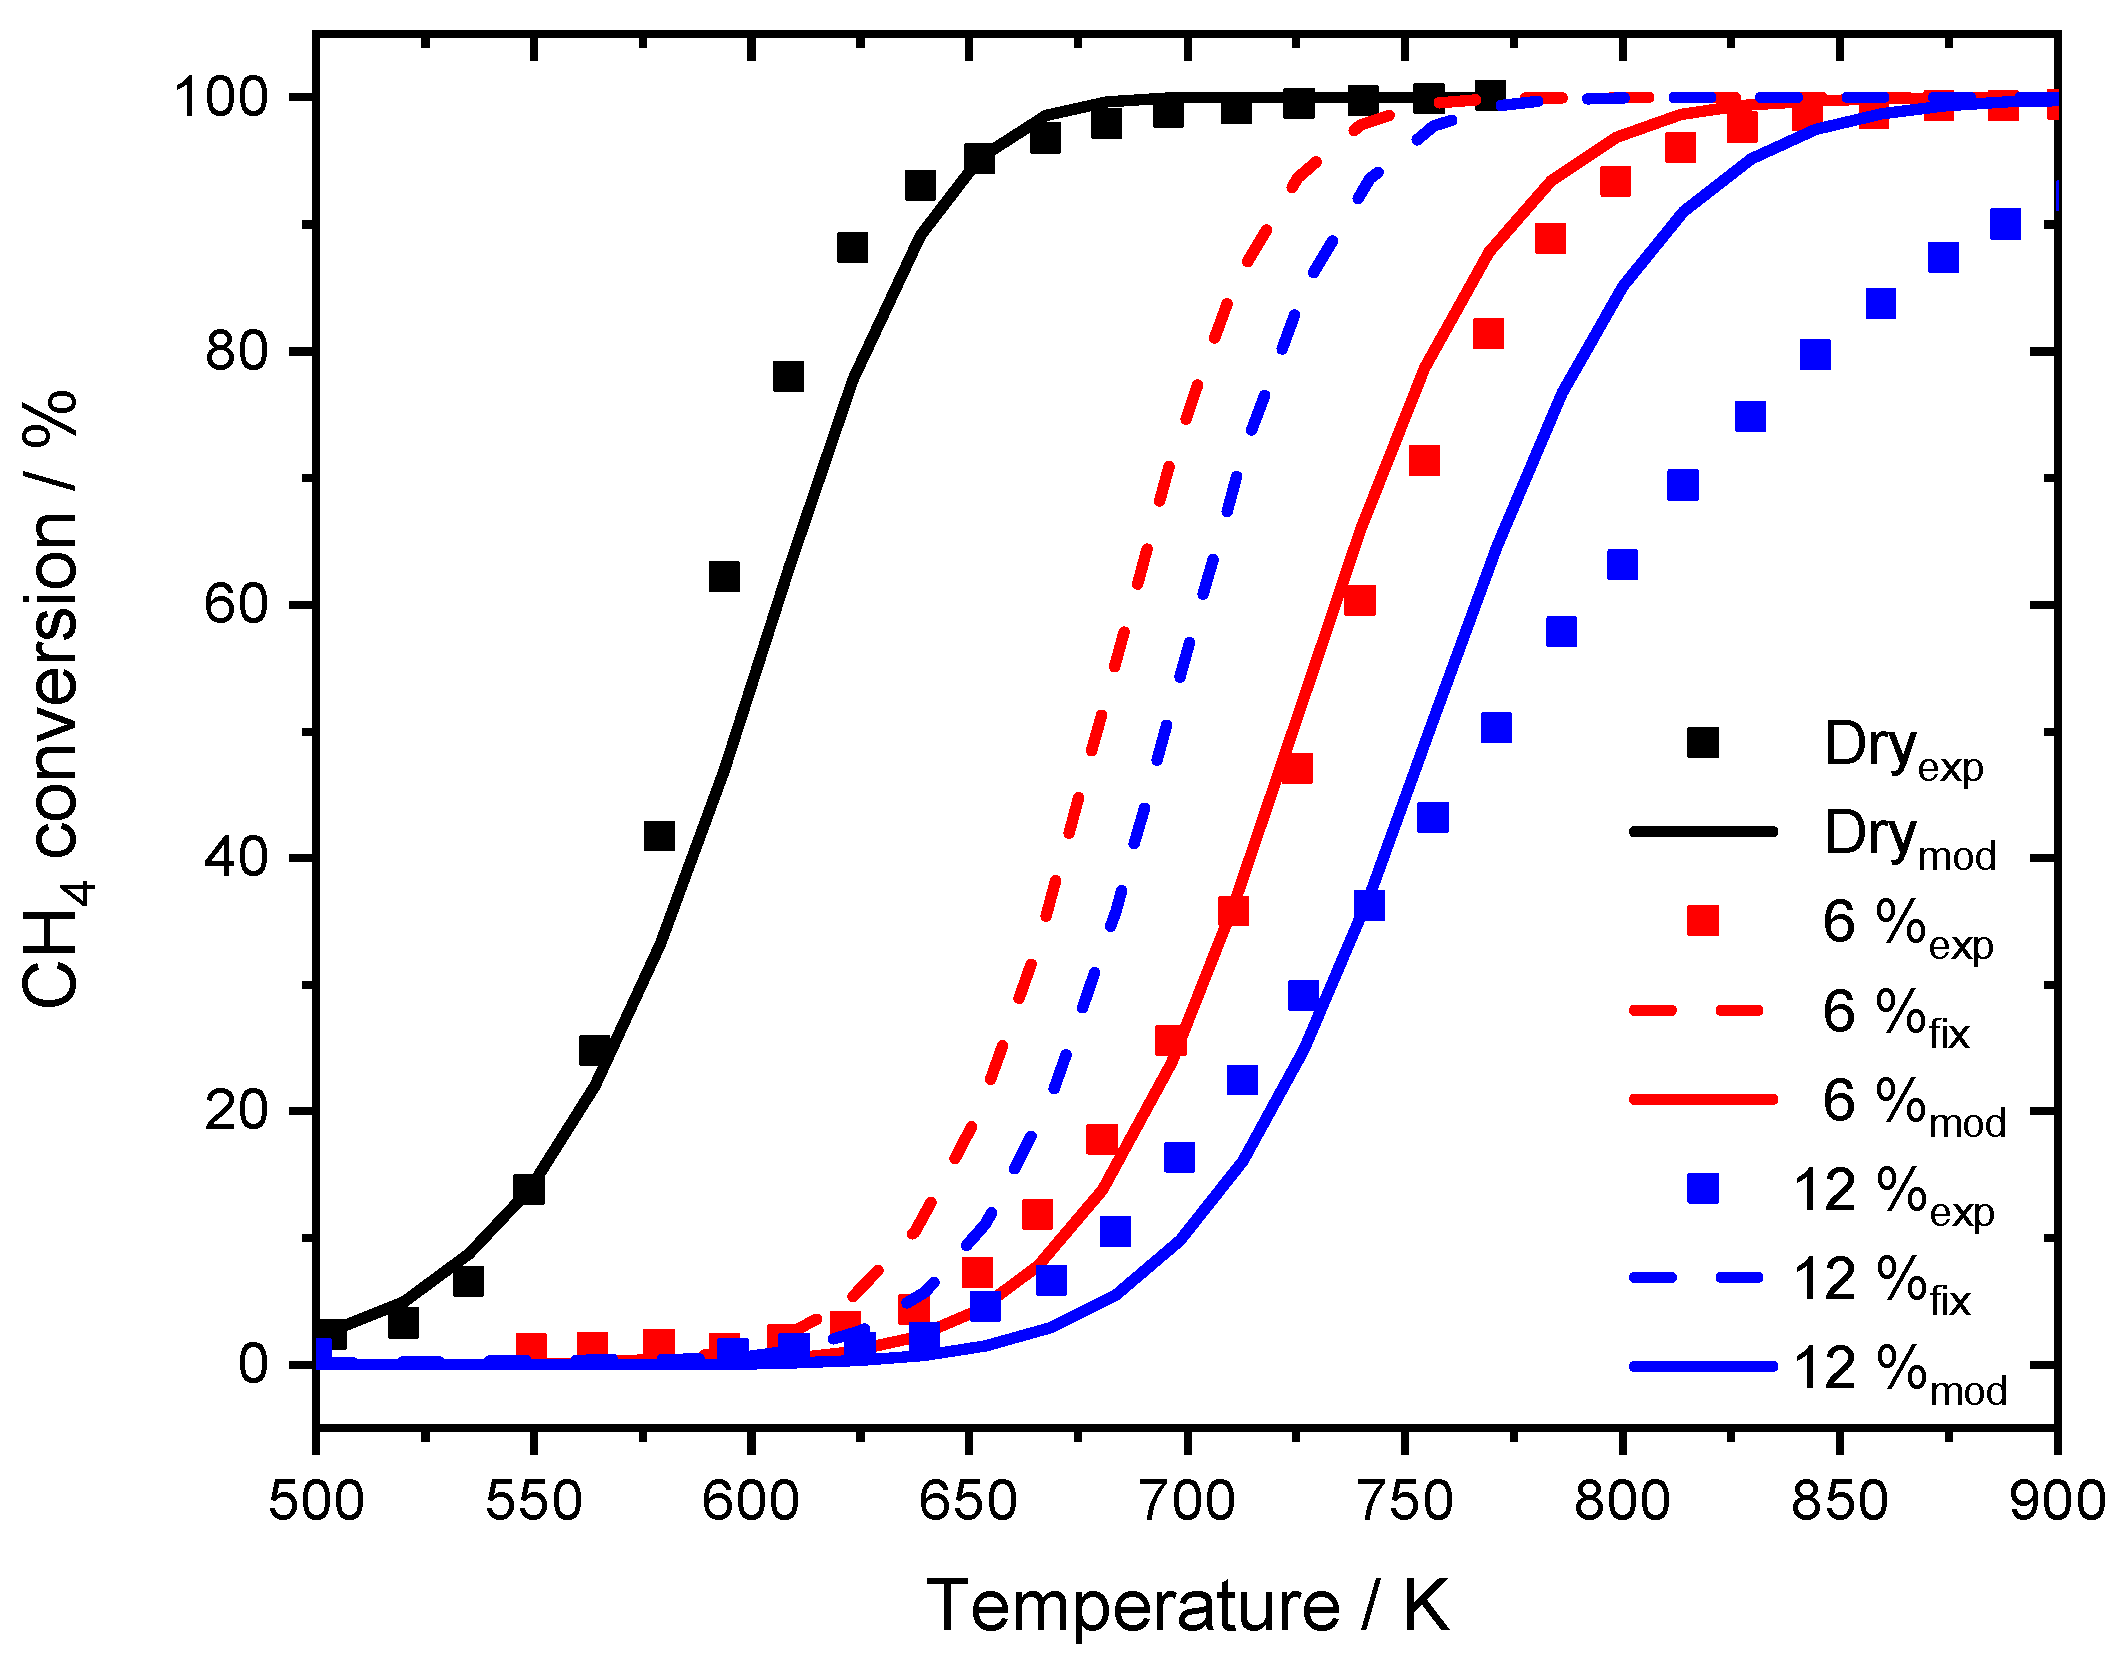
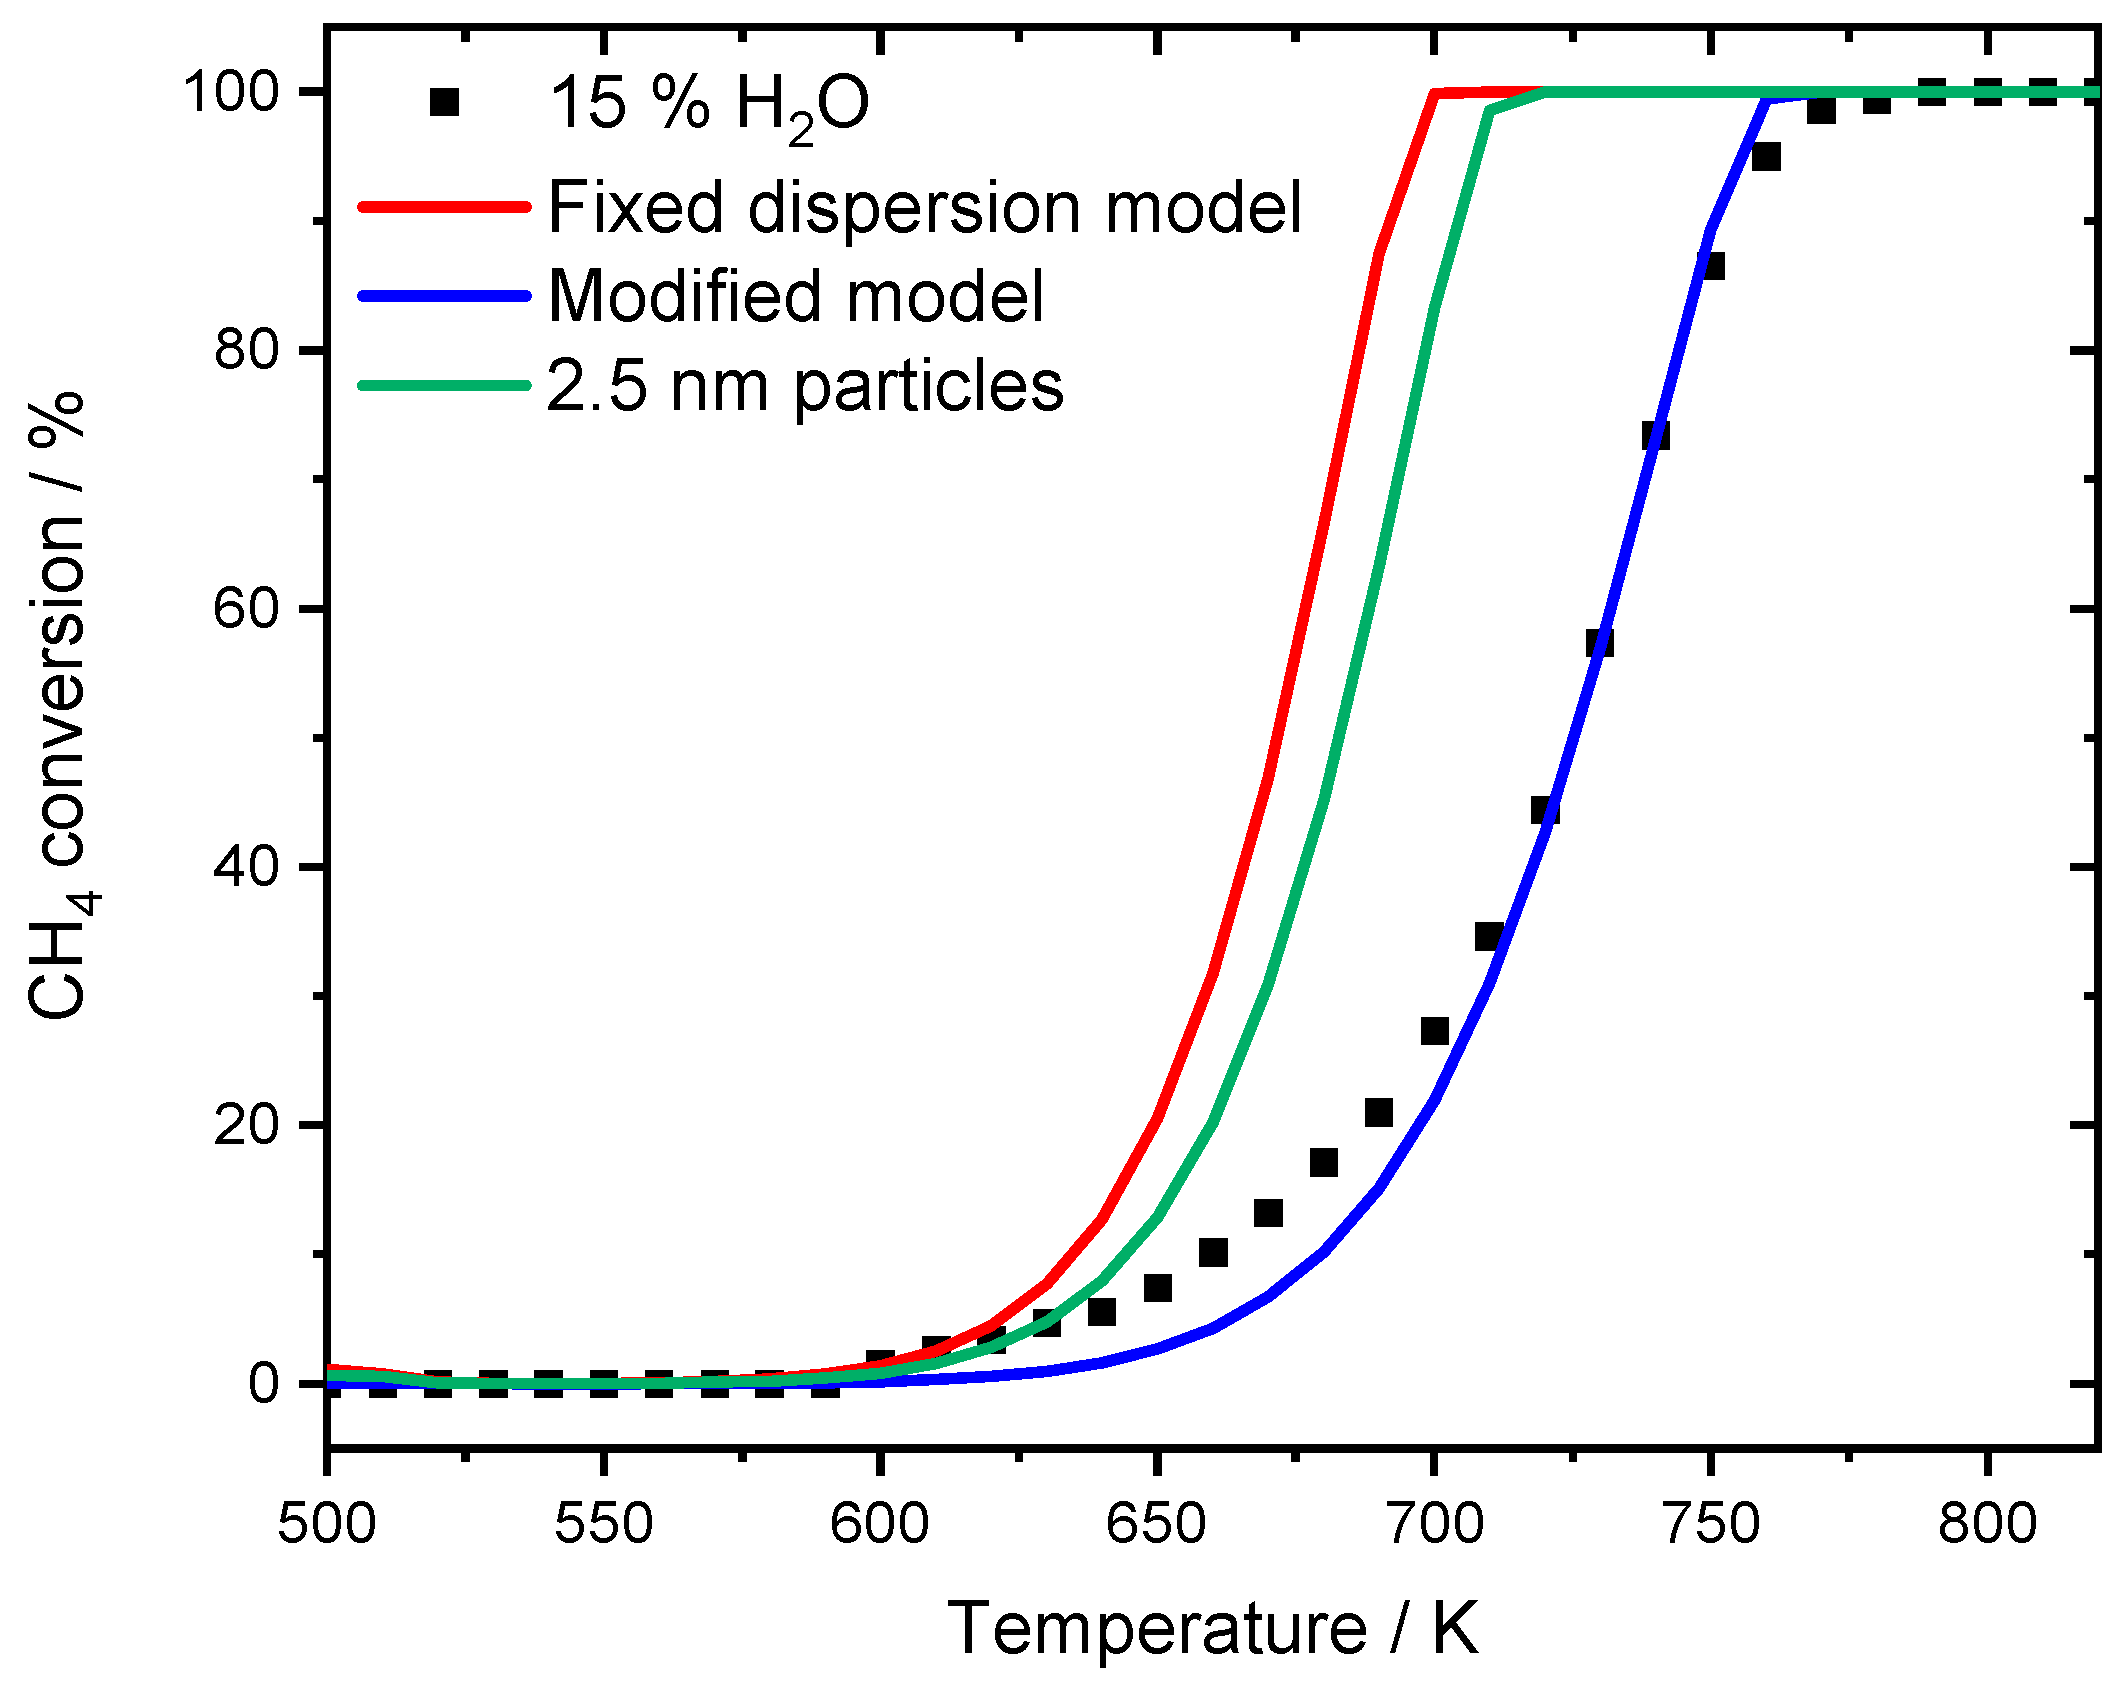
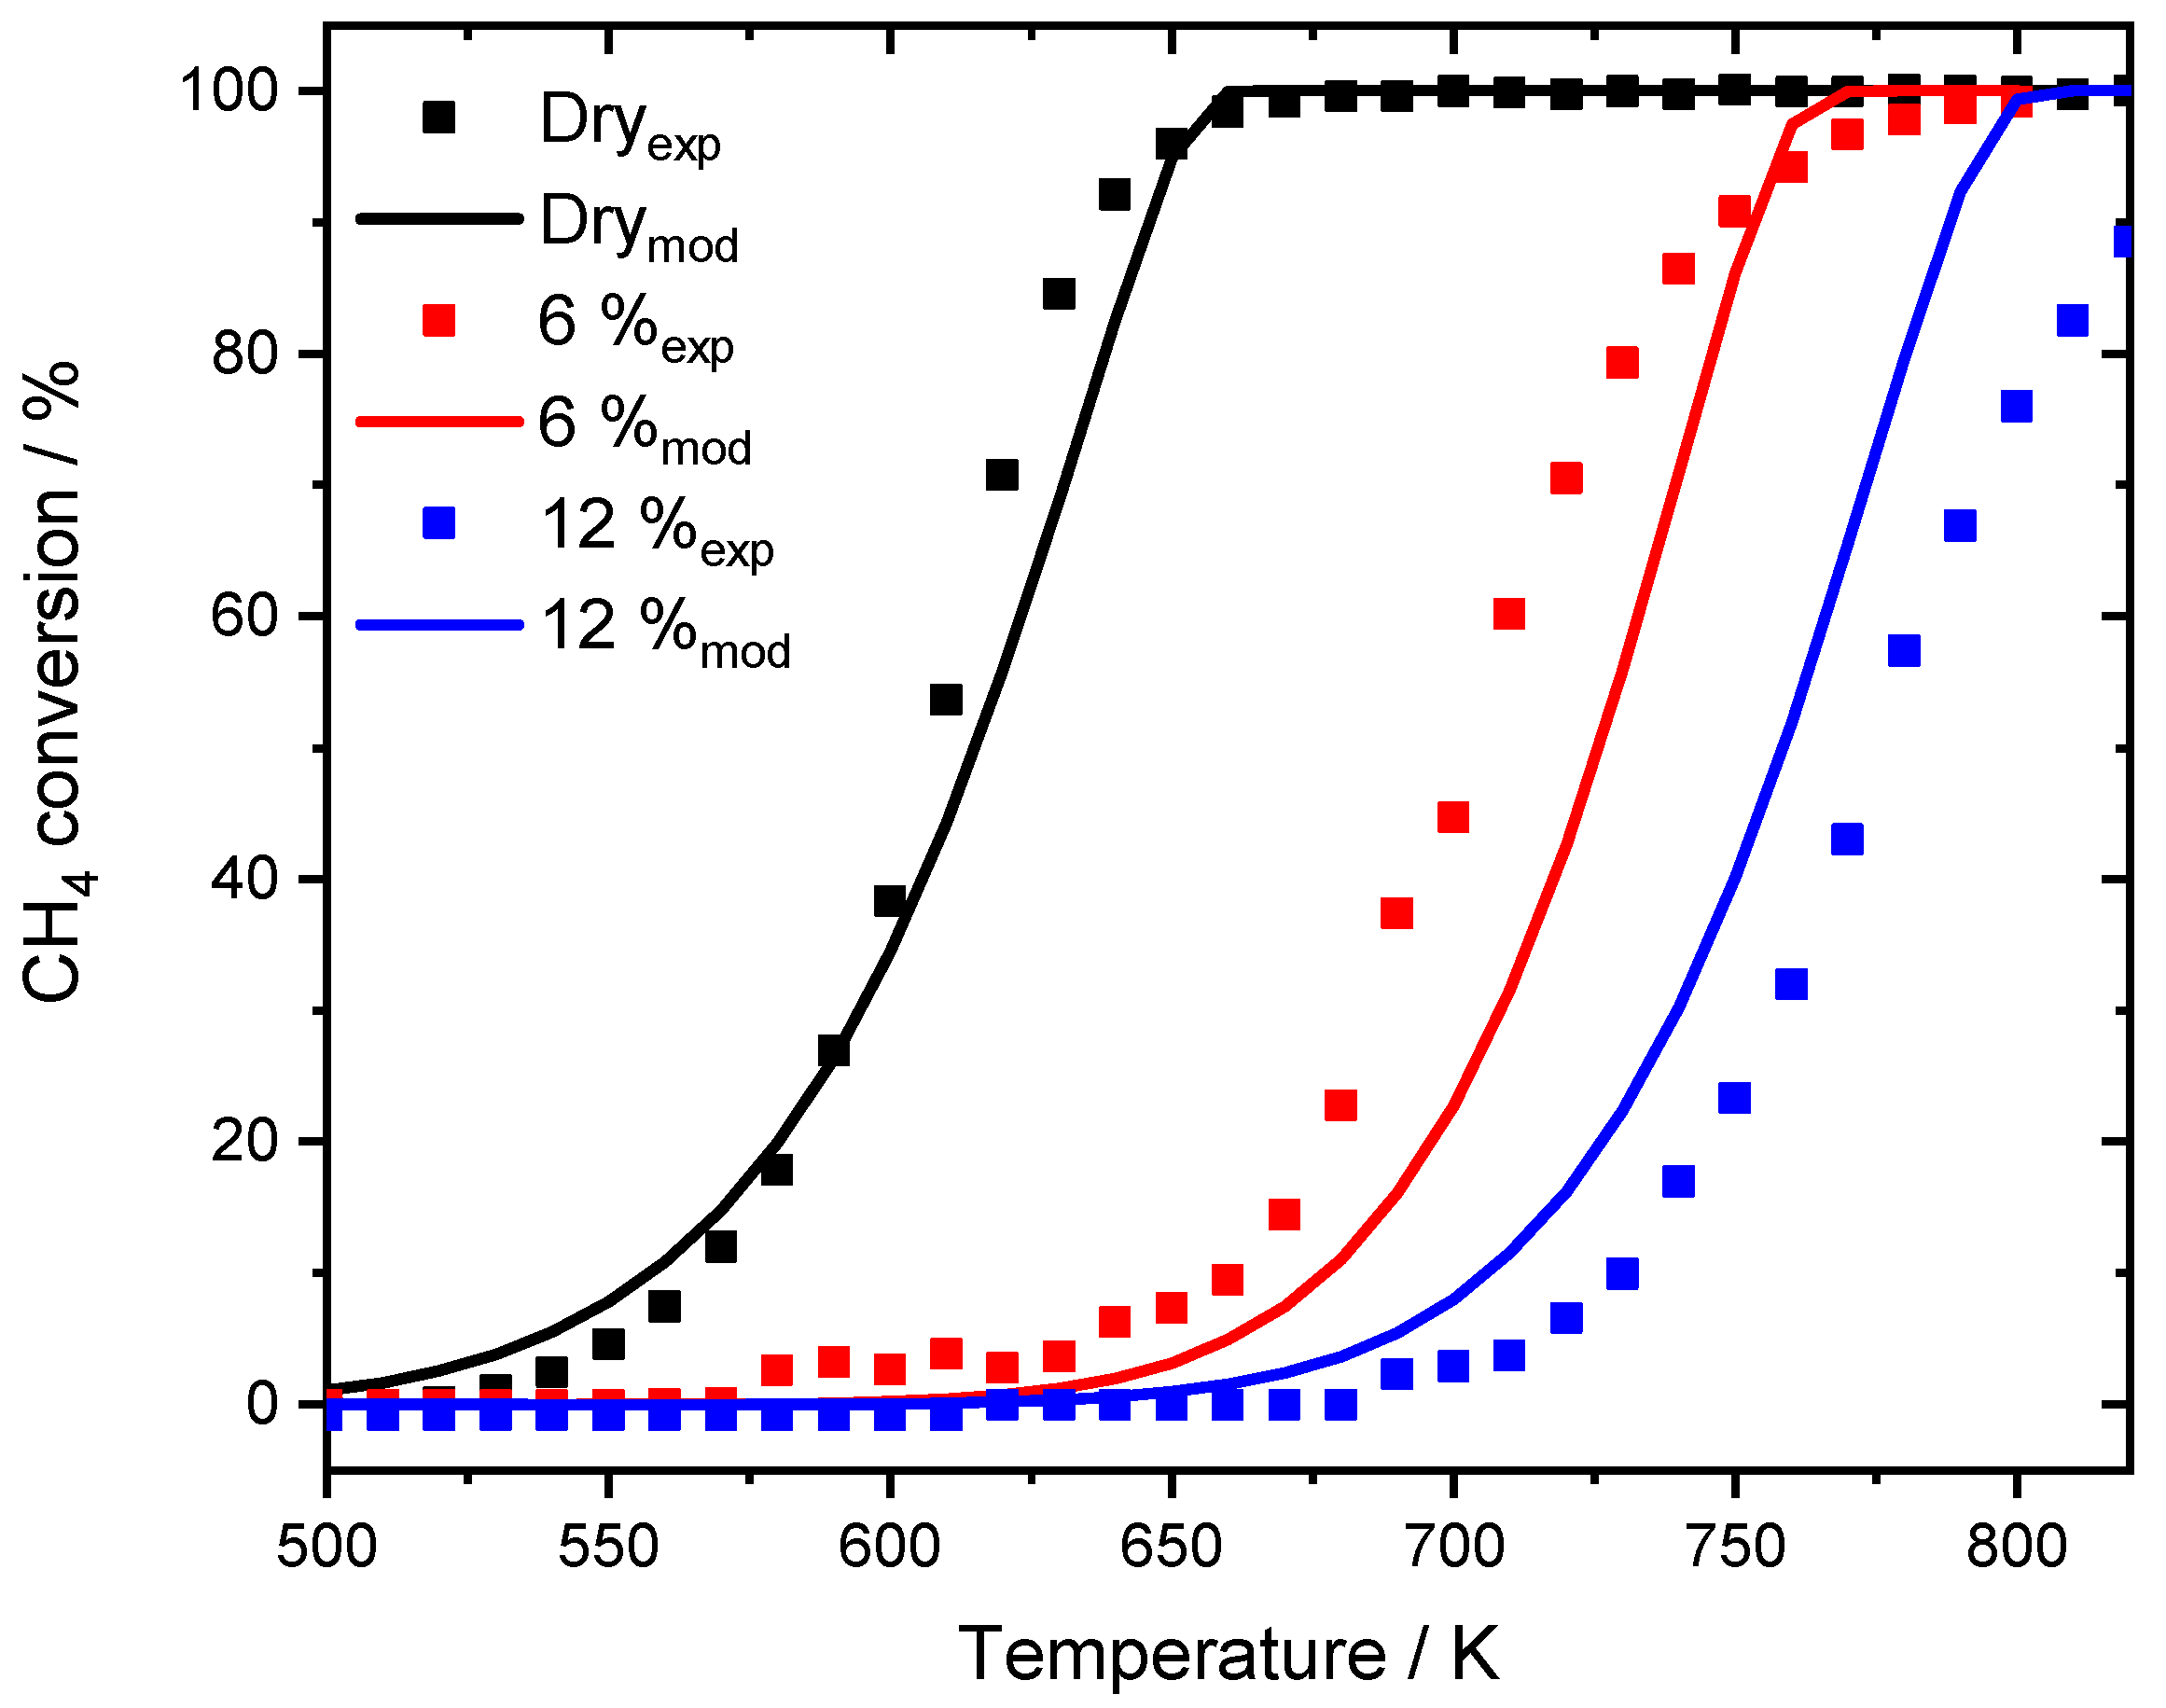
2.2. Modeling the Water Inhibition Effect
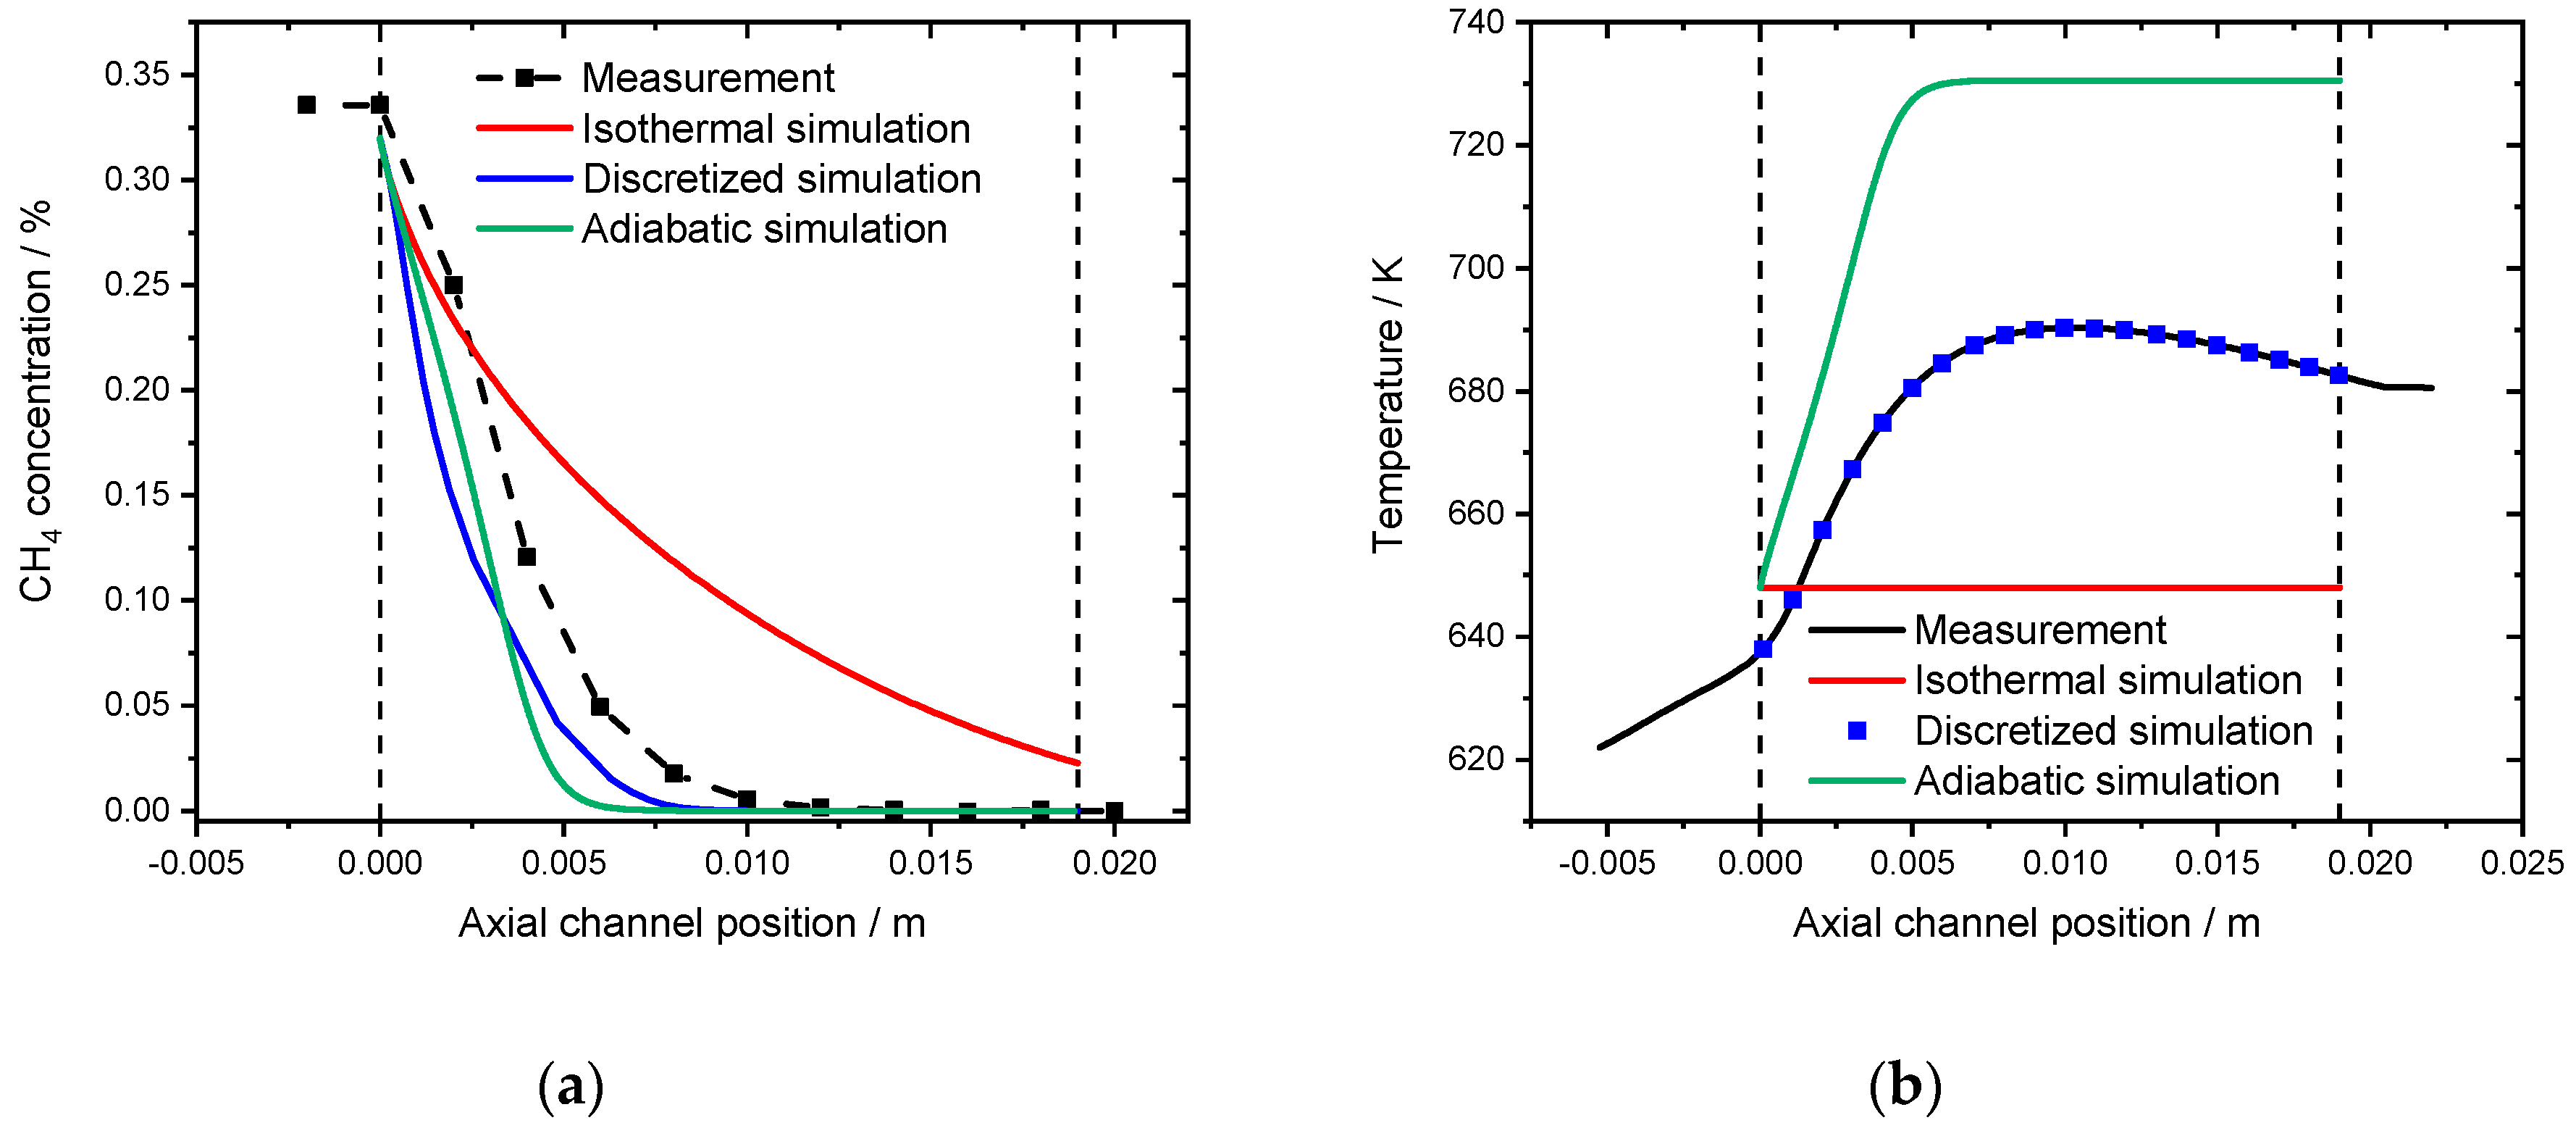
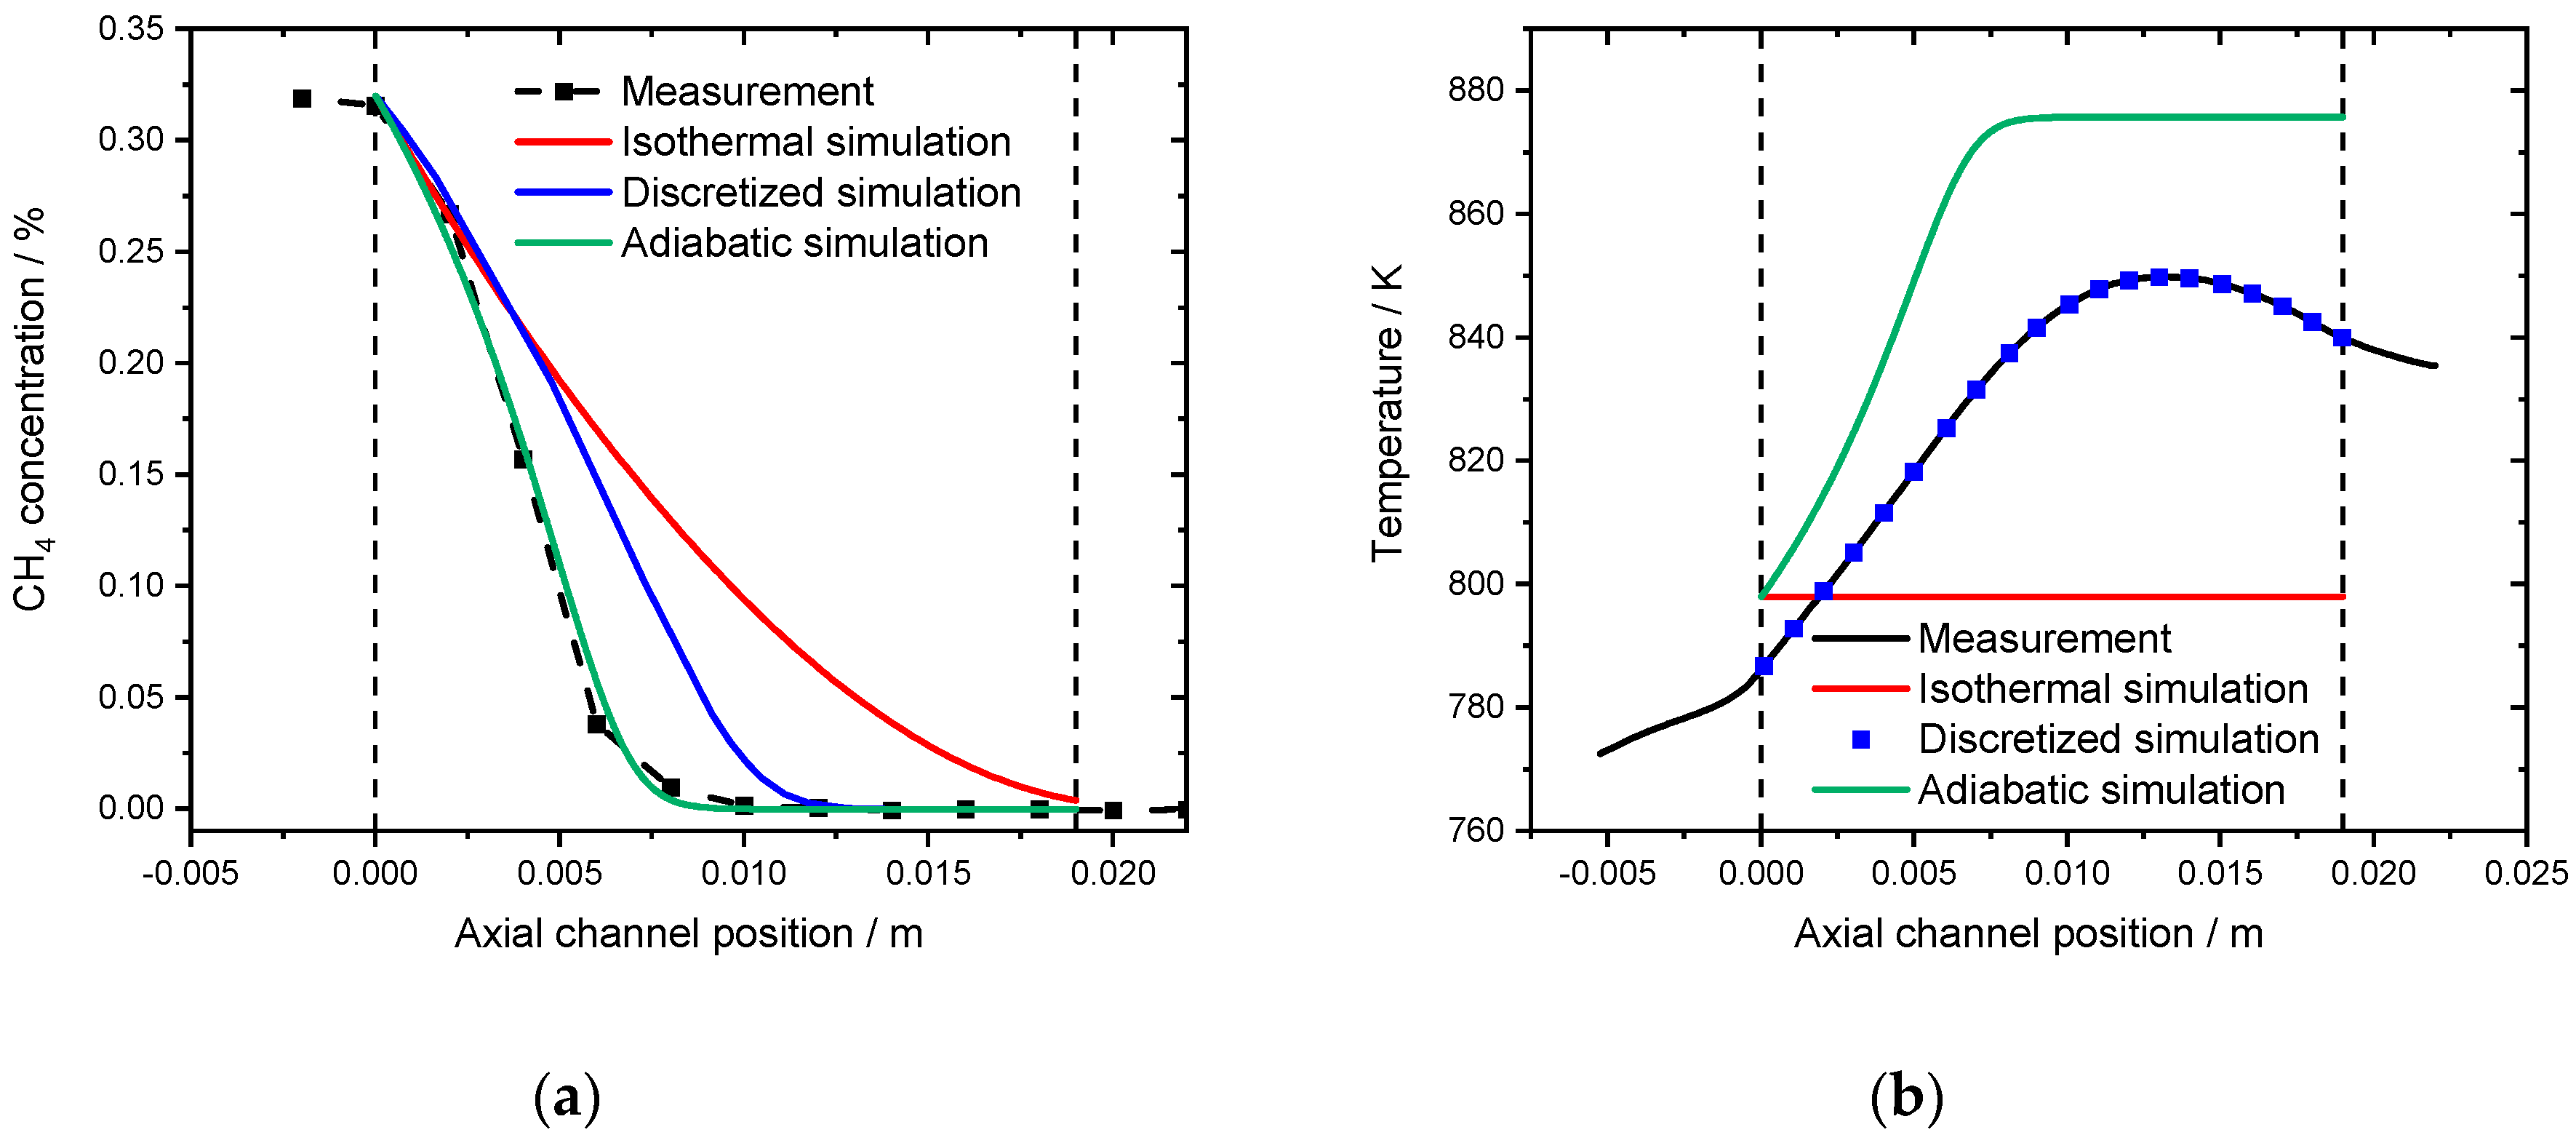
2.3. Modeling Spatially Resolved Concentration Profiles
3. Materials and Methods
3.1. Experimental
3.2. Activity Tests
3.3. Spatially Resolved Profiles
3.4. Computational Methods—Reactor Model
3.5. Chemical Model
3.6. Model Development
4. Conclusions
Author Contributions
Funding
Acknowledgments
Conflicts of Interest
Appendix A

| Nr. | Adsorption/Desorption Reaction | ||||||
| R1 | CH4(g) + (a) + (b)⇄ CH3(a) + H(b) | 4.582∙10− 02 | −0.001 | 33.155 | 1.034∙10+ 21 | 0.003 | 106.18 |
| R2 | CH4(g) + OH(a) + (a)⇄ CH3(a) + H2O(b) | 1.510∙10− 02 | 0.001 | 28.860 | 7.071∙10+ 19 | −0.004 | 104.259 |
| R3 | CH4(g) + O(a) + (a)⇄ CH3(a) + OH(a) | 3.082∙10− 02 | 0.007 | 26.234 | 2.695∙10+ 20 | −0.029 | 192.865 |
| R4 | O2(g) + (a) ⇄ O2(a) | 5.710∙10− 02 | 0.0 | 0.0 | 6.702∙10+ 15 | −0.031 | 63.541 |
| R5 | O2(g) + vac(b) ⇄ O2(b) | 5.710∙10− 02 | 0.0 | 0.0 | 7.024∙10+ 15 | −0.027 | 159.975 |
| R6 | H2O(g) + O(a) + (a) ⇄ 2OH(a) | 1.400∙10− 01 | 0.0 | 0.0 | 3.307∙10+ 20 | 0.013 | 191.178 |
| R7 | H2O(g) + (a) ⇄ H2O(a) | 1.400∙10− 01 | 0.0 | 0.0 | 6.297∙10+ 12 | 0.045 | 99.946 |
| R8 | CO2(g) + (a) ⇄ CO2(a) | 4.910∙10− 02 | 0.0 | 0.0 | 4.087∙10+ 14 | 0.029 | 65.097 |
| Nr. | Surface Reaction | ||||||
| R9 | CH3(a) + (b) ⇄ CH3(b) + (a) | 1.494∙10+ 22 | 0.008 | 131.139 | 2.441∙10+ 23 | 0.008 | 181.201 |
| R10 | CH3(b) + O(a) ⇄ CH2(b) + OH(a) | 1.250∙10+ 22 | 0.012 | 33.366 | 1.855∙10+ 22 | −0.012 | 303.074 |
| R11 | CH3(a) + OH(a) ⇄ CH2(b) + H2O(a) | 1.398∙10+ 22 | −0.004 | 33.193 | 1.111∙10+ 22 | 0.004 | 221.667 |
| R12 | CH3(a) + O(a) ⇄ CH2OH(a) + (a) | 3.534∙10+ 21 | 0.016 | 30.953 | 2.466∙10+ 23 | −0.016 | 333.447 |
| R13 | CH3(a) + OH(a) ⇄ CH2(a) + H2O(a) | 2.014∙10+ 21 | 0.004 | 73.228 | 1.175∙10+ 22 | −0.004 | 116.851 |
| R14 | CH2(a) + OH(a) ⇄ CH2OH(a) + (a) | 3.420∙10+ 21 | −0.004 | 12.581 | 2.191∙10+ 22 | 0.004 | 180.219 |
| R15 | CH2OH(a) + (b) ⇄ CH2O(b) + H(b) | 1.917∙10+ 22 | 0.012 | 12.654 | 3.348∙10+ 20 | −0.012 | 57.646 |
| R16 | CH2O(a) + OH(a) ⇄ CHO(a) + H2O(a) | 5.608∙10+ 21 | 0.012 | 51.570 | 2.119∙10+ 22 | −0.012 | 192.230 |
| R17 | CHO(a) + OH(a) ⇄ CO(a) + H2O(a) | 5.921∙10+ 22 | 0.008 | 65.968 | 8.990∙10+ 21 | −0.008 | 267.530 |
| R18 | CH3(a) + (b) ⇄ CH2(a) + H(b) | 1.827∙10+ 21 | 0.0 | 123.976 | 5.137∙10+ 22 | 0.0 | 165.224 |
| R19 | CH2(a) + (b) ⇄ CH2(b) + (a) | 1.257∙10+ 22 | 0.0 | 13.103 | 2.797∙10+ 22 | 0.0 | 198.017 |
| R20 | CH2(a) + (b) ⇄ CH(a) + H(b) | 3.793∙10+ 22 | 0.008 | 112.541 | 2.987∙10+ 22 | −0.008 | 163.159 |
| R21 | CH(a) + (b) ⇄ CHO(a) + vac(b) | 2.103∙10+ 21 | 0.008 | 24.821 | 1.218∙10+ 21 | −0.008 | 215.219 |
| R22 | CH2(b) + (a) ⇄ CH2O(a) + vac(b) | 2.155∙10+ 22 | 0.008 | 91.22 | 2.425∙10+ 20 | −0.008 | 9.038 |
| R23 | CH2O(a) + (b) ⇄ CHO(a) + H(b) | 3.274∙10+ 21 | 0.008 | 69.676 | 5.962∙10+ 22 | −0.008 | 207.964 |
| R24 | CHO(a) + (b) ⇄ CO(a) + H(b) | 1.088∙10+ 32 | 0.004 | 55.610 | 7.956∙10+ 22 | −0.004 | 254.800 |
| R25 | CHO(a) + (b) ⇄ CHO(b) + (a) | 2.746∙10+ 22 | 0.018 | 76.549 | 6.754∙10+ 21 | −0.018 | 106.611 |
| R26 | CHO(b) + (a) ⇄ CO(b) + H(a) | 2.732∙10+ 12 | −0.002 | 141.937 | 2.123∙10+ 21 | 0.002 | 263.113 |
| R27 | CO(a) + (b) ⇄ (a) + CO(b) | 1.313∙10+ 12 | 0.011 | 33.868 | 2.212∙10+ 21 | −0.011 | 16.262 |
| R28 | CO(b) + (a) ⇄ CO2(a) + vac(b) | 1.40∙10+ 21 | 0.010 | 42.023 | 9.554∙10+ 20 | −0.010 | 78.477 |
| R29 | H(b) + (a) ⇄ OH(a) + vac(b) | 1.886∙10+ 22 | 0.0 | 137.8 | 4.222∙10+ 21 | 0.0 | 27.9 |
| R30 | O2(a) + (a) ⇄ O(a) + O(a) | 3.815∙10+ 22 | 0.005 | 174.961 | 1.744∙10+ 21 | −0.005 | 59.139 |
| R31 | O(b) + (a) ⇄ O(a) + (b) | 2.380∙10+ 22 | 0.027 | 116.625 | 1.797∙10+ 21 | −0.027 | 107.875 |
| R32 | O(a) + vac(b) ⇄ (a) + (b) | 8.012∙10+ 21 | 0.020 | 48.597 | 1.387∙10+ 22 | −0.020 | 252.103 |
| R33 | O2(a) + vac(b) ⇄ O(a) + (b) | 1.196∙10+ 24 | 0.025 | 81.408 | 9.469∙10+ 22 | −0.025 | 169.092 |
| R34 | H(b) + (a) ⇄ H(a) + (b) | 6.133∙10+ 22 | 0.002 | 148.173 | 9.505∙10+ 21 | −0.002 | 117.827 |
| R35 | CHO(b) + OH(a) ⇄ H2O(a) + CO(b) | 2.992∙10+ 22 | 0.001 | 2.168 | 3.113∙10+ 22 | −0.001 | 156.062 |
| R36 | CHO(b) + (a) ⇄ HCOO(a) + vac(b) | 3.658∙10+ 21 | 0.0 | 11.580 | 1.210∙10+ 21 | 0.0 | 8.680 |
| R37 | HCOO(a) + OH(a) ⇄ CO2(a) + H2O(a) | 2.305∙10+ 23 | 0.011 | 193.191 | 4.912∙10+ 23 | −0.011 | 376.439 |
| R38 | HCOO(a) + (b) ⇄ H(b) + CO2(a) | 1.681∙10+ 23 | 0.007 | 177.623 | 1.726∙10+ 24 | −0.007 | 368.497 |
| R39 | H2O(a) + (b) ⇄ OH(a) + H(b) | 3.659∙10+ 21 | 0.0 | 12.5 | 1.763∙10+ 22 | 0.008 | 10.126 |
References
- Lewandowska-Bernat, A.; Desideri, A. Opportunities of power-to-gas technology in different energy systems architectures. Appl. Energy 2018, 228, 57–67. [Google Scholar] [CrossRef]
- Eveloy, V.; Gebreegziabher, T. A review of projected power-to-gas deployment scenarios. Energies 2018, 11, 1824. [Google Scholar] [CrossRef] [Green Version]
- Engerer, H.; Horn, M. Natural gas vehicles: An option for Europe. Energy Policy 2010, 38, 1017–1029. [Google Scholar] [CrossRef]
- Deutschmann, O.; Grunwaldt, J.-D. Exhaust gas aftertreatment in mobile systems: Status, challenges, and perspectives. Chem.-Ing.-Tech. 2013, 85, 595–617. [Google Scholar] [CrossRef]
- Gremminger, A.; Pihl, J.; Casapi, M.; Grunwaldt, J.-D.; Toops, T.J. PGM based catalysts for exhaust-gas after-treatment under typical diesel, gasoline and gas engine conditions with focus on methane and formaldehyde oxidation. Appl. Catal. B 2020, 15, 118571. [Google Scholar] [CrossRef]
- Karion, A.; Sweeney, C.; Pétron, G.; Frost, G.; Hardesty, R.M.; Kofler, J.; Miller, B.R.; Newberger, T.; Wolter, S.; Banta, R.; et al. Methane emissions estimate from airborne measurements over a western United States natural gas field. Geophys. Res. Lett. 2013, 40, 4393–4397. [Google Scholar] [CrossRef]
- Ciuparu, D.; Lyubovsky, M.R.; Altmann, E.; Pfefferle, L.D.; Datye, A.T. Catalytic combustion of methane over palladium-based catalysts. Catal. Rev. Sci. Eng. 2002, 44, 593–649. [Google Scholar] [CrossRef]
- Gelin, P.; Primet, M. Complete oxidation of methane at low temperature over noble metal based catalysts: A review. Appl. Catal. B 2002, 39, 1–37. [Google Scholar] [CrossRef]
- Ciuparu, D.; Bozon-Verduraz, F.; Pfefferle, L.D. Oxygen exchange between palladium and oxide supports in combustion catalysts. J. Phys. Chem. B 2002, 106, 3434–3442. [Google Scholar] [CrossRef]
- Ciuparu, D.; Perkins, E.; Pfefferle, L.D. In situ DR-FTIR investigation of surface hydroxyls on γ-Al2O3 supported PdO catalysts during methane combustion. Appl. Catal. A 2004, 263, 145–153. [Google Scholar] [CrossRef]
- Au-Yeung, J.; Chen, K.; Bell, A.T.; Iglesia, E. Isotopic studies of methane oxidation pathways on PdO catalysts. J. Catal. 1999, 188, 132–139. [Google Scholar] [CrossRef] [Green Version]
- Ciuparu, D.; Altman, E.; Pfefferle, L. Contributions of lattice oxygen in methane combustion over PdO-based catalysts. J. Catal. 2001, 203, 64–74. [Google Scholar] [CrossRef]
- Müller, C.A.; Maciejewski, M.; Koeppel, R.A.; Baiker, A. Combustion of methane over palladium/zirconia: Effect of Pd-particle size and role of lattice oxygen. Catal. Today 1999, 47, 245–252. [Google Scholar] [CrossRef]
- Stakheev, A.Y.; Batkin, A.M.; Teleguina, N.S.; Bragina, O.; Zaikovsky, V.I.; Prosvirin, I.P.; Khudorozhkov, A.K.; Bukhtiyarov, V.I. Particle Size Effect on CH4 Oxidation Over Noble Metals: Comparison of Pt and Pd Catalysts. Top. Catal. 2013, 56, 306–310. [Google Scholar] [CrossRef]
- Chin, Y.C.; Buda, C.; Neurock, M.; Iglesia, E. Consequences of Metal–Oxide Interconversion for C–H Bond Activation during CH4 Reactions on Pd Catalysts. J. Am. Chem. Soc. 2013, 135, 15425–15442. [Google Scholar] [CrossRef] [PubMed]
- Rogal, J.; Reuter, K.; Scheffler, M. Thermodynamic stability of PdO surfaces. Phys. Rev. B 2004, 69, 075421. [Google Scholar] [CrossRef] [Green Version]
- Lundgren, E.; Gustafson, J.; Mikkelsen, A.; Andersen, J.N.; Stierle, A.; Dosch, H.; Todorova, M.; Rogal, J.; Reuter, K.; Scheffler, M. Kinetic hindrance during the initial oxidation of Pd (100) at ambient pressures. Phys. Rev. Lett. 2004, 92, 046101. [Google Scholar] [CrossRef] [Green Version]
- Cargnello, M.; Jaen, J.J.D.; Garrido, J.C.H.; Bakhmutsky, K.; Montini, T.; Gamez, J.J.C.; Gorte, R.J.; Fornasiero, P. Exceptional activity for methane combustion over modular Pd CeO2 subunits on functionalized Al2O3. Science 2012, 337, 713–717. [Google Scholar] [CrossRef]
- Colussi, S.; Trovarelli, A.; Groppi, G.; Llorca, J. The effect of CeO2 on the dynamics of Pd–PdO transformation over Pd/Al2O3 combustion catalysts. Catal. Commun. 2007, 8, 1263–1266. [Google Scholar] [CrossRef]
- Gremminger, A.T.; de Carvalho, H.W.P.; Popescu, R.; Grunwaldt, J.-D.; Deutschmann, O. Influence of gas composition on activity and durability of bimetallic Pd-Pt/Al2O3 catalysts for total oxidation of methane. Catal. Today 2015, 258, 470–480. [Google Scholar] [CrossRef]
- Gremminger, A.T.; Lott, P.; Merts, M.; Casapu, M.; Grunwaldt, J.-D.; Deutschmann, O. Sulfur poisoning and regeneration of bimetallic Pd-Pt methane oxidation catalysts. Appl. Catal B 2017, 218, 833–843. [Google Scholar] [CrossRef]
- Lott, P.; Dolcet, P.; Casapu, M.; Grunwaldt, J.-D.; Deutschmann, O. The Effect of Prereduction on the Performance of Pd/Al2O3 and Pd/CeO2 Catalysts during Methane Oxidation. Ind. Eng. Chem. Res. 2019, 58, 12561–12570. [Google Scholar] [CrossRef]
- Karinshak, K.A.; Lott, P.; Harold, M.P.; Deutschmann, O. In situ activation of bimetallic Pd-Pt methane oxidation catalysts. Chem. Cat. Chem. 2020, 12, 1–10. [Google Scholar]
- Stotz, H.; Maier, L.; Deutschmann, O. Methane oxidation over palladium: On the mechanism in fuel-rich mixtures at high temperatures. Top. Catal. 2017, 60, 83–109. [Google Scholar] [CrossRef]
- Stotz, H.; Maier, L.; Boubnov, A.; Gremminger, A.; Grunwaldt, J.-D.; Deutschmann, O. Surface reaction kinetics of methane oxidation over PdO. J. Catal. 2019, 370, 152–175. [Google Scholar] [CrossRef]
- Farrauto, R.J.; Hobson, M.C.; Kennelly, T.; Waterman, E.M. Catalytic chemistry of supported palladium for combustion of methane. Appl. Catal. A 1992, 81, 227–237. [Google Scholar] [CrossRef]
- Grunwaldt, J.-D.; van Vegten, N.; Baiker, A. Insight into the structure of supported palladium catalysts during the total oxidation of methane. Chem. Commun. 2007, 4635–4637. [Google Scholar] [CrossRef]
- Torkashvand, B.; Gremminger, A.; Valchera, S.; Casappu, M. The impact of pre-turbine catalyst placement on methane oxidation in lean-burn gas engines: An experimental and numerical study. SAE Tech. Pap. 2017, 1019. [Google Scholar] [CrossRef]
- Torkashvand, B.; Maier, L.; Hettel, M.; Schedlbauer, T.; Grunwaldt, J.-D.; Deutschmann, O. On the challenges and constrains of ultra-low emission limits: Formaldehyde oxidation in catalytic sinusoidal-shaped channels. Chem. Eng. Sci. 2019, 195, 841–850. [Google Scholar] [CrossRef]
- Ovesen, C.; Clausen, B.; Schiøtz, J.; Stoltze, P.; Topsøe¸, H.; Nørskov, E.J. Kinetic implications of dynamical changes in catalyst morphology during methanol synthesis over Cu/ZnO catalysts. J. Catal. 1997, 168, 133–142. [Google Scholar] [CrossRef]
- Grunwaldt, J.-D.; Molenbroek, A.; Topsøe, N.-Y.; Topsøe, H.; Clausen, B. In situ investigations of structural changes in Cu/ZnO catalysts. J. Catal. 2000, 194, 452–460. [Google Scholar] [CrossRef]
- Hansen, P.L.; Wagner, J.B.; Helveg, S.; Rostrup-Nielsen, J.R.; Clausen, B.S.; Topsøe, H. Atom-resolved imaging of dynamic shape changes in supported copper nanocrystals. Science 2002, 295, 2053–2055. [Google Scholar] [CrossRef] [PubMed]
- Barrett, W.; Shen, J.; Hu, Y.; Hayes, R.E.; Scott, R.W.J.; Semagina, N. Understanding the Role of SnO2 Support in Water-Tolerant Methane Combustion: In situ Observation of Pd(OH)2 and Comparison with Pd/Al2O3. ChemCatChem 2019, 12, 944–952. [Google Scholar] [CrossRef]
- Livio, D.; Diehm, C.; Donazzi, A.; Beretta, A.; Deutschmann, O. Catalytic partial oxidation of ethanol over Rh/Al2O3: Spatially resolved temperature and concentration profiles. Appl. Catal. A 2013, 467, 530–541. [Google Scholar] [CrossRef]
- Chan, D.; Tischer, S.; Heck, J.; Diehm, C.; Deutschmann, O. Correlation between catalytic activity and catalytic surface area of a Pt/Al2O3 DOC: An experimental and microkinetic modeling study. Appl. Catal. B 2014, 156–157, 153–165. [Google Scholar] [CrossRef]
- Schedlbauer, T.; Lott, P.; Casapu, M.; Störmer, H.; Deutschmann, O. Impact of the Support on the Catalytic Performance, Inhibition Effects and SO2 Poisoning Resistance of Pt-Based Formaldehyde Oxidation Catalysts. Top. Catal. 2018, 62, 198–205. [Google Scholar] [CrossRef]
- Hettel, M.; Diehm, C.; Torkashvand, B.; Deutschmann, O. Critical evaluation of in situ probe techniques for catalytic honeycomb monoliths. Catal. Today 2013, 216, 2–10. [Google Scholar] [CrossRef]
- Brunauer, S.; Emmett, P.H.; Teller, E. Adsorption of gases in multimolecular layers. J. Am. Chem. Soc. 1938, 60, 309–319. [Google Scholar] [CrossRef]
- Groppi, G.; Ibashi, W.; Tronconi, E.; Forzatti, P. Structured reactors for kinetic measurements under severe conditions in catalytic combustion over palladium supported systems. Catal. Today 2001, 69, 399–408. [Google Scholar] [CrossRef]
- Deutschmann, O.; Tischer, S.; Correa, C.; Chatterjee, D.; Kleditzsch, S.; Janardhanan, V.M.; Mladenov, N.; Minh, H.D.; Karadeniz, H.; Hettel, M. DETCHEM Software Package, 2.6 ed., Karlsruhe 2020. Available online: http://www.detchem.com (accessed on 11 August 2020).
- Pushnov, A.S. Calculation of average bed porosity. Chem. Pet. Eng. 2006, 42, 14–17. [Google Scholar] [CrossRef]
- Delgado, K.; Maier, L.; Tischer, S.; Zellner, A.; Stotz, H.; Deutschmann, O. Surface reaction kinetics of steam-and CO2-reforming as well as oxidation of methane over nickel-based catalysts. Catalysts 2015, 5, 871–904. [Google Scholar] [CrossRef] [Green Version]
- Bergeret, G.; Gallezot, P. Makrokinetics and Transport Processes. In Handbook of Heterogeneous Catalysis, 2nd ed.; Wiley-VCH: Weinheim, Germany, 2008. [Google Scholar]
- Van den Bossche, M.; Grönbeck, H. Methane oxidation over PdO (101) revealed by first-principles kinetic modeling. J. Am. Chem. Soc. 2015, 137, 12035–12044. [Google Scholar] [CrossRef] [PubMed]
- Gossler, H.; Maier, L.; Angeli, S.; Tischer, S.; Deutschmann, O. CaRMeN: A tool for analysing and deriving kinetics in the real world. Phys. Chem. Chem. Phys. 2018, 20, 10857–10876. [Google Scholar] [CrossRef] [PubMed]
- Gossler, H.; Maier, L.; Angeli, S.; Tischer, S.; Deutschmann, O. CaRMeN: An Improved Computer-Aided Method for Developing Catalytic Reaction Mechanisms. Catalysts 2019, 9, 227. [Google Scholar] [CrossRef] [Green Version]


| Method | PdO/Al2O3 |
|---|---|
| BET surface area/m2 g−1 | 176 |
| Pore volume/mL g−1 | 0.46 |
| Noble metal dispersion/% | 28 |
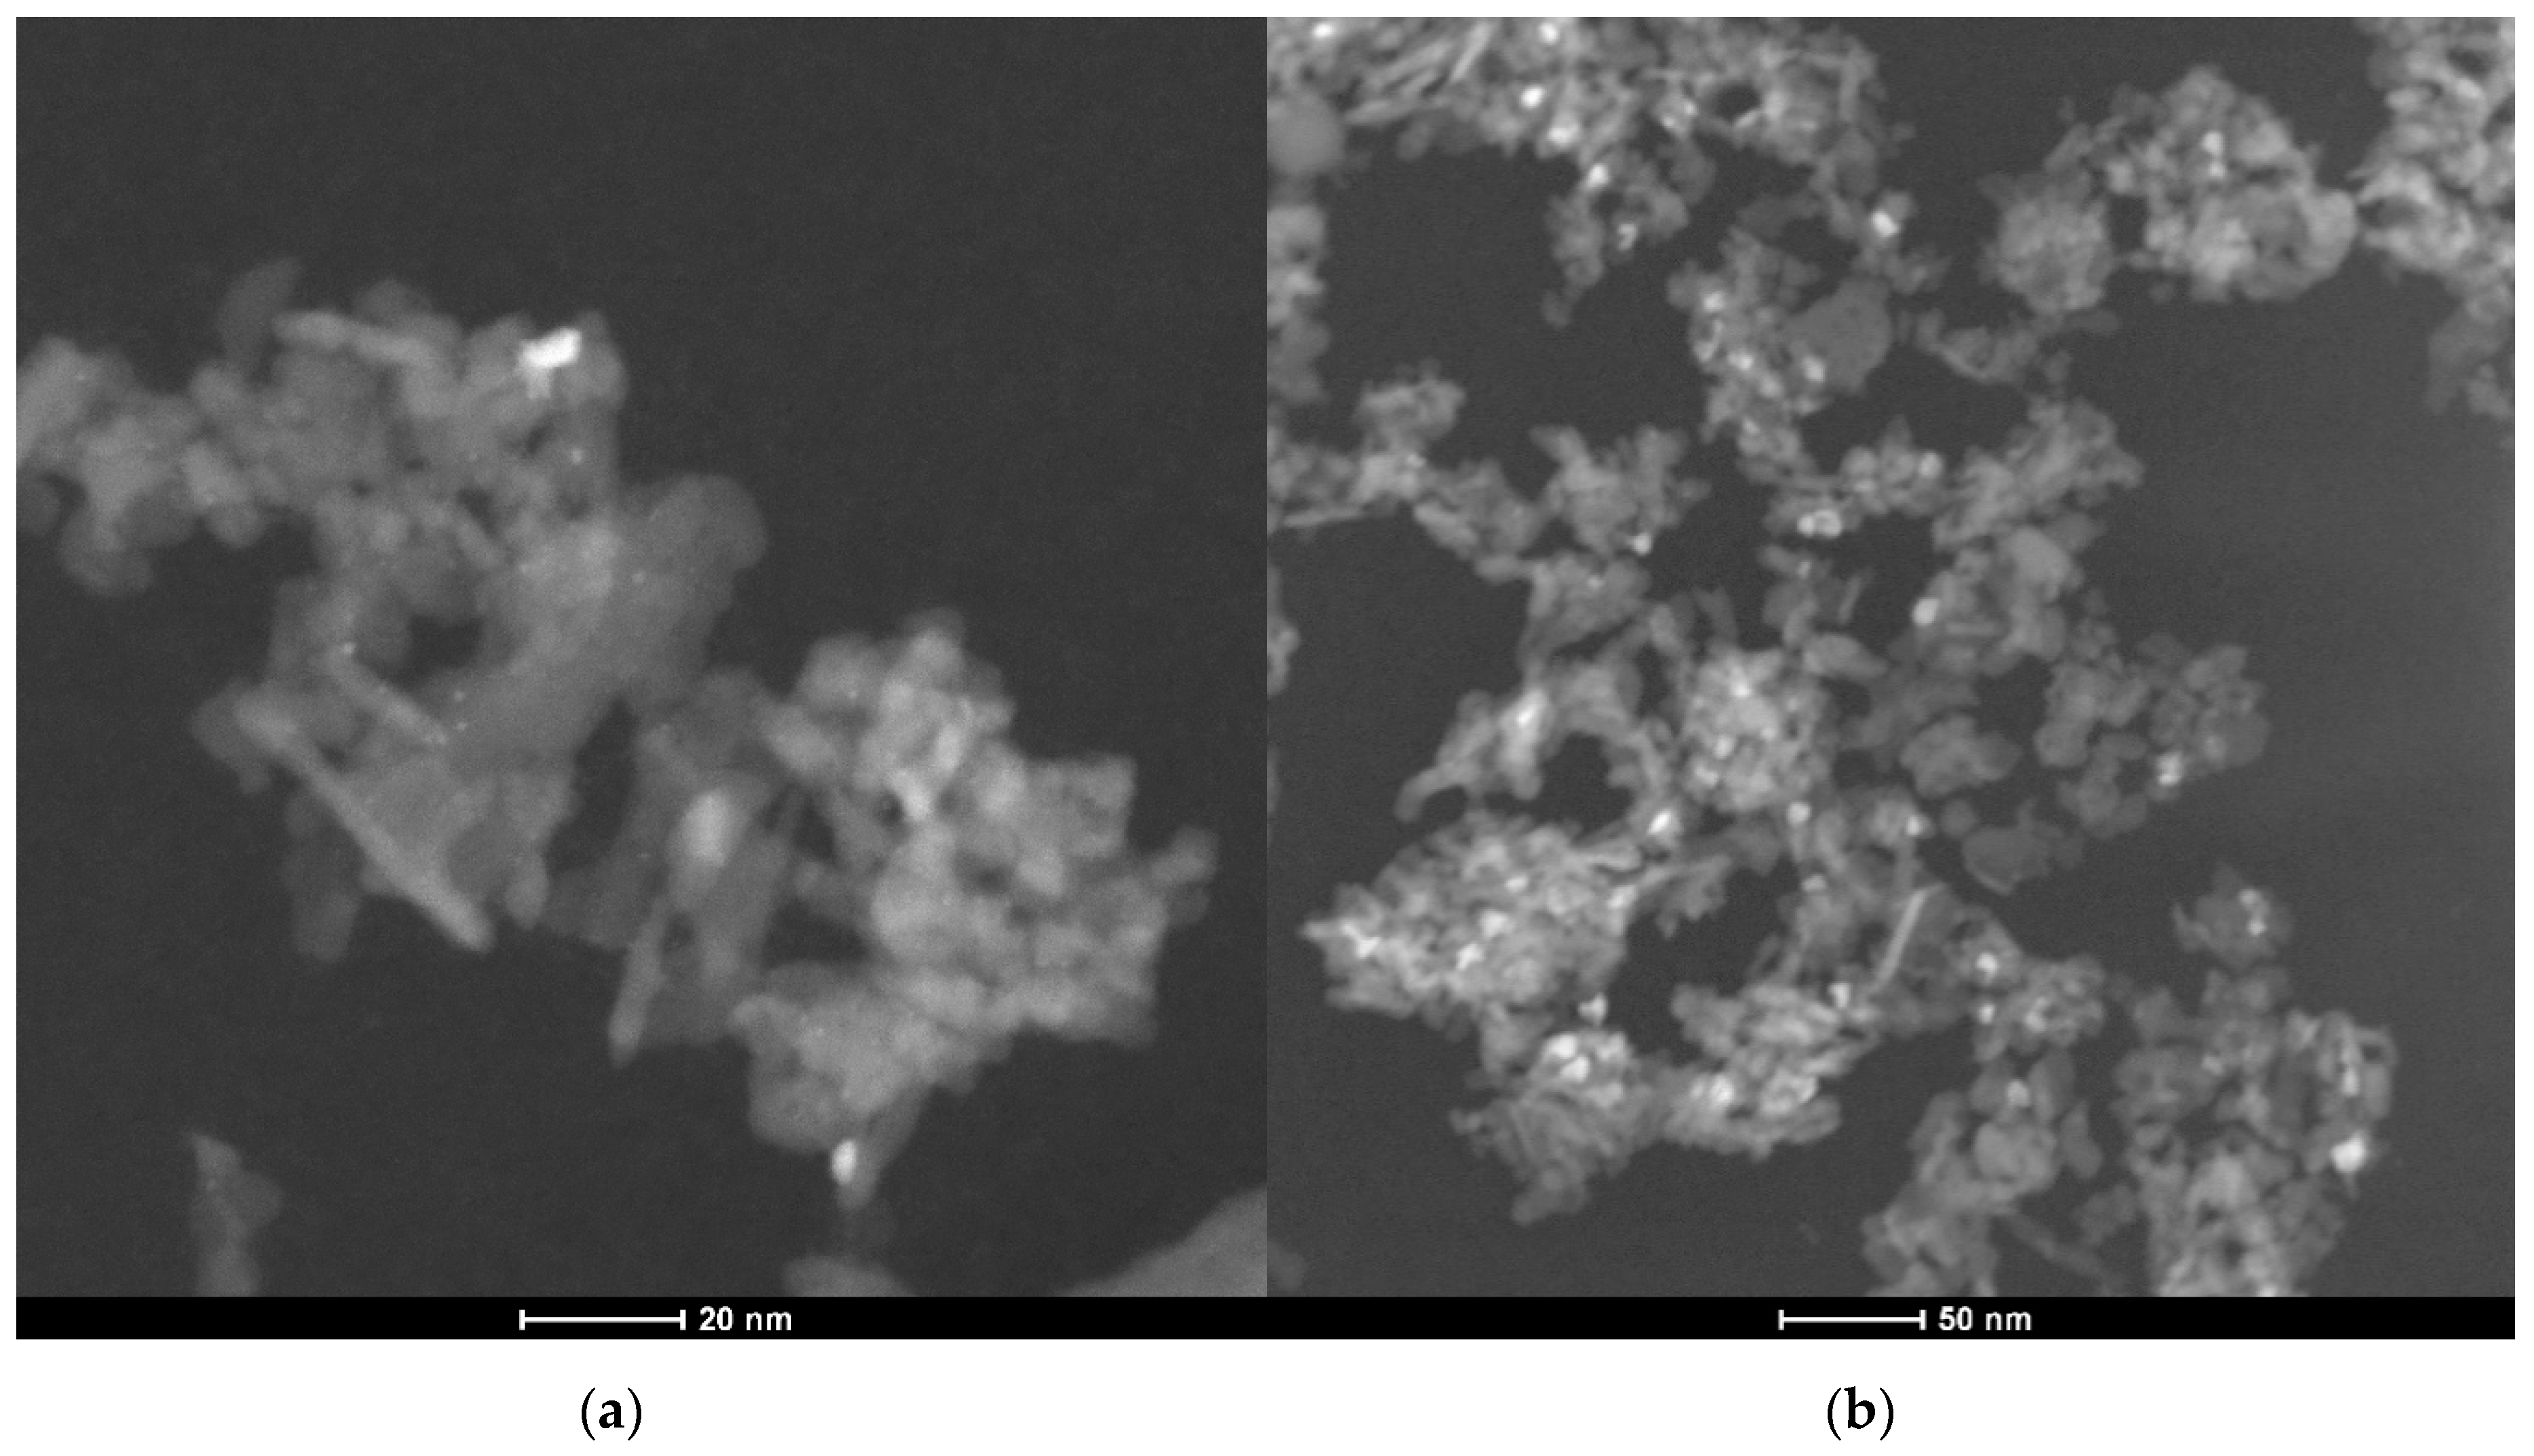
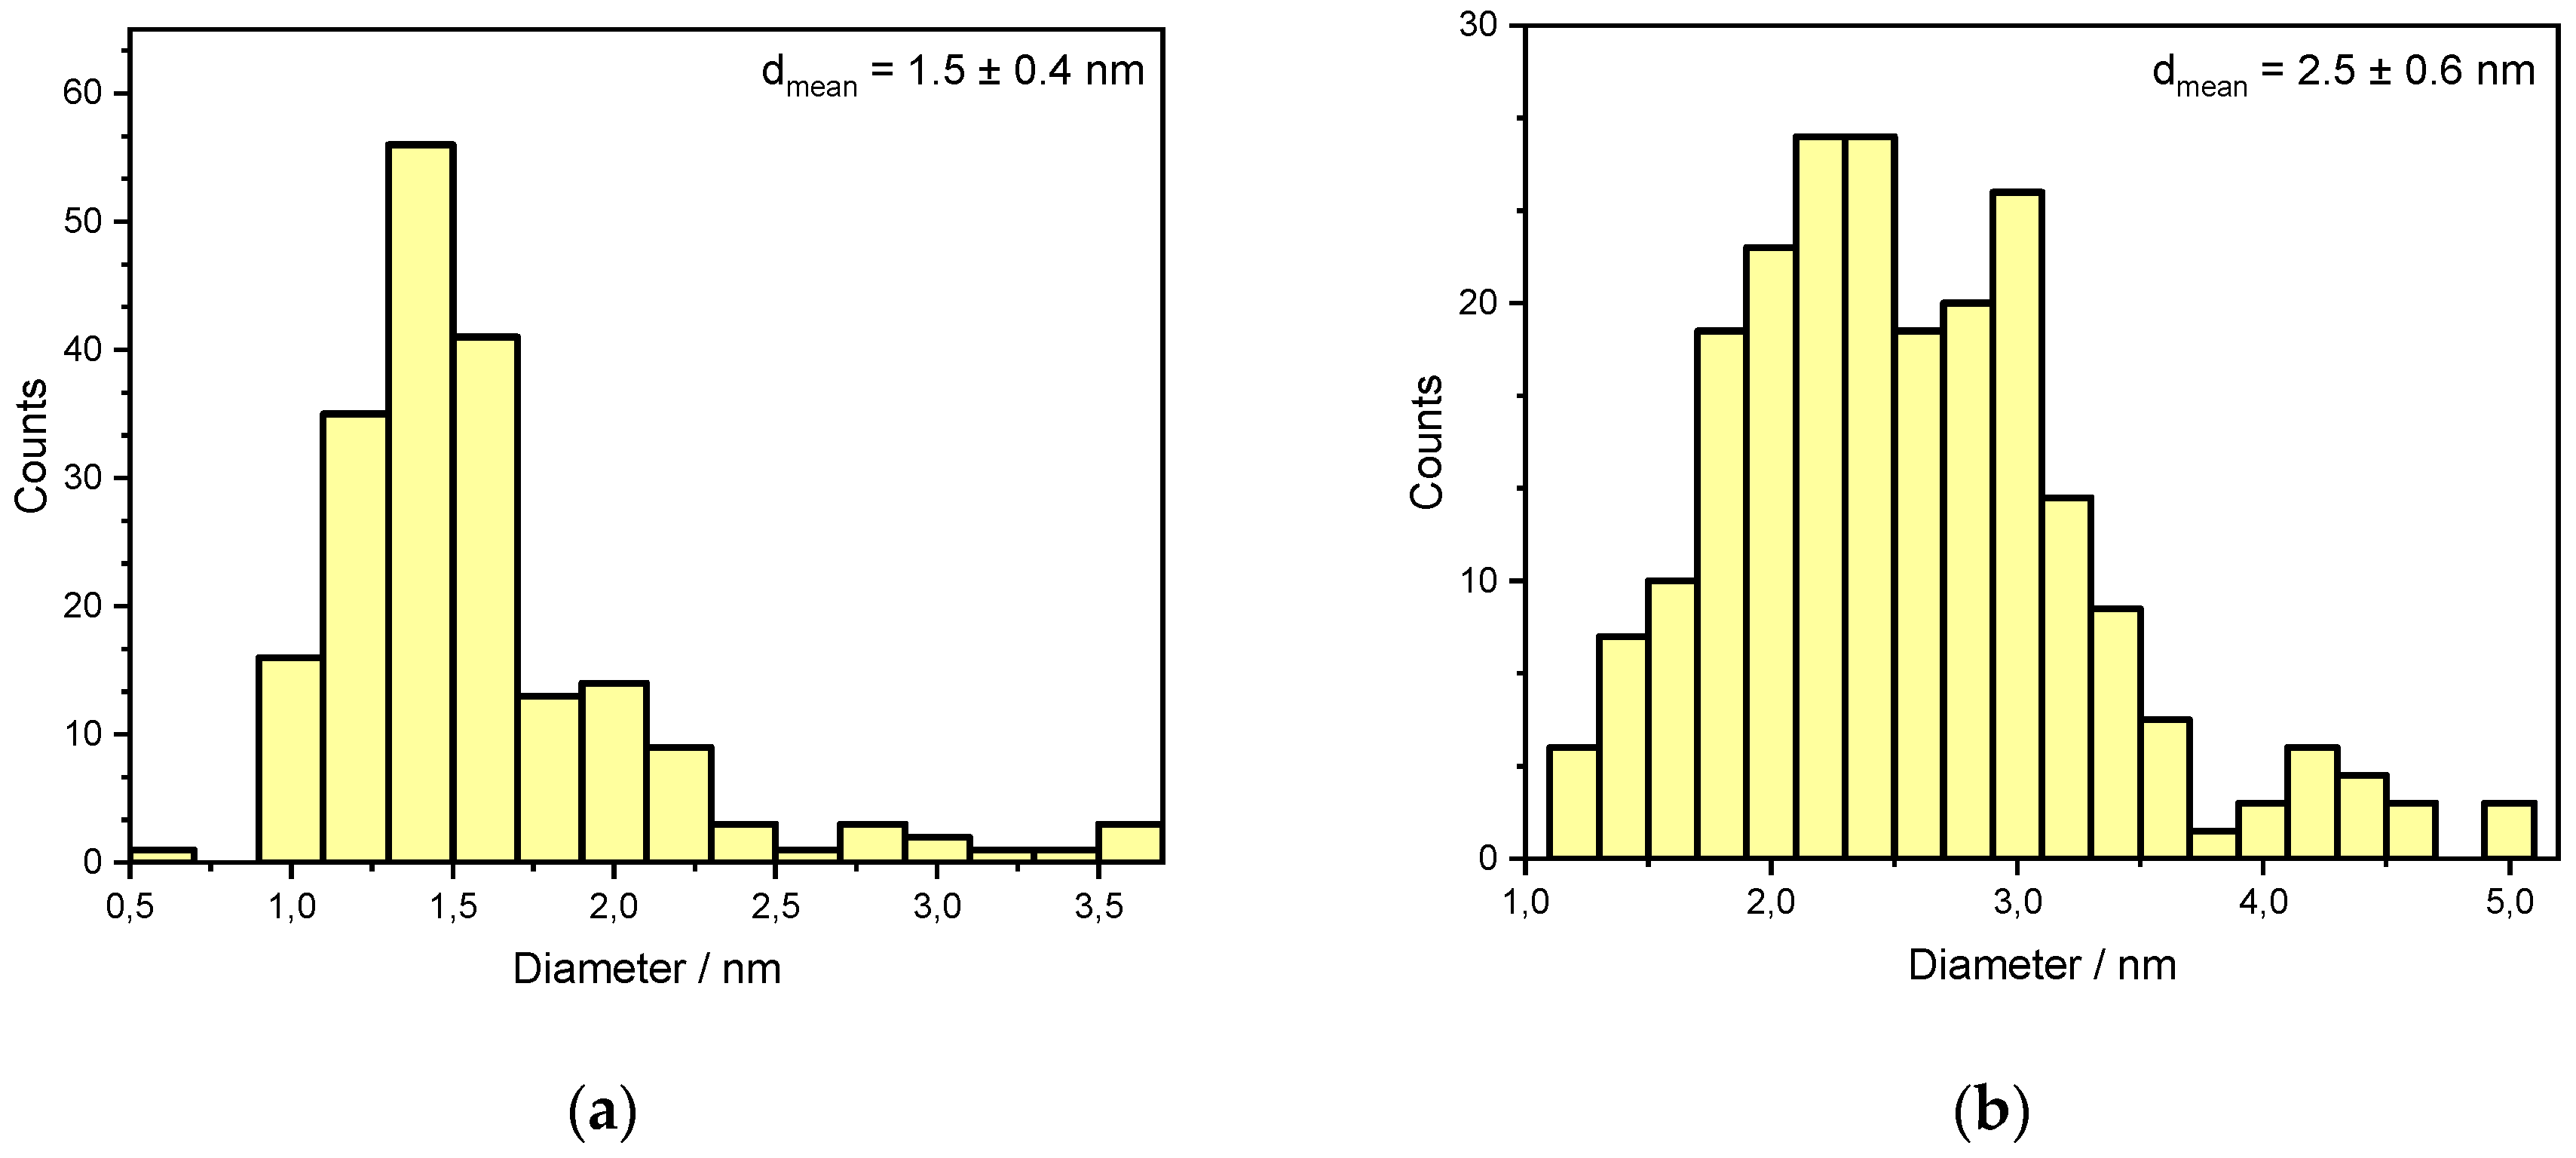
| Mean particle diameter (TEM), as prepared catalyst/nm | 1.5 |
| Mean particle diameter (TEM), aged catalyst/nm | 2.5 |
| Noble metal loading/wt.% | 2.23 |
| Parameter | Value | Unit |
|---|---|---|
| CH4 | 3200 | ppm |
| O2 | 10 | Vol.% |
| N2 | 75–90 | Vol.% |
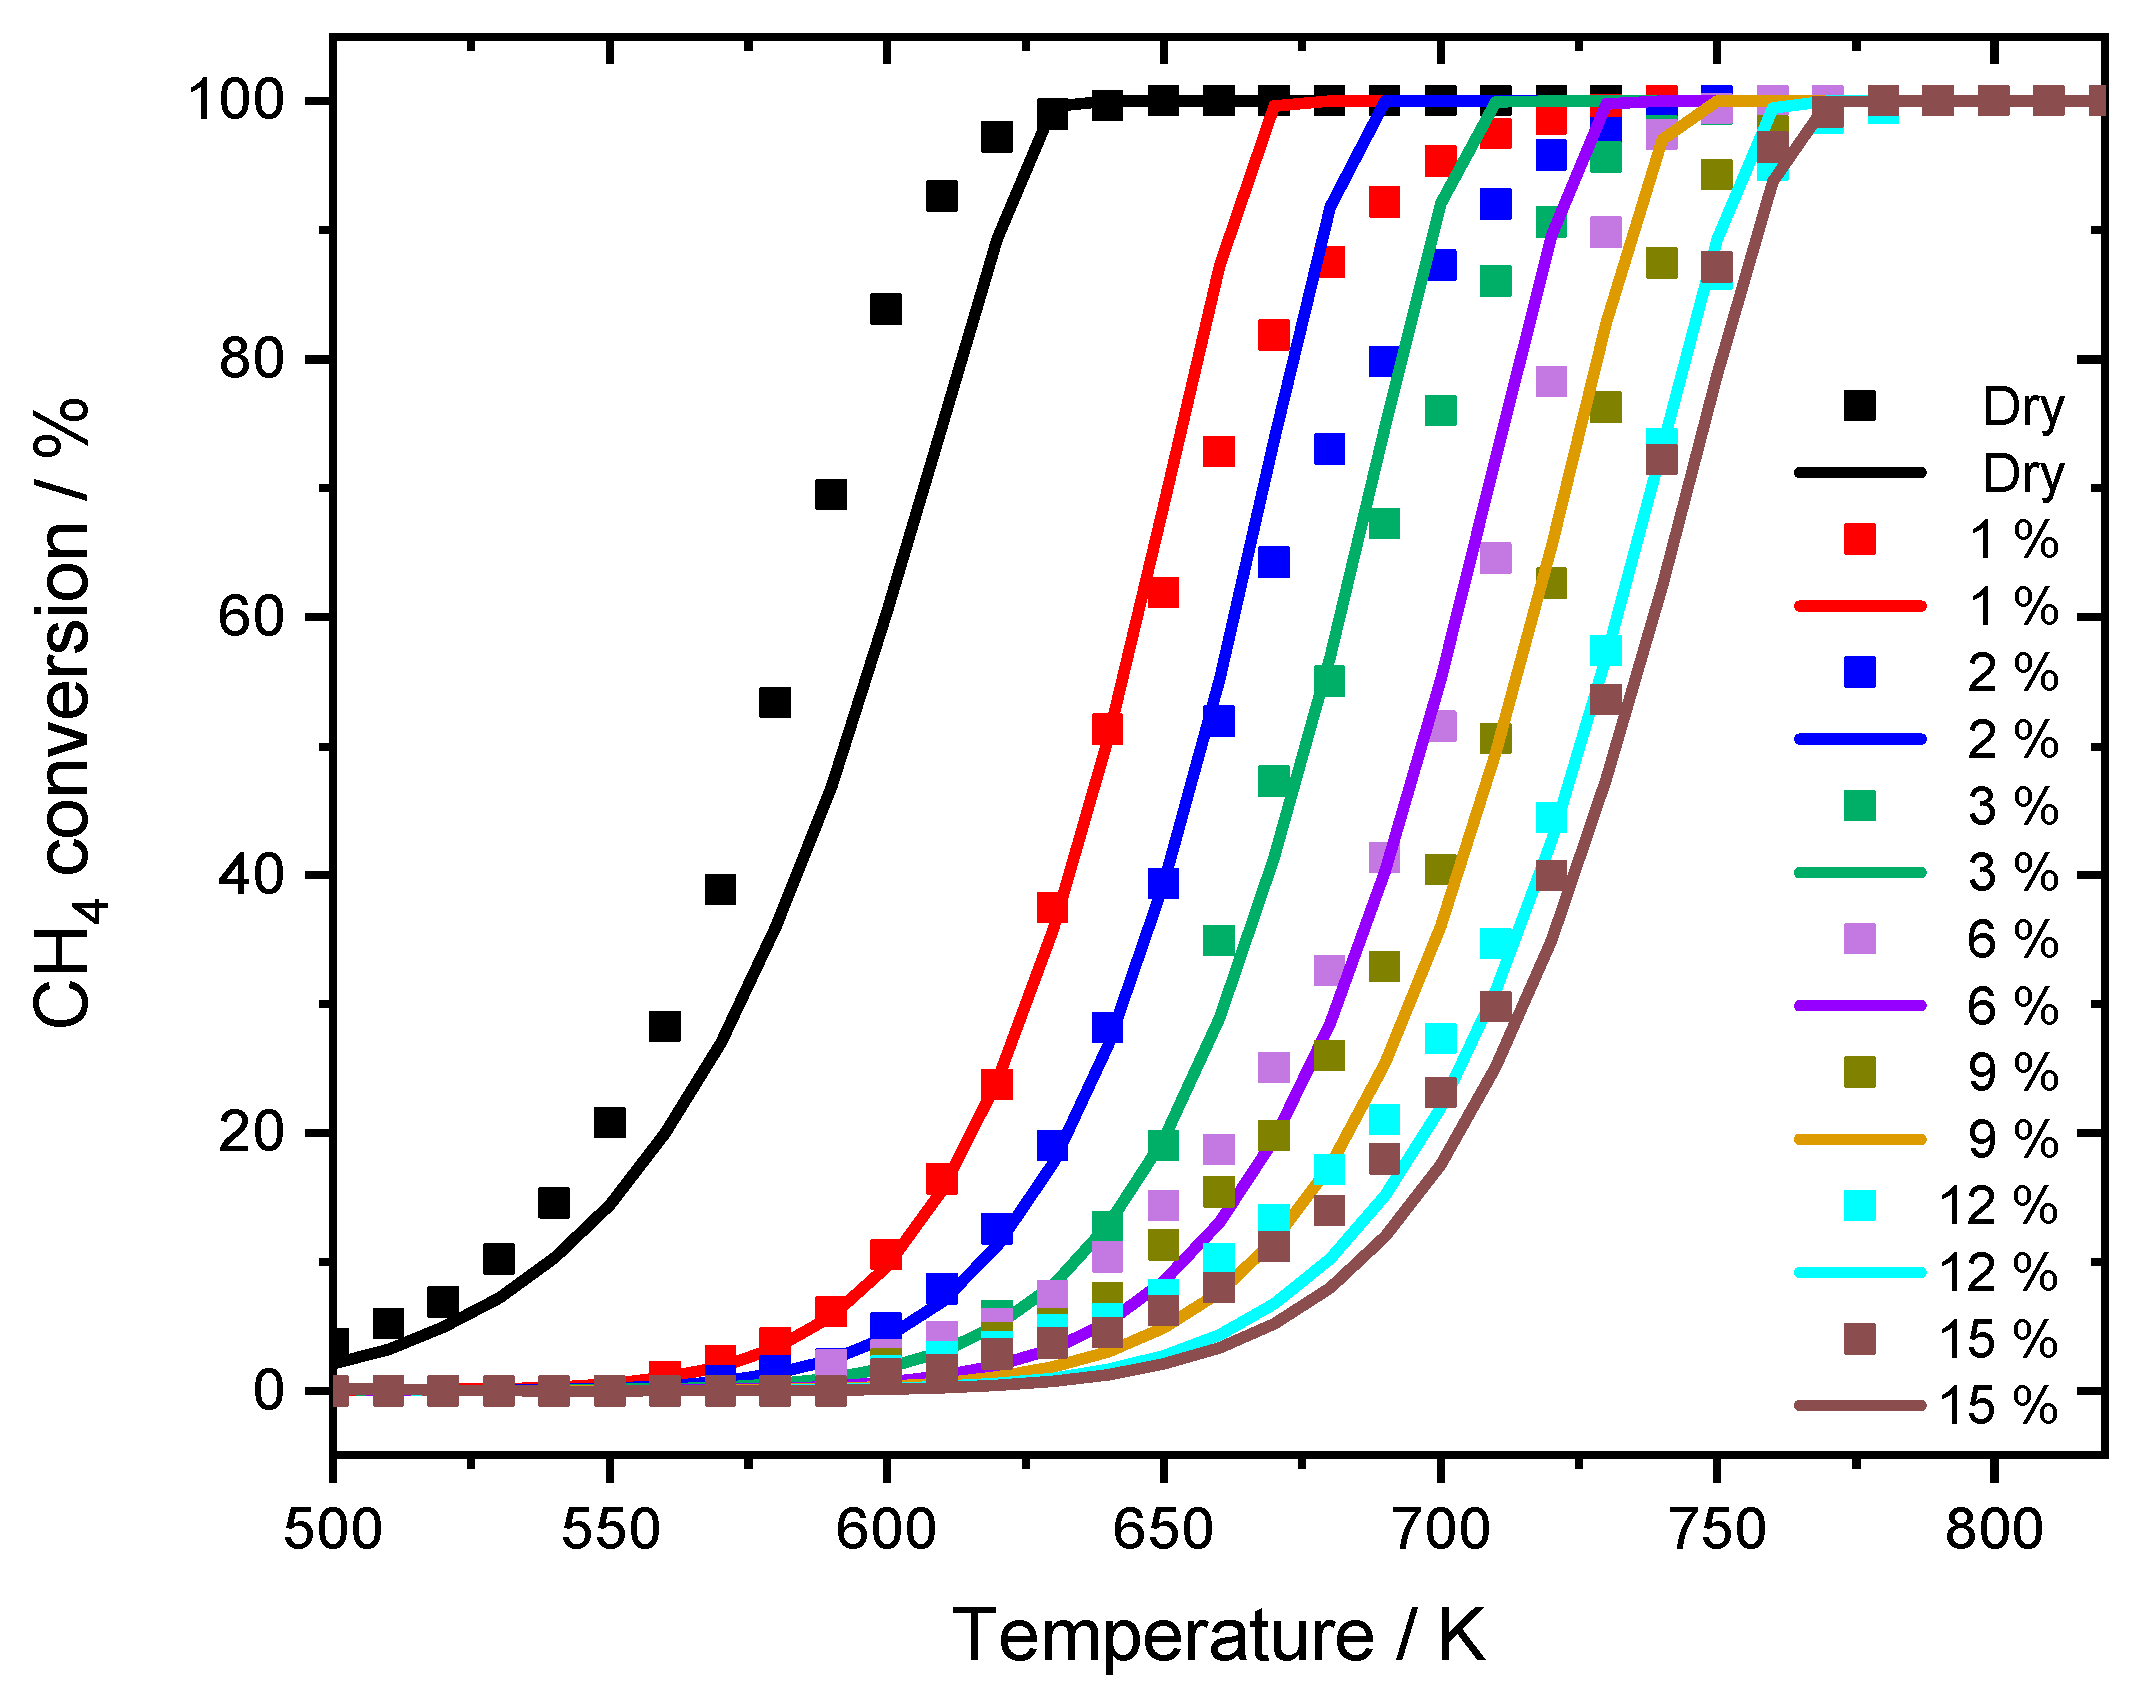
| H2O | 0–15 | Vol.% |
| GHSV | 140,000 | h−1 |
| Pressure p | 1000 | kPa |
| Length of the packed bed L | 15 | mm |
| Inner diameter of the reactor DL | 6 | mm |
| Particle size (sieve fraction) D | 125–250 | μm |
| Catalytic to geometric surface area ratio Fcat,geo | 510 | - |
© 2020 by the authors. Licensee MDPI, Basel, Switzerland. This article is an open access article distributed under the terms and conditions of the Creative Commons Attribution (CC BY) license (http://creativecommons.org/licenses/by/4.0/).
Share and Cite
Keller, K.; Lott, P.; Stotz, H.; Maier, L.; Deutschmann, O. Microkinetic Modeling of the Oxidation of Methane Over PdO Catalysts—Towards a Better Understanding of the Water Inhibition Effect. Catalysts 2020, 10, 922. https://doi.org/10.3390/catal10080922
Keller K, Lott P, Stotz H, Maier L, Deutschmann O. Microkinetic Modeling of the Oxidation of Methane Over PdO Catalysts—Towards a Better Understanding of the Water Inhibition Effect. Catalysts. 2020; 10(8):922. https://doi.org/10.3390/catal10080922
Chicago/Turabian StyleKeller, Kevin, Patrick Lott, Henning Stotz, Lubow Maier, and Olaf Deutschmann. 2020. "Microkinetic Modeling of the Oxidation of Methane Over PdO Catalysts—Towards a Better Understanding of the Water Inhibition Effect" Catalysts 10, no. 8: 922. https://doi.org/10.3390/catal10080922