Article

Response Surface Methodology for the Optimization of Keratinase Production in Culture Medium Containing Feathers by Bacillus sp. UPM-AAG1

by
Aa’ishah Abdul Gafar
,
Mohd Ezuan Khayat
,
Siti Aqlima Ahmad
,
Nur Adeela Yasid
and
Mohd Yunus Shukor
*
Department of Biochemistry, Faculty of Biotechnology and Biomolecular Sciences, Universiti Putra Malaysia, Serdang 43400, Malaysia
*
Author to whom correspondence should be addressed.
Catalysts 2020, 10(8), 848; https://doi.org/10.3390/catal10080848
Submission received: 17 June 2020 / Revised: 5 July 2020 / Accepted: 7 July 2020 / Published: 29 July 2020
(This article belongs to the Special Issue Biomass Derived Heterogeneous and Homogeneous Catalysts)

Abstract

:
Keratinase is a type of proteolytic enzyme with broad application in industry. The main objective of this work is the optimization of keratinase production from Bacillus sp. strain UPM-AAG1 using Plackett-Burman (PB) and central composite design (CCD) for parameters, such as pH, temperature, feather concentration, and inoculum size. The optimum points for temperature, pH, and inoculum and feather concentrations were 31.66 °C, 6.87, 5.01 (w/v), and 4.53 (w/v), respectively, with an optimum keratinase activity of 60.55 U/mL. The keratinase activity was further numerically optimized for commercial application. The best numerical solution recommended a pH of 5.84, temperature of 25 °C, inoculums’ size of 5.0 (v/v), feather concentration of 4.97 (w/v). Optimization resulted an activity of 56.218 U/mL with the desirability value of 0.968. Amino acid analysis profile revealed the presence of essential and non-essential amino acids. These properties make Bacillus sp. UPM-AAG1 a potential bacterium to be used locally for the production of keratinase from feather waste.

1. Introduction

Keratinase (EC 3.4.99.11) is a type of protease enzyme that started to gain interest due to its broad application in industry. They are commonly extracellular inducible enzymes secreted by various microorganism in the medium containing keratin showing high substrate specificity toward keratin [1]. They are widely used in most of the biotechnological processing industry, mainly in feed formulation, nitrogen fertilizer, leather processing, and pharmaceutical industry [2,3,4].
In food and feed supplements, keratinase-treated feather is increasingly seen as a viable source of dietary protein, as the enzyme-treated final product preserved good nutritional value. Keratinases are expected to develop a significant total global demand comparable to other commercial proteases. Diverse class of keratinase have been isolated from various microbial populations, such as bacteria [5,6] actinomycetes [7,8], and fungi [9,10]. However, among bacteria, keratinase from Bacillus genera has been widely reported as keratinase from this genera and appears to be the most promising keratinase producer for commercial application [11,12]. In general, the reasons why Bacillus spp. are preferred in bioremediation and industrial biotechnology are due to their generally regarded as safe (GRAS) property and the capacity of selected Bacillus strains to produce and secrete large quantities (20–25 g/L) of extracellular enzymes [13]. This is also the reason as to why an increase in the number of reports on the isolation of keratin-degrading Bacillus spp. is on the rise.
Numerous commercial keratinases are from Bacillus spp., such as Versazyme from B. licheniformis PWD-1 (Odetallah et al. 2005); Prionzyme (Genencor) and Cibenza DP100™, both also from B. licheniformis PWD-1; Esperase and Savinase (Novozymes A/S), both from Bacillus spp.; and Alcalse (Novozymes A/S) from B. licheniformis [14]. We have been approached by a small feather-processing company interested in feather-degrading technology with the main target in producing keratinase at ambient temperature (25 to 32 °C) without utilizing additional nitrogen sources and heating process to lower the cost. There are many Bacillus spp. keratin-degrading bacteria reported in the literature, but most require additional nitrogen sources, such as yeast extract, peptone, soybean meal, ammonium ions, and soy flour [4,13,15,16,17,18,19,20,21,22,23,24,25], that may elevate the cost. Scouring through the literature shows that only two Bacillus spp. keratin-degrading bacteria fits the bill with chicken feather as the sources of carbon and nitrogen, but both required elevated temperatures 37 °C [26] and 50 °C [27] for optimum activity. In light of the current Covid-19 pandemic, where imported products have great difficulties in being available, sometimes months at a time, this mean that local sources need to be developed.
The objectives of this work are to optimize keratinase production using feather as the only source of carbon and nitrogen and to numerically select the best conditions to maximize keratinase activity under ambient temperature and maximum feather concentration as a substrate. In this work, we report the optimization via response surface method (RSM) followed by a numerical optimization of a Bacillus sp. keratin-degrading bacterium having optimum ambient temperature for growth with chicken feather as the sole carbon and nitrogen sources.

2. Results

2.1. Isolation and Screening of Keratinase Producing Bacterium

In the present study, five prevalent colonies are that competent for sustainable growth on feather meal agar (FMA) were successfully isolated based on hydrolysis zone on FMA indicate the use of feather keratin as both carbon and nitrogen sources. The four isolates were able to utilize keratin in FMA for its growth. The morphology of each isolate is shown in Table 1. For further analysis, all pure strains were subjected to endospore screening for the best keratinase producing Bacillus. For this purpose, endospore-forming species was confirmed by the formation of green-colored spore after staining with malachite green and safranin. Among the tested isolate, three isolates were spore positive within 2 days of incubation in sporulation media signifying a potential member of Bacillus sp. The isolate was isolated UPM-AAG1, UPM-AAG6, and UPM-AAG14. A further screening process to select the highest keratinase producer was conducted based on bacterial growth and keratinase activity in 1% feather as sole carbon and nitrogen sources. The result suggests that the highest keratinolytic activity was isolate UPM-AAG1 (35.23 U/mL), followed by isolate UPM-AAG14 (33.97 U/mL), while isolate UPM-AAG6 resulted in the lowest keratinase production at only 25.56 U/mL for the same incubation time. The bacterial growth showed the same pattern where isolate UPM-AAG1 gave the highest bacterial count at 7.771 Log Colony Forming Unit or CFU/mL followed by isolate UPM-AAG6 at 7.628 Log CFU/mL and isolate UPM-AAG14 at 7.573 Log CFU/mL (Figure 1). Based on the results, isolate UPM-AAG1 was subjected further for identification study.

2.2. Identification of Keratinolytic Microorganism

Micromorphology of isolate AAG1 was examined microscopically and demonstrated rod-shaped blue color bacterial cells, signifying their Gram-positive characteristic. Biochemical analysis showed positive results towards oxidase, catalase, Voges-Proskauer, and citrate test but negative result towards nitrate production. Further identification was supported by the 16S rRNA sequencing. BLASTn result showed that isolate AAG1 belonged to the Bacillus genus with high similarity percentage of (>99%). The phylogenetic tree constructed using partial 16S rRNA sequence and Escherichia coli strain U5/41 as the outgroup demonstrated that isolate AAG1 was not attached to any know species in the clade. However, bootstrap result AAG1 shows sequence similarity to Bacillus safensis strain FO-36b, Bacillus pumilis strain ATCC 7061, Bacillus pumilis strain SBMP2, and Bacillus stratosphericus strain 41KF2a with a bootstrap value of 78% (Figure 2). Therefore, UPM-AAG1 isolate was identified as Bacillus sp. strain UPM-AAG1 and deposited in the GenBank with the Accession No. MK285608.1.

2.3. Optimization of Keratinase Activity Using Plackett Burman and Response Surface Methodology

2.3.1. Pre-Screening of Significant Parameters Using Plackett-Burman

Four independent factors (i.e., inoculum size (v/v), feather concentration (w/v), pH, and temperature) were screened to evaluate their effects on keratinase production using Plackett-Burman design. A total of 12 experimental variables generated using software screening for keratinase production, and their corresponding responds, as shown in Table 2a. The adequacy of the model was calculated using ANOVA analysis and presented in Table 2b. The model F value 70.33 indicates the model is significant with only 0.25% chance that a “Model F-value” this large could occur due to noise. The factors with p < 0.05 were considered to have a significant effect on the response. As presented in the table, all factors—temperature, inoculum size (v/v), pH, and feather concentration (w/v)—exert a positive effect on the model. Therefore, all four significant factors screened were further brought into the central composite design.

2.3.2. Optimization of Significant Variables Using Central Composite Design (CCD)

CCD was used to determine the optimum condition of the four selected significant variables (temperature, inoculum, pH, and feather concentration) for keratinase production using keratinase activity as the output response. A total of 30 experiments with different combinations of the four selected variables were performed. The experimental designs used are shown in Table 3.
The responses were studied using four independent variables with six center point showing both observed and predicted values for keratinase activity. The multiple regression analysis of the observed responses resulted in the below quadratic equation:
Keratinase Activity = + 47.10 + 3.65*A + 0.65* B − 9.70*C − 8.72*D − 6.11*A2 − 0.78*B2 + 0.75*C2 − 3.55*D2 + 0.46*A*B + 2.70*A*C − 1.02*A*D + 5.50*B*C − 0.18*B*D − 16.97*C*D,
where A, B, C, and D, each represent concentrations (coded values) of temperature, pH, inoculum, and feather concentrations, respectively. From Table 4, it can be observed that all four linear terms (A, B, C, D), three squared terms (A2, C2, D2), and two quadratic terms (BC and CD) of the model were significant to the response, suggesting that keratinase production highly depends on the interactions between these factors.
Based on the coded value below, the effects of inoculum and feather concentrations outweigh the effect of other factors.
Final equation in terms of actual factors:
Keratinase Activity = −114.67125 + 13.59533*Temperature − 7.93667*pH − 13.85500*Inoculum + 29.97458 * Feather − 0.24450*Temperature2 − 0.49800*pH2 + 0.12000*Inoculum2 − 0.88750*Feather 2 + 0.073000*Temperature*pH + 0.21600*Temperature*Inoculum − 0.10250*Temperature*Feather + 1.7600*pH*Inoculum − 0.070000*pH*Feather − 3.39500*Inoculum*Feather.
The predicted model was assessed further by RSM analysis. The 3D response plot for keratinase activity represents the interaction between two parameters at a time, while fixing the other parameter at zero levels (constant) for maximum keratinase production (Figure 3a–f). The predicted optimum points for temperature, pH, and inoculum and feather concentrations were 31.66 °C, 6.87, 5.01 (w/v), and 4.53 (w/v), respectively, with an optimum keratinase activity of 60.5539 U/mL. Verification of the value obtained showed a close value of 60.02 U/mL indicating good agreement.
Data fitness into the selected model was examined using diagnostic model plots (Supplementary Figure S2a–d). The plots are especially important in the evaluation of data error which varies from model predictions, which helps to assess and improve model adequacy. The actual versus predicted response plot obtained from the experiment (Figure S2a) showed a similar relationship between the predicted and actual values as the data points were clustered near the line dividing the plot into identical halves (45°). Plotting the predicted values and studentized residuals (Figure S2b) further verified the suitability of the model. Studentized residues are utilized to indicate differences between the predicted value and the actual model responses. The experimental data exhibit slight or no abnormality based on visual observation of the normal probability plot (Figure S2c). To visualize the distantly standout standard deviation, an outlier plot (Figure S2d) can show the presence of outlier(s). The result shows that the data falls between 3.5 and −3.5, suggesting the absence of outlier.

2.3.3. Numerical Optimization

As the company requested minimum costs to for the developed system, a numerical optimization was calculated so that the best conditions under the following criteria (Table 5)—minimum temperature, pH within range, minimum inoculum, maximum substrate (feather), and maximum keratinase activity—were obtained. Under the constraint criteria selected, ten solutions were obtained, and the best solution recommended was as follows.
For verification purposes, a series of validation experiment was conducted based on the conditions provided by CCD for optimum keratinase production (Table 6). Based on the provided solution, the highest keratinase activity obtained through solution 1 with a pH of 7.00, temperature 25.00, inoculums’ size of 5.0 (v/v), feather concentration 4.97 (w/v) resulted in an activity of 56.218 U/mL with the desirability value of 0.968.

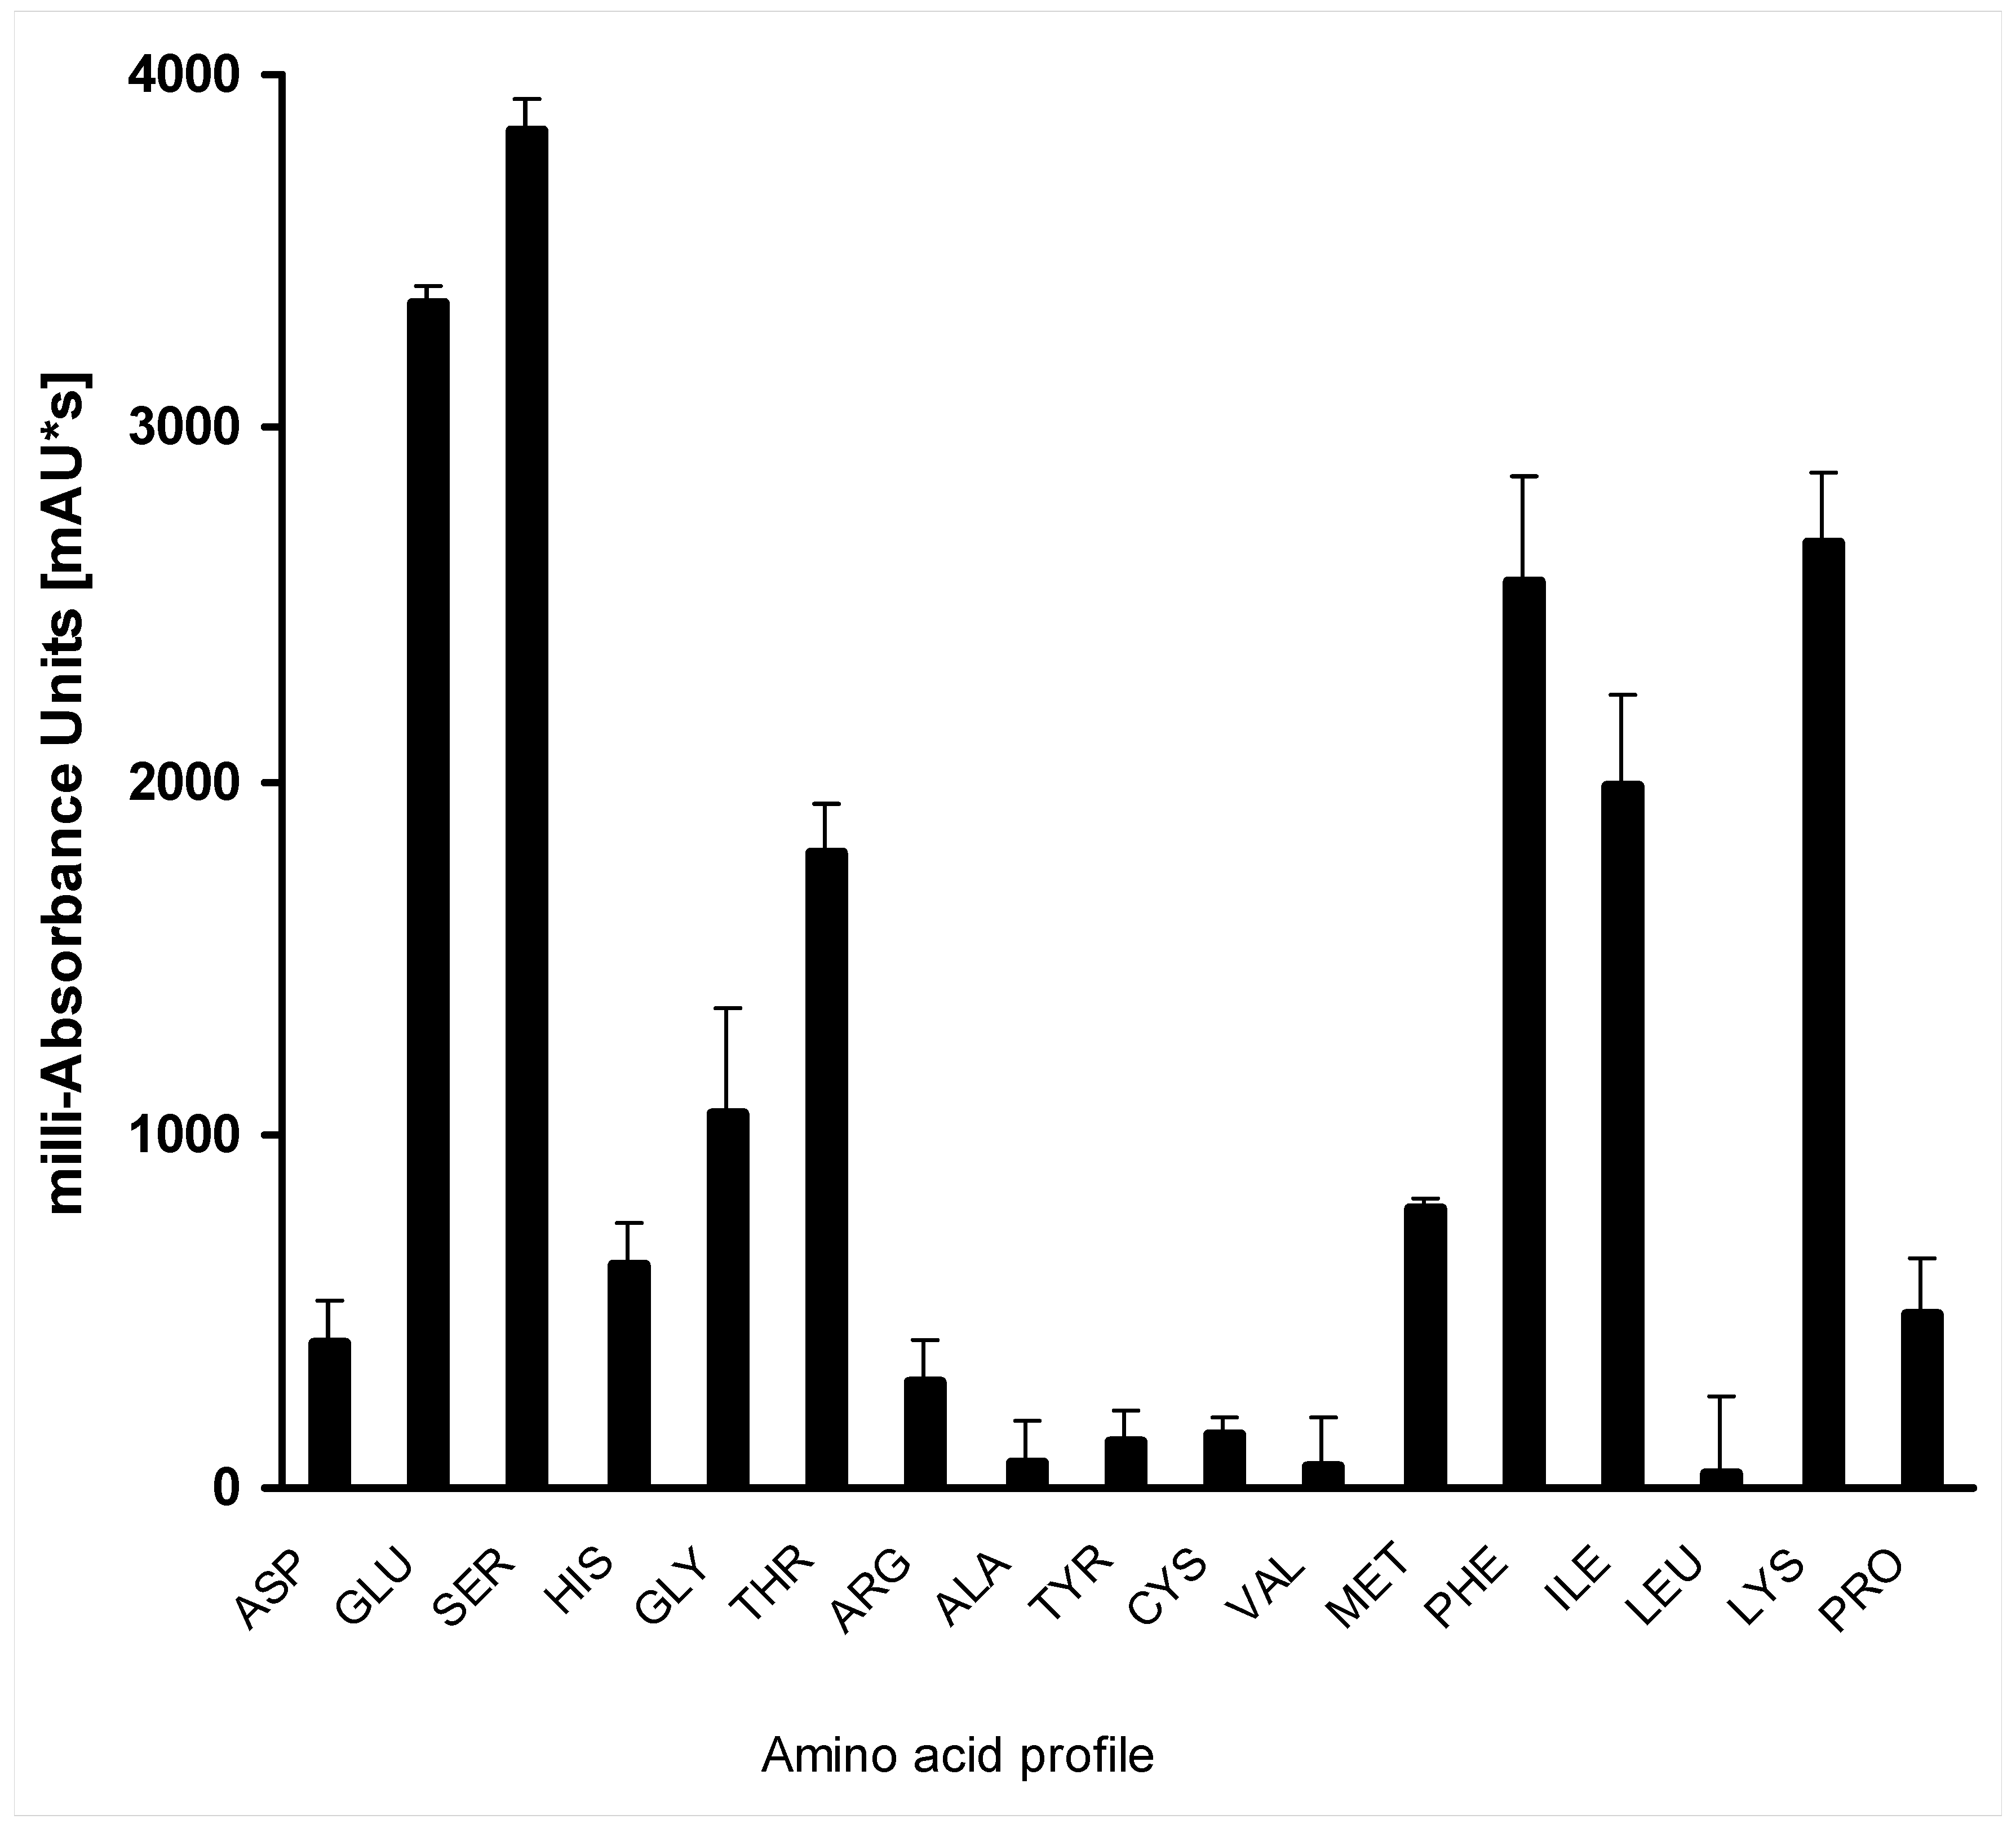
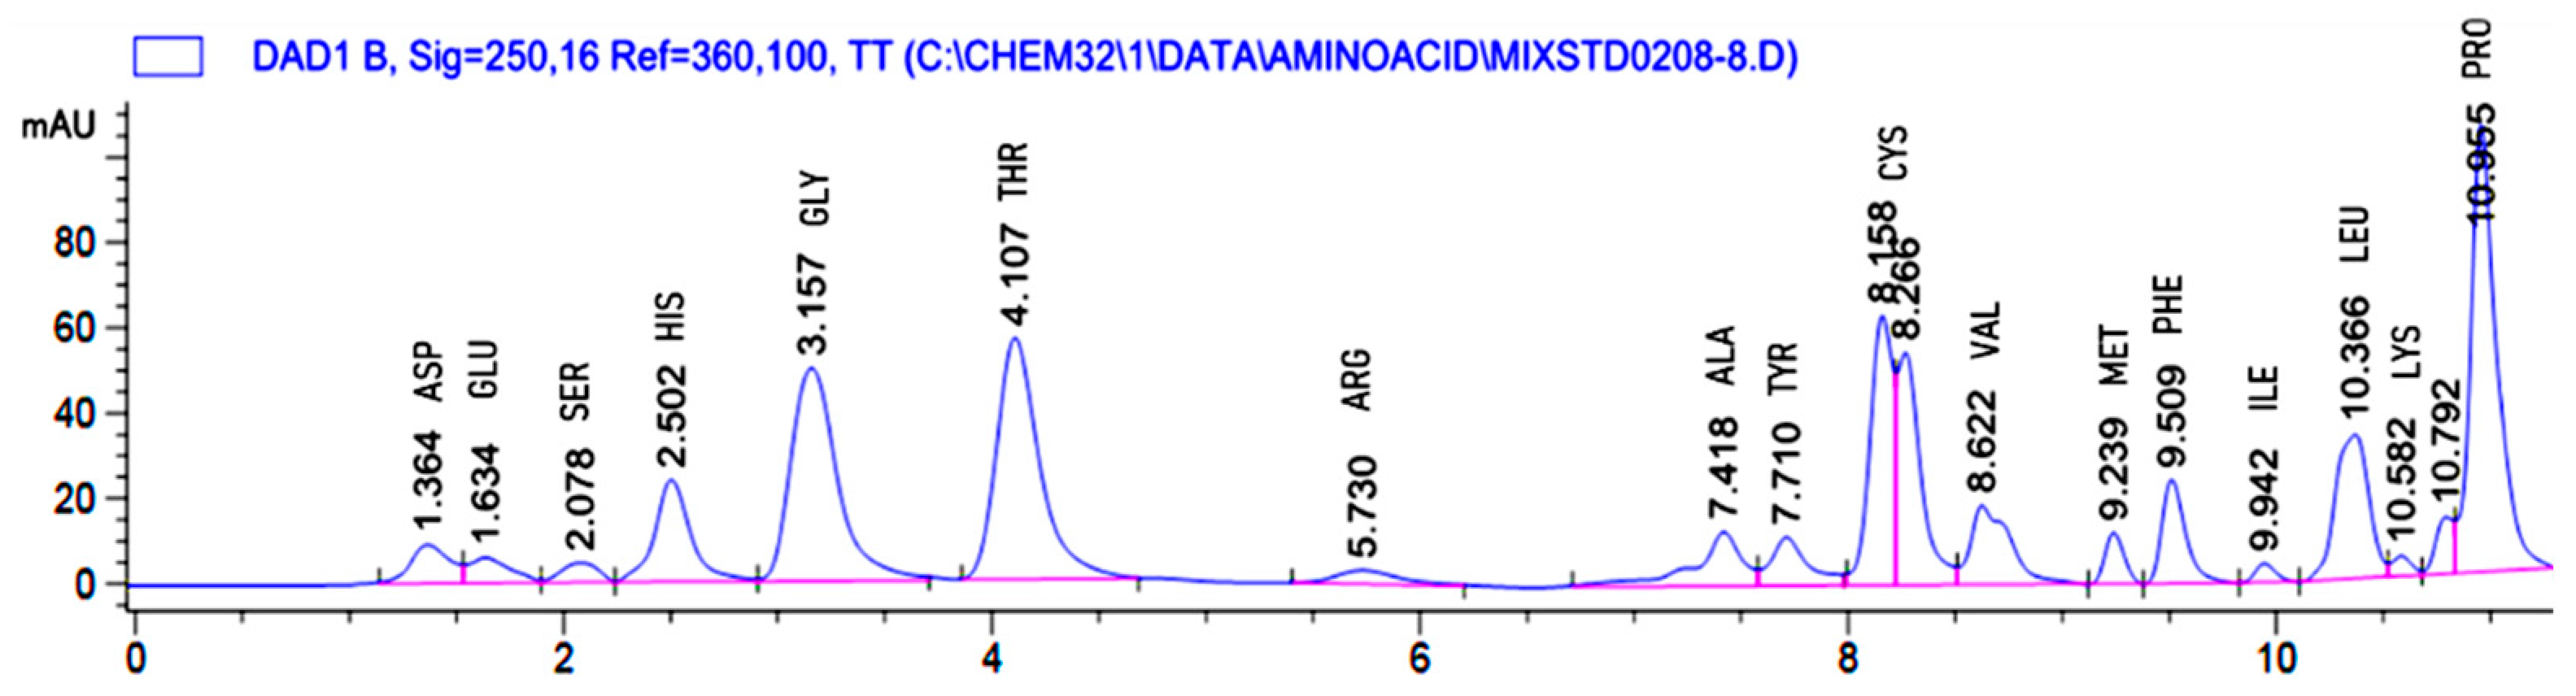
2.4. Amino Acid Profile of Hydrolysate of Bacillus sp. UPM-AAG1 Using High-Performance Liquid Chromatography (HPLC)

Amino acid analysis profile of the keratinase from Bacillus sp. strain UPM-AAG1 (Figure 4) revealed the presence of 17 different amino acids, including essential amino acids histidine, isoleucine, leucine, lysine, methionine, phenylalanine, threonine and valine, and non-essentials amino acids, like aspartic acid, glutamic, glycine, alanine, cysteine, tyrosine, arginine, serine, and proline, as evident from the HPLC chromatogram (Figure 5). The sequence is largely composed of phenylalanine (65.73 µmol/mL), isoleucine (24.04 µmol/mL), and lysine (20.14 µmol/mL) as essential amino acids and glutamine (32.48 µmol/mL), glycine (60.47 µmol/mL), and serine (158.42 µmol/mL) as a non-essential amino acid.

3. Discussion

Keratinase is a protease that is very robust with broad application in industry. In this work, isolation of a new potential keratinase producer from the Bacillus genera due to its high keratinolytic activity [28]. Five colonies were successfully isolated from poultry waste and soil in Selangor using heat treatment method for the selection of spore-forming Bacillus species. As one of the exclusivities of Bacillus species is characterized by endospore formation, heat treatment is the most common and simplest method use to infer the presence of spore-forming Bacillus [29,30]. Under extreme environment, spore-forming Bacillus spp. develop endospore; a metabolically inactive dormant cell to protect themselves against the harsh environment [31]. Once the environment returns to favorable conditions for growth, the cell will proceed with its vegetative life cycle and continue to germinate. The purpose of sporulation in this experiment is to kill other vegetative cells, leaving only dormant endospore cells to survive. Of all five cultures tested, only isolate UPM-AAG1 shows positive growth response in FMA, spore positive, and highest keratinase activity, as well as the highest bacterial growth count; hence, this isolate was selected for further studies. This method of isolation of keratinase producing organism has been reported before [32], where feather as a substrate was used as sole carbon and nitrogen source. A few keratinolytic Bacillus spp. that utilize feather solely as carbon and nitrogen sources include Bacillus pumilus GRK [26] and Bacillus cereus LAU 08 [27].
Physiological and biochemical identification of isolate AAG1 revealed a rod-shaped structure indicating their Gram-positive characteristic. Gram-positive keratinase producer is not exclusive to Bacillus spp. as other Gram-positive bacteria have been reported, including BreviBacillus parabrevis [33], Micrococcus luteus, and Actinobacter sp. [34]. On the basic of 16srDNA sequencing and phylogenetic analysis, the keratinolytic isolate UPM-AAG1 was tentatively identified as Bacillus sp. strain UPM-AAG1. Many of the major commercial keratinolytic bacteria come from the genus Bacillus spp. [28,35], chiefly due to its generally regards as safe (GRAS) property [36]. The keratinolytic bacteria in this study were isolated from a poultry farm environment, and numerous keratinolytic bacteria have been isolated from poultry farm soils, such as Bacillus subtilis DP [25] and five keratinolytic strains of Bacillus spp. [37], to name a few, making them predictable as the feather-contaminated soils offer rich sources of keratin for selective enrichment [25,38].
Despite being the most studied and widely documented, the major drawback in keratinase study is to optimize keratinase production using feather keratin as the sole carbon and nitrogen sources. Addition of supplements will incur a high cost when production is scaled up (Table 7).
In keratinase research, the main objective is to maximize keratinase production through manipulating external and internal parameters [46]. Most of the optimization studied involving keratinase involved conventional optimization through one factor-at-a-time (OFAT) [22,41,47] or both conventional and statistical approach [17,48] but with non-keratin carbon and nitrogen sources (Table 7). By carrying out optimization relying on no additional supplements, as well as optimizing process at ambient temperature suiting Malaysia (from 24 to 32 °C), will increase the chances of a successful keratinase production by local small and medium enterprise (SME) companies. To date, only very few keratinase-producing Bacillus spp. bacteria have been optimized using feather as the sole carbon and nitrogen sources (Table 7). Additional C and N sources supplementation may not work during actual feather degradation as the augmented bacterium may choose to utilize the easily assimilable C and N source rather than the feather itself. In addition, competition with the easily assimilable C and N sources by indigenous bacteria may outcompete the augmented bacterium resulting in a lower production of keratinase and poor degradation of feather waste [49]. Compared to many keratin-degrading Bacillus spp. (Table 7), Bacillus sp. UPM-AAG1 produce a relatively good keratinase activity (60.1 U/mL) in a shorter time (24 h) at 30 °C, features that make this bacterium suitable for the requirement of the local SME company where keratinase production should be optimum or acceptable activity at ambient temperature. However, the applicability of this strain in real world conditions need to be tested, and this remains the limit of this work.
RSM CCD’s result showed that all factors—temperature, inoculum size (v/v), pH, and feather concentration (w/v)—exert positive effects to the model with feather concentration forming a major contributor. This result is similar to Yusuf et al. [48], where feather concentration was found to be the most significant substrates for keratinase production when Plackett-Burman (PB) was used in the screening process. Apart from that, Govarthanan et al. [24] also reported the same result where a significant increase in keratinase production was observed when feather was used as substrate. The inoculum size was reported to give significant effect towards keratinase production in Bacillus licheniformis ER-15 [43]. This is because inoculum size significantly affects the growth profile of aerobic microorganism. Further, a neutral to alkaline pH were reported to promote keratinase production in various microorganism [50,51] with the exception of a few including Bacillus subtilis [52] where the highest activity occurs at acid to neutral pH range (pH 5–7). Apart from that, temperature also plays an important role in the production of keratinase enzyme. Generally, most of the reported keratinases work optimally in between 28 to 50 °C [24,39]. The ANOVA analysis result of keratinase activity obtained through RSM indicated that the model is adequate with a correlation coefficient, R2 of the model was 0.9569 and an adjusted R2 value of 0.9167 showing a high correlation between the experimental data design (Table 5). The nearer the R2 value to 1, the better the accuracy of the model. The “Pred R-Squared” of 0.8165 was in consistent agreement to the “Adj R-Squared” of 0.9167 indicating an acceptable degree of correlation between the observed value and predicted values [53], although “Pred R-Squared” value of >0.9 is more desirable in many cases [54]. A ratio > 4 for the Adeq Precision value is sought and the result from this study with a value of 15.586 indicates a good signal to noise ratio [55]. The large lack of fit F value is normally sough and, with a value of 0.94, suggests an insignificant lack of fit relative to the pure error [56,57]. The p-value for the lack of fit value was 0.5666, and this demonstrated the model appropriateness for the optimal region. The Model F-value of 23.79 implies the model is significant. There is only a 0.01% chance that “Model F-value” this large could occur due to noise. Values of “Prob > F” less than 0.0500 indicate model terms are significant [58]. Significant model terms in this case were A, B, C, D, A2, C2, D2, BC, BD. Further 3D analysis of the model showed an escalated pattern in keratinase production when the temperature was increased, and pH maintained in the targeted range (Figure 3a). The same escalating pattern was also observed in Figure 3b and c where keratinase production increased only when the temperature was increased and could not increase further with increasing in inoculum size and feather concentrations, respectively. Verification of the model with a predicted value close to the actual value showed the reliability of the experiment to predicted precise condition, thus supporting the accuracy of the model over 95%.
The amino acid profile of hydrolysate of Bacillus sp. UPM-AAG1 revealed the presence of both essential amino acid and non-essential amino acids. The result is in accordance with Reference [19], that demonstrated the presence 17 different amino acid acquired from fermentation of Bacillus cereus utilizing chicken feather as sole their carbon and nitrogen sources. The fermented hydrolysate was rich with nutritionally essential amino acid particularly lysine, threonine, and methionine. Similarly, Ghosh et al. [59] reported on purified keratinolytic protease from feather waste hydrolysate by Bacillus cereus DCUW that comprises of 17 different amino acids.

4. Materials and Methods

4.1. Azokeratin and Keratinase Assay

Azo keratin substrate was prepared [60] with the modification where, instead of ball milling, the feather was cut into small pieces with a scissor. One gram of a finely cut white chicken feather, 20 mL deionized water, and 10% of NaHCO3 were mixed in a 100 mL round bottom flask. Separately, 0.174 g of sulfanilic acid was dissolved in 5 mL of 0.2 M NaOH. Next 0.069 g of NaNO2 was added to the suspension. The solution then was acidified with 0.4 mL of 5 M HCl for 2 min and neutralized by 0.4 mL of 5 M NaOH. The prepared solution was then added to finely cut feather keratin and mixed properly for 10 min. The reaction mixture then was filtered. Insoluble azo keratin was retrieved and rinsed with deionized water. The azo keratin was then suspended in water and shaken for 2 h at 50 °C. The pH of the filtrate and absorbance readings were taken periodically until the pH of the filtrate reached 6.0–7.0 and the absorbance value was less than 0.01 [60]. The resulting azokeratin (Supplementary Figure S1) is utilized for keratinase assay. All experiments were carried out three times unless otherwise stated.
The keratinase activity was determined using azo keratin as a substrate. 5 mg azo keratin substrate was added to 1.5 mL mini centrifuges tube together with 800 µL of 0.1 M phosphate buffer pH 8.0. Then, 200 µL of enzyme supernatant was added to the mixture. The mixture was vortexed thoroughly and incubated at 30 °C for 30 min in a water bath. The enzymatic reaction was stopped by 200 µL of 10% (w/v) trichloroacetic acid added to the mixture, and the absorbance was read at 450 nm (DTX 800-Multimode detector, Beckman Coulter, Brea, CA, USA). Control was prepared by adding trichloroacetic acid (TCA) to the mixture before the enzyme. One unit of keratinase activity was defined as 0.010 unit increase in the absorbance at 450 nm compared to control [48]. All experiments were carried out in triplicate, unless stated otherwise.

4.2. Isolation and Screening of Bacillus sp. with Keratinolytic Activity

Soil samples and poultry waste specimens were collected from a waste collection area of a poultry research farm in Universiti Putra Malaysia. One percent (w/v) of each soil samples and poultry waste were dissolved in 10 mL of sterilized phosphate buffer saline (PBS) and incubated in 80 °C water bath for 10 min to further biased the selection towards spore-forming Bacillus species. The PBS medium used was adopted from Dulbecco and Vogt [61]. The suspension (100 µL) was spread on nutrient agar (NA) supplemented with keratin substrate. The plates were incubated at room temperature (25 °C) for 24–48 h. Surviving bacteria that showed different morphology and high hydrolysis zone on NA were further re-streaked on NA until pure cultures were obtained [62].
All potentially isolated keratinase-producing bacteria were screened according to the ability to develop endospore under stress environment in a sporing medium (pH 7.0) composed of g/L: 1.6 NH4 Cl, 0.9 K2HPO4, 0.6 KH2 PO4, 0.2 MgSO4·7H2O, and 0.07 CaCl·2H2O, 0.01 FeSO4·7H2O and 0.01 EDTA for two days at 25 °C under shaking condition at 150 rpm. All strains were spore stained with malachite green and safranin according to Reference [63]’s method and observed under a light microscope (Olympus BX.40F4, Japan) with 100× magnification [64]. Positive endospore-forming isolate were further screened based on bacterial growth (CFU/mL) on feather meal agar (FMA) composed of (g/L); 1.0 feather, 0.5 NaCl, 0.7 K2HPO4, 0.001 MgSO4·6H2O and 15.0 bacteriological agar and keratinase assay with 1% feather as sole carbon and nitrogen sources [48].

4.3. Morphological, Biochemical and Molecular Identification of Keratinolytic Microorganism

The identity of the selected bacterium was further identified morphologically using Gram staining method and a series of biochemical test (oxidase test, catalase, Voges-Proskauer, nitrate, citrate, lipase, and gelatinase) [64]. Meanwhile, molecular identification confirmation was performed by 16S rDNA sequence analysis using a 24 h culture of the bacterial cell using InnuPREP Bacteria DNA Kit (Analytik Jena, Jena, Germany) according to the manufacturer’s protocol. Amplification of the partial 16S rRNA gene was carried out using universal primers. The PCR mixtures comprise of mixtures of 1μL of 5 mM 27F (5′-AGA GTT TGATCC TGG CTC AG-3′) and 1429R (5′-TAC GGT TACCTT GTT ACG ACTT-3′) of forward and reverse primer, 1 μL of DNA sample, 12.5 μL of Master mix 2 × Taq (Vivantis Technologies Sdn. Bhd., Selangor, Malaysia) and 9.5 μL sterile deionized water for a final volume of 25 μL. The polymerase chain reaction was accomplished using a gradient thermocycler (Hercuvan, Milton, UK) under the following conditions: 3 min initial denaturation at 94 °C, 29 cycles denaturation for 1 min at 94 °C, 1 min of annealing at 58 °C, 2 min of extension for 10 min, and final extension at 72 °C for 10 min with incubation at 4 °C. Successfully amplified DNA fragments were analyzed on 1% (w/v) agarose gel [65].

4.4. Sequence Analysis and Phylogenetic Analysis

The selected sequence was analyzed using BLASTn [66]. Twenty sequence alignment with more than 95% similarity was selected for further analysis using neighbor-joining method, as in Ref. [67], fitting to the distances of Jukes-Cantor [68]. Phylogenetic analysis was done using PHYLIP software v3.696 (http://evolution.genetics.washington.edu/phylip.htmL). E. coli strain U5/41 was used as the outgroups in the cladogram for identification analysis. The confidence level of each branch was calculated by 1000 bootstraps replicates. The constructed tree was viewed using Tree View version 1.6.6.

4.5. Optimization of Keratinase Activity Using Response Surface Methodology

The effect of four factors namely temperature, inoculum size (v/v), pH, and feather concentration (w/v) on keratinase production was screened statistically using Plackett-Burman factorial design (PBFD) to verify the significance of the named factors in the production of keratinase. The experimental design and statistical analysis were performed using statistical software Design-Expert® 6.0.8 (Stat-Ease, Minneapolis, MN, USA). Each independent factor was evaluated at two different levels; minimum and maximum levels (+1, −1) as shown in Table 8. Keratinase activity was analyzed as the response. The independent factors that show significance by PBFD were optimized further for their interaction effects by composite design (CCD) of response surface methodology (RSM). Each independent factor was studied at five different level: −α, −1, 0, +1, +α. Keratinase activity was evaluated as a response based on 30 experimental design. All experiments were conducted in triplicate, and keratinase activity was examined as the response using a second-order polynomial equation as below:
y = i = 1 k β i X i + i k β i i X i 2 + 1 i j k β i j X i X j
where Y is the predicted response, X is the independent factor that is affected by Y, k is the number of factors, β0 is the constant term, βi is the linear coefficient, βii is the i the quadratic coefficient, and βij is the ij the interaction coefficient, whereas i and j = 1,2,3 and ij are coefficient in the model. The significance of each coefficient in the equation was determined by Fisher’s F test and analysis of variances (p < 0.05). The experimental design and statistical analysis were performed using statistical software Design-Expert® 6.0.8 (Stat-Ease, Minneapolis, MN, USA). All experiments were conducted in triplicate.

4.6. Amino Acid Profile of Hydrolysate

Amino acid profile of hydrolysate was performed according to a previous method [69], with slight modifications. The amino acid profile of sample hydrolysate was determined using an HPLC system (Agilent 1200, Agilent Technologies, Santa Clara, CA, USA). The sample was subjected to automated pre-column derivatization using orthopthalaldehyde (OPA) run through the injector program. The injector program protocols were as follows where 2.5 μL were drawn from a borate buffer vial (0.4 min, pH 10.2). Next, 0.5 μL of the sample was drawn from a sample vial, followed by mixing with 3 μL in a wash port five times and waiting for 0.2 min. Next, 0.5 μL of orthopthalaldehyde (OPA) was drawn, followed by mixing of 3.5 μL in wash port 6 times. Next, 32 μL of injection diluent (1 mL of mobile phase A + 15 μL of concentrated H3PO3) was mixed with 20 μL in seat 8 times. The sample was injected, then wait for 0.10 min and valve bypass. The mobile phase A consisted of 10 mM of Na2HPO4, 10 mM Na2B4O7, pH 8.2, and mobile phase B (acetonitrile-methanol-water; 45:45:10, v/v). A programmed gradient elution was performed from 2% B to 57% B for 7 min, followed by 57% B to 100% B for 8.4 min, with a flow rate of 1.5 mL/min at 40 °C. Amino acid detection was detected with a 250 nm Diode Array Detector (DAD) detector using an amino acid standard solution (Sigma-Aldrich, St. Louis, MO, USA).

5. Conclusions

The reliability of statistical optimization of the external parameter in enhancing keratinase production Bacillus sp. UPM-AAG1 I was demonstrated in this work. The significant parameter required for the optimum keratinase production was screened using Plackett-Burman design. Optimization of keratinase by RSM allowed us to evaluate the effect of various parameter at different levels. The CCD design applied results 1.7-fold in keratinase yield. The acceptable degree of similarity between the predicted model and actual activity signifies the reliability of the statistical model in optimization of keratinase. The optimized parameters and characteristics of the bacterium include optimal growth at near neutrality, ambient temperature, and able to support growth and keratinase production without external supplementary requirements. Moreover, the hydrolysate of Bacillus sp. UPM-AAG1 obtained through statistical optimization is rich in amino acids. These properties make the bacterium an excellent choice for local commercial application where keratinase production should be optimum at ambient temperature and no additional C or N sources should be added to minimize cost. In the future, cheaper, or even waste, materials from the local agricultural industries, such as waste bagasse or Palm Mill Oil Effluent or POME, may be tested to improve keratinase production and feather degradation in general.

Supplementary Materials

The following are available online at https://www.mdpi.com/2073-4344/10/8/848/s1, Figure S1: Azokeratin formation from feather keratin treated with the azotization of sulfanilic acid. Figure S2: Model diagnostic plots; (a) predicted versus actual, (b) studentized residue versus predicted, (c) normal plots of residue and (d) outlier T versus run.

Author Contributions

Conceptualization, M.Y.S. and N.A.Y.; methodology, M.Y.S.; software, S.A.A.; validation, M.E.K., M.Y.S. and N.A.Y.; formal analysis, A.A.G. and S.A.A.; investigation, A.A.G.; resources, M.Y.S.; data curation, M.Y.S.; writing—original draft preparation, A.A.A.; writing—review and editing, M.Y.S.; visualization, S.A.A.; supervision, M.E.K., M.Y.S. and N.A.Y.; project administration, M.Y.S.; funding acquisition, M.Y.S. All authors have read and agreed to the published version of the manuscript.

Funding

The authors would like to thank the support of the Graduate Research Fellowship University Putra Malaysia (GRF-UPM) given to Aa’ishah Abd Gafar.

Conflicts of Interest

The authors declare the results obtained in this study will be used in discussion for a possible transfer of technology to a local small and medium enterprise (SME) company, of which the company did not sponsor the works carried out in this study.

References

  1. Fang, Z.; Zhang, J.; Liu, B.; Du, G.; Chen, J. Biodegradation of wool waste and keratinase production in scale-up fermenter with different strategies by Stenotrophomonas maltophilia BBE11-1. Bioresour. Technol. 2013, 140, 286–291. [Google Scholar] [CrossRef] [Green Version]
  2. Brandelli, A.; Daroit, D.J.; Riffel, A. Biochemical features of microbial keratinases and their production and applications. Appl. Microbiol. Biotechnol. 2010, 85, 1735–1750. [Google Scholar] [CrossRef] [PubMed]
  3. Tiwary, E.; Gupta, R. Rapid Conversion of Chicken Feather to Feather Meal Using Dimeric Keratinase from Bacillus licheniformis ER-15. J. Bioprocess. Biotech. 2012, 2, 1000123. [Google Scholar] [CrossRef] [Green Version]
  4. Abdel-Fattah, A.M.; El-Gamal, M.S.; Ismail, S.; Emran, M.; Hashem, A. Biodegradation of feather waste by keratinase produced from newly isolated Bacillus licheniformis ALW1. J. Genet. Eng. Biotechnol. 2018, 16, 311–318. [Google Scholar] [CrossRef] [PubMed]
  5. Fang, Z.; Zhang, J.; Liu, B.; Jiang, L. Cloning, heterologous expression and characterization of two keratinases from Stenotrophomonas maltophilia BBE11-1. Process Biochem. 2014, 49, 647–654. [Google Scholar] [CrossRef]
  6. Pereira, J.Q.; Lopes, F.C.; Petry, M.V.; da Costa Medina, L.F.; Brandelli, A. Isolation of three novel Antarctic psychrotolerant feather-degrading bacteria and partial purification of keratinolytic enzyme from Lysobacter sp. A03. Int. Biodeterior. Biodegrad. 2014, 88, 1–7. [Google Scholar] [CrossRef]
  7. Mohamedin, A.H. Isolation, identification and some cultural conditions of a protease- producing thermophilic Streptomyces strain grown on chicken feather as a substrate. Int. Biodeterior. Biodegrad. 1999, 43, 13–21. [Google Scholar] [CrossRef]
  8. Syeda, D.G.; Leeb, J.C.; Lic, W.-J.; Kimb, C.-J.; Agasard, D. Production, characterization and application of keratinase from Streptomyces gulbargensis. Bioresour. Technol. 2009, 100, 1868–1871. [Google Scholar] [CrossRef]
  9. Malviya, H.K.; Rajak, R.C.; Hasija, S.K. Synthesis and regulation of extracellular keratinase in three fungi isolated from the grounds of a gelatin factory, Jabalpur, India. Mycopathologia 1992, 120, 1–4. [Google Scholar] [CrossRef]
  10. Ramakrishnaiah, G.; Mustafa, S.M.; Srihari, G. Studies on Keratinase Producing Fungi Isolated from Poultry Waste and their Enzymatic Activity. Microbiol. Res. 2013, 3, 148–151. [Google Scholar] [CrossRef]
  11. Lin, X.; Chung, G.L.; Casale, E.S.; Jason, C.H.S. Purification and characterization of a keratinase from a degrading Bacillus licheniformis strain. Appl. Environ. Microbiol. 1992, 58, 3271–3275. [Google Scholar] [CrossRef] [Green Version]
  12. Suntornsuk, W.; Suntornsuk, L. Feather degradation by Bacillus sp. FK 46 in submerged cultivation. Bioresour. Technol. 2003, 86, 239–243. [Google Scholar] [CrossRef]
  13. Schallmey, M.; Singh, A.; Ward, O.P. Developments in the use of Bacillus species for industrial production. Can. J. Microbiol. 2004, 50, 1–17. [Google Scholar] [CrossRef]
  14. Huang, Y.; Busk, P.K.; Herbst, F.-A.; Lange, L. Genome and secretome analyses provide insights into keratin decomposition by novel proteases from the non-pathogenic fungus Onygena corvina. Appl. Microbiol. Biotechnol. 2015, 99, 9635–9649. [Google Scholar] [CrossRef] [PubMed] [Green Version]
  15. El-Refai, H.A.; AbdelNaby, M.A.; Gaballa, A.; El-Araby, M.H.; Abdel Fattah, A.F. Improvement of the newly isolated Bacillus pumilus FH9 keratinolytic activity. Process Biochem. 2005, 40, 2325–2332. [Google Scholar] [CrossRef]
  16. Reddy, L.V.A.; Wee, Y.J.; Yun, J.S.; Ryu, H.W. Optimization of alkaline protease production by batch culture of Bacillus sp. RKY3 through Plackett-Burman and response surface methodological approaches. Bioresour. Technol. 2008, 99, 2242–2249. [Google Scholar] [CrossRef]
  17. Pillai, P.; Mandge, S.; Archana, G. Statistical optimization of production and tannery applications of a keratinolytic serine protease from Bacillus subtilis P13. Process Biochem. 2011, 46, 1110–1117. [Google Scholar] [CrossRef]
  18. Dettmer, A.; Cavalli, É.; Ayub, M.A.Z.; Gutterres, M. Optimization of the unhairing leather processing with enzymes and the evaluation of inter-fibrillary proteins removal: An environment-friendly alternative. Bioprocess Biosyst. Eng. 2012, 35, 1317–1324. [Google Scholar] [CrossRef] [PubMed]
  19. Lo, W.H.; Too, J.R.; Wu, J.Y. Production of keratinolytic enzyme by an indigenous feather-degrading strain Bacillus cereus WU2. J. Biosci. Bioeng. 2012, 114, 640–647. [Google Scholar] [CrossRef]
  20. Okoroma, E.A.; Garelick, H.; Abiola, O.O.; Purchase, D. Identification and characterisation of a Bacillus licheniformis strain with profound keratinase activity for degradation of melanised feather. Int. Biodeterior. Biodegrad. 2012, 74, 54–60. [Google Scholar] [CrossRef]
  21. Sahoo, D.K.; Das, A.; Thatoi, H.; Mondal, K.C.; Mohapatra, P.K.D. Keratinase production and biodegradation of whole chicken feather keratin by a newly isolated bacterium under submerged fermentation. Appl. Biochem. Biotechnol. 2012, 167, 1040–1051. [Google Scholar] [CrossRef] [PubMed]
  22. Sivakumar, T.; Shankar, T.; Vijayabaskar, P.; Ramasubramanian, V. Optimization for Keratinase Enzyme Production Using Bacillus thuringiensis TS2. Acad. J. Plant Sci. 2012, 5, 102–109. [Google Scholar] [CrossRef]
  23. E Silva, L.A.D.; Macedo, A.J.; Termignoni, C. Production of keratinase by Bacillus subtilis S14. Ann. Microbiol. 2014, 64, 1725–1733. [Google Scholar] [CrossRef]
  24. Govarthanan, M.; Selvankumar, T.; Selvam, K.; Sudhakar, C.; Kamala-Kannan, S. Response surface methodology based optimization of keratinase production from alkali-treated feather waste and horn waste using Bacillus sp. MG-MASC-BT. J. Ind. Eng. Chem. 2015, 27, 25–30. [Google Scholar] [CrossRef]
  25. Sanghvi, G.; Patel, H.; Vaishnav, D.; Oza, T.; Dave, G.; Kunjadia, P.; Sheth, N. A novel alkaline keratinase from Bacillus subtilis DP1 with potential utility in cosmetic formulation. Int. J. Biol. Macromol. 2016, 87, 256–262. [Google Scholar] [CrossRef]
  26. Reddy, M.R.; Reddy, K.S.; Chouhan, Y.R.; Bee, H.; Reddy, G. Effective feather degradation and keratinase production by Bacillus pumilus GRK for its application as bio-detergent additive. Bioresour. Technol. 2017, 243, 254–263. [Google Scholar] [CrossRef]
  27. Lateef, A.; Oloke, J.K.; Gueguim Kana, E.B.; Sobowale, B.O.; Ajao, S.O.; Bello, B.Y. Keratinolytic activities of a new feather-degrading isolate of Bacillus cereus LAU 08 isolated from Nigerian soil. Int. Biodeterior. Biodegrad. 2010, 64, 162–165. [Google Scholar] [CrossRef]
  28. Kothari, D.; Rani, A.; Goyal, A. Keratinase. In Current Developments in Biotechnology and Bioengineering: Production, Isolation and Purification of Industrial Products; Elsevier: London, UK, 2017; pp. 447–469. ISBN 9780444636621. [Google Scholar]
  29. Walker, R.; Powell, A.A.; Seddon, B. Bacillus isolates from the spermosphere of peas and dwarf French beans with antifungal activity against Botrytis cinerea and Pythium species. J. Appl. Microbiol. 1998, 84, 791–801. [Google Scholar] [CrossRef]
  30. Monteiro, S.M.; Clemente, J.; Henriques, A.O.; Gomes, R.J.; Carrondo, M.J. A Procedure for High-Yield Spore Production by Bacillus subtilis. Biotechnol. Prog. 2005, 21, 1026–1031. [Google Scholar] [CrossRef]
  31. Tan, I.S.; Ramamurthi, K.S. Spore formation in Bacillus subtilis. Environ. Microbiol. Rep. 2014, 6, 212–225. [Google Scholar] [CrossRef] [Green Version]
  32. Riffel, A.; Brandelli, A. Keratinolytic bacteria isolated from feather waste. Braz. J. Microbiol. 2006, 37, 395–399. [Google Scholar] [CrossRef] [Green Version]
  33. Zhang, R.X.; Gong, J.S.; Su, C.; Zhang, D.D.; Tian, H.; Dou, W.F.; Li, H.; Shi, J.S.; Xu, Z.H. Biochemical characterization of a novel surfactant-stable serine keratinase with no collagenase activity from Brevibacillus parabrevis CGMCC 10798. Int. J. Biol. Macromol. 2016, 93, 843–851. [Google Scholar] [CrossRef]
  34. Laba, W.; Choinska, A.; Rodziewicz, A.; Piegza, M.; Laba, W.; Choinska, A.; Rodziewicz, A.; Piegza, M. Keratinolytic abilities of Micrococcus luteus from poultry waste. Braz. J. Microbiol. 2015, 46, 691–700. [Google Scholar] [CrossRef] [PubMed] [Green Version]
  35. Arokiyaraj, S.; Varghese, R.; Ahmed, B.A.; Duraipandiyan, V.; Al-dhabi, N.A. Optimizing the fermentation conditions and enhanced production of keratinase from Bacillus cereus isolated from halophilic environment. Saudi J. Biol. Sci. 2019, 26, 378–381. [Google Scholar] [CrossRef] [PubMed]
  36. Vidmar, B.; Vodovnik, M. Microbial Keratinases: Enzymes with Promising Biotechnological Applications. Food Technol. Biotechnol. 2018, 56, 312–328. [Google Scholar] [CrossRef]
  37. Khodayari, S.; Kafilzadeh, F. Separating Keratinase Producer Bacteria from the Soil of Poultry Farms and Optimization of the Conditions for Maximum Enzyme Production. Eur. J. Exp. Biol. 2018, 8, 1–8. [Google Scholar] [CrossRef]
  38. Fang, Z.; Zhang, J.; Liu, B.; Du, G.; Chen, J. Biochemical characterization of three keratinolytic enzymes from Stenotrophomonas maltophilia BBE11-1 for biodegrading keratin wastes. Int. Biodeterior. Biodegrad. 2013, 82, 166–172. [Google Scholar] [CrossRef]
  39. Fakhfakh-Zouari, N.; Haddar, A.; Hmidet, N.; Frikha, F.; Nasri, M. Application of statistical experimental design for optimization of keratinases production by Bacillus pumilus A1 grown on chicken feather and some biochemical properties. Process Biochem. 2010, 45, 617–626. [Google Scholar] [CrossRef]
  40. Cai, C.; Zheng, X. Medium optimization for keratinase production in hair substrate by a new Bacillus subtilis KD-N2 using response surface methodology. J. Ind. Microbiol. Biotechnol. 2009, 36, 875–883. [Google Scholar] [CrossRef]
  41. Kumar, R.; Balaji, S.; Uma, T.S. Optimization of influential parameters for extracellular keratinase production by Bacillus subtilis (MTCC9102) in solid state fermentation using horn meal -A biowaste management. Appl. Biochem. Biotechnol. 2010, 160, 30–39. [Google Scholar] [CrossRef]
  42. Mazotto, A.M.; Cedrola, S.M.L.; Lins, U.; Rosado, A.S.; Silva, K.T.; Chaves, J.Q.; Rabinovitch, L. Keratinolytic activity of Bacillus subtilis AMR using human hair. Soc. Appl. Microbiol. 2010, 50, 89–96. [Google Scholar] [CrossRef] [PubMed]
  43. Tiwary, E.; Gupta, R. Medium optimization for a novel 58 kDa dimeric keratinase from Bacillus licheniformis ER-15: Biochemical characterization and application in feather degradation and dehairing of hides. Bioresour. Technol. 2010, 101, 6103–6110. [Google Scholar] [CrossRef] [PubMed]
  44. Fakhfakh, N.; Kanoun, S.; Manni, L.; Nasri, M. Production and biochemical and molecular characterization of a keratinolytic serine protease from chicken feather-degrading Bacillus licheniformis RPk. Can. J. Microbiol. 2009, 55, 427–436. [Google Scholar] [CrossRef]
  45. Mazotto, A.M.; Coelho, R.R.R.; Cedrola, S.M.L.; De Lima, M.F.; Couri, S.; Paraguai De Souza, E.; Vermelho, A.B. Keratinase production by three Bacillus spp. using feather meal and whole feather as substrate in a submerged fermentation. Enzyme Res. 2011, 2011. [Google Scholar] [CrossRef] [PubMed] [Green Version]
  46. Gupta, R.; Beg, Q.; Lorenz, P. Bacterial alkaline proteases: Molecular approaches and industrial applications. Appl. Microbiol. Biotechnol. 2005, 59, 15–32. [Google Scholar] [CrossRef]
  47. Mousavi, S.; Salouti, M.; Shapoury, R.; Heidari, Z. Optimization of keratinase production for feather degradation by Bacillus subtilis. Jundishapur J. Microbiol. 2013, 6. [Google Scholar] [CrossRef] [Green Version]
  48. Yusuf, I.; Ahmad, S.A.; Phang, L.Y.; Syed, M.A.; Shamaan, N.A.; Abdul Khalil, K.; Dahalan, F.A.; Shukor, M.Y. Keratinase production and biodegradation of polluted secondary chicken feather wastes by a newly isolated multi heavy metal tolerant bacterium-Alcaligenes sp. AQ05-001. J. Environ. Manag. 2016, 183, 182–195. [Google Scholar] [CrossRef]
  49. Covino, S.; D’Annibale, A.; Stazi, S.R.; Cajthaml, T.; Čvančarová, M.; Stella, T.; Petruccioli, M. Assessment of degradation potential of aliphatic hydrocarbons by autochthonous filamentous fungi from a historically polluted clay soil. Sci. Total Environ. 2015, 505, 545–554. [Google Scholar] [CrossRef]
  50. Riffel, A.; Lucas, F.; Heeb, P.; Brandelli, A. Characterization of a new keratinolytic bacterium that completely degrades native feather keratin. Arch. Microbiol. 2003, 179, 258–265. [Google Scholar] [CrossRef]
  51. Pillai, P.; Archana, G. Hide depilation and feather disintegration studies with keratinolytic serine protease from a novel Bacillus subtilis isolate. Appl. Microbiol. Biotechnol. 2008, 78, 643–650. [Google Scholar] [CrossRef]
  52. Balaji, S.; Kumar, M.S.; Karthikeyan, R.; Kumar, R.; Kirubanandan, S.; Sridhar, R.; Sehgal, P.K. Purification and characterization of an extracellular keratinase from a hornmeal-degrading Bacillus subtilis MTCC (9102). World J. Microbiol. Biotechnol. 2008, 24, 2741–2745. [Google Scholar] [CrossRef]
  53. Bansal, M.; Sudhakara Reddy, M.; Kumar, A. Optimization of cell growth and bacoside—A production in suspension cultures of Bacopa monnieri (L.) Wettst. using response surface methodology. In Vitro Cell. Dev. Biol. Plant 2017, 53, 527–537. [Google Scholar] [CrossRef]
  54. Whitcomb, P.J.; Anderson, M.J. RSM Simplified: Optimizing Processes Using Response Surface Methods for Design of Experiments; Productivity Press: New York, NY, USA, 2004; ISBN 978-1-56327-297-4. [Google Scholar]
  55. Manogaran, M.; Shukor, M.Y.; Yasid, N.A.; Johari, W.L.W.; Ahmad, S.A. Isolation and characterisation of glyphosate-degrading bacteria isolated from local soils in Malaysia. Rend. Lincei 2017, 28, 471–479. [Google Scholar] [CrossRef]
  56. Roslan, M.A.H.; Abdullah, N.; Mustafa, S. Removal of shells in palm kernel cake via static cling and electrostatic separation. J. Biochem. Microbiol. Biotechnol. 2015, 3, 1–6. [Google Scholar]
  57. Aziz, N.F.; Halmi, M.I.E.; Johari, W.L.W. Statistical optimization of hexavalent molybdenum reduction by Serratia sp. strain MIE2 using Central Composite Design (CCD). J. Biochem. Microbiol. Biotechnol. 2017, 5, 8–11. [Google Scholar]
  58. Richa, K.; Bose, H.; K, S.; Loganathan, K.; Kumar, G.; Rao, B. Response surface optimization for the production of marine eubacterial protease and its application. Res. J. Biotechnol. 2013, 8, 78–85. [Google Scholar]
  59. Ghosh, A.; Chakrabarti, K.; Chattopadhyay, D. Degradation of raw feather by a novel high molecular weight extracellular protease from newly isolated Bacillus cereus DCUW. J. Ind. Microbiol. Biotechnol. 2008, 35, 825–834. [Google Scholar] [CrossRef]
  60. Joshi, S.G.; Tejashwini, M.M.; Revati, N.; Sridevi, R.; Roma, D. Isolation, identification and characterization of feather degrading bacteria. Int. Journall Poult. Sci. 2007, 6, 689–693. [Google Scholar] [CrossRef] [Green Version]
  61. Dulbecco, R.; Vogt, M. Plaque formation and isolation of pure lines with poliomyelitis viruses. J. Exp. Med. 1954, 99, 167–182. [Google Scholar] [CrossRef] [Green Version]
  62. Gajbhiye, A.; Rai, A.R.; Meshram, S.U.; Dongre, A.B. Isolation, evaluation and characterization of Bacillus subtilis from cotton rhizospheric soil with biocontrol activity against Fusarium oxysporum. World J. Microbiol. Biotechnol. 2010, 26, 1187–1194. [Google Scholar] [CrossRef]
  63. Schaeffer, A.B.; Fulton, M.D. A simplified methode of staining endospores. Science 1933, 77, 1990. [Google Scholar] [CrossRef] [PubMed]
  64. Cappuccino, J.; Sherman, N. Microbiology: A Laboratory Manual, 10th ed.; Pearson: London, UK, 2010. [Google Scholar]
  65. Habib, S.; Ahmad, S.A.; Johari, W.L.W.; Shukor, M.Y.A.; Alias, S.A.; Khalil, K.A.; Yasid, N.A. Evaluation of conventional and response surface level optimisation of n-dodecane (n-C12) mineralisation by psychrotolerant strains isolated from pristine soil at Southern Victoria Island, Antarctica. Microb. Cell Factories 2018, 17, 1–21. [Google Scholar] [CrossRef] [PubMed]
  66. Altschul, S.F.; Madden, T.L.; Schäffer, A.A.; Zhang, J.; Zhang, Z.; Miller, W.; Lipman, D.J. Gapped BLAST and PSI-BLAST: A new generation of protein database search programs. Nucleic Acids Res. 1997, 25, 3389–3402. [Google Scholar] [CrossRef] [PubMed] [Green Version]
  67. Saitou, N.; Nei, M. The Neighbor-joining Method: A New Method for Reconstructing Phylogenetic Trees’. Mol. Biol. Evol. 1987, 4, 406–425. [Google Scholar] [PubMed]
  68. Jukes, T.H.; Cantor, C.R. Evolution of protein molecules. In Mammalian Protein Metabolism; Munro, N., Ed.; Academic Press: New York, NY, USA, 1969; Volume 3, pp. 21–132. [Google Scholar]
  69. Jones, B.N.; Gilligan, J.P. o-phthaldialdehyde precolumn derivatization and reversed-phase high-performance liquid chromatography of polypeptide hydrolysates and physiological fluids. J. Chromatogr. A 1983, 266, 471–482. [Google Scholar] [CrossRef]
Figure 1. Screening result of three isolates with 1% feather. Error bars represent mean ± standard deviation (n = 3).
Catalysts 10 00848 g001
Figure 2. Phylogram (neighbor-joining method) showing the genetic relationship between strain UPM-AAG1 and other related reference micro-organisms based on the 16S rRNA gene sequence analysis. Species names are followed by the strain of their16S rRNA sequences. The numbers at branching points or nodes refer to bootstrap values, based on 1000 resamplings (GenBank MK285608.1).
Catalysts 10 00848 g002
Figure 3. Response surface 3D plot showing the interaction of factors affecting keratinase production (a) pH and temperature, (b) inoculum size and temperature, (c) feather concentration and temperature, (d) pH and inoculum size, (e) pH and feather concentration, and (f) feather concentration and inoculum size.
Catalysts 10 00848 g003
Figure 4. Amino acid profile of Bacillus sp. UPM-AAG1 hydrolysate. Error bars represent mean ± standard deviation (n = 2).
Catalysts 10 00848 g004
Figure 5. High-performance liquid chromatography (HPLC) chromatogram of chicken feather degradation lysate by Bacillus sp. strain UPMAGG-1.
Catalysts 10 00848 g005
Table 1. Morphology of isolated microorganism.
IsolateMorphology
UPM-AAG1Circular, White, Dry, Flat
UPM-AAG6Irregular, Dry, White, Flat
UPM-AAG14Irregular, Dry, White, Flat
UPM-AAG15Irregular, Dry, White, Flat
UPM-AAG16Irregular, Dry, White, Flat
Table 2. Prescreening of significant parameters using Plackett-Burman design matrix with keratinase activity as the response (±standard deviation, n = 3).
RunFactors
Temperature (°C)Inoculum (v/v)pHFeather Concentration (w/v)Keratinase Activity (U/mL)
ABCD
125.0010.005.001.006.4 ± 0.25
225.0010.008.005.008.7 ± 0.07
335.005.008.001.007.6 ± 0.13
435.0010.005.005.009.7 ± 0.26
535.0010.008.001.007.7 ± 0.01
635.0010.005.005.009.3 ± 0.11
725.005.005.001.008.3 ± 0.14
825.005.005.005.0012.5 ± 0.28
925.0010.008.001.005.8 ± 0.1
1035.005.005.001.0012 ± 0.16
1125.005.008.005.0010.5 ± 0.01
1235.005.008.005.007.8 ± 0.26
SourceFactorsF-Valuep-Value Remarks
Model 70.330.0025 Significant
ATemperature16.980.0259 Significant
BInoculum63.750.0041 Significant
CpH179.380.0009 Significant
DFeather72.240.0034 Significant
Value
R20.9947
Adjusted R20.9806
Predicted R20.8955
Adeq Precision26.980
Table 3. Optimization of keratinase activity by strain AAG-1 using central composite design (CCD) with six center points showing observed and predicted values (±standard deviation, n = 3).
Run OrderX1: TemperatureX2: InoculumX3: pHX4: Feather (w/v)Keratinase Activity (U/mL)
Experimental ValuePredicted Value
135.005.005.505.0042 ± 1.8742.42
225.005.005.505.0042.3 ± 1.7546.18
330.007.506.753.0041.1 ± 1.7438.85
430.007.506.753.0048 ± 0.2848
535.005.005.501.0022.5 ± 1.6222.56
635.0010.008.001.0031.9 ± 1.5729.97
735.0010.005.505.0038.4 ± 0.7640.99
830.007.504.253.0055.7 ± 0.4953.8
925.0010.008.005.0050.5 ± 1.8154.68
1035.005.008.001.0056.6 ± 0.5154.34
1125.005.008.001.0014.9 ± 0.7617.15
1235.0010.008.005.0020 ± 1.0222.21
1325.005.008.005.0033.1 ± 0.4333.42
1420.007.506.753.0032.2 ± 0.8636.73
1540.007.506.753.0019.5 ± 0.5417.9
1635.005.008.005.0026.7 ± 0.8626.6
1730.0012.506.753.0020.2 ± 1.9118.52
1825.0010.005.505.0031.9 ± 0.1130.98
1930.007.506.75-1.0060.1 ± 156.8
2025.0010.008.001.0042.4 ± 0.6143.1
2125.005.005.501.0047.4 ± 0.8444.48
2230.002.506.753.0028.7 ± 0.5429.02
2330.007.506.753.0041.6 ± 1.1242.47
2435.0010.005.501.0031 ± 1.1127.53
2530.007.506.753.0045.1 ± 0.7549.2
2630.007.506.753.0044 ± 1.8749.2
2730.007.506.753.0050.6 ± 0.849.2
2830.007.509.253.0052.4 ± 1.1249.2
2930.007.506.757.0051.1 ± 1.6949.2
3025.0010.005.501.0052 ± 1.6749.2
Table 4. ANOVA analysis of CCD for optimization of keratinase activity by Bacillus sp. strain UPM-AAG1.
SourceSum of SquaresDFMean SquareF ValueProb > F
Model4308.84114307.774323.79177<0.0001significant
A191.19471191.194714.779860.0016
B21.89327121.893271.6924080.2129
C235.71611235.716118.221480.0007
D1089.71411089.71484.23776<0.0001
A21024.80411024.80479.22009<0.0001
B2265.71861265.718620.540750.0004
C20.96428610.9642860.0745420.7886
D2345.66861345.668626.72110.0001
AB13.3225113.32251.0298650.3263
AC29.16129.162.2541450.1540
AD16.81116.811.2994580.2722
BC484148437.41448<0.0001
BD1.9611.960.1515130.7026
CD1152.60311152.60389.09923<0.0001
Residual194.04251512.93617
Lack of Fit126.54251012.654250.9373520.5669not significant
Pure Error67.5513.5
Cor Total4502.88329
Std. Dev.3.596688 R-Squared0.956907
Mean39.13 Adj R-Squared0.916687
C.V.9.191639 Pred R-Squared0.816543
PRESS826.0848 Adeq Precision15.58869
Table 5. Numerical optimization for selected criteria for keratinase activity by Bacillus sp. strain UPMAGG-1.
LowerUpperLowerUpper
NameGoalLimitLimitWeightWeightImportance
Temperatureminimize2535113
pHis in range 5.58113
Inoculumminimize 510113
Feather maximize 15113
Keratinase Activitymaximize 14.960.1115
Table 6. Suggested value for each variable for optimum keratinase activity by Bacillus sp. strain UPMAGG-1.
NumberTemperaturepHInoculumFeatherKeratinase ActivityDesirability
125.057.005.005.0056.2180.968
Table 7. Summary of keratinase production by Bacillus spp.
OrganismOptimization ModelOptimum Temperature (°C)Keratinase Activity (U/mL)Substrate during OptimizationCarbon Sources during OptimizationNitrogen Sources during OptimizationTime (h)References
Bacillus pumilus A1OFAT
Plackett-Burman
CCD
3087.73 U/mLheat-treated chicken feather mealheat-treated chicken feather mealpeptone24[39]
Bacillus subtilis P13OFAT
Plackett-Burman
Box–Behnken
room2.07 U/mLsoybean mealsoybean mealsoybean meal24[17]
Bacillus sp. RKY3Plackett-Burman CCD-ns-939 U/mLcorn starch, corn steep liquorcorn starchcorn steep liquor24[16]
Bacillus
thuringiensis TS2
OFAT5090.78 U/mLfeather mealstarchyeast extract96[22]
B. Subtilis KD-N2OFAT2360.9 U/mLfeather sucrosefeather30[40]
Bacillus subtilis DP1OFAT37379.65 U/mLfeather coffeefeather coffeefeather coffee96[25]
Bacillus subtilis (MTCC9102)OFAT3715.972 U/mLhorn mealdextrosepeptone48[41]
Bacillus licheniformis ALW1OFAT6572.2 U/mLnative feathergalactosecorn steep liquor96[4]
Bacillus pumilus GRKOFAT37373 U/mLfeather featherfeather24[26]
Bacillus subtilis AMROFAT50163 U/mLhuman hairyeast extractyeast extract192[42]
Bacillus cereus
LAU 08
OFAT5051.7 U/mLfeather powderfeather powderfeather powder72[27]
Bacillus licheniformisOFAT5011 U/mLfeather mealfeather mealfeather meal32[20]
B. subtilis BLBC17CCD33170 U/mLsoybean mealsoybean mealyeast extract48[18]
Bacillus licheniformis ER-15:OFAT
PB
CCD
701962 U/mLfeatherglucosesoy flour48[43]
Bacillus subtilis S14OFAT
CCD
505.5 U/mLfeather mealfeather mealfeather meal24[23]
Bacillus cereus Wu2OFAT301750 U/mLchicken feather powderchicken feather powdernh4cl96[19]
Bacillus weihenstephanensisOFAT4015.3 U/mLchicken feathercellulose(NH4)2 SO4168[21]
Bacillus pumilus
FH9
OFAT37647 U/mLchicken featherchicken featherNH4CL yeast extract48[15]
Bacillus sp. 5 MG-MASC-BTBBD551075 U/mLalkali-treated soluble keratinalkali-treated soluble keratinalkali-treated soluble keratin60[24]
Bacillus licheniformis RPkOFAT6037.35 U/mLchicken featherchicken featheryeast extract-[44]
B. subtilis 1273--412 U/mLfeather mealfeather mealfeather meal168[45]
Bacillus sp. UPM-AAG1PB
CCD
3060.1 U/mLchicken featherchicken featherchicken feather24 Current study
Table 8. Experimental factors and level of minimum and maximum range for statistical screening using Plackett-Burman factorial design (PBFD).
FactorsIndependent FactorUnitRange Level
Minimum (−1)Maximum (+1)
X1Temperature(°C)2535
X2Inoculum% (v/v)15
X3pH-58
X4Feather (w/v)% (w/v)15

