Article

Numerical Investigation of Ventilation Air Methane Catalytic Combustion in Circular Straight and Helical Coil Channels with Twisted Tape Insert in Catalytic-Monolith Reactors

1
Department of Mining and Materials Engineering, McGill University, 3450 University, Frank Dawson Adams Bldg., Montreal, QC H3A 2A7, Canada
2
Department of Mechanical Engineering, UniversitiTeknologi PETRONAS, Bandar Seri Iskandar 32610, Perak Darul Ridzuan, Malaysia
3
State Key Laboratory of Mining Disaster Prevention and Control, Shandong Univ. of Science and Technology, Qingdao 266590, China
*
Author to whom correspondence should be addressed.
Catalysts 2020, 10(7), 797; https://doi.org/10.3390/catal10070797
Submission received: 22 June 2020 / Revised: 10 July 2020 / Accepted: 13 July 2020 / Published: 17 July 2020
(This article belongs to the Special Issue Catalytic Reactors Design for Industrial Applications)

Abstract

:
In a catalytic combustion of ventilation air methane, one of the key factors determining the reactor performance is the geometry of the reactor. It should be designed to provide maximum energy conversion at minimum catalyst usage and operating cost. This numerical study is conducted to investigate the catalytic combustion of ventilation air methane from a gassy underground mine in a circular straight and helical reactor channel with twisted tape insert. A three-dimensional computational fluid dynamics model which considers conservation of mass, momentum, energy, and species together with chemical reactions, and constitutive relations for species properties and reactions kinetics was developed and validated against the previously published data. The effect of several key factors affecting the catalytic combustion performance such as inlet Reynolds number, twisted tape ratio, and reactor length are evaluated to obtain the optimum reactor parameters. For evaluation purpose, the reaction performance of the studied reactors will be compared to the straight reactor without twisted tape which is set as a baseline. The results give a firm confirmation on the superior performance of the reactors with twisted tape insert as compared to those without. In addition, it is found that helical reactors generate higher net power as compared to their respective straight reactor counterpart despite having lower FoM due to larger catalyst area. Interestingly, the higher twisting ratio offers better performance in terms of net power as well as FoM. Overall, the results highlight the potential of twisted tape insert application in catalytic combustion.

1. Introduction

Underground coal mine activities, especially gassy mines, are a major contributor to emissions of methane, an important greenhouse gas that has global warming potential 20 times higher than CO2. Methane emissions from coal mining account for about 22% of anthropogenic emissions from energy sector [1]. Methane is continuously produced in the active mining area during the mineral deposit excavation and released to the atmosphere through the main ventilation shaft. Its flammable and explosive nature pose risk to underground mine operation and sometime result in fatal incidents [2,3]. Furthermore, the common practise of releasing a large volume of this diluted methane gas to the atmosphere has triggered global alarm due to its potent greenhouse effect. Kholod et al. [4] suggested that methane emissions will grow considerably in the coming years and estimated total coal mine methane emissions to reach 432 billion cubic meters per year by 2100. Despite its low methane concentration (mostly below 1% [5]) which makes conventional combustion an insurmountable task, ventilation air methane is still a potential alternative fuel source that can be utilized with suitable methods and technologies.
Generally, ventilation air methane (VAM) can be used as combustion air (ancillary uses) or as the main fuel (principal uses) [6]. For its utilization as primary fuel, various technologies have been proposed including concentrators, lean burn gas turbines [7], thermal flow reserve reactors [8], catalytic flow reserve reactors [9], and catalytic-monolith reactors [6]. A concentrator may be used to either concentrate methane for direct combustion or to facilitate another VAM utilization method. Lean burn gas turbine has recently emerged as a promising technology in VAM utilization. Nevertheless, it is generally designed to operate at 1.6% methane concentration which makes it unsuitable for most mines where methane concentration is less than 1%. Thermal flow reversal reactor (TFRR) and catalytic flow reversal reactor (CFRR) share the same operating principles, i.e., the flow-reversal principle to transfer heat from methane combustion to a solid medium (e.g., a bed of silica gravels or ceramic heat exchange medium) then to the incoming air to raise its temperature to the ignition temperature of methane [1,6]. In CFRR, the auto-ignition temperature of methane in ventilation air results in operational advantages such as lower pressure drops and heat losses, requirement of smaller equipment, and negligible production of nitrogen oxides [10]. CFFR offers up to 90% VAM oxidation [1], greatly reduces methane emissions, and allows for considerable energy extraction. Nevertheless, CFRR has relatively narrow methane concentration range to operate effectively: too low methane concentration (below 0.4%) cannot maintain the auto-ignition of the methane while too high methane concentration (above 0.8%) may lead to catalyst degradation and destruction. Overall, the main limitation of the flow reversal technologies is in the difficulty to extract useful energy for power generation—heat recovered must be transferred into a working fluid [6]. The catalytic-monolith reactors (CMR), on the other hand, utilizes a monolith honeycomb reactor containing hundreds of parallel channels rather than particle beds employed in TFRR and CFRR. This honeycomb-type monolithic structure is superior for its outstanding characteristics of very low pressure drop at high mass throughputs and high mechanical strength [11].
The TFRR, CFRR, and CMR technologies are promising VAM mitigation methods and have received widespread attention. Aube and Sapoundjiev [12] developed two-dimensional reverse-flow methane combustion model to predict the transient behaviour of laboratory-scale flow reversal reactors. By taking into account the radial effects related to the thermal insulation, the model could accurately predict the dynamic behaviour of the CFRR even for small reactor diameter and low air flow rate. Gosiewski [13] constructed a one-dimensional model for catalytic combustion of methane in a reverse-flow reactor with manganese and palladium catalyst. High heat recovery could be obtained at the expense of high catalyst temperature. It is worth noting that high temperature may promote homogeneous combustion which leads to catalyst deactivation. Wang et al. [5] experimentally evaluated the effects of initial temperature, cycle time, feed gas concentration, and space velocity on catalytic combustion of VAM in a vertical reactor. It was found that the reactor could run under a wide range of operating conditions with self-sustaining operation and high methane conversion, in the absence of CO and NOx generation. Lan and Li [14] formulated a three-dimensional model to study the thermodynamic characteristics of thermal oxidation of methane in a TFRR. The effects of channel length, feed methane concentration, inlet velocity, and cycle time on the reactor behavior were evaluated as well. It was observed that the lowest feed methane concentration for self-maintained running decreases with increasing channel length and rises significantly with inlet velocity, while cycle time has no effect. The performances of catalytic combustion of CH4/air in a single channel and whole monolith reactor were numerically evaluated by Mei et al. [15]. The reactor was assumed to be cylindrical with numerous axially parallel channels, whose arrangement is a correctitude triangle in the cross section of the reactor, and the catalyst was dispersed in the washcoat coated onto the surface of the channels. The results showed that simulations based on the whole reactor give more relevant results and should be adopted to get a better insight into combustion performance. Analysis of monolith reactors with different structural parameters and simulation conditions showed that reaction rate increases with increasing specific surface area, while keeping voidage constant. Dupont et al. [16] conducted experimental and numerical studies on catalytic methane combustion in a honeycomb catalytic monolith burner. The monoliths studied contained various concentrations of Pt or Pd on an alumina-based washcoat over a cordierite honeycomb support. The palladium catalysts allowed for lower CH4 concentrations with stable operation than the platinum catalysts. For both long and short monoliths, the combustion occurred to completion, with no detectable CO, NOx, or unburned fuel, i.e., near-zero pollutant emissions. Marín et al. [17] compared the performance of particle beds and monolithic beds in a CFRR for lean methane mixture combustion and found that, while the monolithic reactor has lower pressure drop, the particle beds perform better in terms of reactor stability. Using CFD, Mei et al. [15] developed a model to simulate the catalytic combustion of CH4/air mixture in a monolith honeycomb reactor. The results showed that the reactor performance is significantly more affected by the inlet temperature, concentration, and gaseous velocity, than the geometry and catalyst loading.
Nevertheless, insight on the effects of various key parameters is essential for designing the reactor. One important parameter determining the effectiveness of catalytic reactor is the channel geometry. Ramanathan et al. [18] studied the influence of channel geometry on ignition in catalytic monoliths. They showed that ignition in asymmetric geometries with sharp corners starts at the corners and spreads in the axial and circumferential directions. An et al. [19] examined the effects of various channel configurations on the performance of a microreactor using computational fluid dynamics (CFD) in terms of conversion and pumping power. At all considered Reynolds numbers, coil-based reactor offered the higher conversion compared to those of rectilinear designs, with the cost of much higher pressure drop. Similarly, Sasmito et al. [20] investigated various coiled reactors and concluded that the coiled base channel design improves the mixing, reaction, and heat-transfer rate significantly. The helical spiral channel offered superior mixing, reaction, and heat-transfer performance as compared to other coiled reactor designs. Sadeghi et al. [21] investigated the effect of channel geometry on the performance of monolith reactor. They reported that the rate of reaction increases due to increase in the area to volume ratio, i.e., reducing the number of sides of the channel, from circular to triangular. Li et al. [22] numerically investigated the performance of novel dual-channel microreactors with various channel configurations: parallel, divergent, convergent, zig-zag, and curved. The mass transport performance in the dual-channel configuration was higher than that of single-channel due to increased reaction contact area. Between the tested channel configurations, they concluded that zig-zag would be the best choice for CH4 utilization while parallel should be chosen for the least pumping power. Numerical investigation of a surface catalyzed gaseous reaction in a semi-T-shaped microreactor conducted by Shaker et al. [23] revealed that channel geometry with splitting and impingement performed better and offered maximum reactant utilization. It was also observed that effect of channel geometry is higher at higher flow rates. In our previous study [24], the reaction performance of in-plane spiral reactors with various cross-sections were evaluated. Half circular was found to have highest performance as compared to other cross-section. In our following study [25], the performance of helical reactor with various cross-section were evaluated. The results indicated that circular cross-section yielded better a reaction compared to the ellipse and square counterparts.
On the other hand, twisted tape insert is considered as one of the effective passive enhancement methods in heat transfer, mass transfer, and reaction processes. It offers longer flow path, enhanced swirl, and longer residence time which contribute to a superior mixing and transport rate [26,27]. Feng et al. [28] used twisted tape inserts to induce swirl flow and enhance heat transfer of hydrocarbon fuel in circular tubes. It was found that the addition of twisted tape increased heat transfer coefficient (HTC) by 18% as compared to plain tubes. Furthermore, smaller twisted tape ratio was responsible for excellent fluid mixing and higher HTC. Manglik and Bergles [29] showed enhancement in single-phase and two-phase forced convection attributed to twisted tape inserts. Insertion of twisted tape generated helical swirl that promotes cross-stream mixing and sharper wall gradients, promoting high heat transfer rates. Bharadwaj et al. [30] combined the effects of inserting twisted tape and using an internally grooved tube to enhance heat transfer. The spirally grooved tube without twisted tape yielded heat transfer enhancement of up to 400% while those with twisted tape showed maximum enhancement of 600% as compared to smooth tubes. Given its superior performance in mixing and transport rate, it is therefore of interest to introduce twisted tape insert in the helical reactors for VAM catalytic combustion to further increase its superior performance. In the present study, we extended our study to evaluate the reaction performance of straight and helical reactors which is equipped with twisted tape insert by using computational fluid dynamics (CFD) approach. The effect of several key factors affecting the VAM catalytic combustion performance inside the reactors such as inlet Reynolds number, twisted tape ratio and reactor length are evaluated to obtain the optimum reactor parameters. For evaluation purposes, the reaction performance of the studied reactors will be compared to the straight reactor without twisted tape which is set as a baseline. To ensure fair comparison, only the outer wall is coated with a catalyst while the twisted tape insert is uncoated.

2. Results and Discussion

2.1. Model Validation

To ensure the validity and accuracy of the developed model, validation was conducted by comparing model predictions against the experimental counterpart and/or other numerical study. The data used for validation in this study are the experimental data by Bond et al. [31]. In addition, the predictions made by the proposed model are compared to results of numerical studies by Bond et al. [31] and Canu [32]. The dimension of the modeled reactor mimics the experimental setup; 1.5 mm × 1.5 mm square channel of length 8 cm with inlet velocity of 7.3 m/s. Single channel flow approximation was employed to estimate the methane conversion and the temperature distribution in a monolithic reactor. The catalytic oxidation reaction was carried out with varying stoichiometric gas inlet from ξ = 0.18 to ξ = 0.39. Detailed description on the reactions and their kinetics can be found in Canu and Bond et al. As can be seen in Figure 1a, the model predictions agree well with the experimental results in terms of methane conversion and the agreement is more pronounced at lower stoichiometry. Moreover, as compared to the models developed by Bond et al. and Canu, the current model offers better prediction, especially at high methane stoichiometry. The model was also able to provide relatively accurate predictions of temperature distribution in the reactor. Again, it can be observed that a better agreement to the experimental results was achieved at low stoichiometry, as depicted in Figure 1b. Despite the inferior agreement achieved for the high stoichiometry as compared to the model by Bond et al., the proposed model could still predict the temperature within an acceptable range of deviations.

2.2. Effect of Reactor Geometry

Two reactor channel geometries (straight and helical) and three different twisting ratios (3.15, 7.86 and 15.73) are considered in this study. Figure 2 illustrates the axial airflow velocity profile and streamline of mixture flow in straight and helical channels for three different twisting ratios and those without twisted tape insert. It is clear that secondary flow present in all configurations except the straight flow without twisted tape insert. In-line with previous findings [27,33,34], a lower twisting ratio (higher number of twisting) results in higher secondary flow intensity, represented by higher velocity. This finding is true for both straight and helical channels. Moreover, two vortices are observed in a straight channel with a twisting ratio of 3.15 while a straight channel with other twisting ratios generate one vortex only. In a helical tube, a combination of helical curvature and twisted tape generates unsymmetrical vortices in contrast to those in a helical tube without the tape. Among the studied cases, it can be seen that the helical channel with twisting tape having a twisting ratio of 3.15 offers the highest flow intensity and this is expected to directly affect the species distribution and mass transfer as well as the catalytic reaction within the channel.
As revealed in our previous study [35], higher methane concentration is observed in straight channels, by approximately 60%, as compared to helical channels, suggesting lesser methane reaction. Moreover, it can be seen that incorporation of twisted tape insert does enhance the reaction performance, indicated by lower methane concentration for all reactors with a twisted tape insert. On closer inspection, it can be observed that smaller twisting ratio (more twisting) results in superior reaction. For the same twisting ratio, helical reactor is clearly more superior as compared to its corresponding counter parts.
It is found that, as indicated in Figure 3, lower twisting ratio leads to a better reaction performance with helical channels providing slightly higher methane conversion than their corresponding straight channel counterparts. Figure 4 shows methane conversion along both channel geometries at various Reynolds numbers. In general, methane conversion along channel length is higher for helical channels. Overall, the reactor channel with a twisted tape insert offers superior performance than those without. Another interesting observation is the asymptotic behavior of methane conversion inside the channel, which is more pronounced in low Re due to longer residence time which gives sufficient time to allow catalytic reaction to occur. For higher Re, a longer channel will be needed to achieve the similar asymptotic behavior and longer residence time.

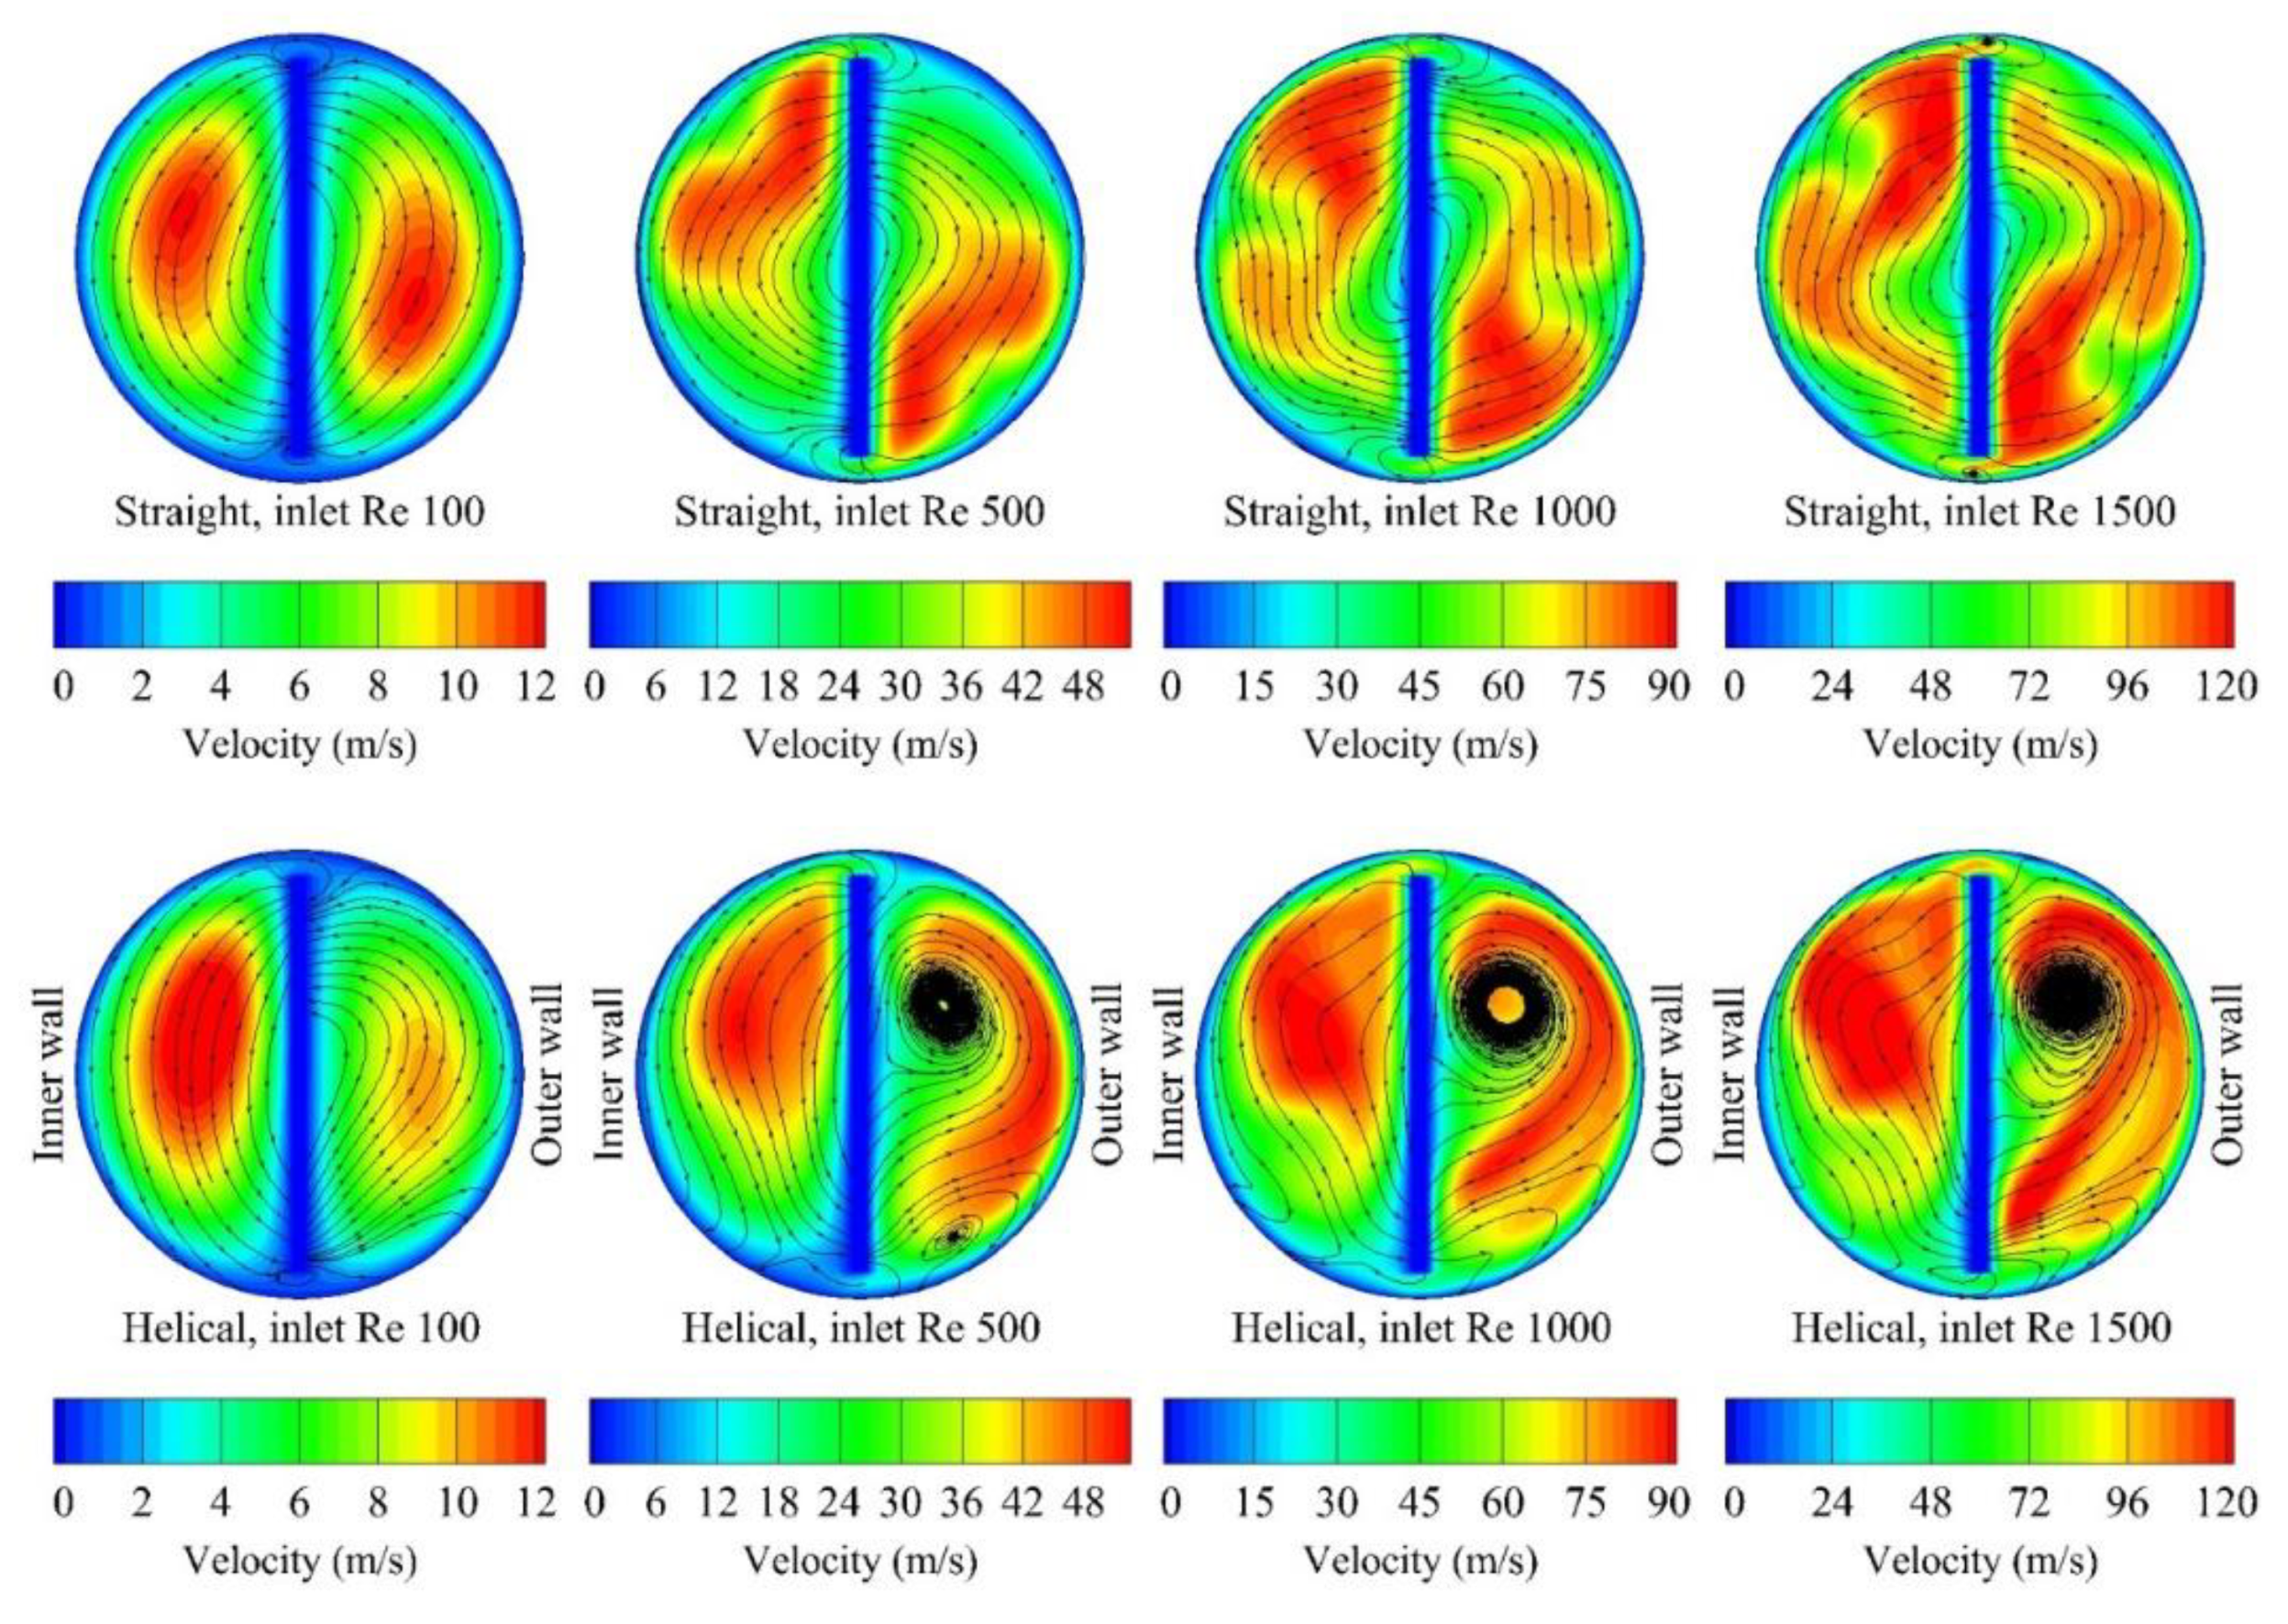
2.3. Effect of the Inlet Reynolds Number

Effect of the inlet Reynolds number was also investigated by varying the mixture inlet velocity corresponding to the inlet Reynolds number of 100, 500, 1000, and 1500. As illustrated in Figure 5, secondary flow and reaction are intensified as the inlet Reynolds number increases. For the straight channel, the vortex transfers from one pair to two pairs as the Re increases. For the helical tube, the unsymmetrical behavior becomes more prominent as the Re increases.
In terms of reaction performance, Figure 4 shows that, within the considered channel length range, lower Re performs better, indicated by increasing methane conversion with decreasing Re. At Re = 100 with long channel (about 125 mm), almost complete methane conversion is achieved for all reactor configurations with no significant improvement observed for the helical reactors relative to the straight counterparts. On average, as compared to the case for Re = 100, the performance declines by 35%, 58%, and 68%, for Re = 500, 1000, and 1500, respectively. Looking closely at the behavior of the reactors with a twisted tape insert of ratio 3.15 at L = 25.16 mm, Figure 6 depicts the methane concentration and masslines of reactant flow. The same trend can be clearly observed higher Re leads to inferior reaction performance, mirrored by higher methane concentration. This is due to a longer residence time in low Re condition, which allows more time for the reactant flow to react. The difference is more pronounced at Re = 100, where the methane concentration is two orders of magnitude lower than the other configurations. Furthermore, it can be observed that, as Re increases, secondary flow enhances mixing and reaction performance, indicated by significantly lower methane concentration near the reaction wall. Interesting observation was obtained for helical tube at low concentration where the methane concentration near the outer wall is significantly lower than that in the inner wall region. This behavior has not been observed in the high Re conditions. Comparing straight and helical tubes, keeping all other conditions the same, helical reactors consistently offer better performance. However, the performance improvement decreases as the Re increases. From Figure 6, methane concentration in helical reactor were calculated to be 14%, 2.7%, 1.4%, and 0.96% lower than the straight counterparts at Re = 100, 500, 1000, and 1500, respectively. This shows that the best improvement can be achieved by replacing a straight tube with helical at the low inlet Reynolds number.

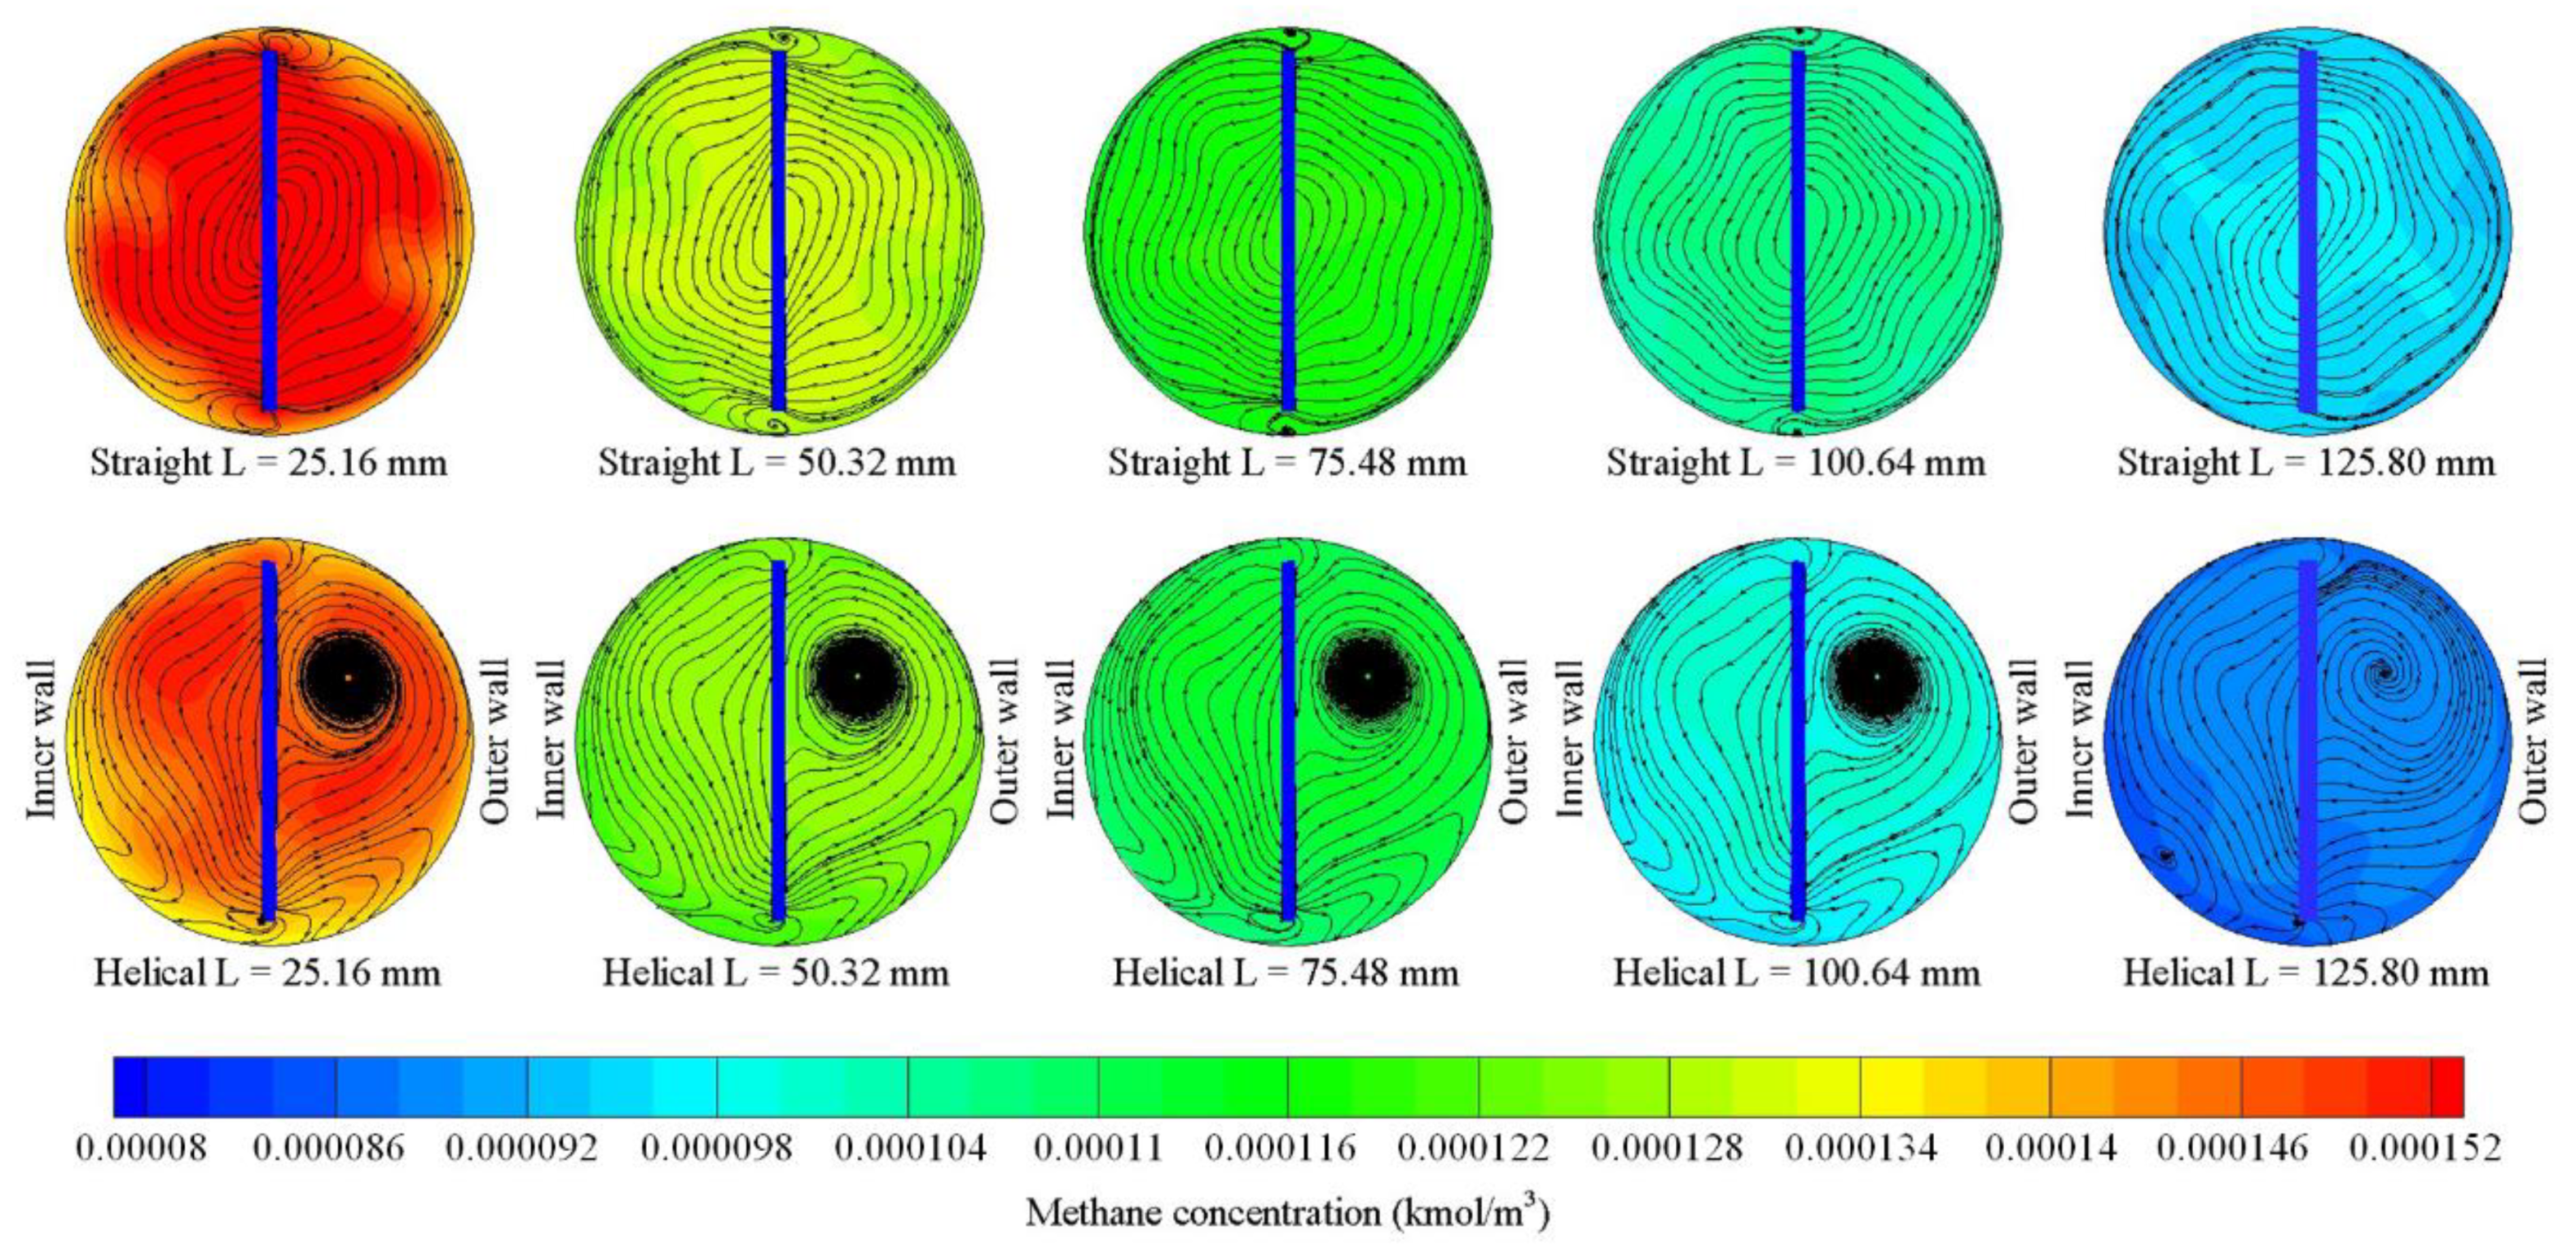
2.4. Effect of Channel Length

Another important factor that must be considered in designing the reactor is the channel length in order to optimize the performance and cost. Here, five different reactor channel lengths are evaluated, i.e., 25.16 mm, 50.32 mm, 75.48 mm, 100.64 mm, and 125.80 mm. As can be clearly seen in Figure 4, better performance, indicated by higher methane conversion, was achieved as the reactor channel got longer. This is true for all reactor configurations, with and without tape inserts, as all curves follow the same second-order polynomial shape. On a closer look, however, it was observed that the improvement decreased as the length was increased from 25.16 to 50.32 to 75.48 to 100.64 and to 125.80 mm. As an example, the enhancement offered by increase in reactor channel length with twisted tape of ratio 3.15 at Re = 1000 were approximately 46%, 29%, 20%, and 9%, respectively. Figure 7 visualizes the velocity profile and streamline of mixture flow at the outlet of the reactor channel with different lengths under the same condition. Overall, a similar profile is observed for all reactor channel length, suggesting that velocity is not influenced by the reactor length. On the contrary, channel length greatly affects methane conversion, as represented by its concentration in Figure 8. The methane concentration lessens with increasing length, with a 125.80 mm reactor having the smallest concentration. It can also be observed that the helical channel outperformed the straight counterpart, indicated by slightly lower (about 10–15%) methane concentration overall. Another interesting point that can be inferred from Figure 8 is that, for these specific conditions (Re = 1000 and twisting ratio 3.15), the methane concentration near the catalyst wall is lower due to consumption in catalytic reaction in shorter channels; however, at a longer channel, the methane concentration becomes more uniform, which indicates a lower reaction rate.
Table 1 summarizes the power generated by methane combustion and required pumping power for different channel lengths in Watt per channel. Note that, in practical application, the channel will be stacked up to form a monolith reactor. As can be seen, helical channels in general generate higher power than the straight counterparts. Longer reactor channels also generate more power from methane combustion that the shorter ones. On average, increasing the channel length from 25.16 mm to 125.80 mm enhances the power generation by 51%, 167%, 149%, and 123%, for straight tubes with Re = 100, 500, 1000, and 1500, respectively. For helical tubes, these enhancements are a littler higher, at 41%, 168%, 166%, and 147%. It is worth pointing out that, in terms of the power generation by the methane combustion, increasing the channel length and employing helical channel at Re = 500 offers the greatest enhancement. Likewise, the effects of twisted tape insert application are more prominent for a longer channel at a higher Reynolds number. Its effect is diminished for a low Reynolds number at all channel length.
As expected, a longer channel imposes higher pressure drop and thus higher pumping power is required to drive the flow. The pumping power is almost doubled when the channel length is doubled. As compared to the straight configuration, the helical channel also necessitates greater pumping power. Again, the increase is more significant as the Re increases. For short channel, the pumping power for the helical channel without a twisted tape is approximately 30–80% higher than the straight counterparts depending on the Re: higher as the Re increases. As the channel length increases, the pumping power for helical can reach up to 140% higher than the straight channel for the 125.8 mm channel. Moreover, the addition of twisted tape inserts increases the pumping power needed. For channels with twisted tape inserts, pumping power is greatly affected by the twist ratio. For high twisting ratio, the behavior is similar to those without twisted tape, i.e., the ratio of pumping power for helical channel to the straight channel is higher at higher Re. For low twisting ratio, the ratio of pumping power is decreased with an increase of Re and then increases when Re increases further. Overall, channels with twisting ratio of 3.15 need the highest pumping power.

2.5. Overall Performance

The overall performances of the reactors were examined using the figure of merit (FoM) concept, defined as net power generation (power generated–pumping power) per unit mass of catalyst (Watt per mg of Pt). Table 2 summarizes the net power generated from the reactor and figure of Merit (FoM) for single channel. Here, it is found that, despite the requirement for high pumping power, the helical reactor still offers considerable net power as compared to the straight channel. In fact, at low Re, it produces higher net power than the straight channel. Looking into the reactor with twisted tape insert, higher net power is observed for short reactors with a twisted tape at low Re. However, this advantage diminishes as the reactor channel gets longer and Re set to higher value. The net power offered by reactors with twisted tape declines when the channel is about 100 mm or longer, and the decrease becomes more significant at high Reynolds number. For example, net power generated at Re = 1500 was the highest for straight reactor with no tape and lowest for straight and helical reactors with the 3.15 twisted tape. This may be due to the extremely high pressure drop imposed by the combined effects of long channel, twisted tape addition, and helical configuration which add extra resistances to the flow. Among the studied tape, one with a twisting ratio of 3.15 has the lowest performance in terms of net power, attributed to its high pumping power requirement. Twisted tape with higher twisting ratio (lesser twisting) generates the highest net power.
On FoM, the straight channel offers better performance as compared to the helical counterpart. For most conditions, straight tube with twisted tape of 15.73 twisting ratio offer the highest FoM among the investigated geometries. In contrast, the helical channel has lower FoM in general compared to the straight channel with the same configuration attributed to higher pumping power and catalyst usage and area. Channel length also influences FoM, as a decreasing trend was observed with increasing channel length for all channel arrangements and Re numbers. Furthermore, FoM increases with increasing Re, although the increase becomes less significant when moving towards a higher Re region. On average, FoM improvements are about 70–100% higher when Re is increased from 100 to 500. These numbers dropped significantly to a 5–30% increase when Re is increased from 500 to 1000. Interestingly, the decline in improvement is more prominent for longer channels.

3. Mathematical Model

In this study, straight and helical coil reactor channel with various twisted tape insert configurations are considered. The channel geometry is similar to the heat exchanger tube evaluated in our previous study [27]. These geometries are illustrated in Figure 9. The assumptions taken in developing this model are a premix inlet condition, the reaction occurs at the reactor wall, Newtonian fluid steady, and laminar flow [24,25,35]. Table 3 summarizes details geometric and operating parameters considered in this study.

3.1. Governing Equations

With reference to the assumption taken in developing the model, the governing equations comprising conservation of mass, momentum, energy, and species inside the reactor can be expressed as [24,25]
ρ u = 0
( ρ u u ) = p I + [ μ ( u + ( u ) T ) 2 3 μ ( u ) I ]
( ρ u ω i ) = ( ρ D i ω i ) + R i
( ρ c p u T ) = ( k e f f T ) + S t e m p
where ρ is the fluid density, u the fluid velocity, p the pressure, μ the fluid dynamic viscosity, ωi and Di are mass fraction and diffusion coefficient of species i, respectively, Ri is the mass consumed or produced by the reactions at the catalyst coated wall, cp is the specific heat of the gas mixture, keff is the effective thermal conductivity, T is the temperature, and Stemp is the heat released/absorbed due to reaction.

3.2. Methane Catalytic Oxidation Reaction

Catalytic combustion of VAM in this study is represented by heterogeneous reaction of methane oxidation occurring at the platinum catalyst-coated wall of reactor channels. In this model, the chemical species deposited on the wall surface is treated separately with those in the bulk flowing gas. Similarly, reaction occurring on the wall surface for the species deposited on the wall is distinguished from the reaction in the bulk gas. In total, one bulk/solid species (Pt(b)), seven gas species (CH4, O2, H2, H2O, CO, CO2 and N2), and 11 surface species (e.g., H(s), Pt(s), O(s), OH(s), H2O(s), CH3(s), CH2(s), CH(s), C(s), CO(s), CO2(s)) that illustrate the coverage of the surface with adsorbed species were considered in this model. Table 4 presented detailed multistep reaction mechanism and its corresponding reactions rate constants.
Both gas-phase and surface species can be produced and consumed by the surface reactor which can be expressed as
i = 1 N g g i , r G i + i = 1 N b b i , r B i + i = 1 N s s i , r S i K r i = 1 N g g i , r G i + i = 1 N b b i , r B i + i = 1 N s s i , r S i
where g′, b′, and s′ are the stoichiometric coefficients for each reactant species; g″, b″, and s″ are the stoichiometric coefficients for each product species; and Kr is the overall reaction rate constant. Meanwhile, Gi, Bi, and Si are the gas-phase, solid species, and the surface-adsorbed species, respectively. The rate of reaction is defined as
= k f , r i = 1 N g [ G i ] w a l l g i , r [ S i ] w a l l s i , r
where [ G i ] w a l l g i , r denotes molar concentration on the wall which can be calculated as
[ G i ] w a l l = ρ w a l l ω i , w a l l M w , i
and [ S i ] w a l l is the site species concentration at the wall, which is given by
[ S i ] w a l l = ρ s i t e z i
where ρsite is the site density of the catalyst and zi is the site coverage of species i. The reaction rate constant, kf,r, is given by
k f , r = A r T β r exp ( E r R T )
Note that that only the species involved as reactants or products will have a nonzero stoichiometric coefficient.
To estimate the net molar rate of production or consumption of each species i, the following correlations were used:
R ^ i , g a s = r = 1 N r x n ( g i , r g i , r ) r ( i = 1 , 2 , 3 , , N g ) R ^ i , b u l k = r = 1 N r x n ( b i , r b i , r ) r ( i = 1 , 2 , 3 , , N b ) R ^ i , s i t e = r = 1 N r x n ( s i , r s i , r ) r ( i = 1 , 2 , 3 , , N s )
At the catalyst-coated wall surfaces, the total mass flux of each gas species due to diffusion and convection is equal to its rate of consumption/production on the surface
ρ w a l l D i ω i , w a l l n m ˙ d e p ω i , w a l l = M w , i R ^ i , g a s ( i = 1 , 2 , 3 , , N g )
[ S i ] w a l l t = R ^ i , s i t e ( i = 1 , 2 , 3 , , N s )
where m ˙ d e p is the net rate of mass deposition or etching as a result of surface reaction, i.e.,
m ˙ d e p = i = 1 N b M w , i R ^ i , b u l k
The diffusion term in Equations (11) and (12) is computed as the ratio of the difference in the mass fraction of species at the cell center and the wall-face center to the normal distance between these center points. To find the dependent variables ωi,wall and zi, Equations (10) and (11) were solved using a point-by-point coupled Newton solver. Alternatively, if the Newton solver fails to solve the equations, time marching in an ordinary differential equations (ODE) solver is used until convergence is reached. In the condition where the ODE solver cannot solve these equations, reaction-diffusion balance will be disabled, ωi,wall is made equal to ωi,cell, and only the site coverage zi is advanced in the ODE solver to convergence.

3.3. Constitutive Relations

In this study, the gas mixture is considered as ideal gas for which the density can be calculated as
ρ = P M R u T
where Ru is the universal gas constant and M is the mixture molar mass which is calculated for the species molar mass, Mi, as
M = ( ω C H 4 M C H 4 + ω H 2 M H 2 + ω O 2 M O 2 + ω H 2 O M H 2 O + ω C O 2 M C O 2 + ω C O M C O + ω N 2 M N 2 ) 1
The gas mixture viscosity (µ) can be calculated by using averaging method, i.e.,
μ = α x α μ α β x β Φ α , β , ( α , β = CH 4 ,   H 2 ,   O 2 ,   H 2 O ,   CO ,   CO 2 ,   N 2 )
where xα, β are the mole fractions of species α and β, and Φα,β is coefficient that can be calculated from
Φ α , β = 1 8 ( 1 + M α M β ) 1 / 2 [ 1 + ( μ α ( g ) μ β ( g ) ) 1 / 2 ( M β M α ) 1 / 4 ] 2
where μα, β are the viscosity of individual species α and β.
Similarly, the mixture thermal conductivity, keff and specific heat capacity, cp can be calculated by using averaging method, i.e.,
k e f f = k i ω i
c p = i ω i c p , i
The performance of reactor is evaluated and discussed in terms of local and overall reactant conversion, ζ and figure of merit (FoM) which are defined as
ζ i , x = ω i , m e a n x ω i , m e a n o u t ω i , m e a n i n
ζ i = ω i , m e a n i n ω i , m e a n o u t ω i , m e a n i n
F o M = E ˙ n e t m c a t a l y s t
where ωi,mean is the mixed mean mass fraction, which is defined as
ω i , m e a n = 1 V A c A c ω i u d A c
and V is the mean velocity, which is given by
V = 1 A c A c u d A c
The net power is defined as the generated from methane catalytic combustion minus the pumping power required to drive the flow inside reactor, i.e.,
E ˙ n e t = E ˙ c o m b u s t i o n P P u m p
E ˙ c o m b u s t i o n = η p g ( m ˙ C H 4 , m e a n i n m ˙ C H 4 , m e a n o u t ) Δ H c , C H 4
P p u m p = ( 1 η p u m p ) V ˙ Δ P
where ηpg denotes the efficiency of the power generation, ΔHc,cH4 is the methane combustion enthalpy, m ˙ C H 4 , m e a n i n and m ˙ C H 4 , m e a n o u t represent the methane inlet and outlet mass flow rates, respectively, ηpump is the pump efficiency, V ˙ is the volumetric flow rate, and Δp is the pressure drop. Currently, VAM is utilized as fuel for steam power plant utilizing catalytic oxidation [35]. Typical steam power plant has efficiency within 38% to 45% [36]. In this study, the efficiency of the power generation is taken at conservative value 33%. Meanwhile, the enthalpy combustion of methane is taken as 890.7 kJ/mol [36,37]. The pump efficiency is taken at moderate 80% while mass of catalyst can be calculated from the catalyst loading, ρsite and the corresponding coating area, given in Table 3.

3.4. Boundary Condition

The boundary conditions implemented in the developed model are as follows:
  • Inlet: Ventilation air which consists of methane gas is treated as premix reactant. The velocity, temperature, and species mass fraction are set,
    u = u m i x t u r e i n ,   T = T m i x t u r e i n ,   ω O 2 = ω O 2 i n ,   ω C H 4 = ω C H 4 i n ,   ω H 24 = ω H 2 i n
    ω N 2 = 1 ( ω O 2 i n + ω C H 4 i n + ω H 2 i n )
    Inlet velocity for the mixture is summarized in Table 3.
  • Reaction walls: The reaction takes place on the wall, which was coated with catalyst and is resolved by using Equation (9). The reaction mechanism is incorporated to the species boundary condition to activate wall surface reaction. No-slip condition is applied. The wall temperature is not known a priori and is calculated from the heat source due to reaction. Note that the initial temperature is very important in the steady state model to trigger the reaction:
    u = 0 ,   T w a l l = T w a l l , i n i t
  • Twisted tape insert: The tape is treated as non-reaction wall where the boundary condition is similar to those for reaction wall but with no reaction.
  • Outlet: The pressure and stream-wise gradient of the temperature and species mass fraction are set to zero:
    p = p o u t ,   n T = 0 ,   n ω i = 0
The inlet velocities used in this study correspond to inlet Reynolds numbers of 100, 500, 1000, and 1500, which are listed in Table 3.

3.5. Streamlines and Masslines Visualization

To provide better visualization on the species distribution within the reactor, the concept of massline is adopted in this study. This concept is evolved from the use of stream-function and streamlines to visualize fluid flow. In the Cartesian coordinate, the stream function is defined as
ψ y = u ,   ψ x = v
where ψ(x,y) is the stream-function. The flow is locally parallel to the constant line of the stream-function (streamlines). Thus, although there is no explicit substitution for the velocity component (u, v) as the source of the local flow attributes, constant streamlines provide a valuable observation of the fluid flow and its characteristics. Similarly, mass-function and masslines are introduced as visualization aid of the mass transfer by convection and diffusion mechanism, described as
M y = M x ,   M x = M y
where
M x = ρ u ω i ρ D i ω i x ,   M y = ρ v ω i ρ D i ω i y

3.6. Numerical Methodology

The computational domain for the model was created in an ANSYS Design Modeller and then transferred to ANSYS Meshing for meshing and labelling to study the dependency of the numerical result on the amount of generated mesh, several mesh sizes with a mesh amount ranging from around 100 thousand to 4.1 million meshes were built and evaluated. The computational domain was then exported and incorporated into the developed model consisting of conservation equations, constitutive relations and corresponding boundary conditions in ANSYS Fluent 19.2. The model was then solved by using the widely adopted Semi-Implicit-Pressure-Linked equation (SIMPLE) algorithm, second order upwind discretization, and algebraic multi-grid (AMG) method. Convergence was obtained by setting a residual criterion of 10−6 for all parameters. One to two hour wall clocks is required for the computational model to reach convergence by using single processor setting in high performance computer (HPC). A range of 5 GB to 10 GB RAM utilization was recorded during a computational run where other processes are closed. By using the previously prepared mesh, a mesh-independent study was conducted to evaluate the mesh independency of the numerical result. As can be seen in Figure 10, no significant changes were observed for mesh beyond 2 million. The same results are observed for the spatial flow profile and methane concentration as presented in Figure 11 and Figure 12, respectively. Therefore, the remaining cases were run with mesh size of 2 million meshes. The mesh was unstructured and had orthogonal quality of ~0.9.

4. Conclusions

A numerical investigation has been conducted to evaluate the reaction performance of a straight and helical coil reactor with twisted tape insert for combustion of methane, specifically in Ventilation Air Methane (VAM) produced by underground coal mines. The effects of twisting ratio of the tape, reactor channel length, and Reynolds number were examined and discussed. Several twisting ratios were evaluated, i.e., 3.15, 7.86 and 15.73 and channel length of 25.16, 50.32, 75.48, 100.64, and 125.80 mm at Reynolds number range of 100–1500. The developed model was validated against published experimental results and it was able to accurately predict the reaction performance in terms of methane conversion. Consistent with our previous study, helical reactors prompt more intense secondary flow, which results in higher axial velocity inside the reactor. Higher methane concentration, i.e., lower conversion, was observed in straight channel as compared to the helical counterpart. The addition of twisted tape insert was also proven to lead to superior performance in general and the results indicate that a small twisting ratio (3.15) offered the best performance. The investigation on the influence of Reynolds number and channel length revealed that enhanced performance and higher power can be achieved with low Re and longer reactor channel although the increase is lower for an increase in the high Re region. The distributions of methane concentration suggest that reaction rate is low for a channel less than 100 mm long. However, the improvement from increasing channel length comes at the cost of high pressure drop and pumping power. Employing twisted tape and helical reactor also adds on the required pumping power, especially at high Re. These combined effects might overcome the advantages and, as a result, the net power generated can decrease. Thus, the design parameters must be chosen carefully and optimized to achieve the best trade-off between performance and cost. Future work will focus on the integration of single channel reactor into stack and system along with its optimization.

Author Contributions

Conceptualization, A.P.S and J.C.K.; methodology, B.A.C., J.C.K., and A.P.S.; software, J.C.K., B.A.C., and A.P.S.; validation, J.C.K and A.P.S.; formal analysis, J.C.K, B.A.C., and A.P.S.; investigation, J.C.K, B.A.C., and A.P.S.; resources, J.C.K and A.P.S.; data curation, J.C.K., B.A.C., and A.P.S.; writing—original draft preparation, B.A.C, J.C.K., L.C., L.J., and A.P.S.; writing—review and editing, B.A.C., A.P.S., and J.C.K.; visualization, J.C.K. and B.A.C.; supervision, J.C.K. and A.P.S.; project administration, A.P.S., L.C., and L.J.; funding acquisition, A.P.S., L.C., L.J. All authors have read and agreed to the published version of the manuscript.

Funding

The Article Processing Charge (APC) was funded by the Shandong University of Science and Technology through an SDUST Open Grant.

Acknowledgments

The first, third, fourth, and fifth authors gratefully acknowledge the financial support from the Shandong University of Science and Technology through SUDST Open Grant. The second author gratefully acknowledges the facility and financial support from the Yayasan Universiti Teknologi PETRONAS (YUTP) through YUTP Fundamental Research Grant (YUTP-FRG) No. 015LC0-214.

Conflicts of Interest

The authors declare no conflict of interest.

References

  1. Karakurt, I.; Aydin, G.; Aydiner, K. Mine ventilation air methane as a sustainable energy source. Renew. Sustain. Energy Rev. 2011, 15, 1042–1049. [Google Scholar] [CrossRef]
  2. Kurnia, J.C.; Xu, P.; Sasmito, A.P. A novel concept of enhanced gas recovery strategy from ventilation air methane in underground coal mines – A computational investigation. J. Nat. Gas Sci. Eng. 2016, 35, 661–672. [Google Scholar] [CrossRef]
  3. Kurnia, J.C.; Sasmito, A.P.; Mujumdar, A.S. CFD simulation of methane dispersion and innovative methane management in underground mining faces. Appl. Math. Model. 2014, 38, 3467–3484. [Google Scholar] [CrossRef]
  4. Kholod, N.; Evans, M.; Pilcher, R.C.; Roshchanka, V.; Ruiz, F.; Coté, M.; Collings, R. Global methane emissions from coal mining to continue growing even with declining coal production. J. Clean. Prod. 2020, 256, 120489. [Google Scholar] [CrossRef]
  5. Wang, Y.; Man, C.; Che, D. Catalytic Combustion of Ventilation Air Methane in a Reverse-Flow Reactor. Energy Fuels 2010, 24, 4841–4848. [Google Scholar] [CrossRef]
  6. Su, S.; Agnew, J. Catalytic combustion of coal mine ventilation air methane. Fuel 2006, 85, 1201–1210. [Google Scholar] [CrossRef]
  7. Yin, J.; Weng, Y. Investigation of combustion and thermodynamic performance of a lean burn catalytic combustion gas turbine system. Energy Convers. Manag. 2011, 52, 1711–1720. [Google Scholar] [CrossRef]
  8. Gosiewski, K.; Pawlaczyk, A.; Jaschik, M. Energy recovery from ventilation air methane via reverse-flow reactors. Energy 2015, 92, 13–23. [Google Scholar] [CrossRef]
  9. Li, Z.; Wu, Z.; Qin, Z.; Zhu, H.; Wu, J.; Wang, R.; Lei, L.; Chen, J.; Dong, M.; Fan, W.; et al. Demonstration of mitigation and utilization of ventilation air methane in a pilot scale catalytic reverse flow reactor. Fuel Process. Technol. 2017, 160, 102–108. [Google Scholar] [CrossRef]
  10. Marín, P.; Ordóñez, S.; Díez, F.V. Procedures for heat recovery in the catalytic combustion of lean methane–air mixtures in a reverse flow reactor. Chem. Eng. J. 2009, 147, 356–365. [Google Scholar] [CrossRef]
  11. Cimino, S.; Pirone, R.; Russo, G. Thermal Stability of Perovskite-Based Monolithic Reactors in the Catalytic Combustion of Methane. Ind. Eng. Chem. Res. 2001, 40, 80–85. [Google Scholar] [CrossRef]
  12. Aubé, F.; Sapoundjiev, H. Mathematical model and numerical simulations of catalytic flow reversal reactors for industrial applications. Comput. Chem. Eng. 2000, 24, 2623–2632. [Google Scholar] [CrossRef]
  13. Gosiewski, K. Efficiency of heat recovery versus maximum catalyst temperature in a reverse-flow combustion of methane. Chem. Eng. J. 2005, 107, 19–25. [Google Scholar] [CrossRef]
  14. Lan, B.; Li, Y.-R. Numerical study on thermal oxidation of lean coal mine methane in a thermal flow-reversal reactor. Chem. Eng. J. 2018, 351, 922–929. [Google Scholar] [CrossRef]
  15. Mei, H.; Li, C.; Liu, H.; Ji, S. Simulation of Catalytic Combustion of Methane in a Monolith Honeycomb Reactor1 1Supported by the National Natural Science Foundation of China (No.20136010 and No.20376005). Chin. J. Chem. Eng. 2006, 14, 56–64. [Google Scholar] [CrossRef]
  16. Dupont, V.; Zhang, S.-H.; Bentley, R.; Williams, A. Experimental and modelling studies of the catalytic combustion of methane. Fuel 2002, 81, 799–810. [Google Scholar] [CrossRef]
  17. Marín, P.; Hevia, M.A.G.; Ordóñez, S.; Díez, F.V. Combustion of methane lean mixtures in reverse flow reactors: Comparison between packed and structured catalyst beds. Catal. Today 2005, 105, 701–708. [Google Scholar] [CrossRef]
  18. Ramanathan, K.; Balakotaiah, V.; West, D.H. Geometry effects on ignition in catalytic monoliths. Aiche J. 2004, 50, 1493–1509. [Google Scholar] [CrossRef]
  19. An, H.; Li, A.; Sasmito, A.P.; Kurnia, J.C.; Jangam, S.V.; Mujumdar, A.S. Computational fluid dynamics (CFD) analysis of micro-reactor performance: Effect of various configurations. Chem. Eng. Sci. 2012, 75, 85–95. [Google Scholar] [CrossRef]
  20. Sasmito, A.P.; Kurnia, J.C.; Mujumdar, A.S. Numerical Evaluation of Transport Phenomena in a T-junction Microreactor with Coils of Different Configurations. Ind. Eng. Chem. Res. 2012, 51, 1970–1980. [Google Scholar] [CrossRef]
  21. Sadeghi, F.; Tirandazi, B.; Khalili-Garakani, A.; Nasseri, S.; Nabizadeh Nodehi, R.; Mostoufi, N. Investigating the effect of channel geometry on selective catalytic reduction of NOx in monolith reactors. Chem. Eng. Res. Des. 2017, 118, 21–30. [Google Scholar] [CrossRef]
  22. Li, J.; An, H.; Sasmito, A.P.; Mujumdar, A.S.; Ling, X. Performance evaluation of mass transport enhancement in novel dual-channel design of micro-reactors. Heat Mass Transf. 2020, 56, 559–574. [Google Scholar] [CrossRef]
  23. Shaker, M.; Ghaedamini, H.; Sasmito, A.P.; Kurnia, J.C.; Jangam, S.V.; Mujumdar, A.S. Numerical investigation of laminar mass transport enhancement in heterogeneous gaseous microreactors. Chem. Eng. Process. Process Intensif. 2012, 54, 1–11. [Google Scholar] [CrossRef]
  24. Kurnia, J.C.; Sasmito, A.P.; Birgersson, E.; Shamim, T.; Mujumdar, A.S. Evaluation of mass transport performance in heterogeneous gaseous in-plane spiral reactors with various cross-section geometries at fixed cross-section area. Chem. Eng. Process. Process Intensif. 2014, 82, 101–111. [Google Scholar] [CrossRef]
  25. Kurnia, J.C.; Sasmito, A.P.; Mujumdar, A.S. Potential catalyst savings in heterogeneous gaseous spiral coiled reactor utilizing selective wall coating – A computational study. Comput. Chem. Eng. 2016, 88, 59–72. [Google Scholar] [CrossRef]
  26. Kurnia, J.C.; Sasmito, A.P. Performance Evaluation of Liquid Mixing in a T-Junction Passive Micromixer with a Twisted Tape Insert. Ind. Eng. Chem. Res. 2020, 59, 3904–3915. [Google Scholar] [CrossRef]
  27. Kurnia, J.C.; Chaedir, B.A.; Sasmito, A.P. Laminar convective heat transfer in helical tube with twisted tape insert. Int. J. Heat Mass Transf. 2020, 150, 119309. [Google Scholar] [CrossRef]
  28. Feng, S.; Cheng, X.; Bi, Q.; Pan, H.; Liu, Z. Experimental investigation on convective heat transfer of hydrocarbon fuel in circular tubes with twisted-tape inserts. Int. J. Heat Mass Transf. 2020, 146, 118817. [Google Scholar] [CrossRef]
  29. Manglik, R.M.; Bergles, A.E. Characterization of Twisted-Tape-Induced Helical Swirl Flows for Enhancement of Forced Convective Heat Transfer in Single-Phase and Two-Phase Flows. J. Therm. Sci. Eng. Appl 2013, 5. [Google Scholar] [CrossRef]
  30. Bharadwaj, P.; Khondge, A.D.; Date, A.W. Heat transfer and pressure drop in a spirally grooved tube with twisted tape insert. Int. J. Heat Mass Transf. 2009, 52, 1938–1944. [Google Scholar] [CrossRef]
  31. Bond, T.G.; Noguchi, B.A.; Chou, C.-P.; Mongia, R.K.; Chen, J.-Y.; Dibble, R.W. Catalytic oxidation of natural gas over supported platinum: Flow reactor experiments and detailed numberical modeling. Symp. Int. Combust. 1996, 26, 1771–1778. [Google Scholar] [CrossRef]
  32. Canu, P. Simulation and interpretation of catalytic combustion experimental data. Catal. Today 2001, 64, 239–252. [Google Scholar] [CrossRef]
  33. Manglik, R.M.; Bergles, A.E. Heat transfer enhancement and pressure drop in viscous liquid flows in isothermal tubes with twisted-tape inserts. Wärme Und Stoffübertragung 1992, 27, 249–257. [Google Scholar] [CrossRef]
  34. Jafaryar, M.; Sheikholeslami, M.; Li, Z. CuO-water nanofluid flow and heat transfer in a heat exchanger tube with twisted tape turbulator. Powder Technol. 2018, 336, 131–143. [Google Scholar] [CrossRef]
  35. Kurnia, J.C.; Chaedir, B.A.; Lim, D.C.; Chen, L.; Jiang, L.; Sasmito, A.P. Numerical Evaluation of Potential Catalyst Savings for Ventilation Air Methane Catalytic Combustion in Helical Coil Reactors with Selective Wall Coating. Catalysts 2019, 9, 380. [Google Scholar] [CrossRef] [Green Version]
  36. NIST Office NIST Chemistry WebBook. Available online: https://webbook.nist.gov/cgi/cbook.cgi?ID=C74828&Mask=1 (accessed on 8 March 2019).
  37. Pittam, D.A.; Pilcher, G. Measurements of heats of combustion by flame calorimetry. Part 8.—Methane, ethane, propane, n-butane and 2-methylpropane. J. Chem. Soc. Faraday Trans. 1 1972, 68, 2224–2229. [Google Scholar] [CrossRef]
Figure 1. Experimental data by Bond et al. [31] and comparison with numerical data by Bond et al. [31] and Canu [32] at low and high inlet stoichiometry for (a) methane conversion and (b) temperature distributions.
Catalysts 10 00797 g001aCatalysts 10 00797 g001b
Figure 2. Velocity profile (contour, m/s) and streamlines of reactant flow in straight and helical reactors with various twisted tape insert configurations at L = 25.16 mm and Reynolds number of 1000.
Catalysts 10 00797 g002
Figure 3. Methane concentration (kmol/m3) and masslines of reactant flow in straight and helical reactors with various twisted tape insert configurations at L = 25.16 mm and Reynolds number of 1000.
Catalysts 10 00797 g003
Figure 4. Methane conversion along the straight and helical reactor at Reynolds number of (a) 100, (b) 500, (c) 1000, and (d) 1500.
Catalysts 10 00797 g004
Figure 5. Velocity profile (contour, m/s) and streamlines of reactant flow in straight and helical reactors with insert tape twisting ratio of 3.15 at L = 25.16 mm different inlet Reynolds numbers.
Catalysts 10 00797 g005
Figure 6. Methane concentration (kmol/m3) and masslines of reactant flow in straight and helical reactors with insert tape twisting ratio of 3.15 at L = 25.16 mm and Reynolds number of 1000.
Catalysts 10 00797 g006
Figure 7. Axial velocity profile (contour, m/s) and streamlines of reactant flow in straight and helical reactors with insert tape twisting ratio of 3.15 at the outlet and inlet Reynolds number of 1000.
Catalysts 10 00797 g007
Figure 8. Methane concentration (kmol/m3) and masslines of reactant flow in straight and helical reactors with insert tape twisting ratio of 3.15 at the outlet and inlet Reynolds number of 1000.
Catalysts 10 00797 g008
Figure 9. Schematics representation of the studied reactors.
Catalysts 10 00797 g009
Figure 10. Mesh independent test result in term of (a) outlet methane concentration (kmol/m3), (b) outlet carbon dioxide concentration (kmol/m3), and (c) pressure drop (Pa) along the reactor channel with twisted tape insert (y = 3.15) at Re 100 for various meshes.
Catalysts 10 00797 g010
Figure 11. Axial velocity profile (contour, m/s) of reactant flow in straight and helical square with twisted tape insert (y = 3.15) at L = 25.16 mm and Reynolds number of 1000 for various meshes.
Catalysts 10 00797 g011
Figure 12. Methane concentration (kmol/m3) of reactant flow in straight and helical square with twisted tape insert (y = 3.15) at L = 25.16 mm and Reynolds number of 1000 for various meshes.
Catalysts 10 00797 g012
Table 1. Power generation from methane combustion (in Watt) and pumping power to drive the flow (in mWatt) for a single channel VAM reactor (in W/mg catalyst).
GeometryReactor Length 25.16 mm
Generated Power (Watt)Pumping Power (mWatt)
Re 100Re 500Re 1000Re 1500Re 100Re 500Re 1000Re 1500
No tapeStraight0.190.330.450.560.134.3420.3350.25
Helical0.210.350.440.510.166.4033.5289.09
With tape y = 3.15Straight0.200.370.510.640.4316.3178.91202.69
Helical0.210.400.540.670.6318.6693.41237.61
With tape y = 7.86Straight0.200.380.530.660.3710.9552.48133.25
Helical0.210.410.550.670.4314.7073.45190.84
With tape y = 15.73Straight0.200.380.530.680.3710.2645.50111.03
Helical0.210.410.550.680.4314.1569.13177.70
GeometryReactor Length 50.32 mm
Generated Power (Watt)Pumping Power (mWatt)
Re 100Re 500Re 1000Re 1500Re 100Re 500Re 1000Re 1500
No tapeStraight0.260.530.660.780.237.3234.2884.55
Helical0.270.580.700.790.3112.1363.58169.16
With tape y = 3.15Straight0.260.570.740.880.7730.51150.03382.71
Helical0.270.630.800.951.0334.27173.63443.79
With tape y = 7.86Straight0.260.580.750.900.6719.3495.90245.79
Helical0.270.630.810.950.7826.74136.38357.98
With tape y = 15.73Straight0.260.580.760.910.6617.7778.61193.43
Helical0.270.630.810.950.7725.77128.75334.31
GeometryReactor Length 75.48 mm
Generated Power (Watt)Pumping Power (mWatt)
Re 100Re 500Re 1000Re 1500Re 100Re 500Re 1000Re 1500
No tapeStraight0.290.700.870.990.3410.0846.64115.20
Helical0.290.760.941.050.4517.8493.38247.83
With tape y = 3.15Straight0.290.740.951.111.1144.77221.86563.78
Helical0.290.811.041.201.4149.89254.27651.83
With tape y = 7.86Straight0.290.750.961.120.9727.74140.48365.08
Helical0.290.811.041.211.1338.84200.12528.19
With tape y = 15.73Straight0.290.750.961.130.9525.25111.51277.17
Helical0.290.811.041.211.1137.43188.35492.14
GeometryReactor Length 100.64 mm
Generated Power (Watt)Pumping Power (mWatt)
Re 100Re 500Re 1000Re 1500Re 100Re 500Re 1000Re 1500
No tapeStraight0.290.841.061.200.4512.7958.19143.43
Helical0.300.911.161.290.6023.56123.17326.41
With tape y = 3.15Straight0.300.881.151.321.4559.06293.86746.89
Helical0.300.951.251.451.8065.53335.06860.35
With tape y = 7.86Straight0.300.881.151.331.2636.13185.39486.26
Helical0.300.951.261.451.4750.95263.82697.94
With tape y = 15.73Straight0.300.881.161.341.2432.72144.40361.47
Helical0.300.951.261.451.4548.95247.42648.73
GeometryReactor Length 125.80 mm
Generated Power (Watt)Pumping Power (mWatt)
Re 100Re 500Re 1000Re 1500Re 100Re 500Re 1000Re 1500
No tapeStraight0.300.951.231.390.5615.4769.32170.10
Helical0.301.031.361.530.7529.37153.77407.75
With tape y = 3.15Straight0.300.981.261.401.7973.35365.91920.55
Helical0.301.051.381.562.2281.24416.231069.88
With tape y = 7.86Straight0.300.981.261.411.5644.55230.48608.45
Helical0.301.051.381.561.8263.12327.93869.26
With tape y = 15.73Straight0.300.981.261.421.5340.20177.34445.90
Helical0.301.051.381.561.8060.72308.33810.74
Table 2. Net power generation from methane combustion (in Watt) and Figure of Merit (FoM) for a single channel VAM reactor (in W/mg catalyst).
GeometryReactor Length 25.16 mm
Net Power (Watt)FoM (Watt/mg Catalyst)
Re 100Re 500Re 1000Re 1500Re 100Re 500Re 1000Re 1500
No tapeStraight0.190.330.430.51405.36693.45908.111080.46
Helical0.210.350.410.42381.89645.41756.56786.73
With tape y = 3.15Straight0.200.360.430.43422.65758.90913.00919.46
Helical0.210.390.450.43396.17718.15839.78809.58
With tape y = 7.86Straight0.200.370.480.52423.14780.871012.811113.58
Helical0.210.390.470.48396.13727.59882.01901.69
With tape y = 15.73Straight0.200.370.490.57423.12783.491035.841214.87
Helical0.210.390.480.50396.05732.12897.39934.70
GeometryReactor Length 50.32 mm
Net Power (Watt)FoM (Watt/mg Catalyst)
Re 100Re 500Re 1000Re 1500Re 100Re 500Re 1000Re 1500
No tapeStraight0.260.520.630.69275.54552.77665.52737.70
Helical0.270.570.640.62251.07526.91594.93580.16
With tape y = 3.15Straight0.260.540.590.50280.45578.57627.86527.32
Helical0.270.590.630.50254.02552.03587.44468.88
With tape y = 7.86Straight0.260.560.660.65280.59593.58699.42691.97
Helical0.270.600.670.59254.29559.83623.85549.98
With tape y = 15.73Straight0.260.560.680.72280.60595.36720.58764.71
Helical0.270.600.680.62254.30560.40631.93575.35
GeometryReactor Length 75.48 mm
Net Power (Watt)FoM (Watt/mg catalyst)
Re 100Re 500Re 1000Re 1500Re 100Re 500Re 1000Re 1500
No tapeStraight0.280.690.820.88201.75485.61580.05620.65
Helical0.290.740.850.80179.98462.17525.90498.70
With tape y = 3.15Straight0.290.700.730.55202.96495.05518.16387.93
Helical0.290.760.790.55180.39470.59487.73342.51
With tape y = 7.86Straight0.290.720.820.75203.08508.28582.67532.15
Helical0.290.770.840.68180.57478.17523.43421.53
With tape y = 15.73Straight0.290.720.850.86203.09510.00604.40607.36
Helical0.290.770.850.72180.58478.82530.37444.13
GeometryReactor Length 100.64 mm
Net Power (Watt)FoM (Watt/mg catalyst)
Re 100Re 500Re 1000Re 1500Re 100Re 500Re 1000Re 1500
No tapeStraight0.290.821.001.05156.13437.68529.83560.26
Helical0.300.891.030.97137.83413.71481.05450.49
With tape y = 3.15Straight0.290.820.850.58156.18438.17453.89306.72
Helical0.300.890.920.58137.56413.68427.82272.33
With tape y = 7.86Straight0.290.850.970.84156.28450.57515.18448.31
Helical0.300.900.990.75137.71420.55461.80349.24
With tape y = 15.73Straight0.290.851.010.98156.28452.24537.29521.37
Helical0.300.911.010.80137.71420.55461.80349.24
GeometryReactor Length 125.80 mm
Net Power (Watt)FoM (Watt/mg catalyst)
Re 100Re 500Re 1000Re 1500Re 100Re 500Re 1000Re 1500
No tapeStraight0.300.941.161.22126.24398.89493.38520.61
Helical0.301.001.201.12110.92374.24447.55417.15
With tape y = 3.15Straight0.300.900.890.48125.89384.58378.24205.88
Helical0.300.970.970.49110.44361.89359.95180.92
With tape y = 7.86Straight0.300.931.030.80125.99396.85438.35341.50
Helical0.300.991.060.69110.59368.57393.08255.98
With tape y = 15.73Straight0.300.941.080.97126.00398.53460.80414.14
Helical0.300.991.070.75110.60369.36400.10277.66
Table 3. Geometric parameters, operating parameters, and material properties.
ParameterSymbolValueUnit
Diameter of circular cross-sectionD1.13 × 10−3m
Height of the twisted tape insertHt1.00 × 10−3m
Pitch/Distance between helical turnHc2.00 × 10−3m
180 degree twist pitchLt3.15 × 10−3, 7.86 × 10⁻³, 1.57 × 10⁻³m
Width of the twisted tape insertWt4.00 × 10−5m
Helical coil radiusRc4.00 × 10−3m
Total length of reactorL12.58 × 10−2m
Catalyst areaAcReactor lengthStraightHelicalcm2
25.160.891.02
50.321.782.03
75.482.683.05
100.643.564.06
125.804.465.08
Platinum coverage on the surfacePt (s)2.71 × 10⁻⁸kmol/m2
Inlet velocity u m i x t u r e i n 1.38, 6.88,13.77, 20.65m/s
Inlet oxygen mass fraction ω O 2 i n 0.23-
Inlet methane mass fraction ω C H 4 i n 0.01-
Inlet hydrogen mass fraction ω H 2 i n 4.50 × 10⁻²-
Inlet temperature T m i x t u r e i n 300K
Wall temperature for initializationTwall,init1290K
Table 4. VAM combustion surface reaction mechanism.
No.ReactionArβrEr (J/kmol)
1H2 + 2Pt(s) → 2H(s)4.36 × 1070.50
22H(s) → H2 + 2Pt(s)3.70 × 102006.74 × 107
3O2 + 2Pt(s) → 2O(s)1.80 × 10¹⁷−0.50
4O2 + 2Pt(s) → 2O(s)2.01 × 10140.50
52O(s) → O2 + 2Pt(s)3.70 × 102002.13 × 108
6H2O + Pt(s) → H2O(s)2.37 × 1080.50
7H2O(s) → H2O + Pt(s)1.00 × 101304.03 × 107
8OH + Pt(s) → OH(s)3.25 × 1080.50
9OH(s) → OH + Pt(s)1.00 × 101301.93 × 108
10H(s) + O(s) → OH(s) + Pt(s)3.70 × 102001.15 × 107
11H(s) + OH(s) → H2O(s) + Pt(s)3.70 × 102001.74 × 107
12OH(s) + OH(s) → H2O(s) + O(s)3.70 × 102004.82 × 107
13CO + Pt(s) → CO(s)7.85 × 10150.50
14CO(s) → CO + Pt(s)1.00 × 101301.25 × 108
15CO2(s) → CO2 + Pt(s)1.00 × 101302.05 × 107
16CO(s) + O(s) → CO2(s) + Pt(s)3.70 × 102001.05 × 108
17CH4 + 2Pt(s) → CH3(s) + H(s)2.30 × 10160.50
18CH3(s) + Pt(s) → CH2(s) + H(s)3.70 × 102002 × 107
19CH2(s) + Pt(s) → CH(s) + H(s)3.70 × 102002 × 107
20CH(s) + Pt(s) → C(s) + H(s)3.70 × 102002 × 107
21C(s) + O(s) → CO(s) + Pt(s)3.70 × 102006.28 × 107
22CO(s) + Pt(s) → C(s) + O(s)1.00 × 101701.84 × 108
23OH(s) + Pt(s) → H(s) + O(s)1.56 × 101801.15 × 107
24H2O (s) + Pt(s) → H(s) + OH(s)1.88 × 101801.74 × 107
25H2O (s) + O(s) → OH(s) + OH(s)4.45 × 102004.82 × 107

