Article

Multi-Leg TiO2 Nanotube Photoelectrodes Modified by Platinized Cyanographene with Enhanced Photoelectrochemical Performance

1
Regional Centre of Advanced Technologies and Materials, Faculty of Science, Palacky University Olomouc, 17. listopadu 1192/12, 771 46 Olomouc, Czech Republic
2
Department of Materials Science and Engineering, University of Erlangen-Nuremberg, Martensstrasse 7, D-91058 Erlangen, Germany
*
Author to whom correspondence should be addressed.
Catalysts 2020, 10(6), 717; https://doi.org/10.3390/catal10060717
Submission received: 27 May 2020 / Revised: 12 June 2020 / Accepted: 23 June 2020 / Published: 26 June 2020

Abstract

:
Highly ordered multi-leg TiO2 nanotubes (MLTNTs) functionalized with platinized cyanographene are proposed as a hybrid photoelectrode for enhanced photoelectrochemical water splitting. The platinized cyanographene and cyanographene/MLTNTs composite yielded photocurrent densities 1.66 and 1.25 times higher than those of the pristine MLTNTs nanotubes, respectively. Open circuit VOC decay (VOCD), electrochemical impedance spectroscopy (EIS), and intensity-modulated photocurrent spectroscopy (IMPS) analyses were performed to study the recombination rate, charge transfer characteristics, and transfer time of photogenerated electrons, respectively. According to the VOCD and IMPS results, the addition of (platinized) cynographene decreased the recombination rate and the transfer time of photogenerated electrons by one order of magnitude. Furthermore, EIS results showed that the (platinized) cyanographene MLTNTs composite has the lowest charge transfer resistance and therefore the highest photoelectrochemical performance.

1. Introduction

Photoelectrochemical (PEC) water splitting is a promising approach to the production of hydrogen, thus representing a clean, renewable, and sustainable technology for future energy systems. Hydrogen can yield more energy per unit mass than other fuels [1,2,3] and can be utilized in fuel cells producing only water as the reaction product. The core component of PEC cells is a semiconductor electrode, in which electron–hole pairs can be generated upon the light absorption [4,5], and can be further separated to provide corresponding redox half-reactions.
Among various types of metal oxide semiconductors (α-Fe2O3, ZnO, WO3, etc.), titanium dioxide (TiO2) has been one of the most widely used materials for the PEC application owing to many beneficial properties, including chemical and mechanical stability, photocorrosion resistance, favorable band edge positions, and low cost [6,7,8,9]. However, TiO2 also suffers from a few significant drawbacks that restrict its broader practical application. These are mainly the low solar light absorption due to its wide bandgap (~3.2 eV for anatase and 3.0 eV for rutile) and a relatively high recombination rate of photogenerated charge carriers [10,11,12].
Considerable effort has been devoted in developing new avenues to overcoming its main drawbacks and improving the PEC activity of TiO2 by, e.g., careful nanostructuring, doping TiO2 with foreign elements or establishing various heterojunctions [13]. One-dimensional (1D) TiO2 nanotubes (TNTs) have been extensively investigated, over the last decade, due to their favorable properties, which have the potential to outperform their bulk counterparts in photocatalytic activity for several reasons [1,14,15]. For example, TNTs generally provide a high aspect ratio that significantly enlarges the surface area and the light harvesting efficiency as well as an increased number of catalytic centers [16]. Moreover, the drawback of the electron–hole recombination can be significantly suppressed due to the fast and directional pathway (along the axial direction) of photogenerated electrons [17,18,19]. Various methods have been developed to synthesize 1D TiO2 nanotubes, including template synthesis, sol-gel, or a hydrothermal method [15]. However, self-organized electrochemical anodization of Ti metal substrate is the most commonly applied technique providing a high degree of control over the length of nanotubes, diameter, and long-range order [18,20,21]. An interesting class of TNTs arrays includes separated TiO2 nanotubes [22] and very well-defined and discrete multi-leg TiO2 nanotube arrays [23], which can be fabricated under specific anodization conditions and by using di-ethylene glycol (DEG), hydrofluoric acid (HF), and deionized water as an electrolyte solution [24,25].
In general, TiO2 nanostructures can be doped with various metal (platinum, gold, iron, etc.) [26,27] and non-metal (carbon, sulfur, nitrogen, silicon, etc.) elements [28] with the aim of shifting their absorption into the visible region of the spectrum as well as improving the charge dynamics by increasing the electrical conductivity. Another approach yielding similar effects is based on establishing a heterojunction between TiO2 and other partner(s) in various hybrid nanostructures. Other semiconductors such as CdS, MoS2 [29], Fe2TiO5 [30], SrTiO3 [31], etc., have been typically applied as the interacting partners providing a charge transfer and/or affective charge separation because of a built-in electric field at the junction/interface between the semiconductors [32,33]. Over the last decade, TiO2 nanostructures have also been extensively combined with carbon-based allotropes including graphitic carbon nitride (C3N4) [34], graphene and its derivatives [35], carbon dots [36], etc., which improve the charge separation and light absorption in order to achieve highly active hybrid photocatalysts based on various heterojunctions. Graphene oxide (GO), which is a low cost and harmless material, has been widely studied as a good candidate for forming composites with TiO2 because of its unique physicochemical properties [37,38]. Other derivatives of GO, such as reduced graphene oxide (rGO), can also be used as a catalyst promotor and support to tackle the disadvantages of TiO2 [38,39,40]. Nevertheless, GO is insulating and upon its reduction to rGO, it loses most of its functionalities and thus the ability to interact with other components is significantly suppressed. On the other hand, fluorographene-derived functionalized graphenes, such as cyanographene (G-CN) [41], can be densely functionalized while keeping its high conductivity [42], unlike GO. Furthermore, G-CN is selectively functionalized, in contrast to the very diverse oxygen chemical groups found on GO [43], and displays a high affinity towards metal atoms [44]. Considering these favorable properties, G-CN caught significant scientific interest in view of its applications in electrochemical sensing and supercapacitors [45,46]. However, no report has been dedicated to the performance of TiO2 nanotubes/G-CN composite in a PEC-WS experiment. In this work, first multi-leg TiO2 nanotubes (MLNTs) were synthesized on a Ti foil via the electrochemical anodization method. Then, electrodeposition was employed to produce a composite with pristine G-CN and G-CN/Pt, respectively. The prepared composite materials were tested for their PEC-WS activity and compared with the bare TiO2 MLNTs. It was found that the G/CN and G-CN/Pt functionalized MLNTs improved the PEC-WS activity response. Furthermore, we investigated different combinations with electrochemical impedance spectroscopy, VOCD analysis, measurement of the transfer time of photogenerated electron, and electron lifetime measurements. The results demonstrate that the surface functionalization of MLNTs with G-CN and G-CN/Pt successfully decreased the overall charge carrier recombination rate and improved the charge transfer kinetics.

2. Results and Discussion

First, we synthetized bare and platinized cyanographene sheets; the characterization results are presented in Figure 1. Cyanographene (G-CN) showed the typical layered structure of fluorographene-derived functionalized graphenes [42,47] (Figure 1a). The microwave assisted homogeneous deposition of single Pt2+ ions on G-CN has also been previously confirmed in detail by high resolution electron microscopy (TEM), sub-Angstrom resolution aberration-corrected high-angle annular dark-field scanning TEM and chemical mapping with energy dispersive X-ray spectroscopy [48]. After the reduction with NaBH4, ultrasmall Pt nanoparticles were clearly formed (Figure 1b–d), with 98% of the particles having diameters between 0.5 to 2 nm. The characteristic fingerprint of Pt was detected in the X-ray photoelectron spectroscopy (XPS) survey spectra, accompanied by the photoelectron peaks of G-CN (Figure 1e). High-resolution XPS (HRXPS) at the Pt 4f core-level area (Figure 1f) showed the two typical spin-orbit components with binding energy for Pt 4f7/2 at 73.2 eV. This is higher than the typical binding energies for bulk metallic Pt (371 eV). Nevertheless, such positive shifts have been observed in ultra-small particles of Pt [48], particularly when interacting with nitrogen atoms [49], as in the present case. G-CN/Pt contained 2.3 wt. % of Pt, as determined with atomic absorption spectroscopy.
In the next step, we grew TiO2 multi-leg nanotubes and combined them with bare and platinized cyanographene sheets. Figure 2a–f shows SEM images of the P-NTs, G-NTs and G-Pt-NTs samples. The structure of multi-leg and largely open ends of TiO2 nanotubes (see Figure 2a) can be observed. The mean length and diameter of the nanotubes are about 3.3 µm and 300 nm (Figure 2b), respectively, and the inter-tube spacing is approximately 500 nm. Figure 2c–f denotes that the cyanographene and platinized cyanographene sheets were electrodeposited not only on the top surface of the TiO2 nanotubes but also deep inside the nanostructure, thus also closely touching the walls of the TiO2 nanotubes. This type of functionalization would not be possible in typical close-packed arrays of TNTs, in which the cyanographene sheets would only be deposited on the top of the TiO2 nanotubes. Raman spectroscopy was employed to further confirm the existence of G-CN and G-CN/Pt within the MLNTs arrays (Figure 3a) and to evaluate the crystalline structure of the hybrids.
The Raman peaks at about 148, 396, 516, and 636 cm–1 were attributed to the Eg, B1g, B1g or A1g and Eg vibrational modes of anatase phase [50], respectively, which can be seen in all (P-NTs, G-NTS, G-Pt-NTs) Raman spectra. Furthermore, for the G-NTs and G-Pt-NTs composite samples, the two main peaks centered at 1365 and 1569 cm–1 are ascribed to the characteristic D band and G band of cyanographene [42]. The D peak originates from the structural disorder and defects in cyanographene, while the G peak is due to the bond stretching of all sp2 carbon atoms (C–C) [42,51]. Such characteristic confirmed that the cyanographene was actually deposited on the MLNTs. The as-prepared TiO2 nanotubes were amorphous. In order to transform them into the crystalline structure, all the samples were annealed at 450 °C for 180 min in air before the electrodeposition process. The X-ray diffraction (XRD) was used to assess the phase composition of the synthesized TiO2 nanotubes after the calcination. As shown in Figure 3b, the XRD pattern of the calcined P-NTs sample indicates the anatase phase which the position of peaks is slightly shifted due to the used Co source (instead of the commonly used Cu source) X-rays. Also, The formation of very little rutile phase can be attributed to the oxidation of Ti metal beneath the TiO2 nanotubes at the interface of Ti/TiO2 nanotubes during the annealing of the sample [52]. UV-vis diffuse reflectance absorption spectra (DRS) of P-NTS, G-NTs, and G-Pt-NTs were measured from 320 to 700 nm (Figure 3c). A red-shift of absorption edge (ca. 10–20 nm) can be observed as well as a higher absorption in the visible range of light spectrum for the composite samples compared to pristine TiO2 nanotubes, which could be attributed to the electronic interactions between cyanographene and TiO2 nanotubes [33,53]. Such an extended optical absorption has also been studied in an enormous number of scientific works related to the functionalization of semiconductors with nanocarbons (e.g., CNT and rGO) [54,55,56]. The high resolution XPS C1s, Ti2P and Pt4f spectra of the G-Pt-NTs composite are presented in Figure 3d–f. As it can be seen in Figure 3d, the four peaks at 284.5, 286.0, 287 and 288.8 eV correspond to C–C, C–N, C=O and O=C–O, respectively, which is in line with the reported results for pristine cyanographene [42]. This suggests that the chemical structures of cynographene did not change during electrodeposition onto TNTs. The peaks at 459.0 and 464.7 belong to Ti4+ (Figure 3e). Furthermore, as Figure 3f illustrates, the presence of metallic Pt (i.e., Pt0) in platinized cyanographene is confirmed by the two peaks at 71.4 and 42.9 eV.
In order to assess the PEC performance of the fabricated photoanodes, linear sweep voltammetry (LSV) measurements were carried out under simulated solar light illumination. Since the theoretical thermodynamic potential for splitting water is 1.23 V vs. reversible hydrogen electrode (RHE), the applied potential was converted from V vs. Ag/AgCl to RHE scale using the following formula:
𝐸𝑅𝐻𝐸 = 𝐸𝐴𝑔0 ⁄𝐴𝑔𝐶𝑙 + 𝐸𝐴𝑔⁄𝐴𝑔𝐶𝑙 + 0.059𝑝𝐻
Figure 4a shows the photocurrent density for P-NTs, G-NTs, and G-Pt-NTs versus applied voltage (J-V curve) in the dark and light periods (i.e., chopped illumination) under AM 1.5 G illumination (100 mW/cm2). The figure clearly shows the enhancement of the photocurrent for the composite samples, compared to the pristine TiO2 nanotubes (P-NTs). With functionalization of P-NTs, the onset potential for water oxidation for three samples did not change (i.e., 0.3 V vs. RHE), whereas the plateau photocurrent did. The maximum photocurrent density of 121 µA (hereafter at 1.3 V vs. RHE) was observed for the G-Pt-NTs sample. However, for the G-NTs and P-NTs, the photocurrent densities were 91 µA and 73 µA, respectively. Therefore, the photocurrent of the platinized cyanographene sample is about 66% and 33% higher than that of bare multi-leg TiO2 nanotubes (P-NTs sample) and cyanographene-TiO2 nanotubes (G-NTs sample), respectively. Such enhancement of the photocurrent might result from faster charge transfer, which is a direct consequence of using G-CN and G-CN/Pt in the composite samples. Moreover, the Pt metal with appropriate work function can suppress electron–hole recombination because of electron trapping in the metal.
Figure 4b shows the incident photon to current efficiency (IPCE) spectra of the three tested samples (i.e., P-NTs, G-NTs, and G-Pt-NTs) at +1.5 V vs. RHE in a 1 M NaOH solution. The results show the same trend in the photoactivity among all three tested samples. Based on our experiment, significant photoactivity was observed in the UV region for all three samples. Moreover, the G-Pt-NTs sample shows, compared to the other samples, the highest IPCE value at 300 nm—about 58%, which is in agreement with the results of the PEC activity of the synthesized samples. To examine the photostability of the most active G-Pt-NTs sample over the time, the chronoamperometry test was performed with the fixed bias voltage +1.5 V vs. RHE and continuous illumination light of 7 h under one sun (100 mW/cm2). After 7 h illumination, the PEC test of the photoanode showed acceptable stability and reached ~ 90% of the starting current (Figure 4c).
We attributed the enhanced PEC activity of the composite samples to the increased charge separation/transfer rate. In order to prove this, electrochemical impedance spectroscopy (EIS) was performed under 1 sun illumination in the frequency range of 0.1 Hz to 100 kHz at the bias potential +1.5 V vs. RHE. Figure 5a shows the Nyquist plots obtained for PNTs, G-NTs and G-Pt-NTs samples. Furthermore, all the fitting results shown as an inset of Figure 5a were obtained using Z-View software (see Table 1). The Rs is assigned as the overall resistance between the electrode and electrolyte, which can be valued from the X-intercept of Nyquist plot.
The Rs value was determined to be 11.46 Ω, 10.22 Ω and 11.01 Ω for P-NTs, G-NTs, and G-Pt-NTs composite, respectively. Similarly, the RSC corresponding to the bulk charge transport was also obtained, however, no significant difference was observed. In addition, the radius of semicircle for the G-Pt-NTs sample is smaller than P-NTs and G-NTs ones, and it decreases in the following order: P-NTs > G-NTs > G-Pt-NTs, representing a fastest interfacial hole transfer and efficient separation of electron-hole pairs. The Rct corresponds to the interfacial charge transfer resistance and the fitting parameters yield a Rct value of 105940 Ω, 38442 Ω, and 27954 Ω for P-NTs, G-NTs, and G-Pt-NTs composite, respectively. This data suggest that (i) the pristine G-CN already greatly improved the charge transfer kinetics to TiO2 nanotubes, decreasing by ~63.7% Rct if compared to pristine TNTs; (ii) G-CN/Pt further improve the performance of the composite by an additional ~27% owing to the beneficial effect of Pt in charge separation. The constant phase elements (CPE) resembles capacitance of space charge layer (Csc) and the semiconductor electrolyte interface (CSE) is determined by CPE-1 and CPE-2 respectively [57,58]. The value of CPE-1 follows the trend of P-NTs < G-NTs < G-Pt-NTs, indicating the significant improvement in electron-hole pair separation of G-Pt-NTs compared to P-NTs and G-NTs. Interestingly, CPE1 value is greatly enhanced for G-Pt-NTs (~72 times) compared to P-NTs, while it is only ~10 times for G-NTs. The observation suggests the efficient role of G-CN/Pt as a charge separator across the space charge region in comparison with Pt and G alone of the composite photoanodes, which is indeed the beneficial role of platinized G-CN for overall photocurrent enhancement, acting as a charge storage reservoir. Further, we also obtained the CPE-2 values, which suggests the charge transferability of photoanode to the electrolyte. The value is higher for G-Pt-NTs compared to Pt-NTs, but lower compared to G-NTs.
Therefore, to get the correlation between charge transfer efficiency and photocurrent enhancement corresponding to the photoanodes, we computed the rate constant (τ) of the charge transfer process across the photoanode/electrolyte interface (see Table 1) [58]. The lower the τ value, the higher the charge transfer efficiency, which follows the order P-NTs > G-NTs > G-Pt-NTs, and is well in agreement with the photocurrent enhancement trend. Therefore, the higher photocurrent of G-Pt-NTs was due to the improved charge separation (CPE1) and decreased charge transfer resistance (Rct) of photoanodes, and the same is reflected in time constant corresponding to charge transfer process. This trend may be attributed to the presence of G-CN/Pt and G-CN in the composite samples. In order to test the transport time of photo-generated electrons, the intensity-modulated photocurrent spectroscopy (IMPS) was examined at different intensity of light. The transform time of photo-generated electrons can be calculated as follows [59]:
τ t r a n s = 1 2 π f m i n
where τtrans is the electron transfer time to the back contact layer and fmin is the minimum frequency of IMPS plot. A comparison between IMPS results of pristine TiO2 nanotubes and the TiO2 composite is shown in Figure 5b. The fastest electron–transfer time was related to the G-Pt-NTs and G-NTs, respectively (see Table 2). This behavior confirms that using cyanographene and platinized cyanographene can provide better charge separation and thus increase the photocurrent.
The observation is in correlation with τ obtained from EIS measurements discussed above. To gain information about the recombination properties of fabricated samples, an open-circuit voltage decay (VOCD) measurement was conducted according the work reported by Zaban et al. [60]. When the photoelectrode is illuminated at open-circuit potential, a photogenerated potential is built up. Once the illumination is interrupted, a decay of VOCD (t) can be monitored. As shown in Figure 5c, under illumination, the photovoltage remains a constant value in the following order G-Pt-NTs > G-NTs > P-NTs, indicating a higher concentration of free electron in G-Pt-NTs and G-NTs composite samples compared to P-NTs. A subsequent decay trend of the voltage can be observed by turning the light off. This is because of the recombination process at the interface between electrons in the conduction band of TiO2 and the electrolyte or bulk recombination. Introduction of G-CN/Pt and G-CN as a conducting layer on the surface of TiO2 nanotubes could suppress the interfacial charge recombination rate in comparison with bare MLNTs. Furthermore, according to the VOCD curve, the electron lifetime can be calculated according to the following equation [60]:
τ n = k B T e d V O C d t 1
where t is a temperature (K), kB is the Boltzmann constant, and e is a positive elementary charge. Figure 5d displays the electron lifetime (τn) as a function of VOCD plot. Therefore, during the voltage decay the smaller slope (the smallest VOCD decay belonged to G-Pt-NTs sample) shows a higher electron lifetime. At an equal potential and by applying Equation (3) to the data in Figure 5c, electron lifetimes were determined in the following order G-Pt-NTs > G-NTs > P-NTs. For instance, at voltage of 1.6 V the electron lifetime for P-NTs, G-NTs, and G-Pt-NTs was 1.3 s, 2.21 s, and 11.25 s, respectively. These results demonstrate that the charge recombination rate in the cyanographene composite is slower that of pristine TiO2 nanotubes, as remarked by the one-order magnitude improvement in the electron lifetime.

3. Materials and Methods

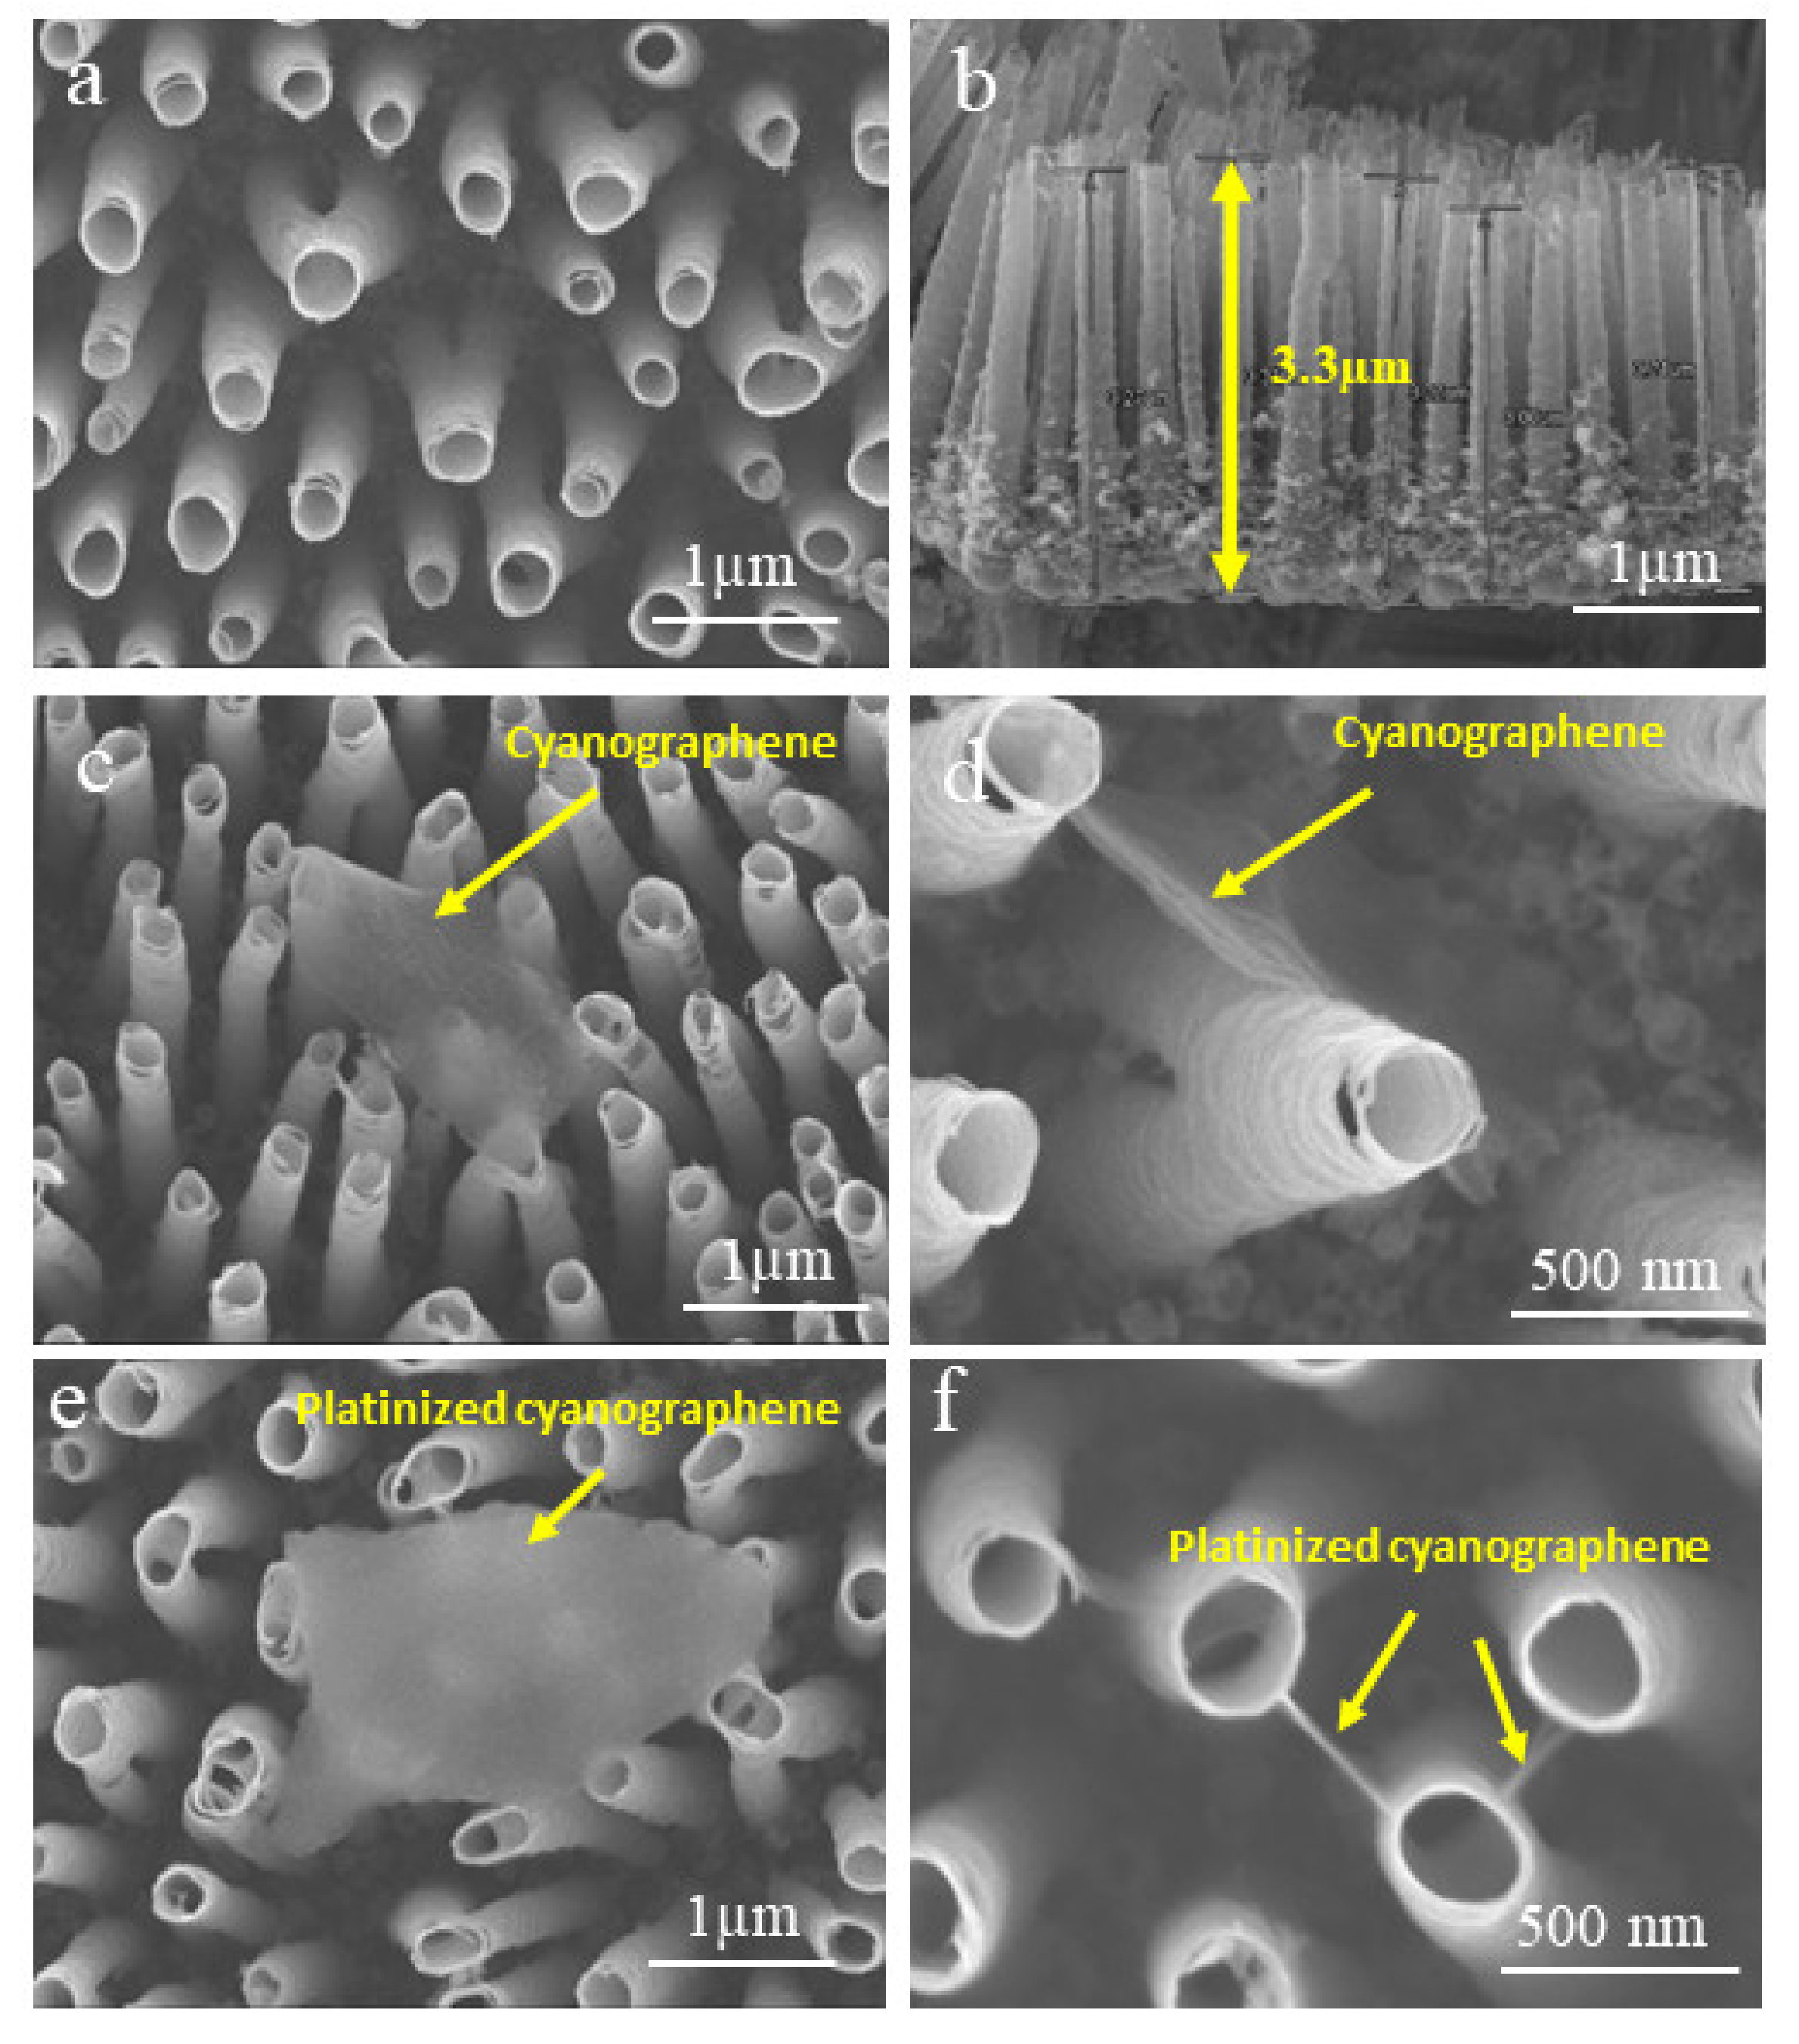
3.1. Preparation of Multi Leg Titanium Dioxide Nano Tubes (MLTNTs)

Multi-leg TiO2 nanotubes were grown via electrochemical anodization of a Ti foil with a thickness of 0.25 mm and 99.7% purity (Sigma-Aldrich 0.25 mm, 99.7%, Darmstadt, Germany). In this particular set-up, the titanium foils served as a working electrode and a platinum plate was used as the counter electrode. Prior to the anodization, the Ti foil (2 × 1 cm) was ultrasonicated in acetone, ethanol, and deionized water for 15 min. Then, the foil was dried in nitrogen stream before being mounted onto the anodization setup, which consisted of a beaker and two electrodes keeping the distance of 2 cm. The anodization was carried out at 35 °C for 2 h by using a constant voltage of 60 V and an electrolyte consisting of 0.6 wt.% ammonium bi-fluoride salt (NH4F.HF), 96 mL diethylene glycol (DEG 99%, Sigma Aldrich, Darmstadt, Germany), and 4 mL deionized (DI) water. Subsequently, the synthesized TiO2 nanotubes were calcined at 450 °C in air for 2 h with heating and cooling rate of 2 °C/min.

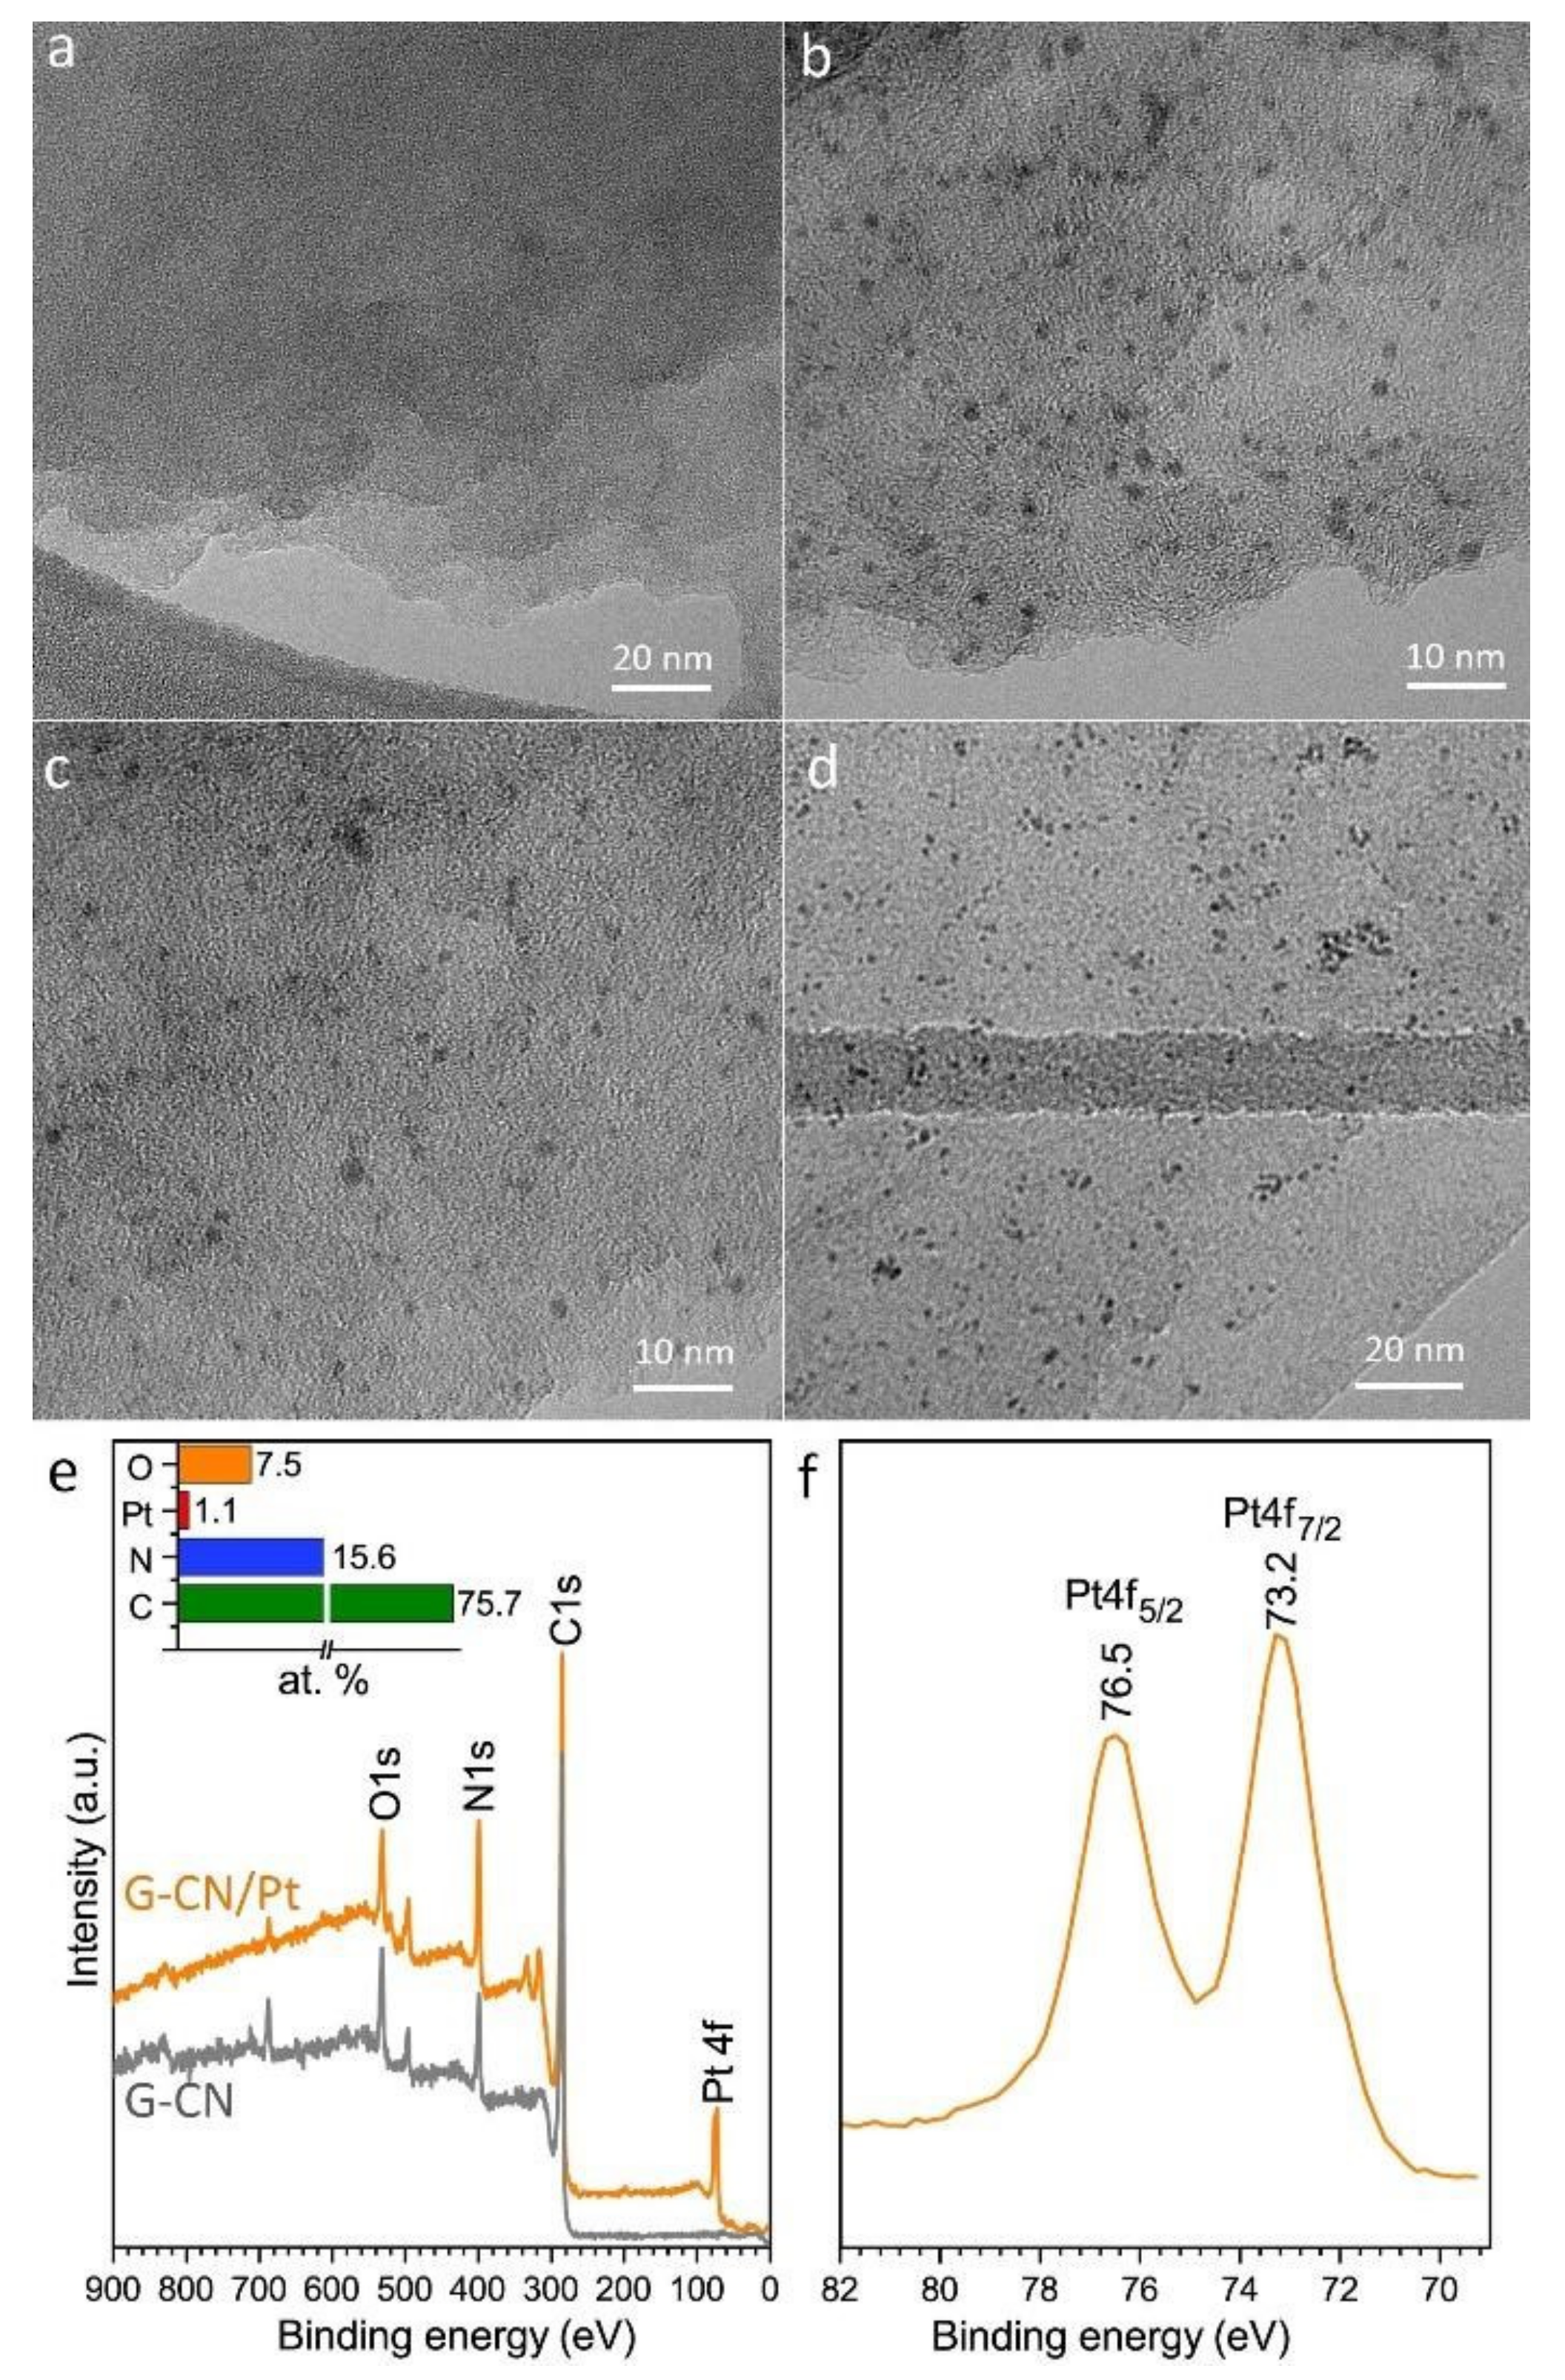
3.2. Preparation of the Cyanographene and Platinized Cyanographene Composite

The synthesis process of the G-CN was described elsewhere [43] as well as the immobilization of Pt2+ ions [48]. Briefly, 100 mg of G-CN was dispersed by sonication (15 min, Branson 2510, Danbury, CT, USA, 100W, 45 kHz) in 10 mL of water. Then 0.32 mmol of K2[PtCl4] was dissolved in 10 mL of water and mixed with G-CN. The reaction mixture was transferred into the microwave reactor and treated for 15 min at 60 °C under microwave irradiation (850 W, Anton Paar microwave synthesis reactor, Monowave 300 MAS 24, Graz, Austria) and stirring. After the reaction ended, the resulting product was collected by centrifugation (12,000 rcf) and washed thoroughly with ethanol and water. For the formation of Pt nanoparticles on G-CN (sample G-CN/Pt), 50 mg of Pt2+ containing G-CN was dispersed by sonication (15 min) in 5 mL of ethanol. Subsequently, a solution of 25 mg NaBH4 in 5 mL of ethanol was added. The reaction proceeded in air at room temperature for one hour under stirring. The product of reaction was then collected by centrifugation (12,000 rcf) and washed with ethanol and water.
The optimized concentration of cyanographene (10 mg/L; see Figures S1 and S2 in the supporting information) was coated over the MLTNTs following the electrodeposition method, the G-CN solution was employed as an electrolyte, in which the MLTNTs on the titanium foils and the platinum sheet served as the working and the counter electrodes, respectively. The deposition was conducted by applying a constant voltage of 100 V for 1 min. Then, the sample was rinsed with DI water and ethanol and dried with nitrogen stream (Scheme 1). For simplicity, pristine TiO2 nanotubes, G-CN-TiO2 nanotubes, and platinized cyanographene TiO2 nanotubes are hereafter referred to as P-NTs, G-NTs, and G-Pt-NTs, respectively.

3.3. Characterization of Samples

The morphological properties were investigated using a scanning electron microscopy (SEM, Hitachi SU 6600, Tokyo, Japan). Raman spectra were acquired with DXR Raman microscope using the 455 nm excitation line of a diode laser. X-ray diffractometer (XRD, PANalytical, Almelo, The Netherlands) with Co-Kα (λ = 1.54 Å) radiation source was employed to analyze the crystalline structure of the synthesized TiO2 nanotubes; the analyses were performed within the range of 20° ≤ 2θ ≤ 70°. The UV-Vis diffuse reflectance spectra of the fabricated samples were obtained by Analytik Jena (Specord 250 plus, Jena, Germany) spectrophotometer. X-ray photoelectron spectroscopy (XPS) was carried out with a PHI 5000 VersaProbe II (Physical Electronics, Chanhassen, USA) spectrometer using an Al Kα source (15 kV, 50 W). The obtained data were evaluated with the MultiPak (Ulvac–PHI, Inc., Chigasaki, Japan) software package. All spectra were acquired at room temperature (22 °C), under a partial vacuum (1.4 × 10⁻⁷ Pa). High-resolution spectra of C 1s peaks were acquired by setting the pass energy to 23.500 eV and step size to 0.200 eV. The binding energy values were corrected considering the C 1s peak at 284.8 eV as a reference. Electron microscopy images were obtained with TEM JEOL 2010 with LaB6 type emission gun (Tokyo, Japan), operating at 160 kV. The concentration of Pt was determined by atomic absorption spectroscopy, using a graphite furnace (ContrAA 600; Analytik Jena AG, Jena, Germany) equipped with a high-resolution Echelle double monochromator (spectral band width, 2 pm at 200 nm). A xenon lamp was used as a continuum radiation source. The sample was digested in trace-metal quality concentrated HNO3 solution.

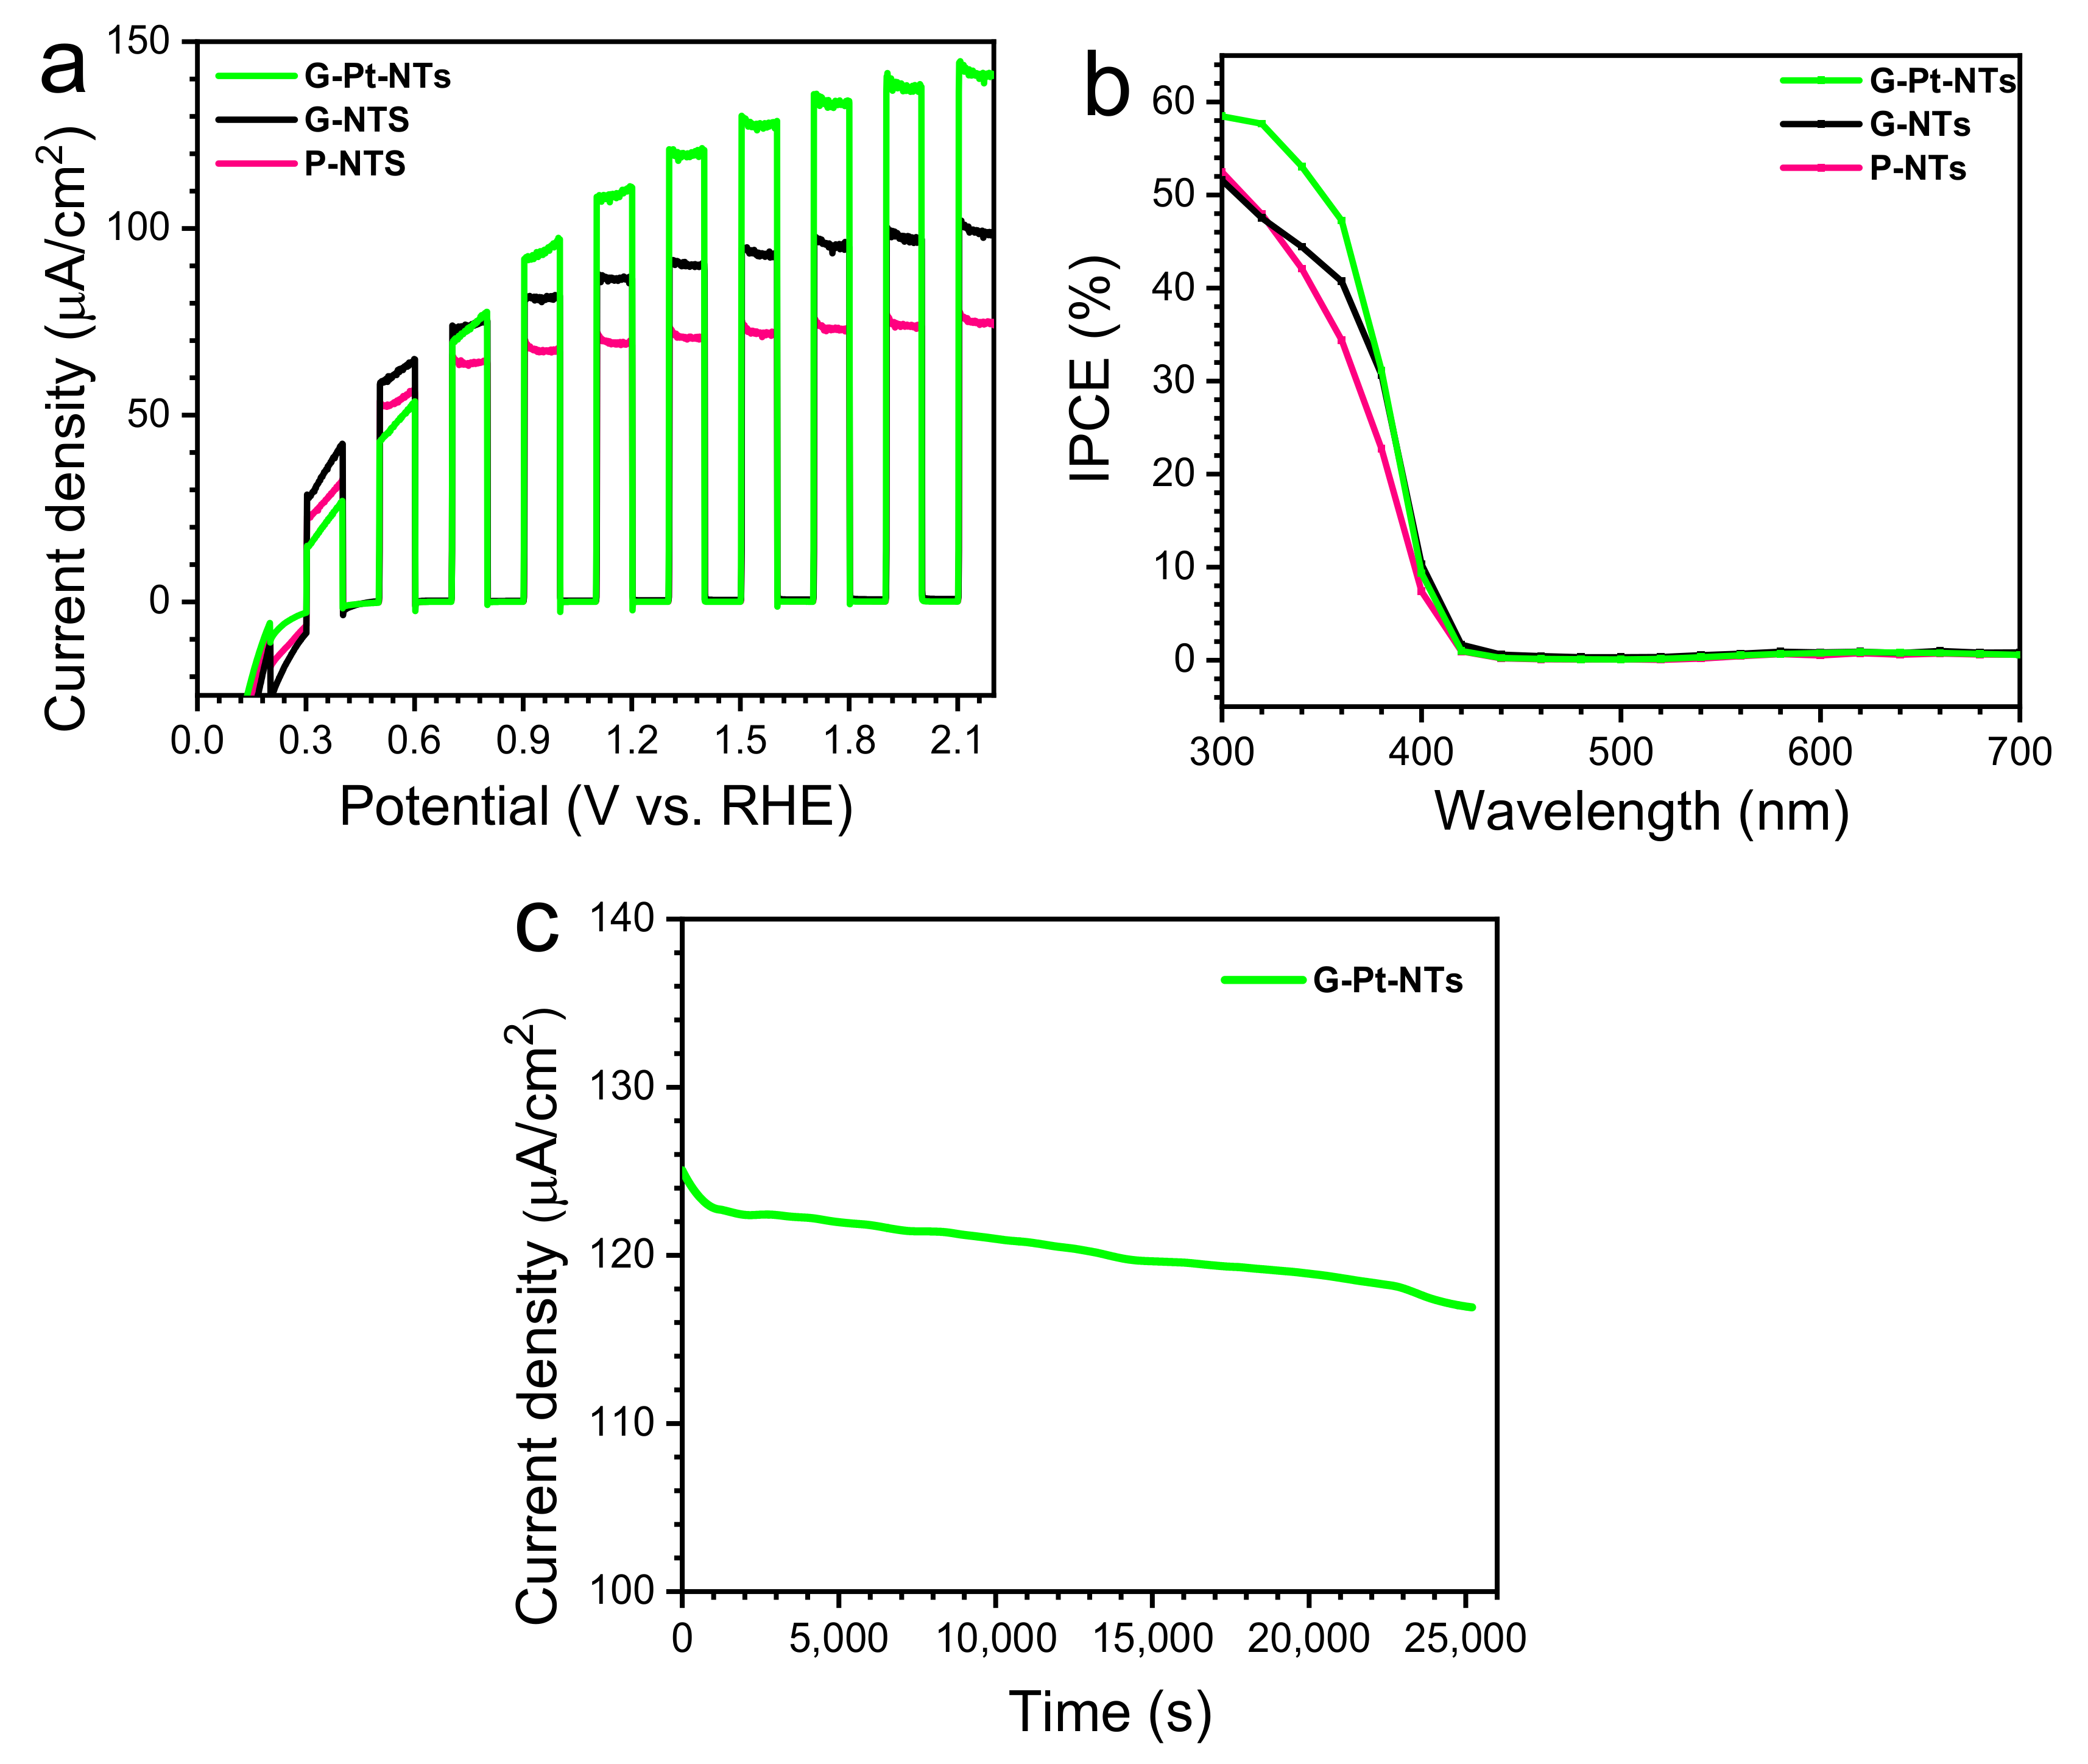
3.4. Photoelectrochemical Tests

The photoelectrochemical and electrochemical impedance spectra (EIS) measurements were carried out in 1 M NaOH solution (pH = 13.6) using a Gamry potentiostat Series G 300 (Gamry Instruments, Warminster, PA, USA). A three-electrode configuration was used for the measurements. Here, the fabricated samples were used as the working electrode; Pt and saturated Ag/AgCl (3 M KCl) were used as counter and reference electrodes, respectively. A xenon lamp equipped with an AM1.5 G filter and with light intensity of 1 sun (100 mW/cm2) was used to illuminate the samples. The incident photon-to-current efficiency (IPCE) was carried out using xenon light combined with a monochromator (Newport Oriel 1/8 Cornerstone). Intensity-modulated photocurrent spectroscopy (IMPS) was carried out using a Zahner PP 211 CIMPS (Zahner-Electrik Gmbh and Co.KG, Kronach, Germany) in the frequency range between 0.1 to 100 kHz with a wavelength of 369 nm and varying power intensity of a LED lamp (80, 25 and 8 mW/cm2). During the IMPS experiments, the photocurrent at the short circuit conditions (zero potential) was measured and sinusoidal perturbation of nearly 10% of the power of the illuminated light was superimposed on the constant base light intensity.

4. Conclusions

In summary, (platinized) cyanographene MLTNTs composites have been successfully constructed applying a facile electrodeposition technique. The unique structure of separated multi-leg TiO2 nanotubes with G-CN and G-CN/Pt provides the proper morphology for functionalizing not only the top surface of the nanotubes but also the space between the TNTs walls. Compared to the pristine TiO2 nanotubes (P-NTs), G-Pt-NTs and G-NTs enhanced the photocurrent by 66% and 25% under 1 sun illumination, respectively, as result of the efficient charge separation and transfer. Detailed EIS and IMPS analysis revealed that both the 2D scaffold of cyanographene as well as the small Pt nanocrystals deposited on it played an active role in improving the photoelectrical and photocurrent performance in the composites materials.

Supplementary Materials

The following are available online at https://www.mdpi.com/2073-4344/10/6/717/s1, Figure S1: The effect of (a) cyanographene concentration and (b) electrodeposition time on the PEC-WS; Figure S2: Photoelectrochemical response of synthesized samples measured under 1 sun illumination (100 mWc/m2- AM1.5 G) in 1 M NaOH solution at (a) different concentration of cyanographene, (b) different electrodeposition time, and (c) pure NTs.

Author Contributions

M.S., wrote the manuscript, designed and performed the experiments; S.M.H.H., aided in interpreting the results, worked on the manuscript and edited the manuscript; Y.R., contributed to EIS analysis; M.V., and A.B., contributed to sample preparation of cyanographene; S.O., Provided an expertise on separated multi-leg nanotubes; S.K., A.N. analyzed the data and edited the manuscript; P.S. and R.Z. supervised the project. All authors have read and agreed to the published version of the manuscript.

Funding

This research was funded by the Operational Programme Research, Development and Education—European Regional Development Fund, Project No. CZ.02.1.01/0.0/0.0/15_003/0000416 of the Ministry of Education, Youth and Sports of the Czech Republic.

Conflicts of Interest

The authors declare no conflict of interest.

References

  1. Kment, S.; Riboni, F.; Pausova, S.; Wang, L.; Wang, L.; Han, H.; Hubicka, Z.; Krysa, J.; Schmuki, P.; Zboril, R. Photoanodes based on TiO2 and α-Fe2O3 for solar water splitting-superior role of 1D nanoarchitectures and of combined heterostructures. Chem. Soc. Rev. 2017, 46, 3716–3769. [Google Scholar] [CrossRef]
  2. Mascaretti, L.; Dutta, A.; Kment, S.; Shalaev, V.M.; Boltasseva, A.; Zboril, R.; Naldoni, A. Plasmon-Enhanced Photoelectrochemical Water Splitting for Efficient Renewable Energy Storage. Adv. Mater. 2019, 31, 1805513. [Google Scholar] [CrossRef]
  3. Li, R.; Sun, L.; Zhan, W.; Li, Y.A.; Wang, X.; Han, X. Engineering an effective noble-metal-free photocatalyst for hydrogen evolution: Hollow hexagonal porous micro-rods assembled from In2O3@carbon core-shell nanoparticles. J. Mater. Chem. A 2018, 6, 15747–15754. [Google Scholar] [CrossRef]
  4. Ahmed, N.; Farghali, A.A.; El Rouby, W.M.A.; Allam, N.K. Enhanced photoelectrochemical water splitting characteristics of TiO2 hollow porous spheres by embedding graphene as an electron transfer channel. Int. J. Hydrog. Energy 2017, 42, 29131–29139. [Google Scholar] [CrossRef]
  5. Dong, Z.; Ding, D.; Li, T.; Ning, C. Black Si-doped TiO2 nanotube photoanode for high-efficiency photoelectrochemical water splitting. RSC Adv. 2018, 8, 5652–5660. [Google Scholar] [CrossRef]
  6. Dong, Y.; Meng, F. Synthesis and photocatalytic properties of three dimensional laminated structure anatase TiO2/nano-Fe0 with exposed (001) facets. RSC Adv. 2020, 10, 11823–11830. [Google Scholar] [CrossRef] [Green Version]
  7. Rusinque, B.; Escobedo, S.; Lasa, H. Photoreduction of a Pd-Doped Mesoporous TiO2 Photocatalyst for Hydrogen Production under Visible Light. Catalysts 2020, 10, 74. [Google Scholar] [CrossRef] [Green Version]
  8. Junior, A.G.; Pereira, A.; Gomes, M.; Fraga, M.; Wender, H.; Miyakawa, W.; Massi, M.; da Sobrinho, A.S. Black TiO2 Thin Films Production Using Hollow Cathode Hydrogen Plasma Treatment: Synthesis, Material Characteristics and Photocatalytic Activity. Catalysts 2020, 10, 282. [Google Scholar] [CrossRef] [Green Version]
  9. Li, R.; Yang, J.; Xu, S.; Zhou, Y.; Wang, X.; Peng, H.; Du, J. Preparation of Gd-Doped TiO2 Nanotube Arrays by Anodization Method and Its Photocatalytic Activity for Methyl Orange Degradation. Catalysts 2020, 10, 298. [Google Scholar] [CrossRef] [Green Version]
  10. Dvorak, F.; Zazpe, R.; Krbal, M.; Sopha, H.; Prikryl, J.; Ng, S.; Hromadko, L.; Bures, F.; Macak, J.M. One-dimensional anodic TiO2 nanotubes coated by atomic layer deposition: Towards advanced applications. Appl. Mater. Today 2019, 14, 1–20. [Google Scholar] [CrossRef]
  11. Kment, S.; Kluson, P.; Stranak, V.; Virostko, P.; Krysa, J.; Cada, M.; Pracharova, J.; Kohout, M.; Morozova, M.; Adamek, P.; et al. Photo-induced electrochemical functionality of the TiO2 nanoscale films. Electrochim. Acta 2009, 54, 3352–3359. [Google Scholar] [CrossRef]
  12. Ge, M.; Li, Q.; Cao, C.; Huang, J.; Li, S.; Zhang, S.; Chen, Z.; Zhang, K.; Al-Deyab, S.S.; Lai, Y. One-dimensional TiO2 Nanotube Photocatalysts for Solar Water Splitting. Adv. Sci. 2017, 4, 1600152. [Google Scholar] [CrossRef] [PubMed]
  13. Li, X.; Yu, J.; Low, J.; Fang, Y.; Xiao, J.; Chen, X. Engineering heterogeneous semiconductors for solar water splitting. J. Mater. Chem. A 2015, 3, 2485–2534. [Google Scholar] [CrossRef]
  14. Shahrezaei, M.; Babaluo, A.A.; Habibzadeh, S.; Haghighi, M. Photocatalytic Properties of 1D TiO2 Nanostructures Prepared from Polyacrylamide Gel–TiO2 Nanopowders by Hydrothermal Synthesis. Eur. J. Inorg. Chem. 2017, 2017, 694–703. [Google Scholar] [CrossRef]
  15. Shahrezaei, M.; Habibzadeh, S.; Babaluo, A.A.; Hosseinkhani, H.; Haghighi, M.; Hasanzadeh, A.; Tahmasebpour, R. Study of synthesis parameters and photocatalytic activity of TiO2 nanostructures. J. Exp. Nanosci. 2017, 12, 45–61. [Google Scholar] [CrossRef] [Green Version]
  16. Macak, J.M.; Tsuchiya, H.; Schmuki, P. High-Aspect-Ratio TiO2 Nanotubes by Anodization of Titanium. Angew. Chem. Int. Ed. 2005, 44, 2100–2102. [Google Scholar] [CrossRef]
  17. Pi, Y.; Li, Z.; Xu, D.; Liu, J.; Li, Y.; Zhang, F.; Zhang, G.; Peng, W.; Fan, X. 1T-Phase MoS2 Nanosheets on TiO2 Nanorod Arrays: 3D Photoanode with Extraordinary Catalytic Performance. ACS Sustain. Chem. Eng. 2017, 5, 5175–5182. [Google Scholar] [CrossRef]
  18. Li, H.; Xing, J.; Xia, Z.; Chen, J. Preparation of coaxial heterogeneous graphene quantum dot-sensitized TiO2 nanotube arrays via linker molecule binding and electrophoretic deposition. Carbon N. Y. 2015, 81, 474–487. [Google Scholar] [CrossRef]
  19. Vijayan, B.K.; Dimitrijevic, N.M.; Wu, J.; Gray, K.A. The effects of Pt doping on the structure and visible light photoactivity of titania nanotubes. J. Phys. Chem. C 2010, 114, 21262–21269. [Google Scholar] [CrossRef]
  20. Tahmasebpoor, R.; Babaluo, A.A.; Shahrouzi, J.R.; Tahmasebpoor, M.; Shahrezaei, M. Theoretical and experimental studies on the anodic oxidation process for synthesis of self-ordering TiO2 nanotubes: Effect of TiO2 nanotube lengths on photocatalytic activity. J. Environ. Chem. Eng. 2017, 5, 1227–1237. [Google Scholar] [CrossRef]
  21. Roy, P.; Berger, S.; Schmuki, P. TiO2 nanotubes: Synthesis and applications. Angew. Chem. Int. Ed. 2011, 50, 2904–2939. [Google Scholar] [CrossRef] [PubMed]
  22. Ozkan, S.; Nguyen, N.T.; Mazare, A.; Hahn, R.; Cerri, I.; Schmuki, P. Fast growth of TiO2 nanotube arrays with controlled tube spacing based on a self-ordering process at two different scales. Electrochem. Commun. 2017, 77, 98–102. [Google Scholar] [CrossRef]
  23. Rambabu, Y.; Jaiswal, M.; Roy, S.C. Enhanced photoelectrochemical performance of multi-leg TiO2 nanotubes through efficient light harvesting. J. Phys. D Appl. Phys. 2015, 48, 295302. [Google Scholar] [CrossRef]
  24. Mohammadpour, A.; Farsinezhad, S.; Hsieh, L.H.; Shankar, K. Multipodal and multilayer TiO2 nanotube arrays: Hierarchical structures for energy harvesting and sensing. Earth Environ. Sci. Trans. R Soc. Edinb. 2013, 1552, 29–34. [Google Scholar] [CrossRef]
  25. Rambabu, Y.; Jaiswal, M.; Roy, S.C. Effect of annealing temperature on the phase transition, structural stability and photo-electrochemical performance of TiO2 multi-leg nanotubes. Catal. Today 2016, 278, 255–261. [Google Scholar] [CrossRef]
  26. He, H.; Sun, D.; Zhang, Q.; Fu, F.; Tang, Y.; Guo, J.; Shao, M.; Wang, H. Iron-Doped Cauliflower-Like Rutile TiO2 with Superior Sodium Storage Properties. ACS Appl. Mater. Interfaces 2017, 9, 6093–6103. [Google Scholar] [CrossRef]
  27. Dozzi, M.V.; Candeo, A.; Marra, G.; Andrea, C.D.; Valentini, G.; Selli, E. Effects of Photodeposited Gold vs Platinum Nanoparticles on N,F- Doped TiO2 Photoactivity: A Time-Resolved Photoluminescence Investigation. J. Phys. Chem. C 2018, 122, 14326–14335. [Google Scholar] [CrossRef]
  28. Piskunov, S.; Lisovski, O.; Begens, J.; Bocharov, D.; Zhukovskii, Y.F.; Michael, W.; Spohr, E. C-, N-, S-, and Fe-Doped TiO2 and SrTiO3 Nanotubes for Visible-Light-Driven Photocatalytic Water Splitting: Prediction from First Principles. J. Phys. Chem. C 2015, 119, 18686–18696. [Google Scholar] [CrossRef]
  29. Zheng, L.; Teng, F.; Ye, X.; Zheng, H.; Fang, X. Photo/Electrochemical Applications of Metal Sulfide/TiO2 Heterostructures. Adv. Energy Mater. 2019, 10, 1902355. [Google Scholar] [CrossRef]
  30. Zhang, P.; Lu, X.F.; Luan, D.; Lou, X.W. Fabrication of Heterostructured Fe2TiO5 – TiO2 Nanocages with Enhanced Photoelectrochemical Performance for Solar Energy Conversion. Angew. Chem. Int. Ed. 2020, 59, 1–6. [Google Scholar] [CrossRef]
  31. Zhang, J.; Bang, J.H.; Tang, C.; Kamat, P.V. Tailored TiO2-SrTiO3 Heterostructure Nanotube Arrays for Improved Photoelectrochemical Performance. ACS Nano 2010, 4, 387–395. [Google Scholar] [CrossRef] [PubMed]
  32. Yu, Z.; Liu, H.; Zhu, M.; Li, Y.; Li, W. Interfacial Charge Transport in 1D TiO2 Based Photoelectrodes for Photoelectrochemical Water Splitting. Small 2019, 2019, 1903378. [Google Scholar] [CrossRef] [PubMed]
  33. Zhai, C.; Zhu, M.; Bin, D.; Wang, H.; Du, Y.; Wang, C.; Yang, P. Visible-light-assisted electrocatalytic oxidation of methanol using reduced graphene oxide modified Pt nanoflowers-TiO2 nanotube arrays. ACS Appl. Mater. Interfaces 2014, 6, 17753–17761. [Google Scholar] [CrossRef] [PubMed]
  34. Rathi, A.K.; Kmentova, H.; Naldoni, A.; Goswami, A.; Gawande, M.B.; Varma, R.S.; Kment, S.; Zboril, R. Significant Enhancement of Photoactivity in Hybrid TiO2/g-C3N4 Nanorod Catalysts Modified with Cu−Ni-Based Nanostructures. ACS Appl. Nano Mater. 2018, 1, 2526–2535. [Google Scholar] [CrossRef]
  35. Xie, G.; Zhang, K.; Guo, B.; Liu, Q.; Fang, L.; Gong, J.R. Graphene-Based Materials for Hydrogen Generation from Light-Driven Water Splitting. Adv. Mater. 2013, 25, 3820–3839. [Google Scholar] [CrossRef]
  36. Yu, H.; Shi, R.; Zhao, Y.; Waterhouse, G.I.N.; Wu, L.; Tung, C.; Zhang, T. Smart Utilization of Carbon Dots in Semiconductor Photocatalysis. Adv. Mater. 2016, 28, 9454–9477. [Google Scholar] [CrossRef]
  37. Faraji, M.; Yousefi, M.; Yousefzadeh, S.; Zirak, M.; Naseri, N.; Jeon, T.H.; Choi, W.; Moshfegh, A.Z. Two-dimensional materials in semiconductor photoelectrocatalytic systems for water splitting. Energy Environ. Sci. 2019, 12, 59–95. [Google Scholar] [CrossRef]
  38. Song, P.; Zhang, X.; Sun, M.; Cui, X.; Lin, Y. Graphene oxide modified TiO2 nanotube arrays: Enhanced visible light photoelectrochemical properties. Nanoscale 2012, 4, 1800–1804. [Google Scholar] [CrossRef]
  39. Ge, M.Z.; Li, S.H.; Huang, J.Y.; Zhang, K.Q.; Al-Deyab, S.S.; Lai, Y.K. TiO2 nanotube arrays loaded with reduced graphene oxide films: Facile hybridization and promising photocatalytic application. J. Mater. Chem. A 2015, 3, 3491–3499. [Google Scholar] [CrossRef]
  40. Li, L.; Yu, L.; Lin, Z.; Yang, G. Reduced TiO2-Graphene Oxide Heterostructure As Broad Spectrum-Driven Efficient Water-Splitting Photocatalysts. ACS Appl. Mater. Interfaces 2016, 8, 8536–8545. [Google Scholar] [CrossRef]
  41. Pumera, M.; Sofer, Z. Towards stoichiometric analogues of graphene: Graphene, fluorographene, graphol, graphene acid and others. Chem. Soc. Rev. 2017, 46, 4450–4463. [Google Scholar] [CrossRef] [PubMed] [Green Version]
  42. Bakandritsos, A.; Pykal, M.; Blonski, P.; Jakubec, P.; Chronopoulos, D.D.; Polakova, K.; Georgakilas, V.; Cepe, K.; Tomanec, O.; Ranc, V.; et al. Cyanographene and Graphene Acid: Emerging Derivatives Enabling High-Yield and Selective Functionalization of Graphene. ACS Nano 2017, 11, 2982–2991. [Google Scholar] [CrossRef] [PubMed]
  43. Marcano, D.C.; Kosynkin, D.V.; Berlin, J.M.; Sinitskii, A.; Sun, Z.; Slesarev, A.; Alemany, L.B.; Lu, W.; Tour, J.M. Improved Synthesis of Graphene Oxide. ACS Nano 2010, 4, 4806–4814. [Google Scholar] [CrossRef] [PubMed]
  44. Bakandritsos, A.; Kadam, R.G.; Kumar, P.; Zoppellaro, G.; Andryskova, P.; Drahos, B.; Varma, R.S.; Otyepka, M.; Gawande, M.B. Mixed-Valence Single-Atom Catalyst Derived from Functionalized Graphene. Adv. Mater. 2019, 31, 1900323. [Google Scholar] [CrossRef]
  45. Talande, S.V.; Bakandritsos, A.; Jakubec, P.; Malina, O.; Zboril, R.; Tucek, J. Densely Functionalized Cyanographene Bypasses Aqueous Electrolytes and Synthetic Limitations Toward Seamless Graphene/β-FeOOH Hybrids for Supercapacitors. Adv. Funct. Mater. 2019, 29, 1906998. [Google Scholar] [CrossRef]
  46. Cheong, Y.H.; Nasir, M.Z.M.; Bakandritsos, A.; Pykal, M.; Zboril, R.; Otyepka, M.; Pumera, M. Cyanographene and Graphene Acid: The Functional Group of Graphene Derivative Determines the Application in Electrochemical Sensing and Capacitors. ChemElectroChem 2019, 6, 229–234. [Google Scholar] [CrossRef] [Green Version]
  47. Chronopoulos, D.D.; Bakandritsos, A.; Pykal, M.; Zboril, R.; Otyepka, M. Chemistry, properties, and applications of fluorographene. Appl. Mater. Today 2017, 9, 60–70. [Google Scholar] [CrossRef]
  48. Langer, R.; Fako, E.; Blonski, P.; Vavrecka, M.; Otyepka, M.; Lopez, N. Anchoring of single-platinum-adatoms on cyanographene: Experiment and theory. Appl. Mater. Today 2020, 18, 100462. [Google Scholar] [CrossRef]
  49. Liu, J.; Jiao, M.; Lu, L.; Barkholtz, H.M.; Li, Y.; Wang, Y.; Jiang, L.; Wu, Z.; Liu, D.; Zhuang, L.; et al. High performance platinum single atom electrocatalyst for oxygen reduction reaction. Nat. Commun. 2017, 8, 15938. [Google Scholar] [CrossRef] [Green Version]
  50. Tian, G.; Fu, H.; Jing, L.; Xin, B.; Pan, K. Preparation and Characterization of Stable Biphase TiO2 Photocatalyst with High Crystallinity, Large Surface Area, and Enhanced Photoactivity. J. Phys. Chem. C 2008, 112, 3083–3089. [Google Scholar] [CrossRef]
  51. Gu, L.; Wang, J.; Cheng, H.; Zhao, Y.; Liu, L.; Han, X. One-Step Preparation of Graphene-Supported Anatase TiO2 with Exposed {001} Facets and Mechanism of Enhanced Photocatalytic Properties. ACS Appl. Mater. Interfaces 2013, 5, 3085–3093. [Google Scholar] [CrossRef] [PubMed]
  52. Albu, S.P.; Tsuchiya, H.; Fujimoto, S.; Schmuki, P. TiO2 nanotubes-Annealing effects on detailed morphology and structure. Eur. J. Inorg. Chem. 2010, 2010, 4351–4356. [Google Scholar] [CrossRef]
  53. Yang, M.-Q.; Zhang, N.; Xu, Y.-J. Synthesis of Fullerene−, Carbon Nanotube−, and Graphene−TiO2 Nanocomposite Photocatalysts for Selective Oxidation: A Comparative Study. ACS Appl. Mater. Interfaces 2013, 5, 1156–1164. [Google Scholar] [CrossRef] [PubMed]
  54. Zhao, D.; Sheng, G.; Chen, C.; Wang, X. Enhanced photocatalytic degradation of methylene blue under visible irradiation on graphene@TiO2 dyade structure. Appl. Catal. B Environ. 2012, 111–112, 303–308. [Google Scholar] [CrossRef]
  55. Zhang, Y.; Tang, Z.-R.; Fu, X.; Xu, Y.-J. Engineering the Unique 2D Mat of Graphene to Achieve Graphene-TiO2 Nanocomposite for Photocatalytic Selective Transformation: What Advantage does Graphene Have over Its Forebear Carbon Nanotube? ACS Nano 2011, 5, 7426–7435. [Google Scholar] [CrossRef]
  56. Tayebi, M.; Kolaei, M.; Tayyebi, A.; Masoumi, Z.; Belbasi, Z.; Lee, B. Reduced graphene oxide (RGO) on TiO2 for an improved photoelectrochemical (PEC) and photocatalytic activity. Sol. Energy 2019, 190, 185–194. [Google Scholar] [CrossRef]
  57. Chen, A.; Nigro, S. Influence of a Nanoscale Gold Thin Layer on Ti/SnO2-Sb2O5 Electrodes. J. Phys. Chem. B 2003, 107, 13341–13348. [Google Scholar] [CrossRef]
  58. Rambabu, Y.; Jaiswal, M.; Roy, S.C. Enhanced Photo-Electrochemical Performance of Reduced Graphene- Oxide Wrapped TiO2 Multi-Leg Nanotubes. J. Electrochem. Soc. 2016, 8, H652–H656. [Google Scholar] [CrossRef]
  59. Yu, X.Y.; Liao, J.Y.; Qiu, K.Q.; Kuang, D.B.; Su, C.Y. Dynamic study of highly efficient CdS/CdSe quantum dot-sensitized solar cells fabricated by electrodeposition. ACS Nano 2011, 5, 9494–9500. [Google Scholar] [CrossRef]
  60. Zaban, A.; Greenshtein, M.; Bisquert, J. Determination of the electron lifetime in nanocrystalline dye solar cells by open-circuit voltage decay measurements. ChemPhysChem 2003, 4, 859–864. [Google Scholar] [CrossRef]
Figure 1. Transmission electron microscopy of (a) the starting cyanographene (G-CN) and (bd) after the formation and immobilization of Pt nanoparticles (G-CN/Pt). (e) X-ray photoelectron spectroscopy survey spectra of G-CN and G-CN/Pt. The inset shows the atomic composition of G-CN/Pt. (f) HR-XPS of the G-CN/Pt sample, showing the Pt 4f region.
Catalysts 10 00717 g001
Figure 2. SEM images of samples: (a) P-NTs, (b) showing cross-section of P-NTs, (c,d) GNTs, (e,f) G-Pt-NTS.
Catalysts 10 00717 g002
Figure 3. (a) Raman spectra of P-NTs, G-NTs and G-Pt-NTs. The inset shows the magnified Raman spectra. (b) XRD pattern of TiO2 nanotubes using cobalt X-ray source annealed at 450 °C in air. (c) UV-vis diffuse reflectance spectra (DRS) of P-NTs, G-NTs, and G-Pt-NTs, and (df) high-resolution XPS spectra of C1s (d), Ti2p (e), and Pt4f (f) of G-Pt-NTs composite.
Catalysts 10 00717 g003
Figure 4. (a) Photoelectrochemical response of synthesized samples measured under 1 sun illumination (100 W/m2- AM1.5 G) in 1 M NaOH solution, (b) corresponding IPCE spectra, (c) chronoamperometry test of G-Pt-NTs in 1 M NaOH solution, potential 1.5 V vs RHE for 7 h where the pH is 13.6, E0Ag/AgCl = 0.197 V at 298 K, and E0Ag/AgCl is the measured potential vs. Ag/AgCl.
Catalysts 10 00717 g004
Figure 5. (a) Nyquist plots representing electrochemical impedance spectra of P-NTs, G-NTs, and G-Pt-NTs samples obtained in 1 M NaOH solution at 1.5 V vs. RHE. The inset shows EIS at high frequency and the equivalent circuits used to fit the impedance spectra. (b) Comparison of transport time of photogenerated electron for the P-NTs, G-NTs, and G-Pt-NTs samples as a function of incident photon flux for monochromatic light at 369 nm. (c) Open-circuit photovoltage decay measurement of P-NTs, G-NTs, and G-Pt-NTs under one sun (100 W/m2 –AM 1.5 G) illumination, and (d) corresponding electron life-time.
Catalysts 10 00717 g005
Scheme 1. Schematic illustration of the fabrication process of G-Pt-NTs and G-NTs composites using electrodeposition.
Catalysts 10 00717 sch001
Table 1. Equivalent circuit components calculated by fitting the experimental electrochemical impedance spectroscopy data.
SampleRs (Ω) Rsc (Ω) Rct (Ω) CPE-1 (µF)CPE-2 (µF) Τ = Rct × CPE2 (s)
P-NTs 11.46 ± 0.1195.7 ± 11.1105,940 ± 28282.61 ± 0.1570.20 ± 0.77.43
G-NTs 10.22 ± 0.0988.28 ± 9.238,442 ± 99227.2 ± 0.9102.99 ± 0.53.95
G-Pt-NTs 11.01 ± 0.09106 ± 19.127,954 ± 625187 ± 11 78.10 ± 0.92.18
Table 2. The electron transfer time (τtrans) of photogenerated electrons determined through IMPS data analysis.
Sampleτtrans (ms) at Light Power 80 Wτtrans (ms) at Light Power 25 Wτtrans (ms) at Light
Power 8 W
P-NTs1.525
G-NTs11.32.5
G-Pt-NTs0.512.1

