3.1. Catalyst Characterization
Table 1 reports the BET surface area for the different catalysts prepared in the present study. It can be observed that the impregnation of the Ni onto the alumina support mildly decreases the support-specific surface area from 191 to 182.3 m
2/g. However, in catalysts with added Ru, the surface area increases slightly. These changes can be considered to be in the range of the expected specific surface area variations. Thus, there is little or no effect of the added Ni and Ru on the γAl
2O
3 surface area.
Furthermore, and with respect to the average pore size, one can also observe, in
Table 1, a small average pore size decrease with Ni addition and a minor average pore size reduction with the additional Ru addition. These changes are in the range of the average pore size experimental error. Thus, these results points towards the consistent little effect of metal addition on the γAl
2O
3 support.
Figure 1a–d, report the Temperature Program Reduction (TPR) for the different catalysts of the present study. These figures also report, in all cases, the baseline used in TPR calculations (broken line).
Figure 1a reports the TPR for catalyst (Cat) A or 5% Ni/γAl
2O
3. Two TPR peaks at 307 and 488 °C were observed. The first peak was assigned to the thermal decomposition of the Ni(NO
3)
2 precursor, while the second peak was assigned to the NiO reduction with the H
2 leading to Ni formation [
23]. Furthermore, and once the Ru was added, as shown in
Figure 1b–d, one could observe a third early TPR peak. This early peak developed in the 235–239 °C range. This third early peak was assigned to RuO
3 reduction.
Table 2 describes the H
2 consumption and the percentages of Ni and Ru used for the prepared catalysts, as established with TPR. On this basis, one can make the following observations: (a) a 2.0–3.9 wt. % reducible Ni was observed by TPR, versus the 5wt. % nominal nickel; (b) Ru loadings were consistently in the anticipated range; (c) Ru addition appeared to contribute to a greater Ni reducibility.
One should note that hydrogen consumption for the catalyst of this study was calculated on the basis of NiO and RuO
3 precursor oxides. This was the case given the catalyst was pretreated with air at 600 °C prior to the TPR analysis. This assumption was consistent with the findings of others (Mazumder et al. [
24], Sharma et al. [
25]).
In addition, one can also see that the Ru influences the thermal decomposition and reduction in nickel peaks which occur at lower temperatures. For example, if one compares Cat C with 1 wt. % Ru with Cat A with no added Ru, one can observe that the reduction temperature shifts from 307 to 250 °C (second peak) and from 488 to 389 °C (third peak). This variation of the reduction in temperature is assigned to a hydrogen spillover effect which lowers both the nickel nitrate precursor decomposition temperature and the NiO reduction temperature.
Furthermore, the surface morphologies of the various catalysts of this study were investigated using scanning electron spectroscopy (SEM), as shown in
Figure 2. The SEM pictures show the minimum agglomeration of the 5% Ni/γAl
2O
3 alumina particles as well as the minimum agglomeration of the 5% Ni-0.25% Ru/γAl
2O
3 alumina particles.
Figure 3 reports the catalyst particle size distribution with 58.6 μm being the average catalyst particle size. These alumina particles belong to Group B of the Geldart Classification and display adequate particle sizes for good fluidization in the CREC Riser Simulator.
Moreover, one can observe that Ru addition affects neither the surface morphology nor the particle size distribution. The average particle size remains at 54.6 μm for the 5% Ni-0.25% Ru/γAl
2O
3 catalyst as reported in
Table 3.
Table 3 also reports the Ni loading in the outer alumina fluidizable particles’ one micron-thick shell, as determined with EDX. It is interesting to note that the observed EDX Ni loading is close to the nominal 5 wt. % Ni loading. These EDX results also provide a strong indication that the added metals, using incipient wetness impregnation, were uniformly distributed across the 60-micron particles.
Furthermore, and regarding the catalyst acid sites, they were measured using ammonia TPD peaks.
Figure 4 describes the desorption profiles for the different catalysts of the present study.
Table 4 shows the distribution of the acid sites, which were classified in two groups: (a) weak strength sites or sites displaying NH
3 desorption peaks in the 25–200 °C range and (b) medium strength sites or sites involving NH
3 desorption peaks in the 200–400 °C range. Given that peaks overlapped, TPD peaks were deconvoluted using Gaussian functions.
Table 4 shows that the medium strength acid sites are, in all cases, the most abundant ones. In this respect, it was also possible to observe that the nickel addition reduces the ammonia desorption peaks from 192.4 µmole/g for γ-Al
2O
3 to 149.3 µmole/g for 5%Ni/γAl
2O
3. Furthermore, it can also be noticed that Ru addition together with Ni, decreases further the medium and weak acid sites. This is desirable given the significant role of acid sites on coke formation [
24,
26].
Figure 5 reports the diffractograms for the γAl
2O
3 support and for the Ni-γAl
2O
3 with different Ru loadings. While it is possible to observe the characteristic γ alumina support peaks at 37.5°, 45.9° and 66.9° [
13], the peaks for the γ alumina loaded with Ni and Ru could not be seen. This was assigned to the low levels of both Ni and Ru.
Table 5 summarizes the results obtained using H
2 chemisorption. On this basis, it can be observed that the percentual metal dispersion increases up to 8.7% at the lowest 0.25 wt. % Ru loading. Consistent with this, the crystallite sizes decrease with Ru addition, achieving a minimum value of 9.7 nm.
3.2. Gasification Results
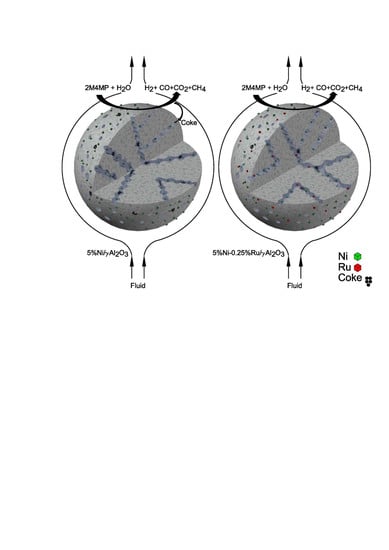
Lignin is a main biomass carbohydrate constituent. Typically, lignin content in biomass ranges from 49.7 to 77.5 wt %. Lignin is a polymer displaying similar chemical functionalities as 2-methoxy-4-methylphenol (2M4MP). It was on this basis that the 2M4MP was chosen as a surrogate compound to study the gasification of tar derived from biomass gasification. The performance of the different Ni and Ni–Ru γAl2O3 supported catalysts was evaluated in a CREC Riser Simulator using steam and 2M4MP at 600 °C, 20 s reaction time, catalyst/2M4MP (Cat/2M4MP) ratio of 2.663 g/g and a steam/2M4MP (S/2M4MP) ratio of 1.5 g/g.
Table 6 reports the 2M4MP gasification conversions at 600 °C, with and without a catalyst being present. One can see that there is an important increase in 2M4MP conversion from 50% to 80% when catalysts are used.
Figure 6 reports the mole fractions of the gas products and the C
6–C
8 hydrocarbons (78–137 g/mole molecular weight) obtained with the different prepared catalysts. These mole fractions can also be compared with the ones predicted using chemical equilibrium calculations and the ones from thermal conversion (experiments without the catalyst present).
Furthermore, while reviewing
Figure 6 and
Figure A1 from
Appendix A, one can also observe the significantly reduced C
6–C
8 fraction (78–137 g/mole molecular weight) when dealing with 2M4MP catalytic gasification.
It can be observed in
Figure 6, that for all catalysts studied, there is a significant influence of the forward methane reforming reaction (Equation (4)), without the corresponding backward reaction compensation. This yields a methane mole fraction significantly below equilibrium values. In
Figure 6, one can also observe that ruthenium addition has a beneficial effect on hydrogen formation with the H
2 mole fraction increasing by 10.2%. One can also see that Ru diminishes CO
2 mole fractions by an average of 7.7%. Furthermore, and if one compares the hydrogen mole fractions obtained from the prepared catalysts with those with added Ru (Cat B, Cat C and Cat D), one can see that there is no significant difference between them.
One should also notice that the prepared catalysts are stable in terms of their catalytic activity. This is the case given that, after five consecutive 2M4MP/water injections in the CREC Riser Simulator, there was no noticeable catalyst activity decay (+/−3%). Thus, no regeneration was effected between consecutive runs, with the coke formed being evaluated at the end of the fifth consecutive run using TOC. Given the observed catalyst stability, it is speculated that coke forms mainly on the alumina support and not on the Ni–Ru crystallites.
Figure 7, reports the percentage of coke deposited on the catalysts, as measured by Total Organic Carbon (TOC), and after the fifth 2M4MP/steam consecutive injection. Coke selectivity is defined as the ratio of grams of coke being deposited on the catalyst over the grams of 2M4MP carbon converted.
One can observe, in
Figure 7, the significant reduction in coke once the Ru is added to the prepared catalysts. This can be attributed to the Ru’s role in promoting both char gasification (C+H
2O → CO+H
2) and the Boudouard reaction (CO
2 + C → 2CO). Additionally, this is in line with both an increased hydrogen and increased mole fractions. This is the case when Ru doped catalysts are used, as shown in
Figure 6.
Regarding the reduced coke formation on Ru doped catalysts, one can anticipate this effect given the ammonia TPDs, as reported in
Table 4.
Table 4 shows that, with Ru addition, there is a reduction in weak and medium strength acid site density, which appears to enhance coke formation. Moreover, consistent with TPD results, one can see that higher Ru levels on the catalysts have little effect on medium strength acid site’s density, leading to unchanged coke yields.
Thus, and given that higher Ru levels have no influence on coke yields and hydrogen yields, the lowest Ru loading (0.25%) was selected to develop further gasification runs. During these runs, the following conditions were changed systematically: (a) catalyst loading; (b) reaction temperature; (c) steam/2M4MP ratio. To accomplish this, runs were carried out in the CREC Riser Simulator using 50, 100 and 150 mg of catalyst.
Figure 8 reports the average product mole fractions obtained using Cat A: 5%Ni/γAl
2O
3 and Cat B: 5%Ni/γAl
2O
3.
It can be observed, in
Figure 8, that there is no significant change in the distribution of the product mole fractions with respect to amount of catalyst used. Thus, one can conclude that the lowest Cat/2M4MP ratio is adequate for the obtained 2M4MP high conversions and desired product distribution.
Figure 9 reports the coke selectivity during the catalytic steam gasification of 2M4MP using different catalyst loadings.
Thus,
Figure 9 shows that Cat B with added Ru consistently displays, for various steam/2M4MP ratios, lower coke selectivity (g coke/g 2M4MP converted) than Cat A catalysts with no Ru addition. This consistent trend for Cat B allows one to anticipate a better catalytic stability for catalysts with added Ru.
Figure 10 and
Figure 11 also report coke selectivity for Cat A and Cat B at different catalyst loadings, as a function of temperature. Experiments were carried out at several S/2M4MP ratios and with a 2.63 Cat/2M4MP ratio. One can see that, for all cases, the coke selectivity decreases at higher thermal levels. One can also notice that the coke selectivity for Cat B (
Figure 11) is approximately 50% lower than that for Cat A, with this being true for all temperatures and S/2MMP ratios studied.
One interesting and consistent issue with both Cat A and Cat B (5% Ni/γAl2O3 is the significant effect of S/2M4MP ratios on coke selectivity at 550 °C. This influence occurs, however, at 600 and 650 °C. Thus, on this basis, one can consider that there is an increased influence of coke steam reforming (C + H2O → CO + H2) at the higher thermal levels.
Figure 12 compares the experimental mole fractions obtained with Cat A with those predicted at chemical equilibrium for 2M4MP gasification at 600 °C and with different S/2M4MP ratios. One should mention that chemical equilibrium calculations were developed following the procedure reported in Salaices et al. [
7], which accounts for various reactions, as described in Equations (6) to (8).
Furthermore,
Figure 13 reports the experimentally observed product mole fractions for Cat B, with chemical equilibrium values during the steam gasification of 2M4MP, at different temperatures.
Thus, in
Figure 12 and
Figure 13, one can consistently see that Cat B yields higher hydrogen mole fractions, with this being true for the three S/2M4MP ratios and three thermal levels. In this respect, the hydrogen values obtained, which supersede chemical equilibrium values, point to the catalytic 2M4MP conversion. These hydrogen values remain moderately affected by the chemical equilibrium of the secondary gasification reactions (Equations (6)–(8)).
Furthermore, and consistent with this, one can observe that Cat B yields a smaller methane mole fraction than Cat A, with both mole fractions well below chemical equilibrium values. Finally, one can notice higher CO and CO2 mole fractions for both Cat A and Cat B than chemical equilibrium values, with this being consistent with the catalyst-promoted methane reforming and water–gas shift reactions.
In summary, the Cat B developed in the present study promises to be valuable for biomass-derived tar gasification. This is given the high H2 mole fractions obtained, the significantly reduced coke formed and the important C6–C8 decrease.


