Article

Optimization of Fenton Technology for Recalcitrant Compounds and Bacteria Inactivation

1
Grupo de Ingeniería y Biotecnología Ambiental, Facultad de Ciencias Ambientales y Centro EULA-Chile, Universidad de Concepción, Concepción 4070386, Chile
2
Departamento de Ingeniería Civil, Facultad de Ingeniería, Universidad Católica de la Santísima Concepción, Alonso de Ribera 2850, Concepción 4030000, Chile
*
Author to whom correspondence should be addressed.
Catalysts 2020, 10(12), 1483; https://doi.org/10.3390/catal10121483
Submission received: 11 October 2020 / Revised: 7 December 2020 / Accepted: 9 December 2020 / Published: 19 December 2020

Abstract

:
In this work, the Fenton technology was applied to decolorize methylene blue (MB) and to inactivate Escherichia coli K12, used as recalcitrant compound and bacteria models respectively, in order to provide an approach into single and combinative effects of the main process variables influencing the Fenton technology. First, Box–Behnken design (BBD) was applied to evaluate and optimize the individual and interactive effects of three process parameters, namely Fe2+ concentration (6.0 × 10⁻⁴, 8.0 × 10⁻⁴ and 1.0 × 10⁻³ mol/L), molar ratio between H2O2 and Fe2+ (1:1, 2:1 and 3:1) and pH (3.0, 4.0 and 5.0) for Fenton technology. The responses studied in these models were the degree of MB decolorization (D%MB), rate constant of MB decolorization (kappMB) and E. coli K12 inactivation in uLog units (IuLogEC). According to the results of analysis of variances all of the proposed models were adequate with a high regression coefficient (R2 from 0.9911 to 0.9994). BBD results suggest that [H2O2]/[Fe2+] values had a significant effect only on D%MB response, [Fe2+] had a significant effect on all the responses, whereas pH had a significant effect on D%MB and IuLogEC. The optimum conditions obtained from response surface methodology for D%MB ([H2O2]/[Fe2+] = 2.9, [Fe2+] = 1.0 × 10⁻³ mol/L and pH = 3.2), kappMB ([H2O2]/[Fe2+] = 1.7, [Fe2+] = 1.0 × 10⁻³ mol/L and PH = 3.7) and IuLogEC ([H2O2]/[Fe2+] = 2.9, [Fe2+] = 7.6 × 10⁻⁴ mol/L and pH= 3.2) were in good agreement with the values predicted by the model.

1. Introduction

Some of the effluents produced by industries such as textiles, dyes, tanneries, cosmetics and pulp are colored [1]. In the pulp industry, effluents are colored due to the presence of lignin byproducts and other phenolic compounds formed [2]. These compounds are considered dangerous and recalcitrant because of their low biodegradability and resistant to chemical degradation [1,3]. Besides, recalcitrant compounds with biological activity contained in treated effluent discharges are generating a loss of biodiversity in ecosystems. Even more, some of these compounds with benzyl and phenolic structures are considered endocrine disruptors [4,5,6,7]. In addition to the presence of recalcitrant compounds, the bacteria in the effluents of the pulp industry must also be seriously considered. The presence of bacteria in effluents discharged to water bodies are generating humans and animals diseases. In this sense, Escherichia coli and other bacteria have been identified in pulp industry effluent [8]. The presence of these bacteria in the effluents of the pulp industry raises an important concern regarding the current technologies (biological treatment) and regulations that govern the discharge of these effluents [9]. The inactivation of a wide range of pathogens in the cellulose industry effluent is effective by chlorination at a relatively low cost [10,11]. However, despite its effectiveness there is a problem to consider: the formation of organochlorine compounds [12]. Tawabini, et al. [13] states that chlorine has a high reactivity that affects the formation of these byproducts (chlorinated organic compounds) when reacting with organic matter. These byproducts are characterized by high toxicity and mutagenic capacity for the environment.
The low effectiveness of conventional water treatments in the destruction of recalcitrant contaminants and the formation of hazardous byproducts has encouraged the search for treatments with a higher oxidative capacity avoiding the formation of harmful byproducts. In this sense, it has been proposed the use of the so-called advanced oxidation processes (AOP) for the elimination of recalcitrant compounds and disinfection of effluents [3,14,15]. Nevertheless, there are differences between bacterial inactivation and decolorization of recalcitrant organic compounds by AOP [16]. Bacteria with the ability to self-repair and grow again after damage are much more complex than recalcitrant compounds [17].
A common point of the vast majority of AOP is the formation of hydroxyl radicals (·OH). Furthermore, ·OH is considered one of the species with the greatest oxidizing power. For example, chlorinated compounds used in conventional effluent treatments such as Cl2 and ClO2 have standard reduction potentials of 1.36 and 1.27 V/SHE respectively, while ·OH has a standard potential of 2.8 V/SHE [18].
Among the AOP, the Fenton technologies has focused a lot of attention for many years [19]. This process involves the reaction of H2O2 as an oxidant agent with Fe2+ ions as a metal catalyst to produce the degradation agent of ·OH as illustrated in Equation (1). Fe3+ produced by the Fenton reaction can also oxidize H2O2 to produce perhydroxyl radicals (HO2·; Equation (2)), named the Fenton-like reaction. The ·OH and HO2· produced in Fenton and Fenton-like reactions can participate in parallel reactions to produce singlet oxygen (1O2; Equations (3) and (4)).
Fe 2 +   +   H 2 O 2     Fe 3 +   +   OH   +   · OH
Fe 3 +   +   H 2 O 2   Fe 2 +   +   HO 2 ·   +   H +
HO 2 ·   +   HO 2 ·     H 2 O 2   +   1 O 2
HO 2 ·   +   · OH     H 2 O   +   1 O 2
Andreozzi, et al. [20] highlight the reactivity of ∙OH, since this species has adequate properties to attack organic compounds, in addition to reacting 106–1012 times faster than other oxidants. Additionally, the cellular damage produced by ∙OH in the disinfection processes takes place on different macromolecules present in the bacterial membrane causing its inactivation [21].
Many of the parameters that can affect any type of chemical reaction could affect the Fenton reaction, among which the effects of pH and reagent concentration stand out. The pH is one of the most important parameters in the Fenton reaction. However, it is possible to find that the optimum pH varies. One of the reasons why it is possible to find this variety at the optimum pH of the Fenton reaction may be associated with the speciation of Fe2+ and Fe3+ [22], changes in redox potentials of the main oxidizing species produced [23], or changes in the type of oxidizing species produced depending on the pH [24,25,26].
Without the presence of Fe2+ in the Fenton system there is no formation of ·OH, so the presence of Fe2+ is essential. However, it has been studied that too high Fe2+ concentrations can cause the Fenton reaction oxidizing capacity to decrease (Equation (5)) [27].
· OH   +   Fe 2 +     Fe 3 +   +   OH
The H2O2 concentration, like Fe2+, is also essential in Fenton systems [28]. However, an excess of H2O2 could act as a scavenger of ·OH [27,28] according to the Equation (6).
· OH   +   H 2 O 2     HO 2 ·   +   H 2 O
Accordingly, to minimize Fe2+ and H2O2 acting as scavengers, but maximizing the production of oxidizing species from these reagents, it is very important to know the optimal [H2O2]/[Fe2+] [29].
Therefore, the aim of this work is to evaluate the decolorization of a model recalcitrant compound (methylene blue) and the inactivation of a model bacteria (E. coli K12 strain) by Fenton technology considering the operational parameters such as pH, Fe2+ concentration ([Fe2+]) and the molar ratio between H2O2 and Fe2+ ([H2O2]/[Fe2+]), and to reveal the single and combinative effects of the these variables influencing on degree of methylene blue (MB) decolorization (D%MB), rate constant of MB decolorization (kappMB) and E. coli K12 inactivation in uLog units (IuLogEC).

2. Results and Discussion

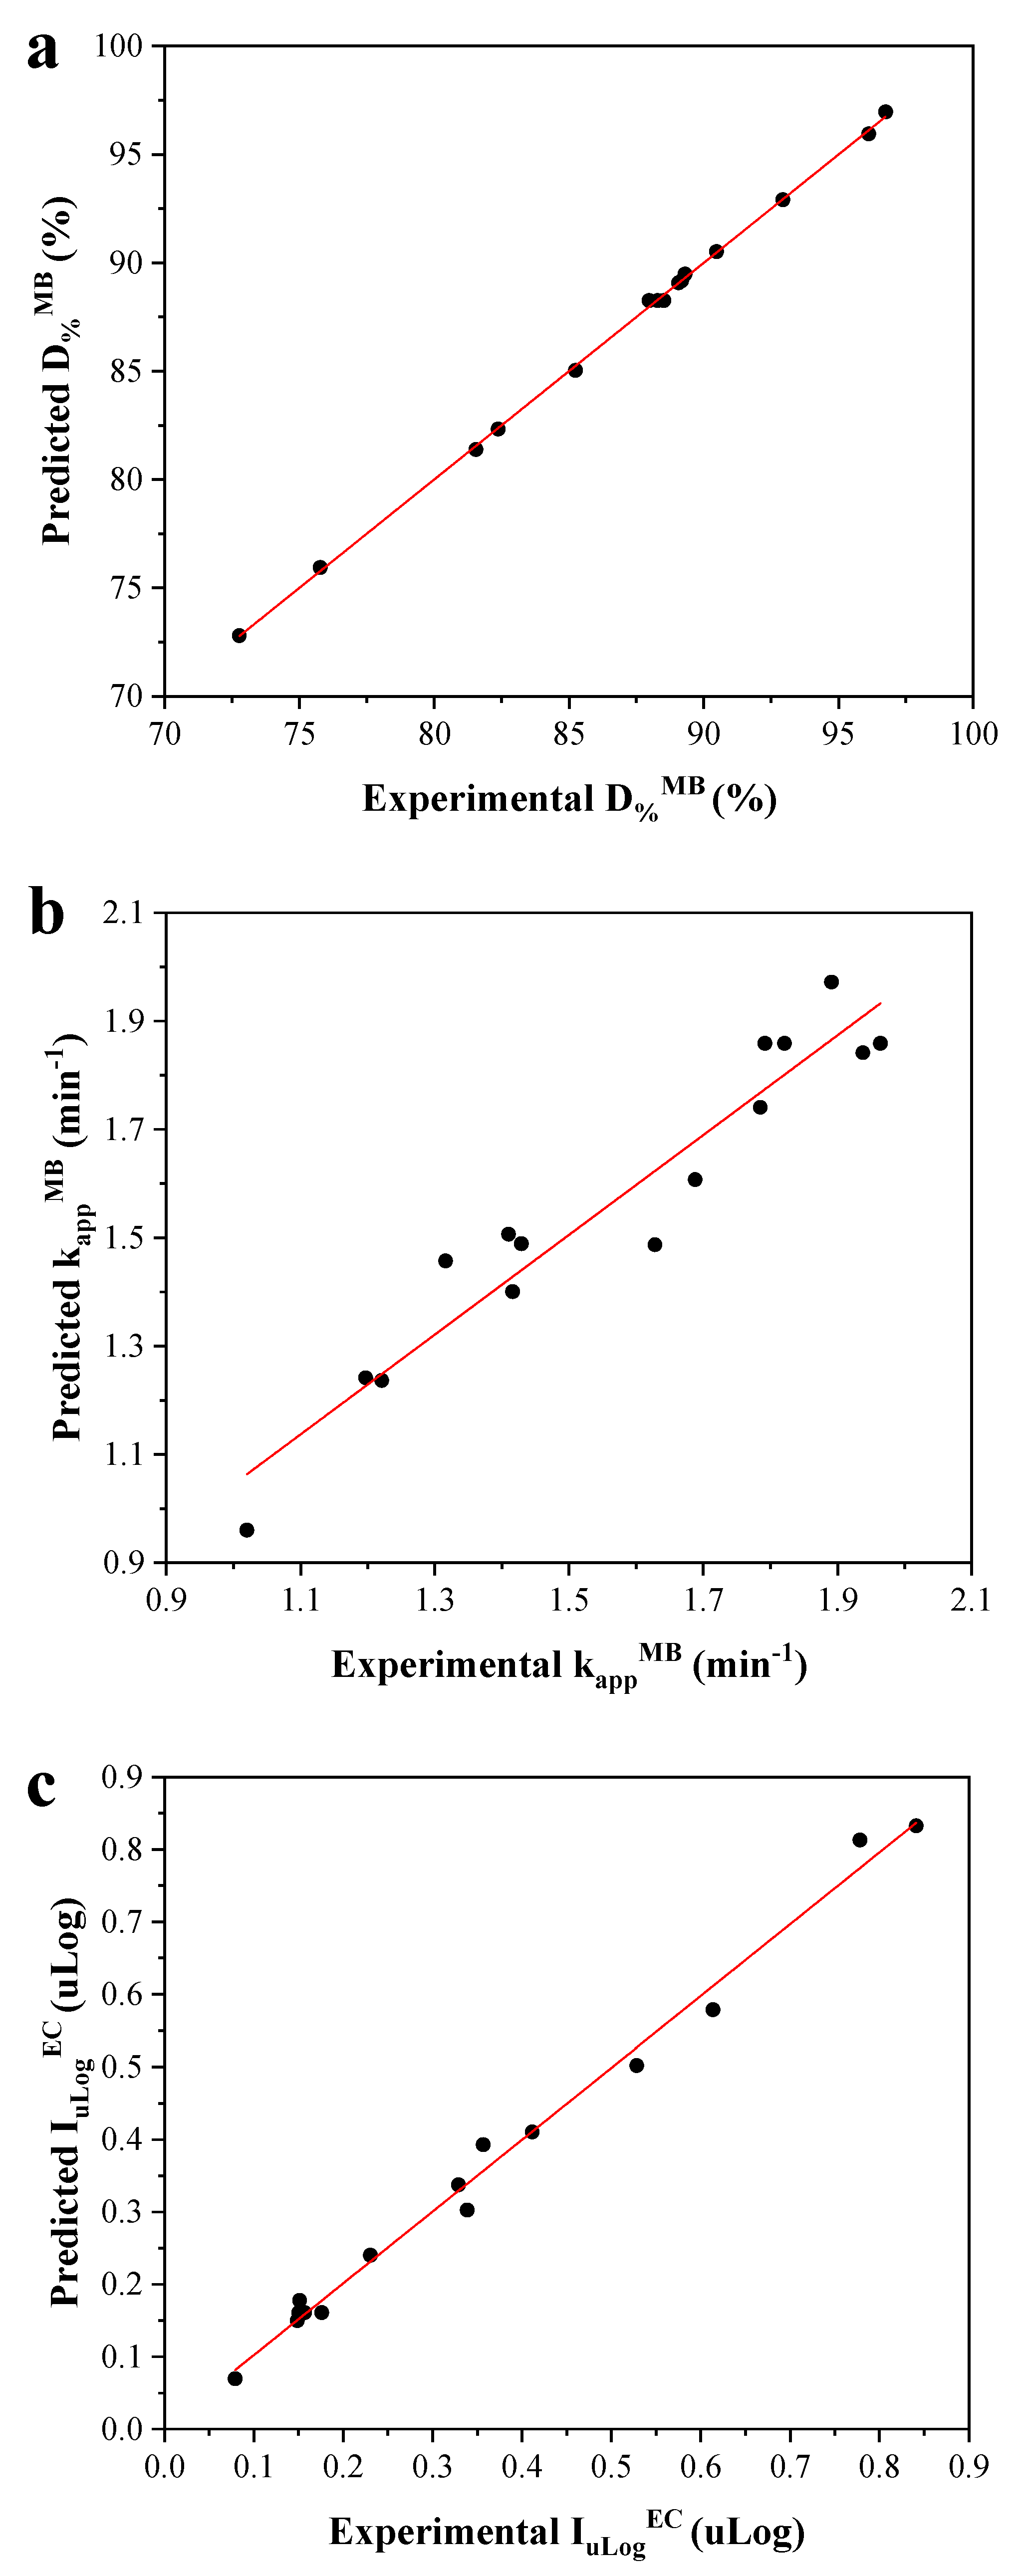
2.1. Models and Regression Analysis

Table 1 lists the factors and levels in the experimental design using the following variable: pH, Fe2+ concentration ([Fe2+], mol/L) and molar concentration ratio of Fe2+ and H2O2 ([H2O2]/[Fe2+]). Also, the experimental degree of MB decolorization (D%MB), the apparent rate constant of MB decolorization (kappMB) and the inactivation of E. coli K12 bacteria in logarithmic units (IuLogEC) are presented.
Using Design Expert software (version 10), experimental data in Table 1 were analyzed by a second-order linear polynomial regression model (Equation (7)).
η   =   γ 0 +   γ 1 A   +   γ 2 B   +   γ 3 C   +   γ 12 AB   +   γ 13 AC   +   γ 23 BC   +   γ 11 A 2 +   γ 22 B 2 +   γ 33 C 2
in which η is the dependent factor (response), γ0 is the intercept; A ([H2O2]/[Fe2+]), B ([Fe2+]) and C (pH) are the independent variables; γ1, γ2 and γ3 are the coefficients of the linear part of the predicted model; γ12, γ13 and γ23 are the interaction coefficients and γ11, γ22 and γ33 are the quadratic coefficients. Interaction and quadratic coefficients refer to the effects of the interaction among independent variables.
Analysis of variances (ANOVAs) and significant test results for the quadratic regression equations are shown in Table 2.
Table 2 listed the results of variance analysis for the MB decolorization and E. coli K12 removal using the Fenton process. The values of the sum of squares demonstrate the contribution of independent variables on responses [30]. The mean squares, which are the sums of squares divided by the degree of freedom. Adequacy of the model parameters in the present study for response variables (D%MB, kappMB and IuLogEC) was determined by the Fisher value (F-value), obtained by dividing the mean squares of each effect by the mean squares of error [31]. The probability critical level (p-value) of 0.05 was considered to reflect the statistical significance of the parameters of the proposed model. The F-values > 0.001 (975.81, 6.47 and 62.10) and p-values < 0.05 obtained for D%MB, kappMB and IuLogEC responses confirming the qualification of the model to predict the decolorization of MB (D%MB and kappMB) and the inactivation of E. coli K12 (IuLogEC) by the Fenton reaction. In addition, the validity of the model is confirmed by the p-value of the lack of fit with values greater than the lowest limit of fit as recommended (>0.05) [32]. As a result, the models developed in this work for predicting the D%MB, kappMB and IuLogEC by the Fenton process were considered adequate. These models can be described as shown in Table 3 with coded three factors.
The ANOVA results of three parameters (D%MB, kappMB and IuLogEC) showed that the significant (p < 0.05) response surface models with high R2 value (0.9210–0.9994) were obtained as shown in Table 3, ensuring a satisfactory adjustment of the quadratic models to the experimental data. The Radj2 values (0.7787–0.9984) obtained suggests that the three proposed models had an adequate predictive capacity. Even more, plots comparing the experimental and predicted values for D%MB, kappMB and IuLogEC indicated a good agreement between experimental and predicted data from the model (Figure 1). Therefore, this finding indicates high correlation and adequacy of the proposed model to predict performance of the Fenton process (D%MB, kappMB and IuLogEC).

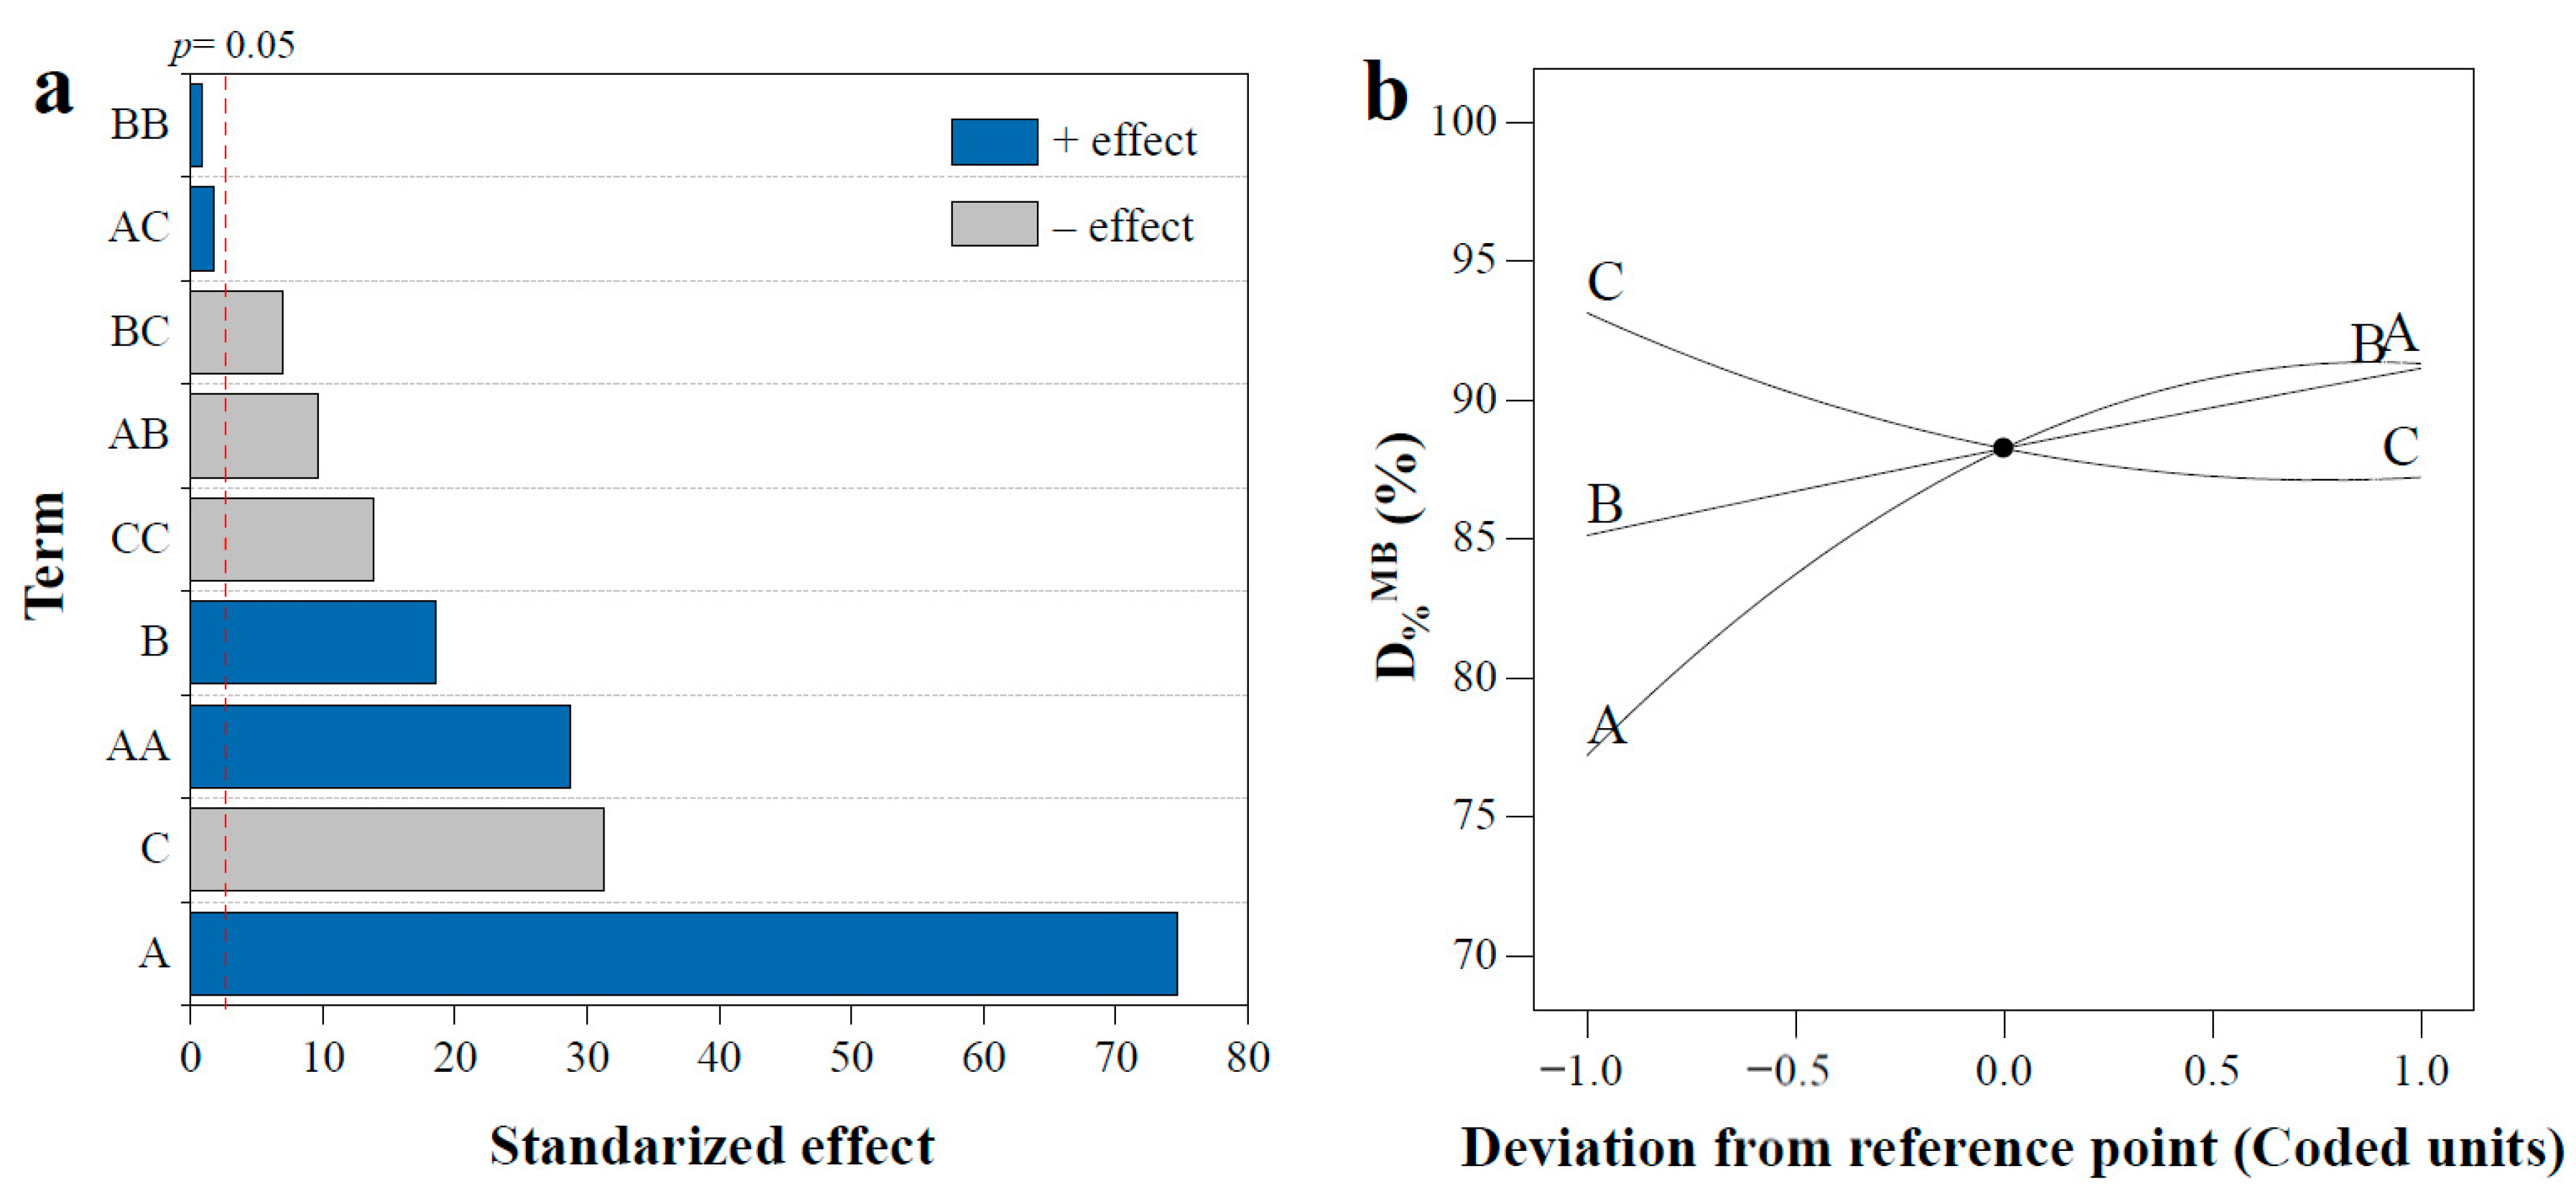
2.2. Effect of Variables on MB Decolorization (D%MB)

Figure 2a showed the standardized effects of the components and their contribution to the D%MB in a Pareto chart. The sign of standardized effects in Pareto chart, + (favorable effect) or − (unfavorable effect), along the length of the bars provided the physical meaning of model terms. In this Pareto chart, we saw that A, B, C, AB, BC, AA and CC crossed the reference line (p = 0.05). It is evident that the most important model term was A ([H2O2]/[Fe2+]), followed by linear terms B and C ([Fe2+] and pH respectively), quadratic terms corresponding to AA, etc. Thus, e.g., it can be concluded that larger A value, i.e., higher [H2O2]/[Fe2+] values, would result in an increase in the D%MB.
The perturbation plots (Figure 2b) illustrates the effect of all parameters on the D%MB. The positive effect means that if the effect factor level increases then the response value increases. On the other side, the negative effect means that if the effect factor level increases then the response value decreases. In other words, steep slope or curvature in a factor shows that the response is sensitive to that variable, while a relatively flat line indicates a low sensitivity of response to change with that particular variable. It was observed that the [H2O2]/[Fe2+] (A) and [Fe2+] values (B) had significant positive effects on D%MB, while the initial pH (C) had a negative effect on this response. Gulkaya, Surucu and Dilek [29] demonstrated that [H2O2/Fe2+] is a critical parameter for improving the Fenton technology as a treatment of a carpet dyeing wastewater. Otherwise, Babuponnusami and Muthukumar [33] and Chen, et al. [34] demonstrated the positive effect of [Fe2+] on the degradation of phenol and Acridine Orange by Fenton technologies. In both publications it was established that an increase in the [Fe2+] values leads to an increase in the percentage of degradation of phenol and Acridine Orange by the Fenton reaction, in line with what has been demonstrated in the present investigation. Regards to pH in a large part of the experiments carried out by Fenton technologies exhibit an optimal pH close to 3 [24,33,34]. In these research, at pH less or greater than 3 the efficiency of Fenton technology decreases, as observed in this publication.
The 3D surface and contour plots in Figure S1 show the individual effects of the process variables and their interactions on the D%MB. Optimum conditions determination of different variables is the main objective of the response surface methodology (RSM) study, which can affect the D%MB. By considering the predicted response, [H2O2]/[Fe2+] = 2.9, [Fe2+] = 1.0 × 10⁻³ mol/L and pH = 3.2 of Fenton process were the optimum condition for D%MB (94.57%).

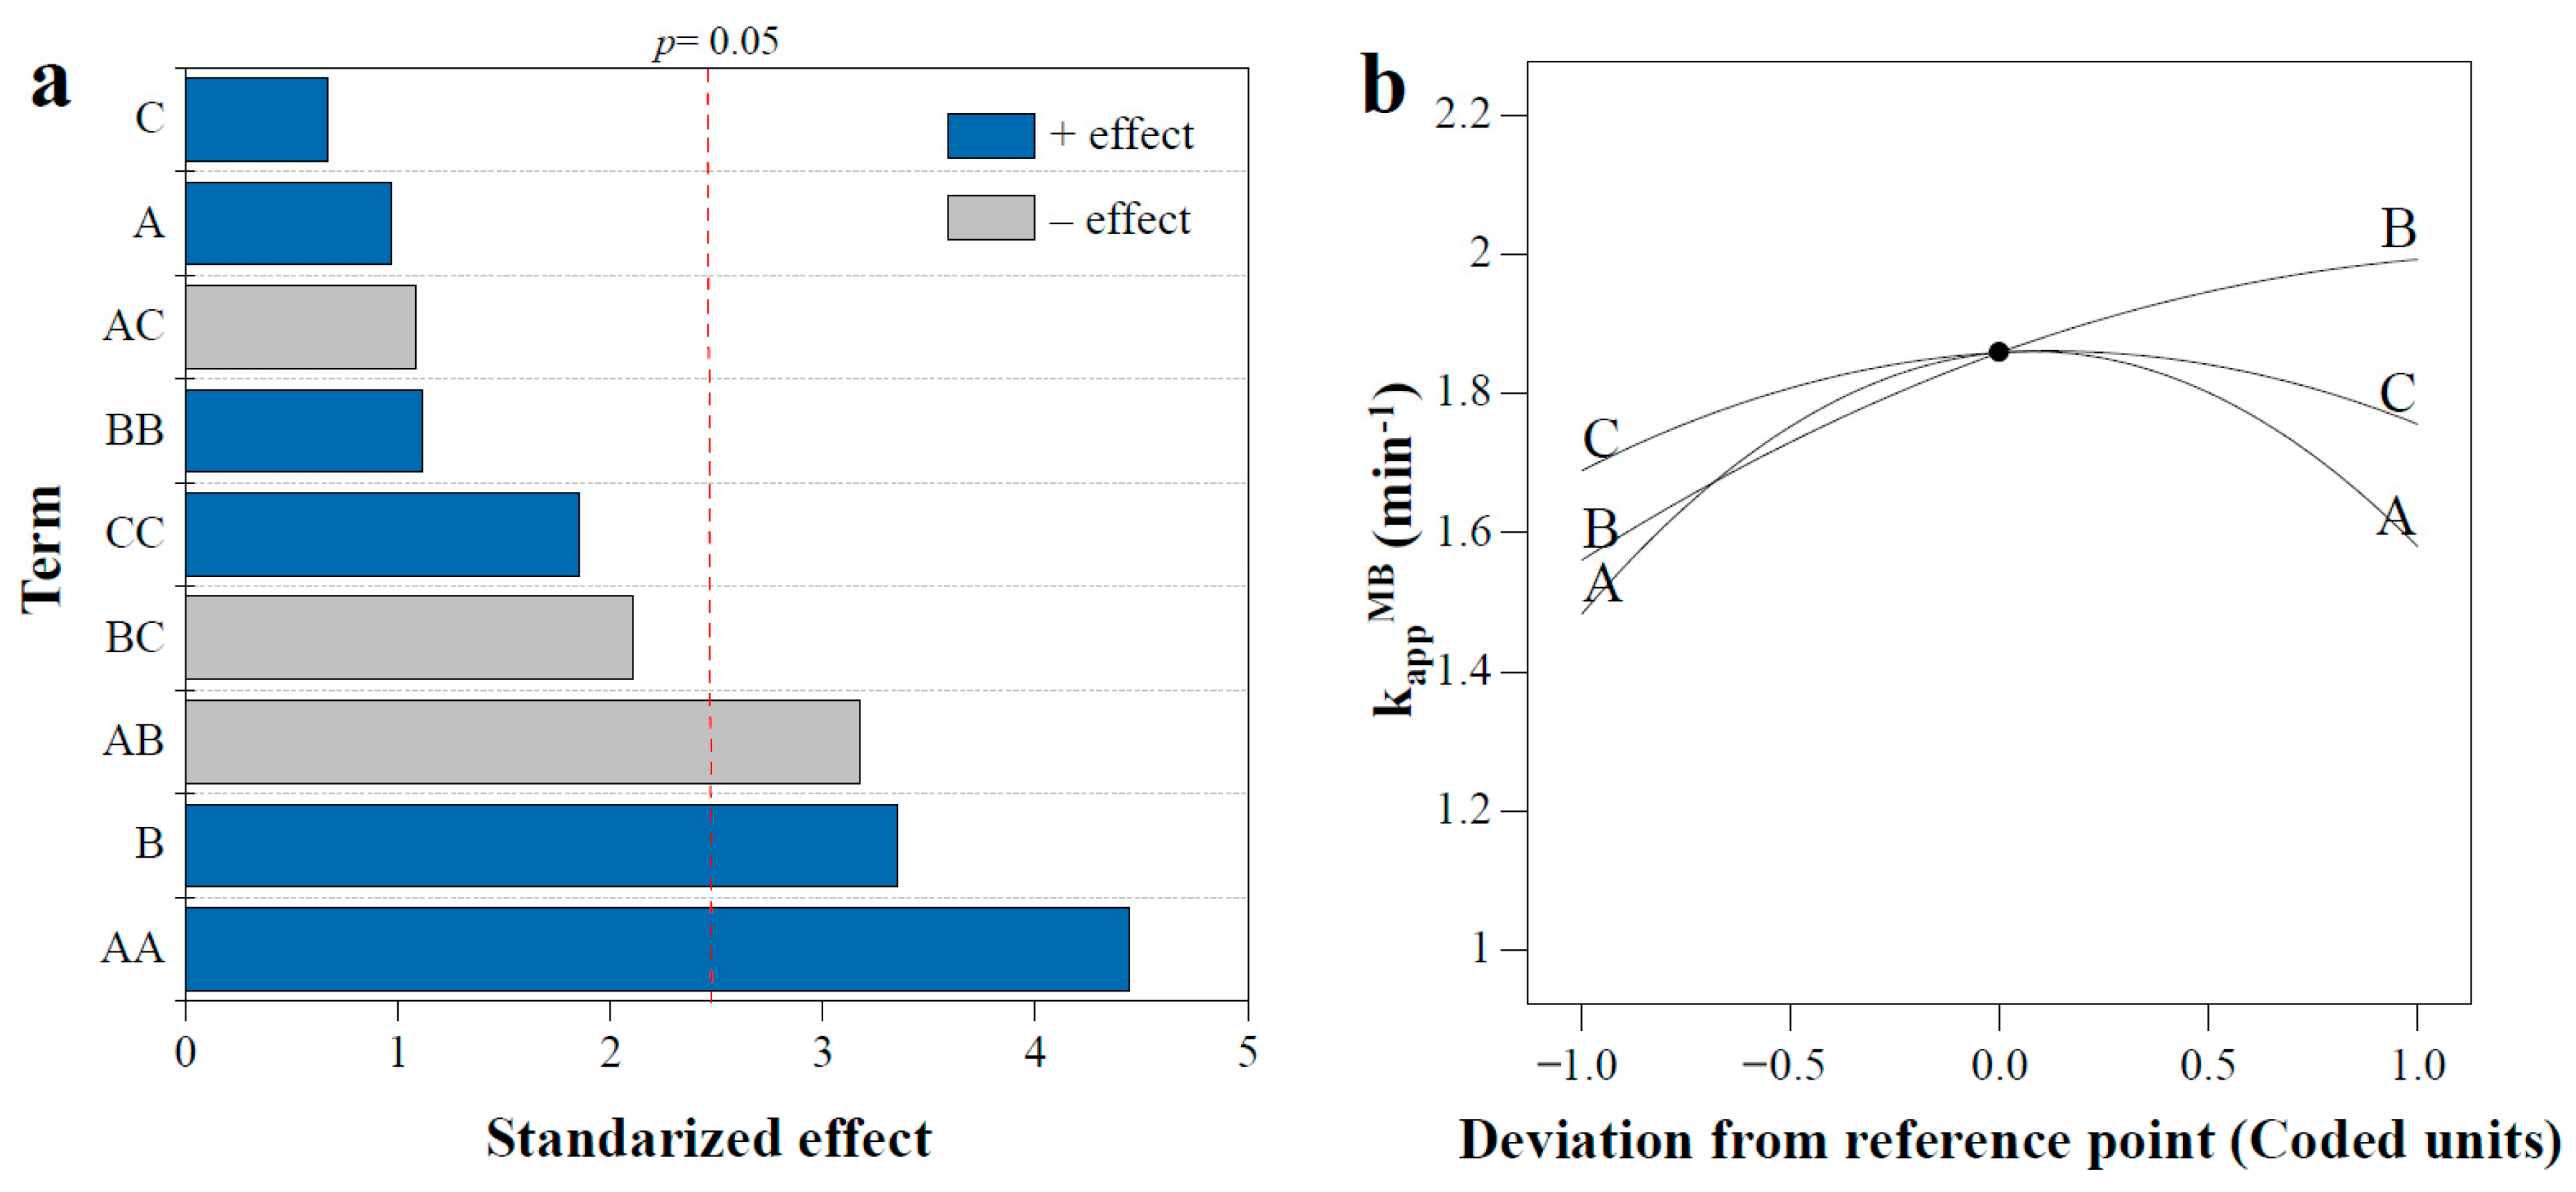
2.3. Effect of Variables on the MB Decolorization Rate Constant (kappMB)

Figure 3a shows the standardized effects of the components and their contribution to the kappMB in a Pareto chart. In this Pareto chart, we saw that B, AA and AB crossed the reference line (p = 0.05). It is evident that the most important model terms are AA and B, followed by interaction term AB ([H2O2]/[Fe2+] and [Fe2+] interaction). Thus, e.g., the AA term implies that kappMB were not influenced by [H2O2]/[Fe2+] in a linear level, but strongly influenced by this parameter in a quadratic level, i.e., a slight variation in [H2O2]/[Fe2+] will result in an increase in the kappMB.
Figure 3b shows the perturbation plot of the effect of the parameters on the kappMB. It was observed that the [Fe2+] values (B) had a significant positive effect on kappMB, while the [H2O2]/[Fe2+] (B) and pH (C) had an insignificant effect on the response. It has also been reported the main role of [Fe2+] on the rate constants of discoloration of other dyes. For example, Tunç, et al. [35] indicated that the rate constant of acid orange 8 decolorization increased almost 10 times (0.0027–0.0267 min−1) if [Fe2+] values change from 5.0 × 10⁻⁶ to 2.5 × 10⁻⁵ mol/L. In the same publication the rate constant of acid red 44 decolorization increased almost 4 times (0.0085–0.0331 min−1) if [Fe2+] values incremented from 2.5 × 10⁻⁶ to 2.5 × 10⁻⁵ mol/L. Melgoza, et al. [36] reported also that the decolorization rate constant of MB increased 2.5 times (0.0014–0.0035 min−1) if [Fe2+] values change from 1.0 × 10⁻³ to 2.0 × 10⁻³ mol/L.
Figure S2 show the individual effects of the process variables and their interactions on the kappMB in the 3D surface and contour plots. By considering the predicted response, [H2O2]/[Fe2+] = 1.7, [Fe2+] = 1.0 × 10⁻³ mol/L and pH = 3.7 of the Fenton process were the optimum condition providing kappMB (2.08 min−1).

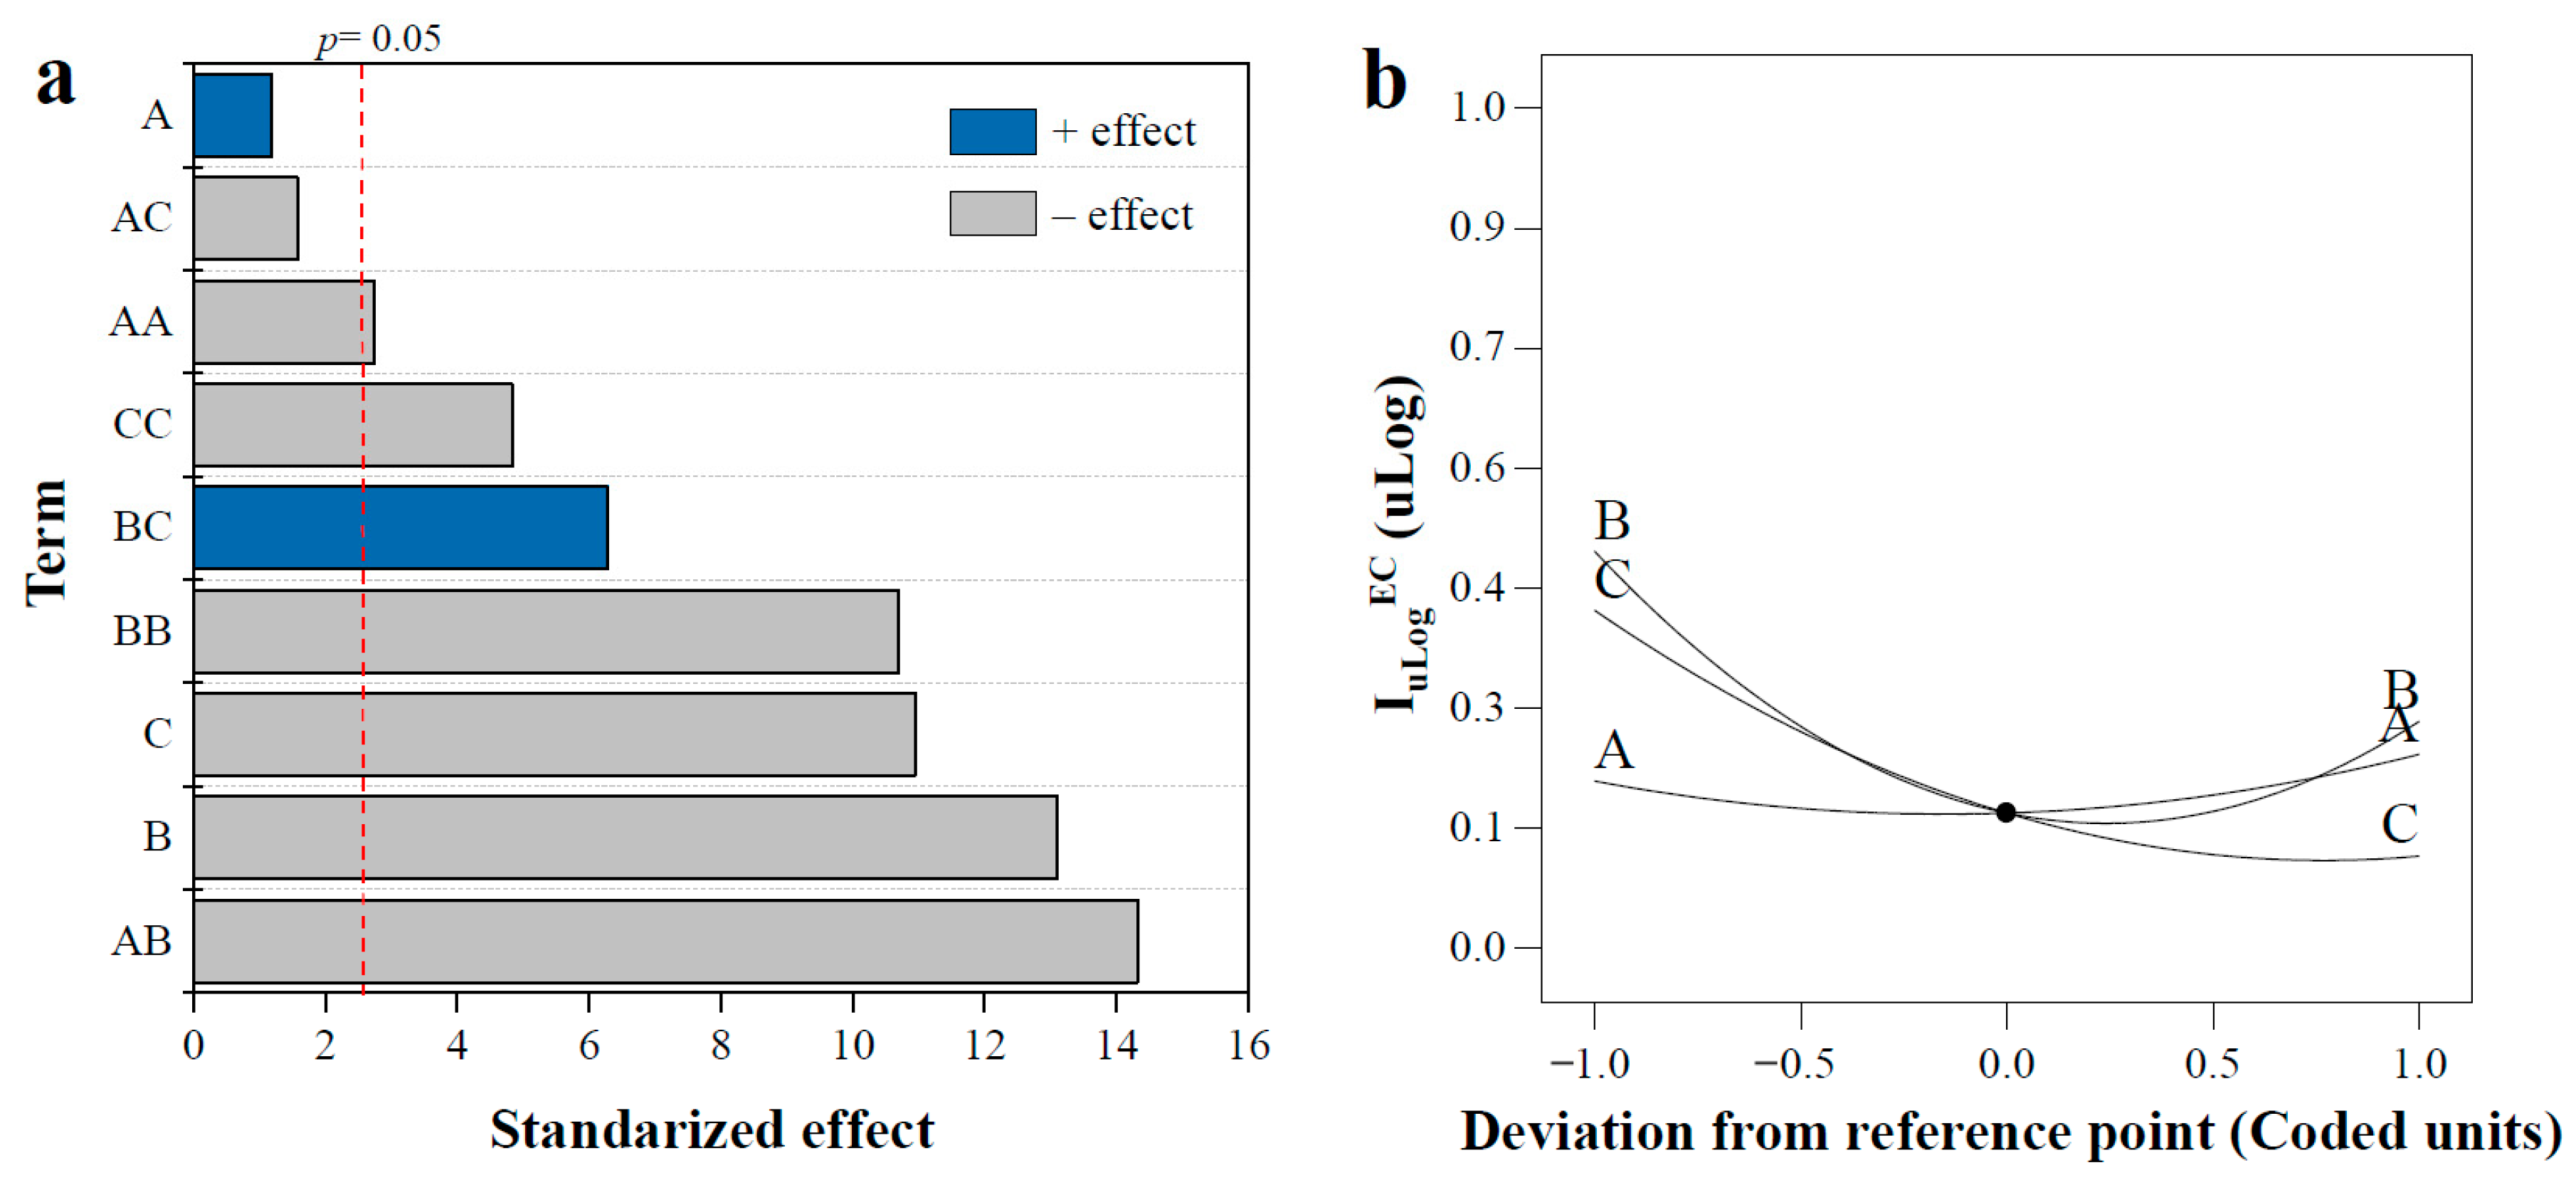
2.4. Effect of Variables on E. coli K12 Removal (IuLogEC)

Figure 4a showed the standardized effects of the components and their contribution to the IuLogEC in a Pareto chart. In this Pareto chart, we saw that B, C, AA, BB, CC, AB and BC crossed the reference line (p = 0.05). It is evident that the most important model terms was AB, followed by linear term C (pH) and quadratic term BB ([Fe2+]2). Thus, e.g., it can be concluded that smaller C value, i.e., lower pH values, would result in an increase in the IuLogEC.
The perturbation plots (Figure 4b) illustrates the effect of all parameters on the IuLogEC. It was observed that the [Fe2+] (B) and pH (A) values had a significant negative effects on IuLogEC, while the [H2O2]/[Fe2+] (C) values did not have a statistically significant effect on this response. Asad, et al. [37] also reported that the inactivation of E. coli was mostly affected by Fenton technologies if the [Fe2+] was low. This is evident when considering Equation (5), since at high [Fe2+] values the activity of the ·OH formed could be inhibited.
On the other hand, it is known that the ·OH production by Fenton technology is benefited at acidic pH close to 3. Some examples of Fenton technologies applied to the inactivation of a few bacteria are presented in Table 4. Although the experiments do not have the same conditions of [H2O2]/[Fe2+] and reaction time, it is possible to identify that at lower pH values and at lower values of [Fe2+] the bacterial elimination efficiencies tend to increase.
Figure S3 show the individual effects of the process variables and their interactions on the IuLogEC in the 3D surface and contour plots. By considering the predicted response, [H2O2]/[Fe2+] = 2.9, [Fe2+] = 7.6 × 10⁻⁴ mol/L and pH = 3.2 of the Fenton process were the optimum condition providing IuLogEC (0.89 uLog).

2.5. Analysis of Optimization and Model Validation

The optimal conditions obtained for MB decolorization and E. coli K12 inactivation are different for each of the responses studied. These results indicate that although some authors have suggested that it is possible to analyze the bacteria inactivation of AOP by extrapolating from dye decolorization [42], these processes have differences. The results in the present study (Table 1) show that if for example experiments #1 ([H2O2]/[Fe2+] = 1:1, [Fe2+] = 6.0 × 10⁻⁴ mol/L and pH = 4.0) and #10 ([H2O2]/[Fe2+] = 2:1, [Fe2+] = 1.0 × 10⁻³ mol/L and pH = 3.0) are compared, the MB decolorization reaches 72.8% and 96.7% respectively, while in the same experiments the E. coli K12 inactivation reaches 61.3% (0.412 uLog) and 33.4% (0.176 uLog), i.e., when the MB decolorization is high the E. coli K12 inactivation tends to be low, and vice versa. Similar compartments can be observed when comparing (Table 1), for example, experiments #3 ([H2O2]/[Fe2+] = 1:1, [Fe2+] = 1.0 × 10⁻³ mol/L and pH = 4.0) and #14 ([H2O2]/[Fe2+] = 2:1, [Fe2+] = 8.0 × 10⁻⁴ mol/L and pH = 4.0). These observations support what has been observed in other studies on the complexity involved in the bacteria inactivation compared to the recalcitrant compounds elimination [43].
To validate the model obtained by the Box–Behnken optimization technique, experiments were carried out with the suggested optimum values of independent variables. Table 5 shows the optimal conditions predicted by the models, the predicted response value and the response value obtained experimentally (Table 5).
The result obtained from experiments for all response parameters was in agreement with the model prediction. Low errors showed the model and parameters could accurately reflect on the three responses analyzed.

2.6. Effect of [H2O2]/[Fe2+] on Responses

The increasing of [H2O2]/[Fe2+] value (studied at molar ratio 1:1, 2:1 and 3:1) showed a significant positive effect only on the values of D%MB. Gulkaya, Surucu and Dilek [29] studied the treatment of wastewater from carpet dyes by Fenton technologies, also finding that [H2O2]/[Fe2+] plays a crucial role in the removal of dyes. Considering the above, it is possible to indicate that it is necessary to maintain a considerable concentration of H2O2, to ensure that the ·OH production is maintained for a longer time, obtaining a high efficiency in the discoloration of MB. However, the values of [H2O2]/[Fe2+] do not seem to significantly affect the kappMB and IuLogEC values.

2.7. Effect of [Fe2+] on Responses

Statistical analyses identified [Fe2+] as an important factor for the three types of responses studied (D%MB, kappMB and IuLogEC). For both the D%MB analysis and for kappMB the increasing of [Fe2+] value (studied at 6.0 × 10⁻⁴, 8.0 × 10⁻⁴ and 1.0 × 10⁻³ mol/L) exhibited a significant positive effect on these responses, while for the IuLogEC analysis this parameter showed a significant negative effect. In Equation (1) it is observed that the formation of ∙OH due to the oxidation of Fe2+ to Fe3+ in the presence of H2O2 will increase with a higher concentration of Fe2+. A single ∙OH attack on the MB structure leads to its decolorization (D%MB and kappMB), which seems to agree with the importance of [Fe2+] found in the present research. However, if the ·OH also had a preponderant role in the inactivation of E. coli K12, then the [Fe2+] values should not have a significant negative effect on the IuLogEC response. Some authors [44,45,46,47] suggest that although ∙OH oxidize most simple organic compounds (such as recalcitrant compounds), the inactivation of a bacterium (such as E. coli K12) is not directly affected by the production of these radicals. These researchers indicate that the formation of singlet oxygen (1O2) is responsible for the inactivation of bacteria. Consequently, the IuLogEC decreases with increasing values of [Fe2+], since excess Fe2+ could react with the ∙OH formed (Equation (5)), decreasing the possibility that the ·OH react to form 1O2 (Equations (3) and (4)).

2.8. Effect of pH on Responses

The pH value (studied at pH 3.0, 4.0 and 5.0) showed a significant effect on the D%MB and IuLogEC responses but did not show a significant effect on the kappMB response. The Fenton reaction (Fe2+ and H2O2), with a rate constant 76 L·mol−1s−1 [48], form ·OH quickly, consume Fe2+ and produce Fe3+. The Fenton-like reaction (Fe3+ and H2O2) has a much slower rate constant (0.01 L·mol−1s−1) than the Fenton reaction [48] and it only produces O2·, a much less reactive radical than ·OH. Additionally it has been established that the species of Fe(II) that prevails in the working pH range (3.0–5.0) is Fe2+ [49], while in the same pH range the speciation of Fe(III) demonstrates the formation of Fe(OH)2+ and Fe(OH)2+ species, species that are less reactive than Fe3+ [22]. Based on this information, it is expected that the rate of ·OH formation from the Fenton reaction, at least in the first minutes of reaction that directly influence the determination of kappMB, will not be greatly altered when changing system pH between 3.0 and 5.0. However, D%MB and IuLogEC, which are obtained in a final time of 15 min, will be influenced by both the Fenton reaction and the subsequent Fenton-like reaction. Considering this, the participation of the Fenton-like reaction implies that the pH and its effect on Fe(III) speciation have a greater influence on the D%MB and IuLogEC responses, as observed in this investigation.

3. Materials and Methods

3.1. Chemicals and Materials

Iron sulfate heptahydrate (FeSO4·7H2O), hydrogen peroxide (H2O2, 30%), sodium hydroxide (NaOH), hydrochloric acid (HCl), Luria Bertani (LB) medium and methylene blue (C16H18N3SCl·3H2O) were purchased from Merck S.A. (Santiago, Chile).

3.2. Fenton Experiments

Methylene blue, a dye that does not generate toxic byproducts when reacting with ·OH [50,51,52], was used as a model of recalcitrant compound, while E. coli K12, a non-pathogenic E. coli [53], was used as a model of bacteria. Experiments were performed in 20 mL glass reactors containing the MB solution (5.0 × 10⁻⁵ mol/L) or E. coli K12 (106 CFU), kept under magnetic stirring at room temperature (25 °C) [43,44]. First, FeSO4·7H2O solution was added to each sample according to the experimental design. The pH of each sample was adjusted by using NaOH (0.25 mol/L) or HCl (0.10 mol/L) solutions. Reactions were started by adding an aliquot of H2O2 solution. After the experimental time elapsed (15 min), for E. coli K12 analysis, 0.2 mL of each sample was collected for its enumeration. The decolorization of MB was studied by determining its kinetic constants of color decay and the degree of decolorization. After 2 min of maintaining the reaction under constant agitation, samples (3.0 mL) were withdrawn, and immediately injected into a cuvette for analysis at time intervals of 3, 6, 9, 12 and 15 min. The analyses in samples were performed spectrophotometrically by UV–Vis spectrophotometry (Shimadzu UV-1800, Shimadzu Inc., Kyoto, Japan) at 668 nm using quartz cells with path lengths of 1 cm. A calibration curve was constructed (5.30 × 10⁻⁷–1.30 × 10⁻⁵ mol/L; R2 = 0.999). Fitting decolorization kinetics and the rate constant was obtained by Sigma Plot 11.0 software (Systat Software, Inc., San Jose, CA, USA).

3.3. Detection and Enumeration of E. coli K12

Strain samples were stored in cryo-vials containing 20% glycerol at −20 °C. To prepare the bacterial pellet for the experiments, one colony was picked from the precultures and loop-inoculated into a 50 mL sterile PE eppendorf flask containing the Luria Bertani (LB) medium. The flask was then incubated aerobically at 37 °C and 150 rpm in a shaker incubator (Gerhardt THO500, Gerhardt GmbH & Co., Königswinter, Germany) until the stationary physiological phase was reached. After 24 h, cells were centrifuged (SIGMA 2-16P, Sigma Laborzentrifugen GmbH, Steinheim, Germany) and diluted until optical density 0.5 a.u. (i.e., 106 CFU/mL) at 600 nm [43,44]. Component of LB medium included sodium chloride (10 g), tryptone (10 g) and yeast extract (5 g) in 1 L of deionized water; this solution was then sterilized by autoclaving for 20 min at 121 °C. The bacterial pellet was resuspended and washed three times with a saline solution (NaCl/KCl). The final pellet was resuspended in saline solution. This procedure resulted in a cell density of approximately 109 colony forming units (CFU) per milliliter. The pH of the solution was adjusted to 7.0 and the solution was then sterilized by autoclaving for 30 min at 121 °C. The bacterial solution was diluted in reactors to the required cell density corresponding to 106 CFU/mL [43,44].
CFU were performed by plating on plates (PCA method). Of the samples 0.2 mL was withdrawn. Samples were diluted (10% v/v) and 0.1 mL poured on plates. Plates were aerobic incubated for 24 h at 37 °C (Heraeus B6, Kendro, Langenselbold, Germany) and the CFU were counted manually. All experiments were performed in triplicates. The enumeration of colonies was expressed as CFU (colony forming units) per 100 mL of sample. These concentrations were transformed to log10 and the removal of bacteria, uLog = log(Nt/N0), was calculated from the initial bacteria concentration (N0) and the remaining bacteria population at “t” time (Nt).

3.4. Experimental Design

To determine the optimal experimental conditions for the decolorization of MB and the inactivation of E. coli K12 by Fenton technology, a Box–Behnken design was performed. pH, Fe2+ concentration ([Fe2+], mol/L) and molar concentration ratio of Fe2+ and H2O2 ([H2O2]/[Fe2+]) were selected as independent variables in the experimental design (Table 6).
Three replicates were performed at the central point, with 15 runs performed for each study. The chosen levels of the independent variables were based on literature reports [54]. The experimental responses were the degree of MB decolorization (D%MB), the apparent kinetic constant of MB decolorization (kappMB), and removal of bacteria in uLog units (IuLogEC) for variables showed in Table 6.
A second-order linear polynomial regression model (Equation (7)) was obtained to analyze the data. Data were statistically evaluated and an analysis of variance (ANOVA) was applied at with a confidence level of 95% using software Design Expert version 10 (Stat-Ease Inc., Minneapolis, MN, USA). Responses of the experimental tests were compared to the estimated values, and the fit of model was assessed. Experimental tests, performed under optimal conditions, were performed to achieve maximal D%MB, kappMB and IuLogEC.

4. Conclusions

The present study provided a comprehensive description regarding the application of the Fenton technology as a process for MB decolorization and E. coli K12 inactivation in aqueous solutions at different [H2O2]/[Fe2+] values (1.0, 2.0 and 3.0), [Fe2+] values (6.0 × 10⁻⁴, 8.0 × 10⁻⁴ and 1.0 × 10⁻³ mol/L) and pH values (3.0, 4.0 and 5.0) up to 15 min of reaction. It was found that the Box–Behnken model could effectively predict and optimize the performance of Fenton technology for MB decolorization and E. coli K12 inactivation.
The maximum D%MB of 94.57% was predicted at [H2O2]/[Fe2+] = 2.9, [Fe2+] = 1.0 × 10⁻³ mol/L and pH = 3.2; for kappMB the maximum of 2.08 min−1 was predicted at [H2O2]/[Fe2+] = 1.7, [Fe2+] = 1.0 × 10⁻³ mol/L and pH = 3.7 and the maximum IuLogEC of 0.89 uLog was predicted at [H2O2]/[Fe2+] = 2.9, [Fe2+] = 7.6 × 10⁻⁴ mol/L and pH = 3.2. This analysis revealed good agreement between experimental results and the RSM predictions, further illustrating that RSM is a suitable approach to optimize the MB decolorization and E. coli K12 inactivation.
The Pareto and perturbation analysis of the model terms showed that all parameters analyzed have different effects on the responses. The [H2O2]/[Fe2+] values show a significant positive effect only on D%MB. The pH values show a significant negative effect on D%MB and IuLogEC, which could involve the main role of speciation of Fe(II) and Fe(III) species in the total process of MB decolorization and E. coli K12 inactivation by Fenton technology. The positive and negative significant effect of the [Fe2+] values on the MB decolorization (D%MB and kappMB) and E. coli K12 inactivation (IuLogEC) respectively, suggest that different oxidizing species are involved in these processes.
Thus, considering that bacteria are larger than dye molecules, the complex self-repair mechanisms of bacteria and the different external structures of bacteria compared to the dyes structure, the E. coli inactivation proved to be less effective than MB decolorization by Fenton processes.

Supplementary Materials

The following are available online at https://www.mdpi.com/2073-4344/10/12/1483/s1, Figure S1: Three-dimensional response surface plots (a, c and e) and their corresponding contour plots (b, d and f) representing de modeled D%MB as a function of: [H2O2]/[Fe2+] and [Fe2+] (a, b), pH and [H2O2]/[Fe2+] (c, d), [Fe2+] and pH (e, f) at central point values of other parameters, Figure S2: Three-dimensional response surface plots (a, c and e) and their corresponding contour plots (b, d and f) representing de modeled kappMB as a function of: [H2O2]/[Fe2+] and [Fe2+] (a, b), pH and [H2O2]/[Fe2+] (c, d), [Fe2+] and pH (e, f) at central point values of other parameters, Figure S3: Three-dimensional response surface plots (a, c and e) and their corresponding contour plots (b, d and f) representing de modeled IulogEC as a function of: [H2O2]/[Fe2+] and [Fe2+] (a, b), pH and [H2O2]/[Fe2+] (c, d), [Fe2+] and pH (e, f) at central point values of other parameters.

Author Contributions

Conceptualization, P.S. and G.V.; methodology, P.S. and G.V.; software, P.S. and J.L.F.; validation, P.S. and J.L.F.; formal analysis, P.S. and G.V.; investigation, J.L.F.; writing—original draft preparation, P.S. and G.V.; writing—review and editing, P.S. and G.V.; supervision, G.V.; project administration, G.V.; funding acquisition, P.S. and G.V. All authors have read and agreed to the published version of the manuscript.

Funding

This research was funded by ANID/FONDAP/15130015 and ANID FONDECYT/Postdoctorado 3180566.

Acknowledgments

José Luis Frontela thanks ERASMUS mobility program.

Conflicts of Interest

The authors declare no conflict of interest.

References

  1. Lizama, C.; Freer, J.; Baeza, J.; Mansilla, H.D. Optimized photodegradation of Reactive Blue 19 on TiO2 and ZnO suspensions. Catal. Today 2002, 76, 235–246. [Google Scholar] [CrossRef]
  2. Vidal, G.; Videla, S.; Diez, M.C. Molecular weight distribution of Pinus radiata kraft mill wastewater treated by anaerobic digestion. Bioresour. Technol. 2001, 77, 183–191. [Google Scholar] [CrossRef]
  3. Yeber, M.C.; Oñate, K.P.; Vidal, G. Decolorization of Kraft Bleaching Effluent by Advanced Oxidation Processes Using Copper (II) as Electron Acceptor. Environ. Sci. Technol. 2007, 41, 2510–2514. [Google Scholar] [CrossRef] [PubMed]
  4. Chamorro, S.; Hernández, V.; Monsalvez, E.; Becerra, J.; Mondaca, M.A.; Piña, B.; Vidal, G. Detection of Estrogenic Activity from Kraft Mill Effluents by the Yeast Estrogen Screen. Bull. Environ. Contam. Toxicol. 2010, 84, 165–169. [Google Scholar] [CrossRef] [PubMed]
  5. Chamorro, S.; Hernández, V.; Matamoros, V.; Domínguez, C.; Becerra, J.; Vidal, G.; Piña, B.; Bayona, J.M. Chemical characterization of organic microcontaminant sources and biological effects in riverine sediments impacted by urban sewage and pulp mill discharges. Chemosphere 2013, 90, 611–619. [Google Scholar] [CrossRef]
  6. Chamorro, S.; Monsalvez, E.; Piña, B.; Olivares, A.; Hernández, V.; Becerra, J.; Vidal, G. Analysis of aryl hydrocarbon receptor ligands in kraft mill effluents by a combination of yeast bioassays and CG-MS chemical determinations. J. Environ. Sci. Health A 2013, 48, 145–151. [Google Scholar] [CrossRef]
  7. Orrego, R.; Guchardi, J.; Hernandez, V.; Krause, R.; Roti, L.; Armour, J.; Ganeshakumar, M.; Holdway, D. Pulp and paper mill effluent treatments have differential endocrine-disrupting effects on rainbow trout. Environ. Toxicol. Chem. 2009, 28, 181–188. [Google Scholar] [CrossRef]
  8. Singh, A.K.; Chandra, R. Pollutants released from the pulp paper industry: Aquatic toxicity and their health hazards. Aquatic Toxicol. 2019, 211, 202–216. [Google Scholar] [CrossRef]
  9. Xavier, C.; Chamorro, S.; Vidal, G. Chronic Effects of Kraft Mill Effluents and Endocrine Active Chemicals on Daphnia magna. Bull. Environ. Contam. Toxicol. 2005, 75, 670–676. [Google Scholar] [CrossRef]
  10. Wang, Y.; Zhu, G.; Yang, Z. Analysis of water quality characteristic for water distribution systems. J. Water Reuse Desalinat. 2018, 9, 152–162. [Google Scholar] [CrossRef]
  11. Kulkarni, P.; Olson, N.D.; Paulson, J.N.; Pop, M.; Maddox, C.; Claye, E.; Rosenberg Goldstein, R.E.; Sharma, M.; Gibbs, S.G.; Mongodin, E.F.; et al. Conventional wastewater treatment and reuse site practices modify bacterial community structure but do not eliminate some opportunistic pathogens in reclaimed water. Sci. Total Environ. 2018, 639, 1126–1137. [Google Scholar] [CrossRef] [PubMed]
  12. Pantelaki, I.; Voutsa, D. Formation of iodinated THMs during chlorination of water and wastewater in the presence of different iodine sources. Sci. Total Environ. 2018, 613–614, 389–397. [Google Scholar] [CrossRef] [PubMed]
  13. Tawabini, B.; Al-Mutair, M.; Bukhari, A. Formation potential of trihalomethanes (THMs) in blended water treated with chlorine. J. Water Reuse Desalinat. 2011, 1, 172–178. [Google Scholar] [CrossRef]
  14. Selvabharathi, G.; Adishkumar, S.; Jenefa, S.; Ginni, G.; Rajesh Banu, J.; Tae Yeom, I. Combined homogeneous and heterogeneous advanced oxidation process for the treatment of tannery wastewaters. J. Water Reuse Desalinat. 2015, 6, 59–71. [Google Scholar] [CrossRef] [Green Version]
  15. Gandhi, K.; Lari, S.; Tripathi, D.; Kanade, G. Advanced oxidation processes for the treatment of chlorpyrifos, dimethoate and phorate in aqueous solution. J. Water Reuse Desalinat. 2015, 6, 195–203. [Google Scholar] [CrossRef] [Green Version]
  16. Yeber, M.C.; Soto, C.; Riveros, R.; Navarrete, J.; Vidal, G. Optimization by factorial design of copper (II) and toxicity removal using a photocatalytic process with TiO2 as semiconductor. Chem. Eng. J. 2009, 152, 14–19. [Google Scholar] [CrossRef]
  17. Wang, J.; Li, C.; Zhuang, H.; Zhang, J. Photocatalytic degradation of methylene blue and inactivation of Gram-negative bacteria by TiO2 nanoparticles in aqueous suspension. Food Control 2013, 34, 372–377. [Google Scholar] [CrossRef]
  18. Sirés, I.; Brillas, E.; Oturan, M.A.; Rodrigo, M.A.; Panizza, M. Electrochemical advanced oxidation processes: Today and tomorrow. A review. Environ. Sci. Pollut. Res. 2014, 21, 8336–8367. [Google Scholar] [CrossRef]
  19. Miklos, D.B.; Remy, C.; Jekel, M.; Linden, K.G.; Drewes, J.E.; Hübner, U. Evaluation of advanced oxidation processes for water and wastewater treatment—A critical review. Water Res. 2018, 139, 118–131. [Google Scholar] [CrossRef]
  20. Andreozzi, R.; Caprio, V.; Insola, A.; Marotta, R. Advanced oxidation processes (AOP) for water purification and recovery. Catal. Today 1999, 53, 51–59. [Google Scholar] [CrossRef]
  21. Gao, M.; An, T.; Li, G.; Nie, X.; Yip, H.-Y.; Zhao, H.; Wong, P.-K. Genetic studies of the role of fatty acid and coenzyme A in photocatalytic inactivation of Escherichia coli. Water Res. 2012, 46, 3951–3957. [Google Scholar] [CrossRef] [PubMed]
  22. Salgado, P.; Melin, V.; Contreras, D.; Moreno, Y.; Mansilla, H.D. Fenton reaction driven by iron ligands. J. Chil. Chem. Soc. 2013, 58, 2096–2101. [Google Scholar] [CrossRef] [Green Version]
  23. Sawyer, D.T. The Chemistry and Activation of Dioxygen Species (O2, O2, and HOOH) in Biology. In Oxygen Complexes and Oxygen Activation by Transition Metals; Martell, A.E., Sawyer, D.T., Eds.; Springer: Boston, MA, USA, 1988; pp. 131–148. [Google Scholar] [CrossRef]
  24. Salgado, P.; Melin, V.; Albornoz, M.; Mansilla, H.; Vidal, G.; Contreras, D. Effects of pH and substituted 1,2-dihydroxybenzenes on the reaction pathway of Fenton-like systems. Appl. Catal. B Environ. 2018, 226, 93–102. [Google Scholar] [CrossRef]
  25. Lee, H.; Lee, H.-J.; Sedlak, D.L.; Lee, C. pH-Dependent reactivity of oxidants formed by iron and copper-catalyzed decomposition of hydrogen peroxide. Chemosphere 2013, 92, 652–658. [Google Scholar] [CrossRef]
  26. Bataineh, H.; Pestovsky, O.; Bakac, A. pH-induced mechanistic changeover from hydroxyl radicals to iron(iv) in the Fenton reaction. Chem. Sci. 2012, 3, 1594–1599. [Google Scholar] [CrossRef]
  27. Mansoorian, H.J.; Bazrafshan, E.; Yari, A.; Alizadeh, M. Removal of azo dyes from aqueous solution using Fenton and modified Fenton processes. Health Scope 2014, 3, 1–9. [Google Scholar] [CrossRef] [Green Version]
  28. Mohajeri, S.; Aziz, H.A.; Isa, M.H.; Bashir, M.J.K.; Mohajeri, L.; Adlan, M.N. Influence of Fenton reagent oxidation on mineralization and decolorization of municipal landfill leachate. J. Environ. Sci. Health A 2010, 45, 692–698. [Google Scholar] [CrossRef]
  29. Gulkaya, İ.; Surucu, G.A.; Dilek, F.B. Importance of H2O2/Fe2+ ratio in Fenton’s treatment of a carpet dyeing wastewater. J. Hazard. Mater. 2006, 136, 763–769. [Google Scholar] [CrossRef]
  30. Ahmadian-Kouchaksaraie, Z.; Niazmand, R.; Najafi, M.N. Optimization of the subcritical water extraction of phenolic antioxidants from Crocus sativus petals of saffron industry residues: Box-Behnken design and principal component analysis. Innov. Food Sci. Emerg. Technol. 2016, 36, 234–244. [Google Scholar] [CrossRef]
  31. Peydayesh, M.; Bagheri, M.; Mohammadi, T.; Bakhtiari, O. Fabrication optimization of polyethersulfone (PES)/polyvinylpyrrolidone (PVP) nanofiltration membranes using Box-Behnken RSM method. RSC Adv. 2017, 7, 24995–25008. [Google Scholar] [CrossRef] [Green Version]
  32. Al-Musawi, T.J.; Kamani, H.; Bazrafshan, E.; Panahi, A.H.; Silva, M.F.; Abi, G. Optimization the Effects of Physicochemical Parameters on the Degradation of Cephalexin in Sono-Fenton Reactor by Using Box-Behnken Response Surface Methodology. Catal. Lett. 2019, 149, 1186–1196. [Google Scholar] [CrossRef]
  33. Babuponnusami, A.; Muthukumar, K. Degradation of Phenol in Aqueous Solution by Fenton, Sono-Fenton and Sono-photo-Fenton Methods. Clean-Soil Air Water 2011, 39, 142–147. [Google Scholar] [CrossRef]
  34. Chen, C.-C.; Wu, R.-J.; Tzeng, Y.-Y.; Lu, C.-S. Chemical Oxidative Degradation of Acridine Orange Dye in Aqueous Solution by Fenton’s Reagent. J. Chin. Chem. Soc. 2009, 56, 1147–1155. [Google Scholar] [CrossRef]
  35. Tunç, S.; Duman, O.; Gürkan, T. Monitoring the Decolorization of Acid Orange 8 and Acid Red 44 from Aqueous Solution Using Fenton’s Reagents by Online Spectrophotometric Method: Effect of Operation Parameters and Kinetic Study. Ind. Eng. Chem. Res. 2013, 52, 1414–1425. [Google Scholar] [CrossRef]
  36. Melgoza, D.; Hernández-Ramírez, A.; Peralta-Hernández, J.M. Comparative efficiencies of the decolourisation of Methylene Blue using Fenton’s and photo-Fenton’s reactions. Photochem. Photobiol. Sci. 2009, 8, 596–599. [Google Scholar] [CrossRef]
  37. Asad, L.M.B.O.; Asad, N.R.; Silva, A.B.; de Almeida, C.E.B.; Leitão, A.C. Role of SOS and OxyR systems in the repair of Escherichia coli submitted to hydrogen peroxide under low iron conditions. Biochimie 1997, 79, 359–364. [Google Scholar] [CrossRef]
  38. Blanco, J.; Torrades, F.; De la Varga, M.; García-Montaño, J. Fenton and biological-Fenton coupled processes for textile wastewater treatment and reuse. Desalination 2012, 286, 394–399. [Google Scholar] [CrossRef]
  39. Ortega-Gómez, E.; Esteban García, B.; Ballesteros Martín, M.M.; Fernández Ibáñez, P.; Sánchez Pérez, J.A. Inactivation of Enterococcus faecalis in simulated wastewater treatment plant effluent by solar photo-Fenton at initial neutral pH. Catal. Today 2013, 209, 195–200. [Google Scholar] [CrossRef]
  40. Ahmad, S.I.; Iranzo, O.G. Treatment of post-burns bacterial infections by Fenton reagent, particularly the ubiquitous multiple drug resistant Pseudomonas spp. Med. Hypotheses 2003, 61, 431–434. [Google Scholar] [CrossRef]
  41. Cengiz, M.; Uslu, M.O.; Balcioglu, I. Treatment of E. coli HB101 and the tetM gene by Fenton’s reagent and ozone in cow manure. J. Environ. Manag. 2010, 91, 2590–2593. [Google Scholar] [CrossRef]
  42. Chen, F.; Yang, X.; Xu, F.; Wu, Q.; Zhang, Y. Correlation of Photocatalytic Bactericidal Effect and Organic Matter Degradation of TiO2 Part I: Observation of Phenomena. Environ. Sci. Technol. 2009, 43, 1180–1184. [Google Scholar] [CrossRef] [PubMed]
  43. Marugán, J.; van Grieken, R.; Pablos, C.; Sordo, C. Analogies and differences between photocatalytic oxidation of chemicals and photocatalytic inactivation of microorganisms. Water Res. 2010, 44, 789–796. [Google Scholar] [CrossRef] [PubMed]
  44. Fisher, M.B.; Keane, D.A.; Fernández-Ibáñez, P.; Colreavy, J.; Hinder, S.J.; McGuigan, K.G.; Pillai, S.C. Nitrogen and copper doped solar light active TiO2 photocatalysts for water decontamination. Appl. Catal. B Environ. 2013, 130–131, 8–13. [Google Scholar] [CrossRef] [Green Version]
  45. Rengifo-Herrera, J.A.; Pulgarin, C. Photocatalytic activity of N, S co-doped and N-doped commercial anatase TiO2 powders towards phenol oxidation and E. coli inactivation under simulated solar light irradiation. Sol. Energy 2010, 84, 37–43. [Google Scholar] [CrossRef]
  46. Keane, D.A.; McGuigan, K.G.; Ibáñez, P.F.; Polo-López, M.I.; Byrne, J.A.; Dunlop, P.S.M.; O’Shea, K.; Dionysiou, D.D.; Pillai, S.C. Solar photocatalysis for water disinfection: Materials and reactor design. Catal. Sci. Technol. 2014, 4, 1211–1226. [Google Scholar] [CrossRef] [Green Version]
  47. Luo, Y.; Han, Z.; Chin, S.M.; Linn, S. Three chemically distinct types of oxidants formed by iron-mediated Fenton reactions in the presence of DNA. Proc. Natl. Acad. Sci. USA 1994, 91, 12438–12442. [Google Scholar] [CrossRef] [Green Version]
  48. Salgado, P.; Melin, V.; Durán, Y.; Mansilla, H.; Contreras, D. The Reactivity and Reaction Pathway of Fenton Reactions Driven by Substituted 1,2-Dihydroxybenzenes. Environ. Sci. Technol. 2017, 51, 3687–3693. [Google Scholar] [CrossRef]
  49. Fischbacher, A.; von Sonntag, C.; Schmidt, T.C. Hydroxyl radical yields in the Fenton process under various pH, ligand concentrations and hydrogen peroxide/Fe(II) ratios. Chemosphere 2017, 182, 738–744. [Google Scholar] [CrossRef]
  50. Liu, Y.; Jin, W.; Zhao, Y.; Zhang, G.; Zhang, W. Enhanced catalytic degradation of methylene blue by α-Fe2O3/graphene oxide via heterogeneous photo-Fenton reactions. Appl. Catal. B Environ. 2017, 206, 642–652. [Google Scholar] [CrossRef]
  51. Su, S.; Liu, Y.; Liu, X.; Jin, W.; Zhao, Y. Transformation pathway and degradation mechanism of methylene blue through β-FeOOH@GO catalyzed photo-Fenton-like system. Chemosphere 2019, 218, 83–92. [Google Scholar] [CrossRef]
  52. Biswas, S.; Pal, A. Visible light assisted Fenton type degradation of methylene blue by admicelle anchored alumina supported rod shaped manganese oxide. J. Water Process Eng. 2020, 36, 101272. [Google Scholar] [CrossRef]
  53. Leech, J.; Golub, S.; Allan, W.; Simmons, M.J.H.; Overton, T.W. Non-pathogenic Escherichia coli biofilms: Effects of growth conditions and surface properties on structure and curli gene expression. Arch. Microbiol. 2020, 202, 1517–1527. [Google Scholar] [CrossRef] [PubMed] [Green Version]
  54. Gao, A.; Gao, H.; Zhu, Z.; Jiao, Z. Application of response surface methodology to optimize the treatment of cephems pharmaceutical wastewater by ultrasound/Fenton process. Desalinat. Water Treat. 2016, 57, 10866–10877. [Google Scholar] [CrossRef]
Figure 1. Correlations between the experimental and predicted values of (a) D%MB values, (b) kappMB values and (c) IuLogEC values.
Catalysts 10 01483 g001
Figure 2. (a) Pareto chart showing the standardized effects of variables (first order, quadratic and interaction terms) on D%MB (vertical line represents the 95% confidence interval), and (b) Perturbation graphs for D%MB (A-[H2O2]/[Fe2+], B-[Fe2+], C-pH).
Catalysts 10 01483 g002
Figure 3. (a) Pareto chart showing the standardized effects of variables (first order, quadratic and interaction terms) on kappMB (vertical line represents the 95% confidence interval), and (b) Perturbation graphs for kappMB (A-[H2O2]/[Fe2+], B-[Fe2+], C-pH).
Catalysts 10 01483 g003
Figure 4. (a) Pareto chart showing the standardized effects of variables (first order, quadratic and interaction terms) on IuLogEC (vertical line represents the 95% confidence interval), and (b) Perturbation graphs for IuLogEC (A-[H2O2]/[Fe2+], B-[Fe2+], C-pH).
Catalysts 10 01483 g004
Table 1. Actual values and coded levels (in parentheses) of the variables in the Box–Behnken design and experimental values for each response.
VariablesResponses (Experimental Results)
#[H2O2]/[Fe2+][Fe2+] (mol/L)pHD%MB (%)kappMB (min−1)IuLogEC (uLog)
11:1 (−1)6.0 × 10⁻⁴ (−1)4.0 (0)72.81.020.41
23:1 (+1)6.0 × 10⁻⁴ (−1)4.0 (0)89.31.410.84
31:1 (−1)1.0 × 10⁻³ (+1)4.0 (0)81.61.940.78
43:1 (+1)1.0 × 10⁻³ (+1)4.0 (0)92.91.430.23
51:1 (−1)8.0 × 10⁻⁴ (0)3.0 (−1)82.41.220.33
61:1 (−1)8.0 × 10⁻⁴ (0)5.0 (+1)96.11.630.15
73:1 (+1)8.0 × 10⁻⁴ (0)3.0 (−1)75.81.320.53
83:1 (+1)8.0 × 10⁻⁴ (0)5.0 (+1)90.51.420.34
92:1 (0)6.0 × 10⁻⁴ (−1)3.0 (−1)89.11.200.16
102:1 (0)1.0 × 10⁻³ (+1)3.0 (−1)96.71.890.18
112:1 (0)6.0 × 10⁻⁴ (−1)5.0 (+1)85.21.690.15
122:1 (0)1.0 × 10⁻³ (+1)5.0 (+1)89.21.780.61
132:1 (0)8.0 × 10⁻⁴ (0)4.0 (0)88.51.790.15
142:1 (0)8.0 × 10⁻⁴ (0)4.0 (0)88.01.960.079
152:1 (0)8.0 × 10⁻⁴ (0)4.0 (0)88.31.820.36
Table 2. ANOVA of the regression model for the prediction of degree of methylene blue (MB) decolorization, rate constant of MB decolorization and E. coli K12 inactivation.
SourceSum of
Squares
DfMean
Square
F-Valuep-ValueObservations
Degree of MB decolorization (D%MB)
Model627.24969.69975.81<0.0001significant
A-[H2O2]/[Fe2+]397.411397.415564.29<0.0001-
B-[Fe2+]72.17172.171010.43<0.0001-
C-pH69.91169.91978.81<0.0001-
AB6.6416.6492.990.0002-
AC0.2210.223.140.1365-
BC3.5213.5249.260.0009-
A258.93158.93825.15<0.0001-
B20.05510.0550.760.4223-
C213.62113.62190.72<0.0001-
Residual0.3650.071---
Lack of Fit0.2130.0690.920.5584not significant
Pure Error0.1520.075---
Cor Total627.6014----
Rate constant of MB decolorization (kappMB)
Model1.1790.136.470.0267significant
A-[H2O2]/[Fe2+]0.01910.0190.940.3768-
B-[Fe2+]0.3710.3718.640.0076-
C-pH8.98 × 10−318.98 × 10−30.450.5328-
AB0.2010.2010.090.0246-
AC0.02410.0241.180.3275-
BC0.08910.0894.450.0887-
A20.4010.4019.760.0067-
B20.02510.0251.250.3141-
C20.06910.0693.430.1232-
Residual0.1050.020---
Lack of Fit0.08330.0283.270.2430not significant
Pure Error0.01728.48 × 10−3---
Cor Total1.2714----
E. coli K12 inactivation in uLog units (IuLogEC)
Model0.8090.08962.100.0001significant
A-[H2O2]/[Fe2+]2.03 × 10−312.03 × 10−31.420.2870-
B-[Fe2+]0.08210.08257.420.0006-
C-pH0.1710.17119.790.0001-
AB0.2910.29205.03<0.0001-
AC3.57 × 10−313.57 × 10−32.500.1745-
BC0.05610.05639.450.0015-
A20.01110.0117.530.0406-
B20.1610.16114.390.0001-
C20.03310.03323.330.0048-
Residual7.14 × 10−351.43 × 10⁻³---
Lack of Fit6.78 × 10−332.26 × 10−312.540.0747not significant
Pure Error3.60 × 10−421.80 × 10⁻⁴---
Cor Total0.8114----
Df: degrees of freedom. Parameter “A” represents the [H2O2]/[Fe2+], “B” represents the [Fe2+] and “C” represent the pH. AC, AC, BC, A2, B2 and C2 represent the interactions of A, B and C parameters on the responses.
Table 3. Statistical results of the proposed models in terms of the coded factors.
ResponseProposed Quadratic ModelR2Radj2
D%MB 88.3 + 7.05 A + 3.00 B     2.96 C     1.29 AB + 0.24 AC     0.94 BC     4.00 A 2     0.12 B 2 + 1.92 C 2 0.99940.9984
kappMB 1.86 + 0.048 A + 0.22 B + 0.034 C     0.22 AB     0.077 AC     0.15 BC     0.33 A 2   0.082 B 2   0.14 C 2 0.92100.7787
IuLogEC 0.20     0.061 A + 0.030 B + 0.10 C     0.24 AB     0.003 AC + 0.11 BC + 0.22 A 2 + 0.15 B 2     0.075 C 2 0.99110.9752
Table 4. Examples of Fenton technologies applied to the bacteria inactivation.
[Fe2+] (mol/L)[H2O2]/[Fe2+]pHTime (min)BacteriaReduction (uLog)Ref.
7.8 × 10−462.23.0300E. coli2.12Blanco, et al. [38]
7.2 × 10−520.43.5100E. faecalis1.0Ortega-Gómez, et al. [39]
1.0 × 10−3207.025E. coli0.108Ahmad and Iranzo [40]
5.0 × 10−3108.51440E. coli0.36Cengiz, et al. [41]
Table 5. Results of validation experiments under optimized conditions.
Conditions[H2O2]/[Fe2+][Fe2+] (mol/L)pH Experimental ValuePredicted ValueError
D%MB2.91.0 × 10−33.294.5797.12−2.55
kappMB1.71.0 × 10−33.72.082.020.06
IuLogEC2.97.6 × 10−43.20.890.92−0.03
Table 6. Independent variables and levels used in the Box–Behnken design for Fenton technology.
VariableCoded Factor Level
Coded−101
[H2O2]/[Fe2+] (A)X11:12:13:1
[Fe2+] (mol/L) (B)X26.0 × 10−48.0 × 10−41.0 × 10−3
pH (C)X33.04.05.0
Publisher’s Note: MDPI stays neutral with regard to jurisdictional claims in published maps and institutional affiliations.

