Article

Enhancement of Ni Catalyst Using CeO2–Al2O3 Support Prepared with Magnetic Inducement for ESR

by
Pumiwat Vacharapong
1,
Sirintra Arayawate
1,
Sasimas Katanyutanon
1,
Pisanu Toochinda
1,*,
Luckhana Lawtrakul
1,* and
Sumittra Charojrochkul
2
1
School of Bio-Chemical Engineering and Technology (BCET), Sirindhorn International Institute of Technology (SIIT), Thammasat University, Pathum Thani 12120, Thailand
2
National Energy Technology Center (ENTEC), National Science and Technology Development Agency (NSTDA), Pathum Thani 12120, Thailand
*
Authors to whom correspondence should be addressed.
Catalysts 2020, 10(11), 1357; https://doi.org/10.3390/catal10111357
Submission received: 4 November 2020 / Revised: 19 November 2020 / Accepted: 19 November 2020 / Published: 21 November 2020

Abstract

:
The effect of magnetic inducement in support preparation was studied to reduce coke and improve the activity of Ni catalysts for ethanol steam reforming (ESR) at 550–650 °C. Magnetic inducement was introduced to prepare 5 mol % CeO2 in Al2O3 support in order to control the composition and the distribution of Ce in Al2O3. The results show that using CeO2–Al2O3 support with magnetic inducement affects both hydrogen production and coke reduction, where Ni/CeO2–Al2O3 support prepared under magnetic inducement with N–N pole arrangement (Ni/CeO2–Al2O3 (N–N)) exhibited the highest hydrogen production and the lowest coke formation among the catalysts used in this work. Compared with Ni/CeO2–Al2O3 (no magnet), Ni/CeO2–Al2O3 (N–N) catalysts yield 14.0% higher H2 production and 31.7% less coke production. The modified catalyst preparation process used in this study could create catalysts for hydrogen production from ESR which are high in performance and stability but low in preparation cost.

Graphical Abstract

1. Introduction

Ethanol steam reforming (ESR) is one of the reforming reactions of hydrocarbon to produce H2, which is considered as a renewable energy source due to ethanol production from biomass fermentation. ESR pathways comprise many reaction routes [1]. However, the most preferable is the main reaction which yields up to six moles of H2 per mole of ethanol, as shown in Equation (1).
CH3CH2OH + 3H2O → 6H2 + 2CO2  ∆H298 = +174 kJ mol1
Coking is a long-term catalyst deactivation due to carbon deposition overactive metal sites during a reaction which commonly occurs in hydrocarbon reforming [2,3,4,5]. An appropriate catalyst for ESR promotes the main reaction over the side reactions that produce CO, which is a coke precursor. The best catalysts for ESR reported in the literature are Rh-based catalysts which are active at 600 °C with low coking [6,7,8]. However, the high cost and the low availability of Rh exponentially increases the cost of H2 production from ESR. In order to reduce the cost, investigations of other metals to replace Rh are widely studied. The literature reports that among non-noble metal catalysts (Cu, Zn, Co, Ni), Ni exhibits the highest activity for ESR [6,9]. However, Ni-based catalysts can suffer from deactivation due to coking at reaction temperatures as low as 500 °C at certain reaction conditions [10]. Additional cost is required to remove the coke and reactivate the catalysts via calcination with air and reduction with H2, respectively. Therefore, coking is the main drawback of Ni catalysts to serve as a substitution of Rh catalysts for ESR at low temperatures. The development of Ni catalysts that are active at low operating temperature and exhibit low coke formation is required. An approach to solve this problem is to increase Ni dispersion on the catalyst and investigate the support to reduce coke formation for ESR at low temperature.
Ceria has been reported as a support that can reduce the coke formation for reforming of hydrocarbons due to its high oxygen storage capacity [11,12,13,14,15,16]. Oxygen storage capacity of CeO2 is essential in retaining oxygen gas (O2) which is used to remove the carbon residue on the metal active sites [17,18]. However, the cost of CeO2 is particularly high to use solely as the support, and the low surface area of CeO2 is also not suitable for serving as a support for heterogeneous catalysts. Therefore, partial doping of CeO2 to Al2O3 should yield a support with high surface area with the benefit of coke reduction property. Doping CeO2 into Al2O3 also results in the creation of an oxygen vacancies. Oxygen vacancies can serve as nucleation sites for metal clusters [19]. Therefore, dispersion of CeO2 on Al2O3 framework surface should affect Ni dispersion on the support.
The literature reported that applying an external magnetic field to a dilute solution can cause ions to move differently during gelation process [20]. Therefore, magnetic inducement is introduced in an attempt to control the composition and the distribution of Ce in Al2O3 framework during the sol-gel process in order to improve the homogeneity of the dopant in the support framework. This work aimed to increase the activity of Ni catalysts at low temperatures and reduce coking, which was accomplished by support modification of CeO2 partial doping into an Al2O3 framework with magnetic inducement. This support modification provides an attractive development of a low-cost Ni catalyst which is active at low temperature and able to reduce coking for H2 production from ESR.

2. Results

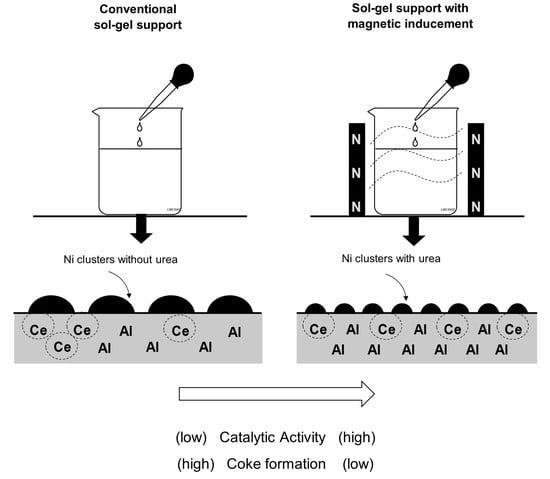
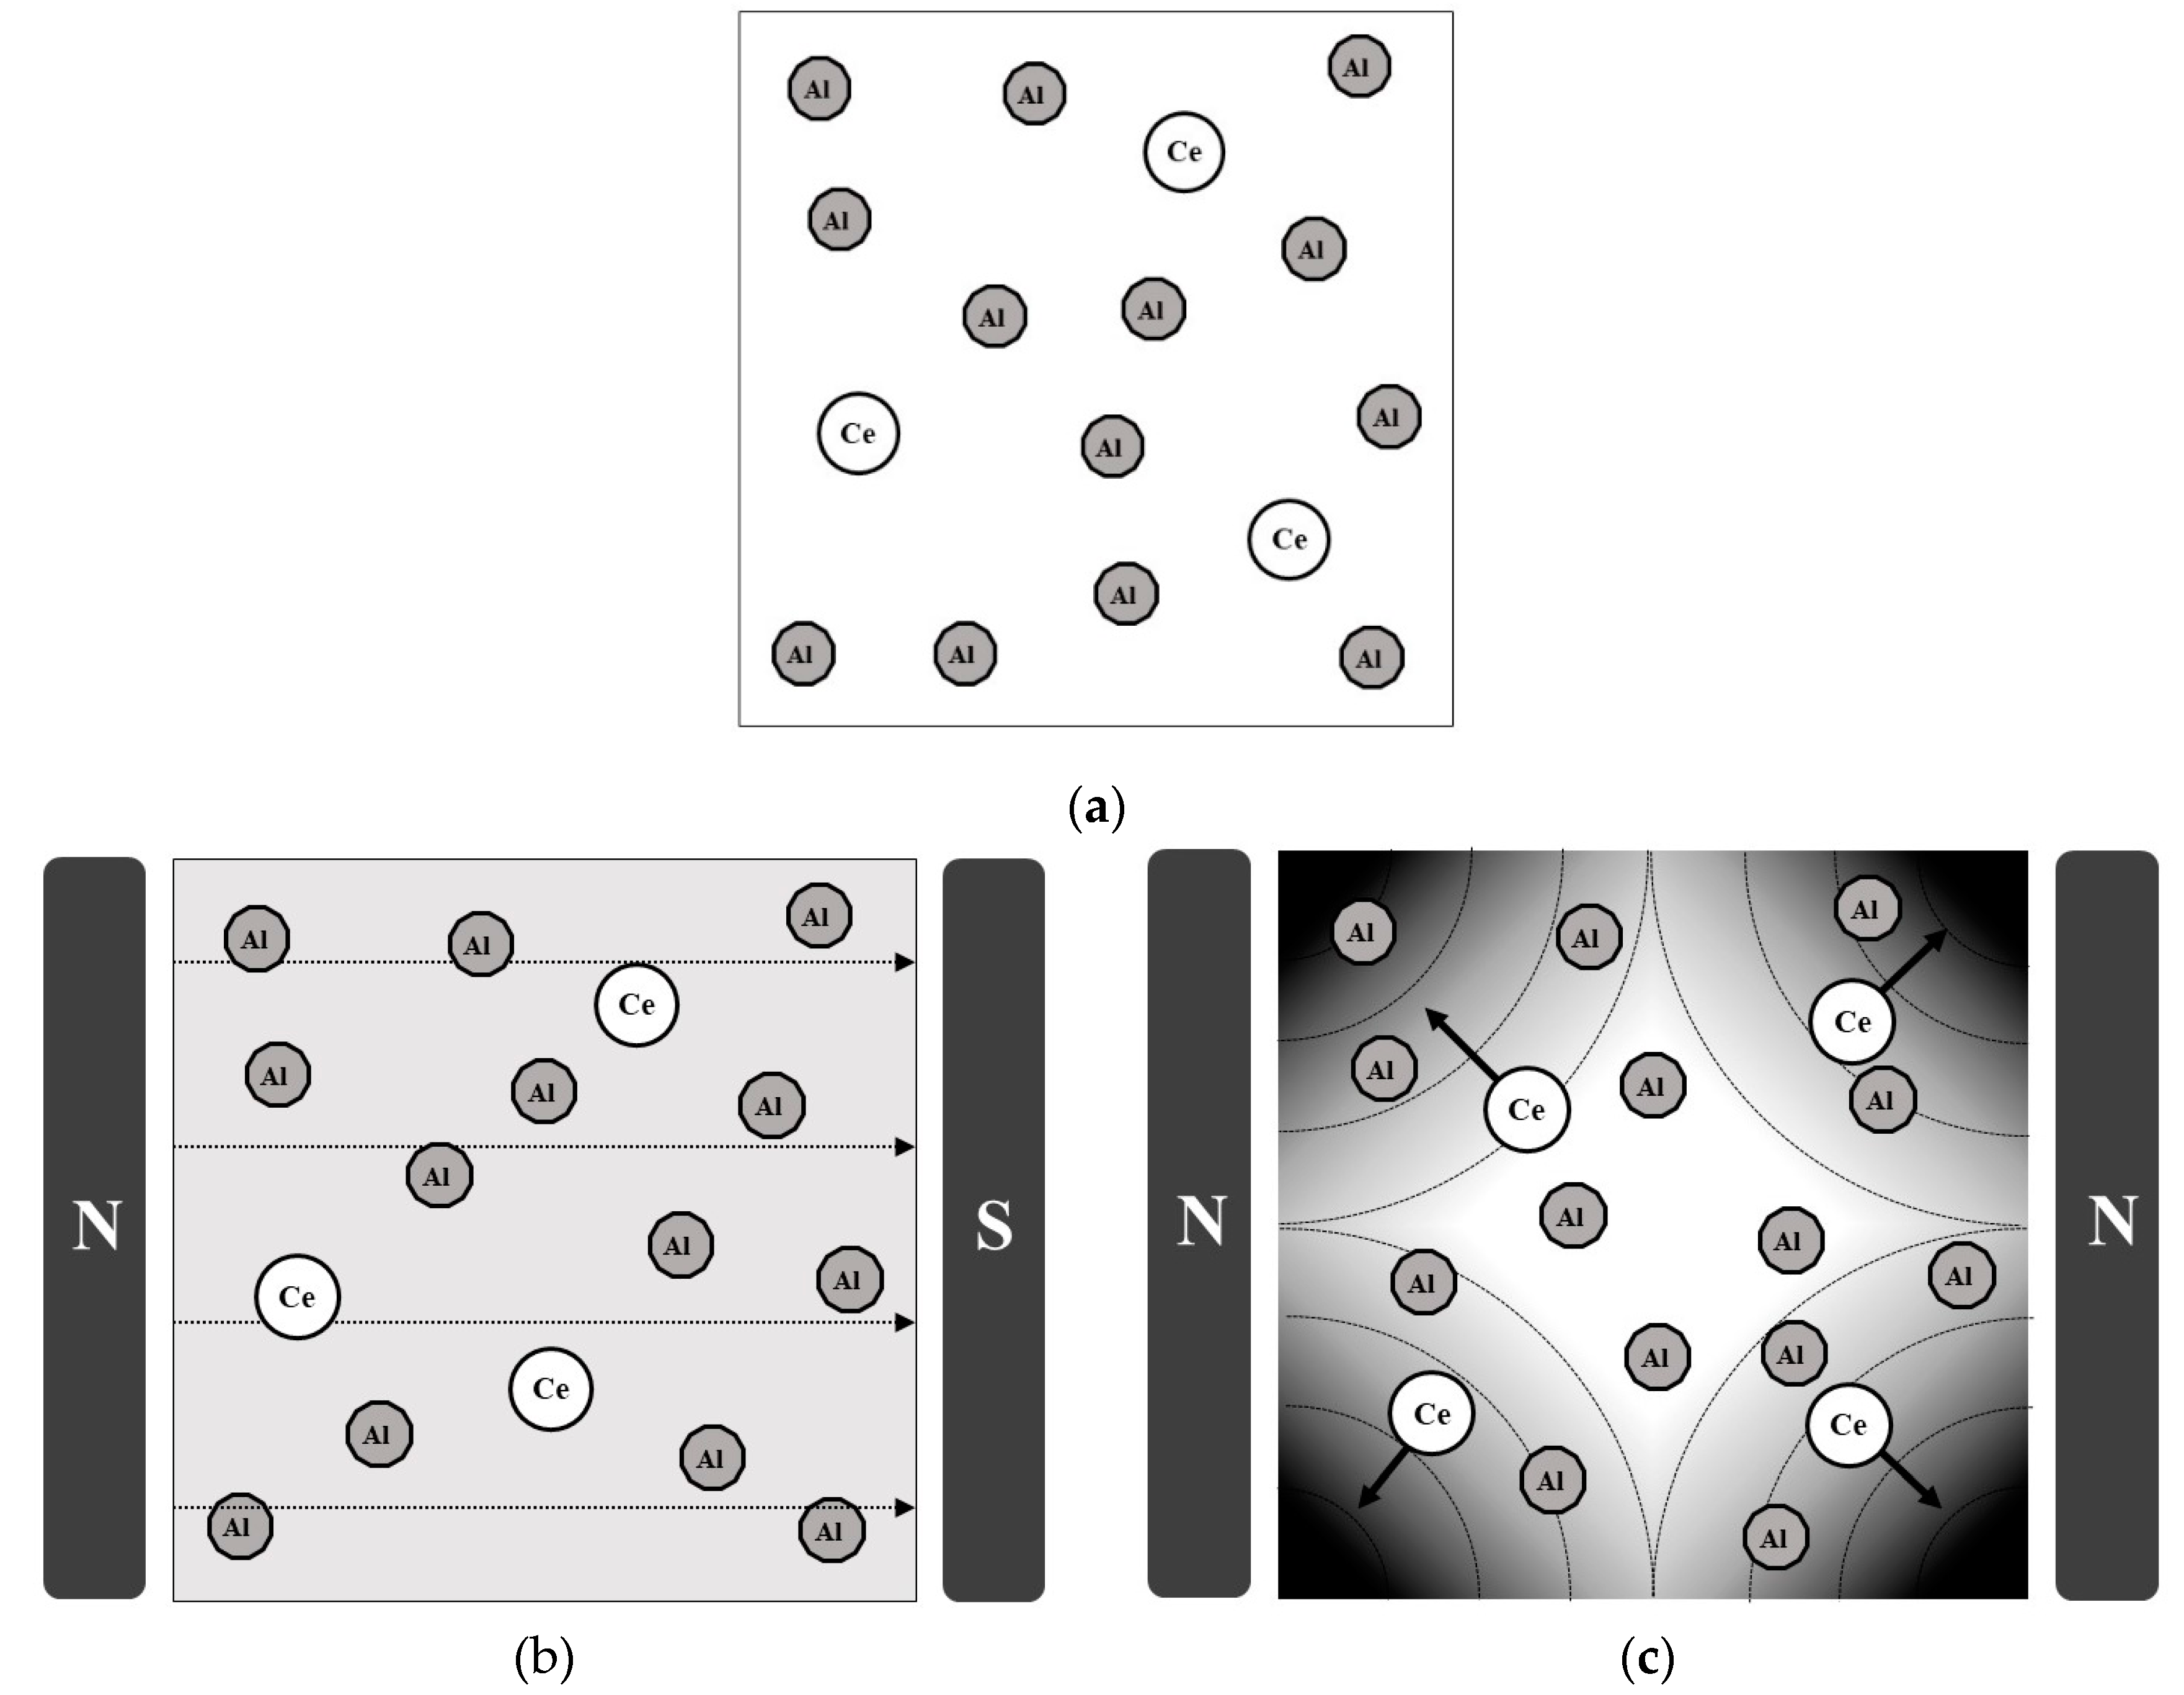
2.1. Effect of CeO2–Al2O3 Support Prepared with and without Magnetic Inducement

2.1.1. Effect on H2, CO2 and CO Production

ESR occurs together with other side reactions. The main products of ESR are H2 and CO2, while CO is a byproduct from methane reforming and decomposition of acetaldehyde which is more likely to convert to coke compared to CO2 [21]. Therefore, the rate of H2 production and the CO2:CO ratio can give information regarding the preferred pathway.
Table 1 shows the H2, CO2 and CO production rate with the CO2:CO ratio from ESR over Ni/γ–Al2O3 and Ni/CeO2–Al2O3 with and without magnetic inducement at 550 °C and 650 °C in continuous mode, respectively. The results show that doping Ce into an Al2O3 framework and using it as a support helps in the H2 production rate of the Ni catalyst. By doping Ce into an Al2O3 framework and implementing a magnet (N–N and S–S) during support preparation, Ni/CeO2–Al2O3 (N–N), Ni/CeO2–Al2O3 (S–S) catalysts yielded a higher H2 production rate and CO2:CO than the other catalysts at both temperatures. A trace of CH4 was detected only at 550 °C in the range of 2.4–3.6 mmol/min·gcat, but none was found at 650 °C. Ethylene was not found in the product stream in the operating temperature range. The result of the CO2 and CO production rate confirms that the catalyst which exhibited higher H2 production also yielded a higher ratio of CO2:CO, implying that ESR was the preferred pathway in the process.

2.1.2. Effect on Coke Reduction

Table 2 shows the amount of coke produced over Ni catalysts after the ESR process in this study, determined using Temperature Program Oxidation (TPO) technique at 550, 650 and 750 °C. In addition, the coke production at 750 °C was determined in order to observe a clear difference in the coke reduction capability of the prepared catalysts. The data shows that catalysts on CeO2–Al2O3 support contained a lower coke content than that over γ–Al2O3, because Ce can provide oxygen to gasify the deposited carbon and subsequently prevent coking. Magnetic inducement and pole arrangement also affected the coke reduction in the catalysts. Ni/CeO2–Al2O3 prepared under same magnetic pole (N–N) and (S–S) exhibited the highest coke reduction. On the other hand, Ni/CeO2–Al2O3 (N–S) showed poor coke reduction, even outperformed by Ni/CeO2–Al2O3 prepared without magnetic inducement. This trend correlates negatively with the CO2:CO ratio reported in Table 1, where a higher CO2:CO ratio corresponds with lower amounts of coke formed.
The reduced coke formation from Ni/CeO2–Al2O3 prepared without magnetic inducement is due to oxygen vacancies from the CeO2 dopant which provides oxygen to gasify the deposited carbons to CO2. The increase in CO2 production can drive the Boudouard reaction (Equation (2)) backward, causing a decrease in coke formation.
2 CO C + CO 2
However, magnetic inducement with proper pole arrangements can significantly reduce the coke formation. In order to understand the role of magnetic inducement on Ce dopants in Al2O3 framework and on coke reduction on Ni catalysts, the following characterizations: XRD, Brunauer, Emmett and Teller (BET) surface analysis, and SEM-EDS, were performed.

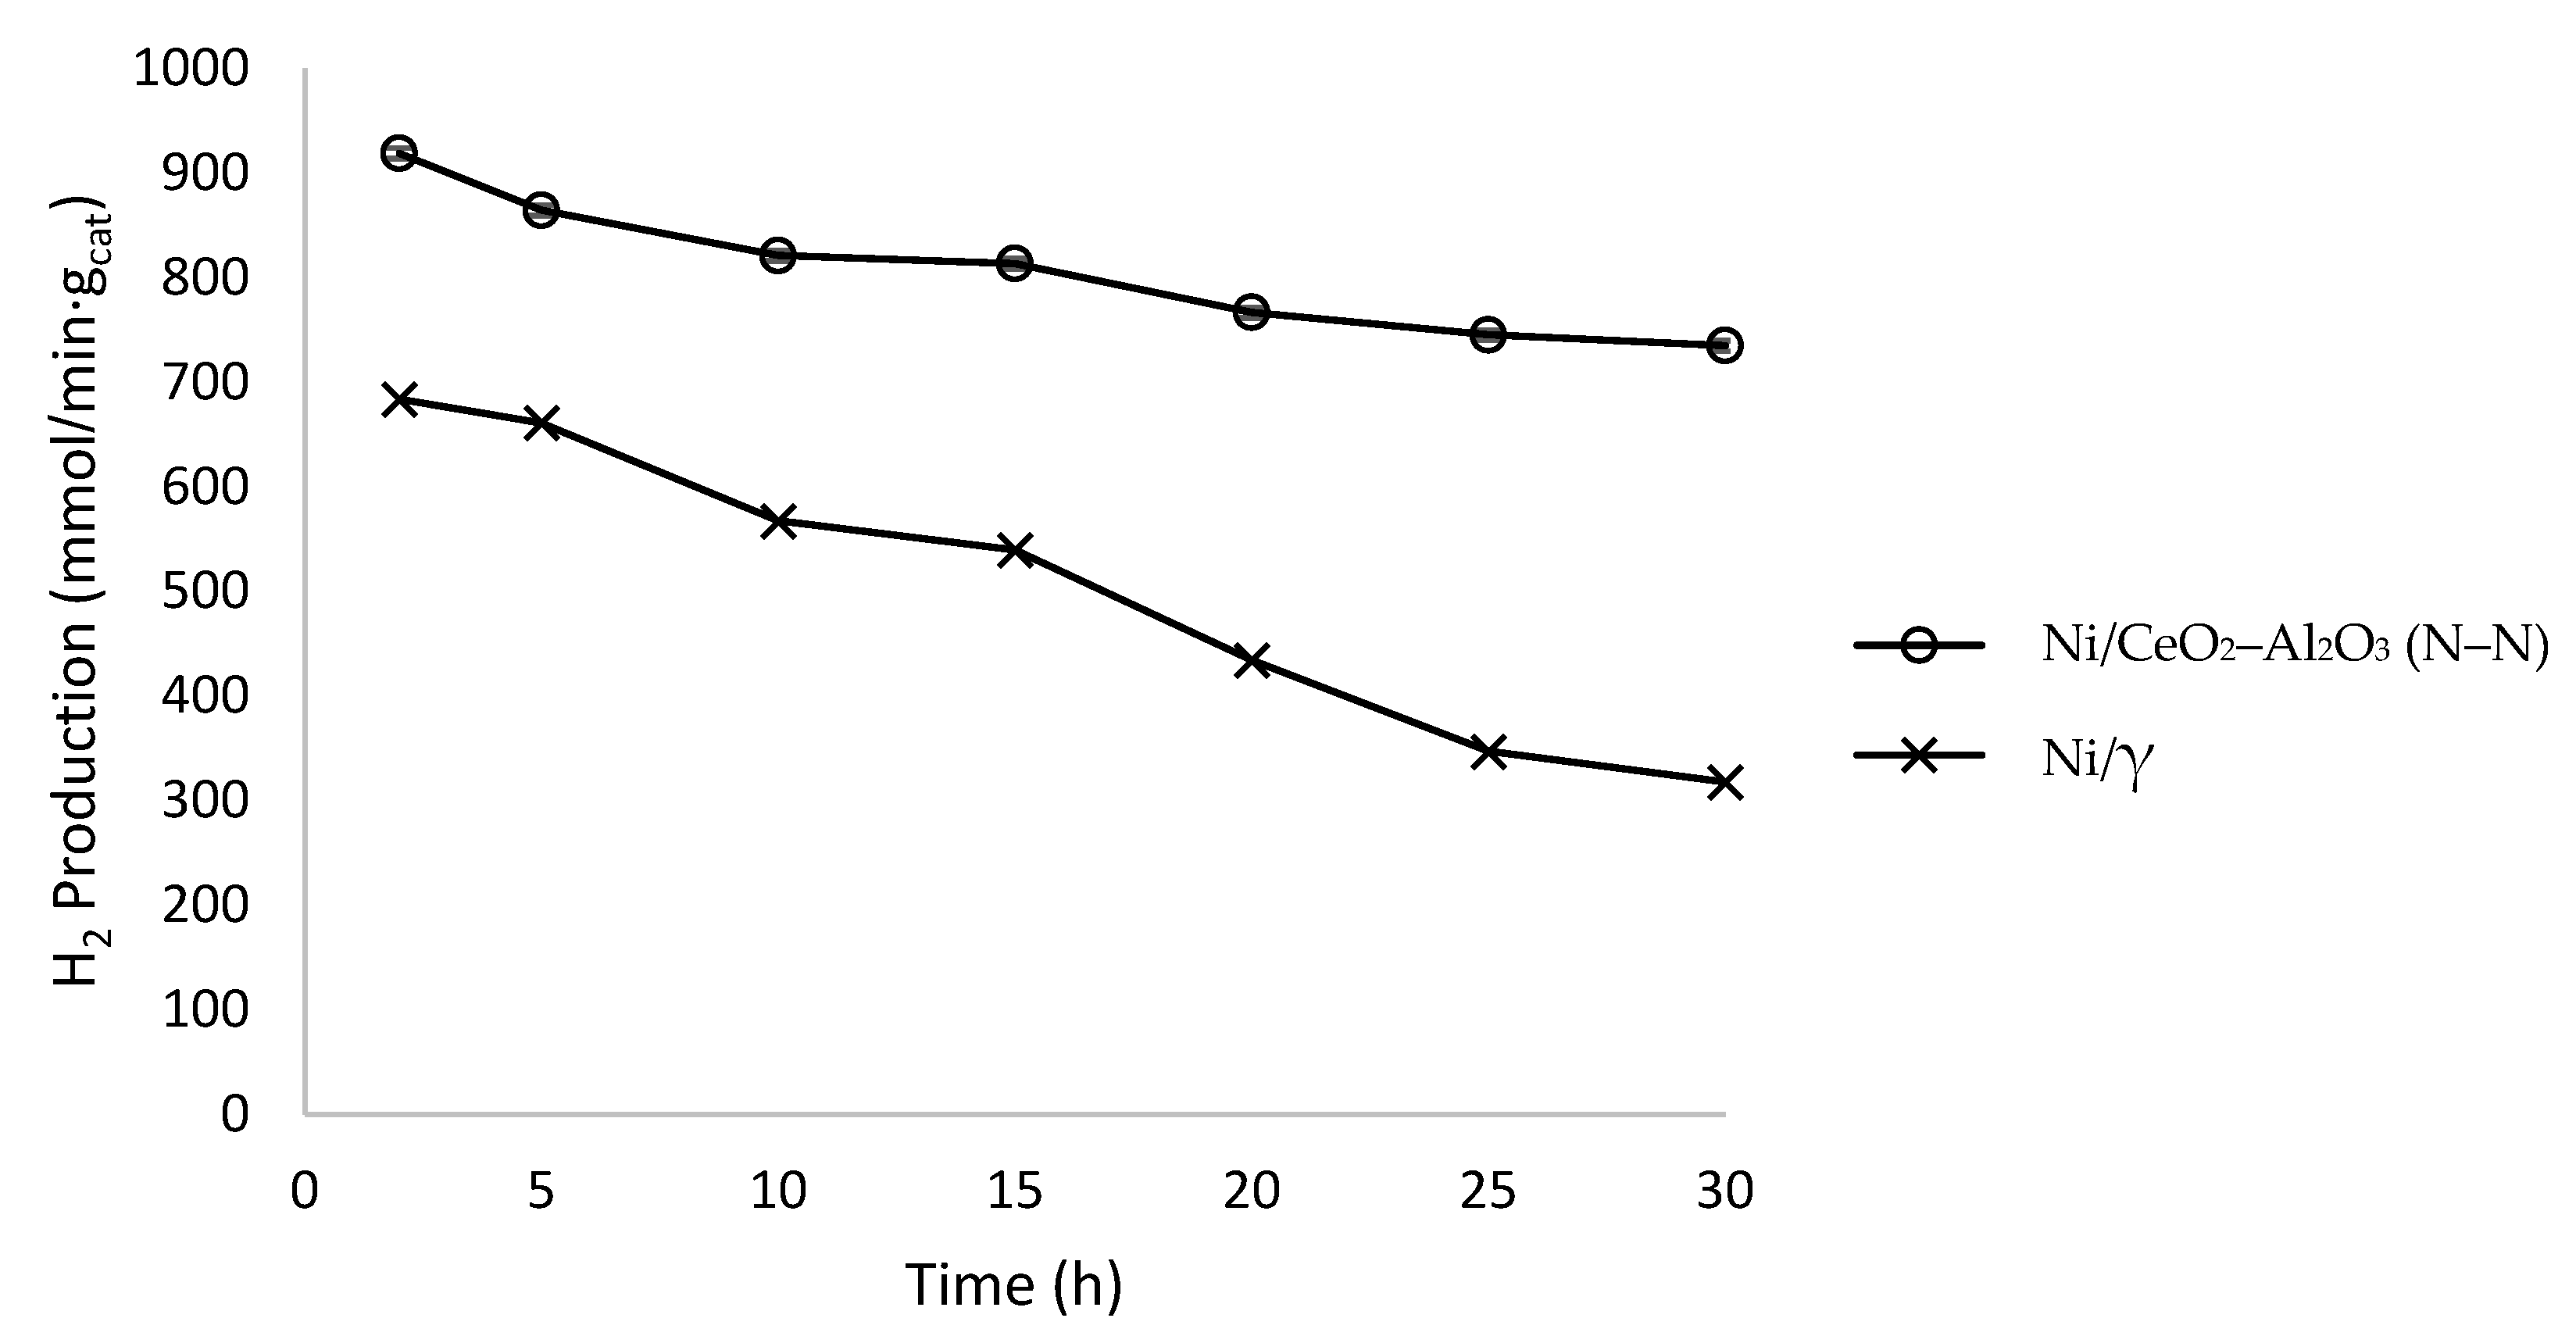
2.1.3. Stability Test

Figure 1 shows the H2 production at 650 °C from Ni/γ–Al2O3 and Ni/CeO2–Al2O3 (N–N) which exhibited the lowest and highest catalytic activity among the catalysts used, respectively. The stability test was run for 30 h. The result shows that while the H2 production from Ni/γ–Al2O3 started to drop after 5 h of reaction, Ni/CeO2–Al2O3 (N–N) achieved a higher H2 production rate with lower decrease rate for 30 h. Therefore, the amount of coke is directly related to the deactivation of the catalyst, which corresponds to the results in Table 2.

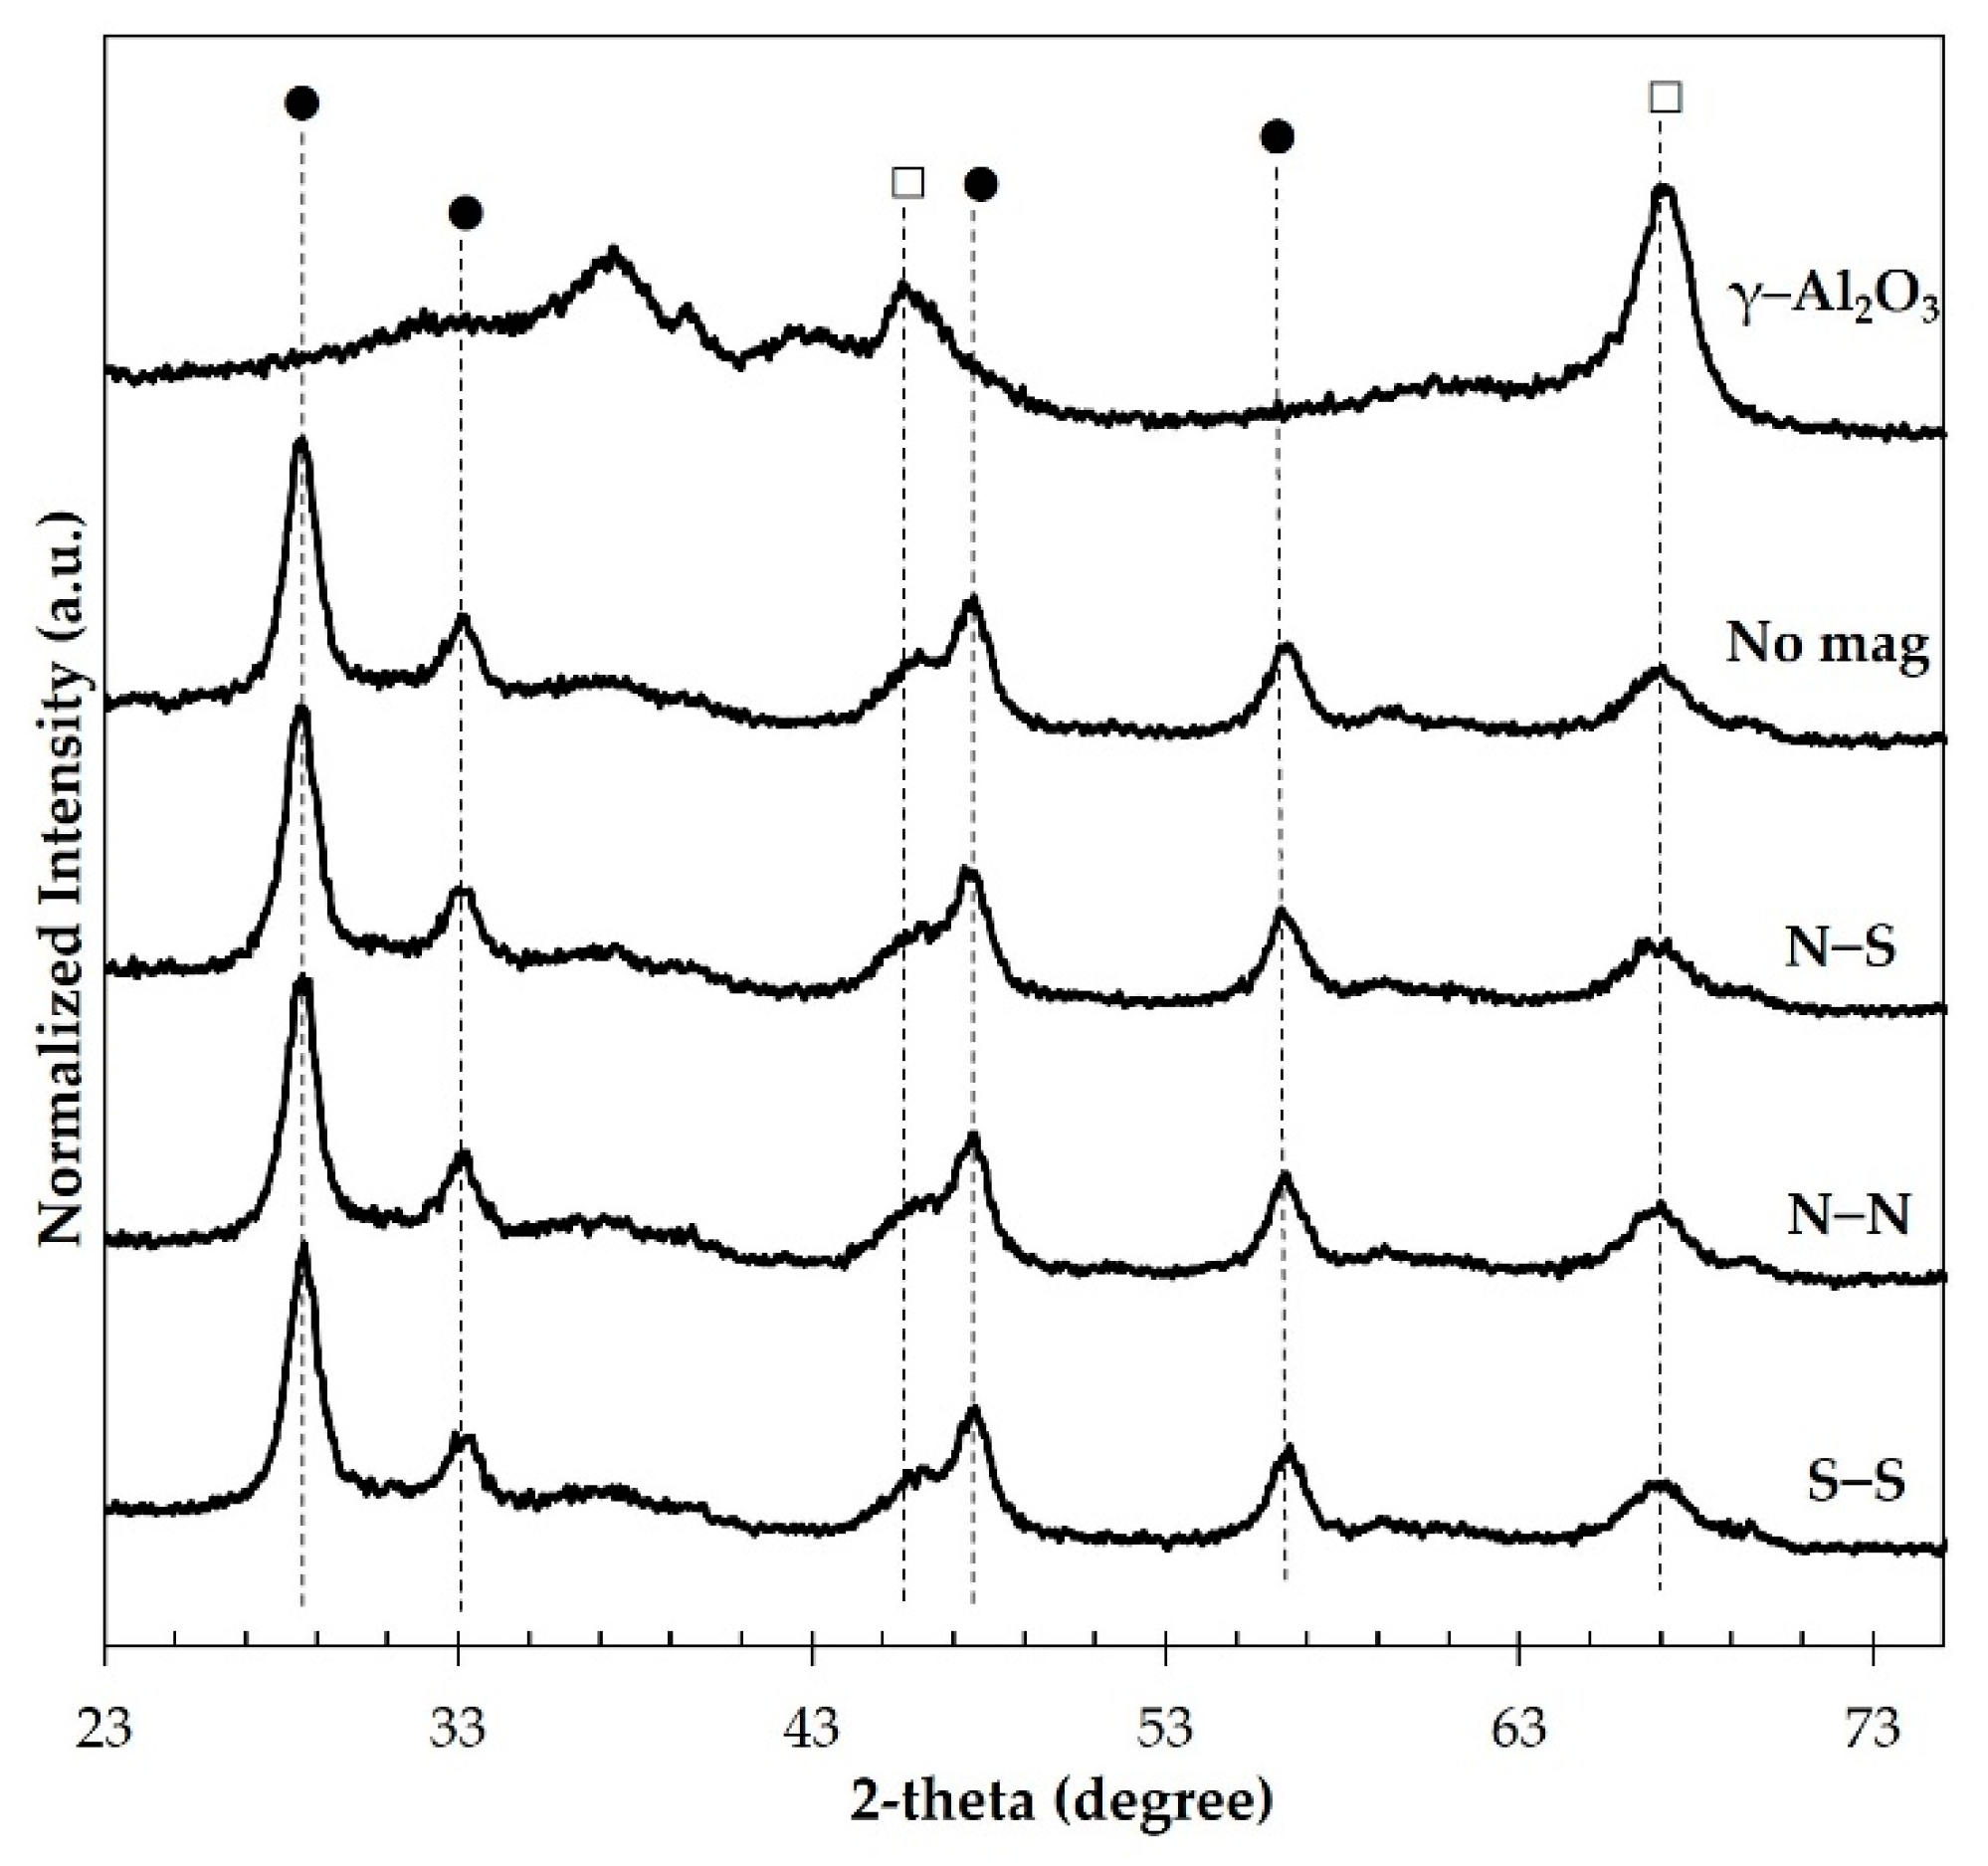
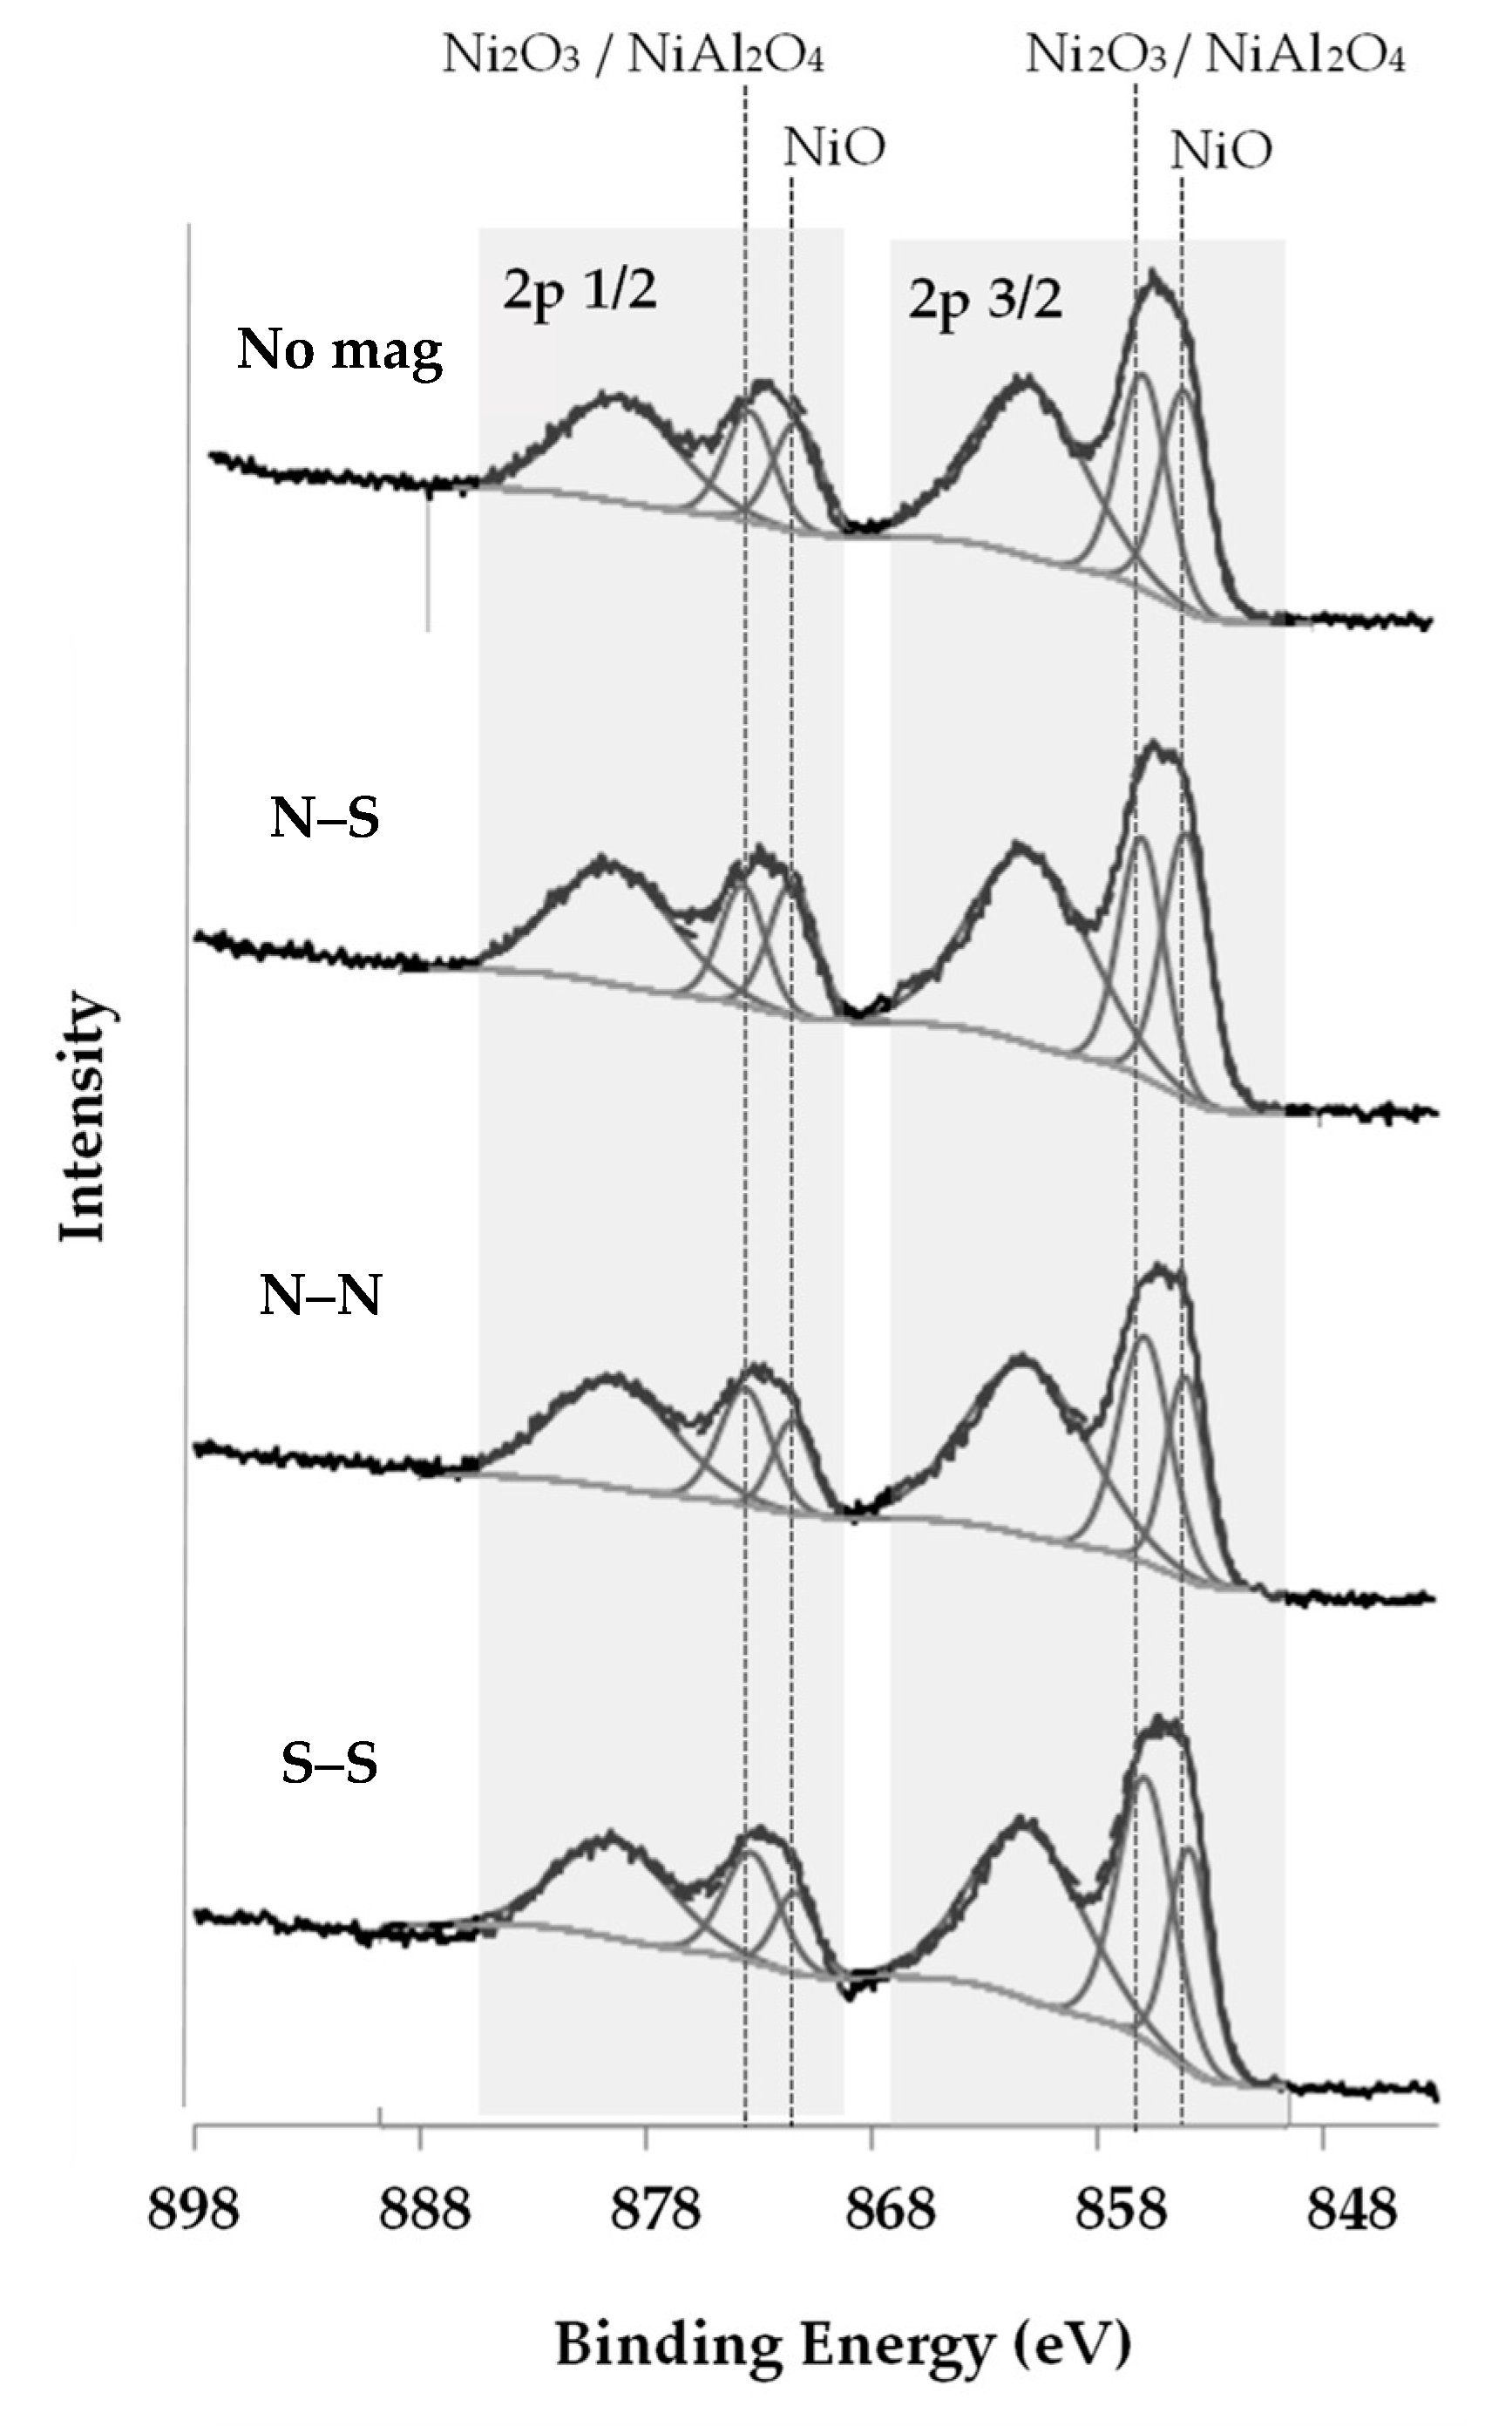
2.2. Catalyst and Support Characterization

Table 3 lists the Ni content, dispersion percentage, and surface areas of the catalysts in this study. Ni contents of the catalysts were determined using the inductively coupled plasma optical emission spectrometry (ICP-OES) technique. The results show the same range of Ni contents in each catalyst (from 9.60 ± 0.13 to 9.86 ± 0.20 wt %). This ensures that the catalytic activity of Ni catalysts is based on the same Ni mass basis in this study. The results also show that doping Ce into the Al2O3 framework enhances both the dispersion and the surface area of Ni active sites. Ce dopants cause defects in the Al2O3 framework and serve as nucleation points for Ni atoms [20]. Magnetic inducement clearly affects the Ni dispersion on this support. Ni/CeO2–Al2O3 catalysts prepared under same pole magnetic inducements (N–N and S–S) exhibit the highest Ni surface area and Ni dispersion. In contrast, Ni/CeO2–Al2O3 (N–S) does not show any changes in these properties compared to Ni catalyst on the support prepared without magnetic inducement. These differences in Ni dispersion and surface area are due to the effect of magnetic inducement on the insertion of Ce into the Al2O3 framework.
Table 4 lists physical properties of the supports in this study including the surface areas, the average pore diameters, and the lattice constants. The lattice constants obtained from XRD pattern analysis of CeO2–Al2O3 supports in Figure 2 were different from those of Al2O3, which was caused by the defect and the distortion of the Al2O3 structure due to the doped Ce atoms [8]. The change in the unit cell of Al2O3 structure led to larger lattice constants in CeO2–Al2O3. A larger lattice constant implies better Ce insertion into the Al2O3 framework [16], thus the supports prepared with N–N and S–S magnetic pole arrangement showed better Ce insertion than the support prepared without magnetic inducement and with N–S magnetic pole arrangement.
All CeO2–Al2O3 supports had surface areas lower than that of Al2O3. The decrease in support surface area comes from the high proportion of Ce, which has a surface area lower than that of Al2O3 [22]. The supports prepared under the same pole magnetic inducement (N–N and S–S) yielded lower surface areas than the support with opposite pole inducement (N–S). The results imply that there are more Ce atoms in the Al2O3 framework when the support is prepared under the same pole magnetic inducement, corresponding with the implication from the lattice constants.
Therefore, magnetic inducement with certain pole arrangements might be able to control the Ce composition in the Al2O3 framework during the support preparation by the sol–gel process.
The SEM-EDS technique was used to identify the Ce distribution on the surface of the CeO2–Al2O3 support by random sampling at different points. The SEM-EDS data were collected from five random particles of each support, measured at three points on each particle, to visualize the Ce distribution on the surfaces of CeO2–Al2O3 supports and determine the range of Ce compositions in the Al2O3 framework.
The Ce compositions are represented in term of the molar ratio of Ce:Al, as listed in Table 5. The doped support without magnetic inducement showed a wide range of Ce composition with high standard deviation, which implies that Ce is randomly inserted into the Al2O3 framework. Therefore, the magnetic inducement during sol–gel preparation can uniformly distribute Ce into the Al2O3 framework, resulting in a narrower Ce:Al ratio range with a low standard deviation.
The application of the same magnetic pole arrangement (N–N and S–S) yielded the highest Ce:Al molar ratio and the best Ce distribution in the Al2O3 framework. On the contrary, the application of an opposing magnetic pole arrangement (N–S) yielded the lowest Ce:Al molar ratio, even lower than the support prepared without magnetic inducement. This corresponds to and confirms the results from the BET surface area and the lattice constants of the supports, which suggest that same magnetic pole arrangements yield the best Ce insertion into the Al2O3 framework.
The addition of Ce dopants not only improves Ni dispersion on the support, but also creates oxygen vacancies to react with carbon species formed on the catalysts after long-term use. Improvement of Ce composition and distribution in the Al2O3 framework thus directly affects the H2 production and the amount of coke formed. The application of magnetic inducement during the support preparation, as reported elsewhere, causes Ce3+ and Al3+ ions to move differently, especially for the same magnetic pole arrangement [23]. The magnetic field gradient produced between same magnetic poles, as shown in Figure 3, can drive paramagnetic ions, such as Ce3+ ions, to move towards regions with stronger magnetic field. On the other hand, diamagnetic ions, such as Al3+ ions, are generally less affected by magnetic fields. Application of a magnetic field to a dilute aqueous solution also leads to higher viscosity. The decrease in Ce dispersion in the Al2O3 framework in the support prepared under opposite magnetic pole arrangement is a probable result of the higher viscosity of the Ce–Al solution. In contrast, a same magnetic pole arrangement provides extra driving force for movements of Ce3+ ions, causing them to better disperse into regions rich in Al3+ ions.
The XPS spectra of Ni 2p on CeO2–Al2O3 supports are shown in Figure 4. The spectra exhibit characteristic peaks of NiO at 854 and 871 eV. The peaks of Ni2O3 or NiAl2O4 are observed at binding energies of 856 and 873 eV, respectively. The lack of observable peak shift for Ni 2p between Ni catalysts loaded onto CeO2–Al2O3 prepared with and without magnetic inducement suggests that magnetic inducement does not affect the oxidation states of Ni active metal.
In order to determine the oxidation states of Al and Ce, the Al2O3 and CeO2–Al2O3 supports were also analyzed with XPS spectrometry. The XPS spectra of Al 2p and Ce 3d are presented in Figure 5 and Figure 6, respectively, with the list of characteristic peaks presented in Table 6.
In Figure 5 and Table 6, differences are observed in Al 2p binding energy between Al2O3 and CeO2–Al2O3 supports prepared with and without magnetic inducement. The Al–O peak was slightly shifted to the higher binding energy side when Ce was doped to the Al2O3 support. In Figure 6 and Table 6, Ce 3d peak energy also showed a similar pattern with slight peak shift on Ce 3d sat (3/2). However, the distribution of Ce3+ and Ce4+ cannot be defined, because XPS experimentation was executed under vacuum conditions without O2. Therefore, there is no solid explanation for this phenomenon, but this result might be useful for further investigation with other techniques.
Therefore, the application of magnetic inducement during CeO2–Al2O3 support preparation does not cause significant differences in the oxidation states of Al and Ce. Magnetic inducement affects only the distribution and composition of Ce in Al2O3. The defects due to oxygen vacancies in CeO2 serve as nucleation points for Ni [22], therefore a higher composition of Ce on the surface of the Al2O3 framework leads to better dispersion of Ni, as supported by the results from CO pulse chemisorption. Magnetic inducement with the same magnetic pole arrangement during CeO2–Al2O3 support preparation thus improves the catalytic activity of Ni catalysts by creating a larger number of Ni active sites without significantly changing the reaction pathway and the electronic structure of the catalyst.

3. Conclusions

From this study, we discovered that by introducing magnetic inducement using different pole arrangements (N–N, S–S, and N–S) during the CeO2–Al2O3 support preparation, the surface areas of the supports can be altered. There is, thus, a possibility that magnetic inducement can be used to control the composition of the doped Ce in Al2O3 supports due to its effect on the viscosity of the metal solution and the movement of paramagnetic Ce2+ ions. The supports prepared under the same pole magnetic inducement (N–N and S–S) yielded a lower surface area than that of the support with opposite pole inducement (N–S) due to a higher Ce composition in the Al2O3 framework. After impregnation, Ni/CeO2–Al2O3 (N–N) and Ni/CeO2–Al2O3 (S–S) catalysts exhibited the highest Ni surface area and Ni dispersion which corresponded to the highest H2 production rate and the highest CO2:CO ratio at 550 °C and 650 °C. The higher Ce composition in Ni/CeO2–Al2O3 (N–N) and Ni/CeO2–Al2O3 (S–S) catalysts also related to a lower coke formation as expected, due to the oxygen storage capacity of Ce.

4. Materials and Methods

4.1. Support Preparation

The CeO2–Al2O3 supports were prepared with 5 mol % of dopant following these steps. Ce(NO3)3·6H2O (≥99%, Fluka, North Carolina, USA) and Al(NO3)3·9H2O (≥98%, LOBA Chemie, Mumbai, India) were separately dissolved in deionized water to form 0.1 M salt solutions. The Ce salt solution was mixed with Al salt solution to form a Ce–Al salt solution with a mole ratio of 0.1:9.9. Ammonia solution (30 vol %, Panreac AppliChem, Darmstadt, Germany) was dropped into the mixed salt solutions to form gel until the pH of the salt solution reached 9 within 60 min with the influence of a magnetic field as shown in Figure 7 (same poles and opposite poles), and without. The Ce–Al gels were kept at room temperature for 48 h and dried at 110 °C for 24 h. The dried gels were calcined at 800 °C for 4 h to obtain CeO2–Al2O3, CeO2–Al2O3 (N–S), CeO2–Al2O3 (N–N) and CeO2–Al2O3 (S–S) supports. The undoped γ–Al2O3 was prepared with the same preparation procedure as the CeO2–Al2O3 support without magnetic inducement. All supports were ground and sieved using 106 µm sieves to control the support particle size.

4.2. Catalyst Preparation

The 10 wt % of Ni catalysts were prepared using an incipient wetness impregnation method. Ni(NO3)2·6H2O (≥99%, LOBA Chemie, Mumbai, India) with 2 mol of urea was dissolved in deionized water to obtain Ni solutions with a concentration of 1.25 M. The Ni solutions were impregnated over the supports. After impregnation, the catalysts were dried at 110 °C for 12 h and then calcined at 500 °C for 4 h without a catalyst washing process.

4.3. Ethanol Steam Reforming Process

Figure 8 shows the schematic diagram of ESR process used in this work. The catalysts were tested in a quartz tubular reactor with an inner diameter of 1 cm to evaluate the gas production from ESR. To minimize the temperature gradients inside the catalyst bed, the catalyst (0.1 g) was mixed with fine quartz powder (0.4 g, Sigma-Aldrich, St. Louis, USA) then packed between quartz wool in the reactor. The catalyst reduction process was conducted using 50 vol % H2 (99.99% purity, Linde Thailand Pub Co., Ltd., Samut Prakan, Thailand) balanced in Ar (99.999% purity, Linde Thailand Pub Co., Ltd.) at a total flow rate of 50 mL·min−1 at 600 °C for 1 h. Then, the reactor was purged with 50 mL·min−1 Ar at 600 °C for 30 min to remove excess H2. Carrier gas (Ar) at the flow rates of 30 mL·min−1 and 10 mL·min−1 were flowed into saturators containing water at 98.4 °C, and ethanol at 80 °C, respectively. Feed reactant was a mixture of ethanol to water with the molar ratio of 1:3. The catalyst activity tests were performed at 550 °C and 650 °C in a continuous mode for 2 h and 30 h for the stability test. The product gas was sent directly to an auto sampling unit of the Gas Chromatography with Thermal Conductivity Detector (GCMS-2010 Ultra, Shimadzu Corporation, Kyoto, Japan) to determine the composition of the gas products. The H2, CO2 and CO production rates were calculated by measuring the gas product flow rate and multiplying it with the mole percentage of each gas component determined from GC. The values corresponded to average values during 2 h reaction runs.

4.4. Support Characterization

X-ray diffraction technique (XRD, X’Pert PRO diffractometer, PANalytical, Almelo, Netherlands) with Cu Kα1 radiation at 40 kV and 45 mA, 23°–73° 2-theta, 0.02° step size, and 0.5 s step time was used to characterized the structures of the supports. JADE software (Materials Data, Inc., Livermore, CA, USA) was used to determine the lattice constant of the Al2O3 structure from peak deconvolution on the XRD pattern of supports prior, which corresponded to the diffraction angles at around 46 and 67 degrees, with the highest diffraction planes of (4 0 0) and (4 4 0) in the diffractogram. Brunauer, Emmett and Teller (BET) technique (Autosorp-1C, Quantachrome, FL, USA) was used to evaluate the surface areas, the pore volumes, and the pore diameters of the supports. X-ray photoelectron spectroscopy analysis (XPS) acquired with Kratos Axis Supra XPS spectrometer using a monochromated Al Kα x-ray source operated at 450 mA and 15 kV was used to determine Al 2p and Ce 3p XPS spectra of Al2O3 and CeO2–Al2O3 supports.

4.5. Catalyst Characterization

CO chemisorption by a pulse injection technique was conducted using 10 vol % CO in He (Linde Thailand Pub Co., Ltd., Samut Prakan, Thailand) The chemisorption spectra of the catalysts were subtracted by the baseline taken from CO pulse chemisorption on the corresponding supports to determine Ni dispersion and Ni surface area on the catalysts (CO-pulse, BELCAT-B, BEL Japan Inc., Osaka, Japan). SEM-EDS (JSM 7800F, JEOL Japan Inc., Japan) was used to determine the distribution of Ce in the Ni/CeO2–Al2O3 catalysts. The Ni contents on the catalysts were determined using inductively coupled plasma optical emission spectrometry (ICP-OES, OptimaTM 8300, PerkinElmer, MA, USA) to verify Ni contents in each catalyst. The catalysts were digested with 65 vol % HNO3 solution to obtain the Ni catalyst solutions using the microwave digestion technique. The catalyst solutions were diluted 50 times with deionized water to obtain the Ni contents in the catalyst solutions in the range of mg·L−1. The Ni contents in the catalyst solutions were determined using the MultiElement Calibration Standard 2 (PerkinElmer Plus, USA), with a working range of 0.1–100 mg·L−1 for Ni. Temperature Programmed Oxidation (TPO) using 10 vol % O2 in He (Linde Thailand Pub Co., Ltd.) was also conducted using the Chemisorption Catalyst analyzer (BELCAT-B, BEL Japan Inc., Japan). The mixed gas was fed at 50 cm–3/min with temperature ramping rate of 10 °C·min−1 to 900 °C and the amount of CO2 produced during combustion was recorded to determine the amount of coke formation on the used catalyst after reaction. X-ray photoelectron spectroscopy analysis (XPS) acquired with Kratos Axis Supra XPS spectrometer using a monochromated Al Kα x-ray source operating at 15 mA and 15 kV was used to determine Ni 2p XPS spectra for Ni on CeO2–Al2O3 supports. The XPS peak pattern of each catalyst was observed to determine the oxidation state of Ni of different catalysts.

Author Contributions

Conceptualization, P.V., P.T., L.L. and S.C.; methodology, P.V. and P.T.; investigation, P.V., S.A. and S.K.; writing—original draft preparation, P.V., S.A. and S.K.; writing—review and editing, P.T., L.L. and S.C.; supervision, P.T. All authors have read and agreed to the published version of the manuscript.

Funding

This research received no external funding.

Acknowledgments

This study was supported by Thammasat University Research Fund, Contact No. TUFT 067/2563 and the thesis support from the Scholarship for Excellent Thai Student (ETS), Sirindhorn International Institute of Technology (SIIT), Thammasat University (TU). This work was also supported by the National Science and Technology Development Agency Thailand (NSTDA) and Center of Scientific Equipment for Advanced Research, Thammasat University (TUCSEAR).

Conflicts of Interest

The authors declare no conflict of interest.

References

  1. Benito, M.; Sanz, J.; Isabel, R.; Padilla, R.; Arjona, R.; Daza, L. Bio-ethanol steam reforming: Insights on the mechanism for hydrogen production. J. Power Sources 2005, 151, 11–17. [Google Scholar] [CrossRef]
  2. Ogo, S.; Sekine, Y. Recent progress in ethanol steam reforming using non-noble transition metal catalysts: A review. Fuel Process. Technol. 2020, 199, 106238. [Google Scholar] [CrossRef]
  3. Arslan, A.; Doğu, T. Effect of calcination/reduction temperature of Ni impregnated CeO2–ZrO2 catalysts on hydrogen yield and coke minimization in low temperature reforming of ethanol. Int. J. Hydrog. Energy 2016, 41, 16752–16761. [Google Scholar] [CrossRef]
  4. Kumbilieva, K.; Petrov, L.; Alhamed, Y.A.; Alzahrani, A. Reaction Mechanism and Deactivation Modes of Heterogeneous Catalytic Systems. Chin. J. Catal. 2011, 32, 387–404. [Google Scholar] [CrossRef]
  5. Vicente, J.; Ereña, J.; Montero, C.; Azkoiti, M.J.; Bilbao, J.; Gayubo, A.G. Reaction pathway for ethanol steam reforming on a Ni/SiO2 catalyst including coke formation. Int. J. Hydrog. Energy 2014, 39, 18820–18834. [Google Scholar] [CrossRef]
  6. Ni, M.; Leung, D.Y.; Leung, M.K. A review on reforming bio-ethanol for hydrogen production. Int. J. Hydrog. Energy 2007, 32, 3238–3247. [Google Scholar] [CrossRef]
  7. Kugai, J.; Velu, S.; Song, C. Low-temperature reforming of ethanol over CeO2-supported Ni-Rh bimetallic catalysts for hydrogen production. Catal. Lett. 2005, 101, 255–264. [Google Scholar] [CrossRef]
  8. Cavallaro, S. Low-temperature reforming of ethanol over CeO2-supported Ni-Rh bimetallic catalysts for hydrogen production. Energy Fuels 2000, 14, 1195–1199. [Google Scholar] [CrossRef]
  9. Auprêtre, F.; Descorme, C.; Duprez, D. Bio-ethanol catalytic steam reforming over supported metal catalysts. Catal. Commun. 2002, 3, 263–267. [Google Scholar] [CrossRef]
  10. Montero, C.; Remiro, A.; Valle, B.; Oar-Arteta, L.; Bilbao, J.; Gayubo, A.G. Origin and Nature of Coke in Ethanol Steam Reforming and Its Role in Deactivation of Ni/La2O3−αAl2O3 Catalyst. Ind. Eng. Chem. Res. 2019, 58, 14736–14751. [Google Scholar] [CrossRef]
  11. Sepehri, S.; Rezaei, M. Ce promoting effect on the activity and coke formation of Ni catalysts supported on mesoporous nanocrystalline γ-Al2O3 in autothermal reforming of methane. Int. J. Hydrog. 2017, 42, 11130–11138. [Google Scholar] [CrossRef]
  12. Das, S.; Ashok, J.; Bian, Z.; Dewangan, N.; Wai, M.; Du, Y.; Borgna, A.; Hidajat, K.; Kawi, S. Silica–Ceria sandwiched Ni core–shell catalyst for low temperature dry reforming of biogas: Coke resistance and mechanistic insights. Appl. Catal. B 2018, 230, 220–236. [Google Scholar] [CrossRef]
  13. Pu, J.; Luo, Y.; Wang, N.; Bao, H.; Wang, X.; Qian, E.W. Ceria-promoted Ni@Al2O3 core-shell catalyst for steam reforming of acetic acid with enhanced activity and coke resistance. Int. J. Hydrog. 2018, 43, 3142–3153. [Google Scholar] [CrossRef]
  14. Kathiraser, Y.; Wang, Z.; Ang, M.; Mo, L.; Li, Z.; Oemar, U.; Kawi, S.-. Highly active and coke resistant Ni/SiO2 catalysts for oxidative reforming of model biogas: Effect of low ceria loading. J. CO2 Util. 2017, 19, 284–295. [Google Scholar] [CrossRef]
  15. Fard, A.A.; Arvaneh, R.; Alavi, S.M.; Bazyari, A.; Valaei, A. Propane steam reforming over promoted Ni–Ce/Mg Al2O4 catalysts: Effects of Ce promoter on the catalyst performance using developed CCD model. Int. J. Hydrog. 2019, 44, 21607–21622. [Google Scholar] [CrossRef]
  16. Sharma, Y.C.; Kumar, A.; Prasad, R.; Upadhyay, S.N. Ethanol steam reforming for hydrogen production: Latest and effective catalyst modification strategies to minimize carbonaceous deactivation. Renew. Sustain. Energy Rev. 2017, 74, 89–103. [Google Scholar] [CrossRef]
  17. Kumar, P.; Sun, Y.; Idem, R.O. Nickel-Based Ceria, Zirconia, and Ceria–Zirconia Catalytic Systems for Low-Temperature Carbon Dioxide Reforming of Methane. Energy Fuels 2007, 21, 3113–3123. [Google Scholar] [CrossRef]
  18. Ebiad, M.A.; El-Hafiz, D.R.A.; Elsalamony, R.A.; Mohamed, L.S. Ni supported high surface area CeO2–ZrO2 catalysts for hydrogen production from ethanol steam reforming. RSC Adv. 2012, 2, 8145–8156. [Google Scholar] [CrossRef]
  19. Pacchioni, G. Oxygen Vacancy: The Invisible Agent on Oxide Surfaces. ChemPhysChem 2003, 4, 1041–1047. [Google Scholar] [CrossRef]
  20. Fujiwara, M.; Chie, K.; Sawai, J.; Shimizu, D.; Tanimoto, Y. On the Movement of Paramagnetic Ions in an Inhomogeneous Magnetic Field. J. Phys. Chem. B 2004, 108, 3531–3534. [Google Scholar] [CrossRef]
  21. Wu, Y.-J.; Santos, J.; Li, P.; Yu, J.-G.; Cunha, A.F.; Rodrigues, A.E. Simplified kinetic model for steam reforming of ethanol on a Ni/Al2O3 catalyst. Can. J. Chem. Eng. 2014, 92, 116–130. [Google Scholar] [CrossRef]
  22. Zhou, Y.; Perket, J.M.; Crooks, A.B.; Zhou, J. Effect of Ceria Support on the Structure of Ni Nanoparticles. J. Phys. Chem. Lett. 2010, 1, 1447–1453. [Google Scholar] [CrossRef]
  23. Chang, K.-T.; Weng, C.-I. An investigation into the structure of aqueous NaCl electrolyte solutions under magnetic fields. Comput. Mater. Sci. 2008, 43, 1048–1055. [Google Scholar] [CrossRef]
Figure 1. H2 production from Ni/γ–Al2O3 and Ni/CeO2–Al2O3 (N–N) at 650 °C.
Catalysts 10 01357 g001
Figure 2. XRD patterns of γ–Al2O3 and CeO2Al2O3 prepared with and without magnetic inducement supports, □: face centered cubic Al2O3, ●: face centered cubic CeO2.
Catalysts 10 01357 g002
Figure 3. Schematic of Ce2+ and Al3+ movement under (a) no magnetic inducement (b) magnetic field from opposite magnetic pole arrangement (N–S) and (c) same magnetic pole arrangement (N–N or S–S).
Catalysts 10 01357 g003
Figure 4. Ni 2p XPS spectrograms of Ni/CeO2–Al2O3 prepared with and without magnetic inducement.
Catalysts 10 01357 g004
Figure 5. Al 2p XPS spectrograms of Al2O3 and CeO2–Al2O3 prepared with and without magnetic inducement.
Catalysts 10 01357 g005
Figure 6. Ce 3d XPS spectrograms of CeO2–Al2O3 prepared with and without magnetic inducement.
Catalysts 10 01357 g006
Figure 7. Magnetic setup for magnetic inducement (N–S).
Catalysts 10 01357 g007
Figure 8. Schematic diagram of the ethanol steam reforming (ESR) process.
Catalysts 10 01357 g008
Table 1. H2 production rate of Ni catalysts at 550 and 650 °C.
CatalystsGaseous Production Rate (mmol/min·gcat)
Temperature550 °C650 °C
H2CO2COCO2:COH2CO2COCO2:CO
Ni/γ–Al2O3672.1 ± 1.6235.737.96.21683.4 ± 5.7231.071.03.27
Ni/CeO2–Al2O3680.1 ± 2.1258.341.26.27761.9 ± 2.8276.738.87.13
Ni/CeO2–Al2O3 (N–S)675.1 ± 3.6255.039.16.52727.7 ± 4.3238.832.86.94
Ni/CeO2–Al2O3 (N–N)773.2 ± 4.2293.941.67.07885.8 ± 5.4336.324.99.13
Ni/CeO2–Al2O3 (S–S)781.5 ± 3.3299.537.28.06813.6 ± 4.8299.328.38.04
Table 2. Coke formation over Ni catalysts.
CatalystsCoke (mg/gcat)
550 °C650 °C750 °C
Ni/γ–Al2O31.462.414.97
Ni/CeO2–Al2O31.322.134.08
Ni/CeO2–Al2O3 (N–S)1.422.284.84
Ni/CeO2–Al2O3 (N–N)1.251.712.82
Ni/CeO2–Al2O3 (S–S)1.301.752.79
Table 3. Ni content, Ni dispersion and Ni surface area of catalysts.
CatalystsNi Content (wt %)Ni Dispersion (%)Ni Surface Area (m2/gNi)
Ni/γ–Al2O39.70 ± 0.151.07.3
Ni/CeO2–Al2O39.60 ± 0.132.818.3
Ni/CeO2–Al2O3 (N–S)9.82 ± 0.192.918.8
Ni/CeO2–Al2O3 (N–N)9.86 ± 0.203.221.4
Ni/CeO2–Al2O3 (S–S)9.62 ± 0.193.221.0
Table 4. Physical properties of γ–Al2O3 and CeO2–Al2O3 supports.
SupportsPreparation MethodSurface Area (m2/g)Pore Volume (cm3/g)Average Pore Diameter
(Å)
Lattice Constant of Al2O3 Framework
(Å)
ProcessMagnetic Inducement
γ–Al2O3Sol–gelnone165.30.3995.17.9068
CeO2–Al2O3none138.10.3394.37.9141
N–S142.20.3291.27.9145
N–N135.60.3396.37.9220
S–S135.60.3294.27.9180
Table 5. Compositions in terms of Ce:Al molar ratio of CeO2–Al2O3 supports with and without magnetic inducement.
SupportsMagnetic InducementCe:Al Molar Ratio × 102
RangeAverageSD
CeO2–Al2O3none4.32–26.179.659.28
N–S2.00–2.662.380.29
N–N7.20–7.987.580.33
S–S6.24–7.096.700.35
Table 6. Peak energy of Al 2p and Ce 3d XPS spectrograms.
SupportPeak Energy (eV)
Al–OAl2O3Ce 3d (3+)
5/2
Ce 3d (3+) 3/2Ce 3d
(4+)
5/2
Ce 3d
(4+)
3/2
Ce 3d (sat) 5/2Ce 3d (sat) 3/2
γ–Al2O373.6475.08--------
CeO2–Al2O373.8475.06882.12900.22884.53897.79902.63916.23888.36908.31
CeO2–Al2O3 (N–S)74.1575.77882.44900.54884.85898.26902.95916.36888.73906.83
CeO2–Al2O3 (N–N)73.8675.23882.04900.14884.33897.73902.43916.31888.07907.20
Publisher’s Note: MDPI stays neutral with regard to jurisdictional claims in published maps and institutional affiliations.

