1. Introduction
The attainment of efficient and affordable polymer electrolyte fuel cells (PEFCs) is fundamental to set up a hydrogen economy, claimed by the scientific community as a need to ameliorate the effects of global warming while increasing energy efficiency and reducing the emissions of pollutants. Further fuel cell developments should aim to reduce cost and increase durability [
1,
2,
3,
4]. The core of PEFCs is the stacking of membrane-electrode assemblies (MEAs), formed by a solid polymer membrane and two electrodes (anode and cathode). These electrodes contain the catalytic layers responsible for the electrochemical reactions (hydrogen oxidation and oxygen reduction, Equations (1) and (2) for alkaline media, respectively).
The interest in alkaline environments has increased enormously in recent years because the reaction kinetics for the oxygen reduction reaction (ORR) is much faster than in acidic media. This is very important, because it is true not only for noble metal catalysts but also for platinum group metal-free (PGM-free) catalysts, and the minimization or removal of PGM catalysts from the system would imply an important reduction of cost and would consequently make it feasible to spread the fuel cell technology [
5,
6]. Besides, PGM-free fuel cells would not be subjected to the limitation imposed by the scarcity of PGM in the Earth crust that could eventually hinder a large scale production of fuel cells containing them. In any case, as a result of that interest, the development of novel alkaline anion exchange membranes (AAEMs) is rapidly improving the properties of alkaline MEAs [
7], thus widening the possibilities for the design of active, robust and cost-affordable catalysts, a fact that is reflected in a large number of recent publications [
8,
9,
10,
11].
It must be said that most of the reported catalyst developments correspond to experiments in three electrode configurations (half-cell) [
5,
6] instead of experiments in a full single cell device. In a half-cell configuration, rotating disk electrode (RDE) techniques are commonly used, with a thin layer of catalyst deposited on the surface of the electrode while oxygen is dissolved in the electrolyte [
12,
13,
14]. Although the ionomer concentration in the catalytic layer on the RDE can influence the number of available active sites and an excess of ionomer causes a lower apparent activity [
15], it has been demonstrated that the ionomer nature is a less relevant factor in the electroactivity. For example, even a proton-conducting polymer like Nafion
® can be used to bind the catalyst to the electrode surface with similar (or even better) results than those obtained with an anion exchange ionomer (AEI) [
16,
17]. The reason is that in the RDE system, the liquid electrolyte penetrates the catalyst pores, wetting the whole catalyst layer and thus generating a large excess of anions in the aqueous medium, an excess that leads to a good ionic conductivity.
But the situation is different for full cells because, at the electrodes, the anion conduction of the catalytic layer relies only on the amount and distribution of the ionomer inside the catalytic layer, factors which greatly condition the performance of the cell. Consequently, the preparation of electrodes and, in particular, the selection of the proper content and treatment of the ionomer, is of paramount importance to gain the best performance of the catalyst.
In spite of the importance of the issue, there are but very few works dealing with single cells using AAEM, not enough to serve as reference, and some of those cells are built with laboratory-made membranes [
18]. This might be motivated by the few high performing AAEMs commercially available. Up to our knowledge, Fumatech [
19], Tokuyama [
20], Sustainion and Enapter (formerly Acta) are the only manufacturers of this kind of AAEM/AEI. Among the existing products, the Fumasep
® FAA-3 membrane from Fumatech has an ion exchange capacity of 1.6–2.3 meq g
−1, a water uptake of 10–25 wt% at 25 °C, and a dimensional swelling up to 2%. FAA-3 thus represents an adequate candidate as benchmark AAEM for fuel cell studies in single cell and stack investigations [
21]. The ionomer counterpart related to FAA-3 is known as Fumion. The exact chemical structure of the polymer has not been published, but has been reported to be an aminated poly(phenylene oxide) backbone with quaternary ammonium groups [
22]. This commercial Fumatech AAEM has also shown a promising performance in alkaline electrolysis [
23,
24].
To obtain a good cell performance, a good balance is required between catalyst active sites, the amount of ionomer for ion conduction, and porosity of the catalyst layer to allow reactants and products to diffuse properly. In the early 2000s, some research works pointed out the importance of ionomer concentration at the electrodes in Nafion
®-based fuel cells [
25,
26]. Nafion
® is still the benchmark polymer for low temperature fuel cells. It was observed that an optimum ionomer concentration around 30–33% maximizes power density [
25,
27]. Later works concluded that the catalyst loading and the porous texture of the catalyst carbon support influenced also the best ionomer-to-catalyst ratio [
26,
28]. Additionally, some works concluded that the method to incorporate the catalyst layer to either the gas diffusion layer (catalyst coated substrate) or to the membrane (catalyst coated membrane) has no significant influence on the optimum concentration of ionomer for Nafion
® [
27,
29]. All these features, together with green fabrication approaches [
30], are important for the development of fuel cell electrodes.
Concerning alkaline ionomers, the number of works on the optimization of the catalytic layer is low. Carmo and coworkers used a hand brushing procedure to prepare the electrodes and an OH-form based ionomer (FAA-3 solution in N-methyl-2-pyrrolidone, NMP), establishing an optimum Pt loading of 0.8 mg cm
−2 and 25 wt% ionomer [
31]. Britton and coworkers used the catalyst coated membrane methodology [
32]. They concluded that the mesoporosity of the catalytic layer plays a very relevant role in performance. This indicates that the pore blocking effect of the ionomer phase must be taken into account in the optimization of the electrodes. Carlson and collaborators established the optimum values of ionomer concentration (37–44 wt%) and Pt loading (0.4 mg cm
−2) for a Tokuyama ionomer (AS-4) and Tokuyama membrane fuel cell [
33].
Then, the purpose of this work is to optimize the catalytic layer preparation on the basis of Fumion ionomer and Pt/C catalysts in a full single fuel cell with a membrane Fumasep® FAA-3. The catalyst-coated substrate method has been used to prepare Fumion-based electrodes. Specifically, a commercial Pt/C catalyst was mixed with a Fumion ionomer and sprayed onto a gas diffusion layer. Such prepared electrodes were exchanged in an alcoholic solution to substitute Br− by OH− anions. The impact of the exchange duration and the ionomer concentrations were investigated as were also the effects of membrane thickness. As we experimentally observed significant differences in optimum ionomer concentration when compared to previous works in the literature, a further aim was to provide a practical guide for catalyst researchers and developers to facilitate full cell performance analysis.
2. Results and Discussion
To explore the best conditions for electrode preparation, three different FAA-3 membranes were tested in the first place to select the appropriate thickness because the thickness of the membrane is a relevant aspect influencing the performance of the MEA. On the one hand, the thinner the membrane, the lower the ionic conduction resistance, thus resulting in a better performance due to a lower ohmic drop. On the other hand, some parameters are favored with a thicker membrane, such as the mechanical stability or the minimization of fuel/oxygen crossover through the polymer electrolyte. This is why a compromise situation usually leads to the best thickness in terms of performance. Fumatech GmbH offers three different thicknesses of their Fumasep® FAA-3 membrane, i.e., 20, 30 and 50 µm thick in dry form.
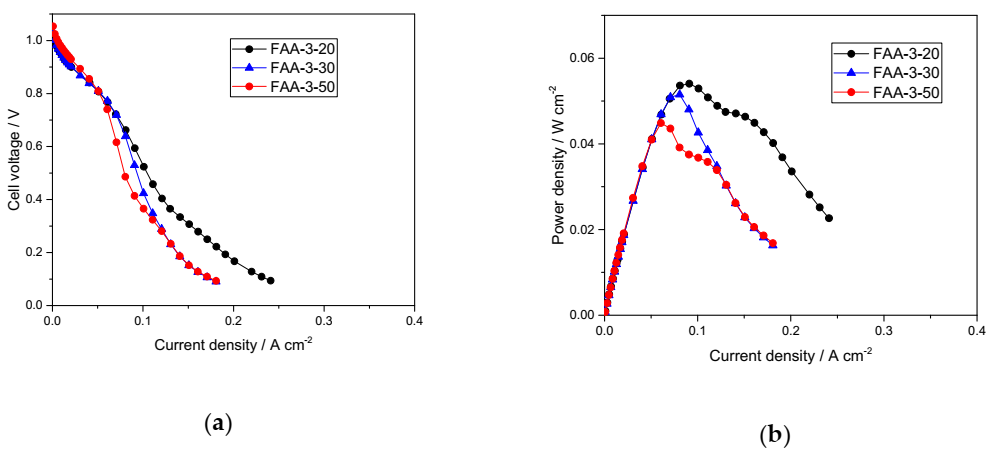
Figure 1 shows the behavior of three MEAs with essentially the same characteristics, where only the membrane was different. As these were the first tests, aimed to single out the most effective membrane, the electrodes were not yet optimized and has room for further improvement. Nevertheless, it is deduced that the performance above 0.05 A cm
−2 increases as the membrane thickness decreases (
Figure 1a). Whereas, the cell voltage in the zone below 0.05 A cm
−2 current density, i.e., in the activation zone, is slightly higher for the thickest membrane (FAA-3-50). This may indicate a detrimental effect of gases crossover.
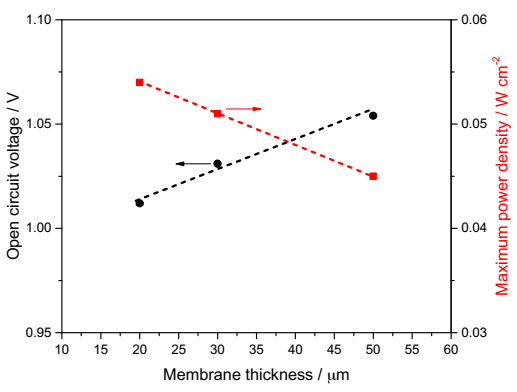
The open circuit voltage (OCV), as an indicator of the extent of hydrogen/oxygen crossover, increases with AAEM thickness from 1.01 V (FAA-3-20) to 1.03 V (FAA-3-30) and to 1.05 V (FAA-3-50). The variation of OCV with membrane thickness is represented in
Figure 2. Whereas, when analyzing the power density curves (
Figure 1b), the results indicate that the ohmic drop is a very relevant aspect. The maximum power density decreases with the increase of membrane thickness up to 17% when passing from 50 μm to 20 μm (
Figure 2). From these experiments, we decided to use FAA-3-20 in order to obtain larger power densities.
According to the indications of the manufacturer (Fumatech GmbH), the as-purchased ionomer Fumion contains bromide as a counteranion in order to stabilize the polymer. One important aspect to be considered in the preparation of electrodes is the ion exchange procedure for the ionomer phase of the catalytic layer. The ink is prepared by dispersing the Pt/C catalyst (40 wt%, Johnson Matthey) and the appropriate amount of Fumion solution (FAA-3-SOLUT-10, 10 wt%) in a water/iso-propyl alcohol mixture. This ink is sprayed on the gas diffusion layer of the electrode (GDL 39BC, Sigracet). The ionomer phase in the resulting electrode thus contains a significant amount of bromide that must be exchanged to OH-form before assembly. Electrodes are treated first in a KCl solution (0.5 M in water/isopropyl alcohol 75/25 vol%), and subsequently in a KOH solution (0.1 M in water/isopropyl alcohol 75/25 vol%). Before assembly, the electrodes are thoroughly washed with deionized water.
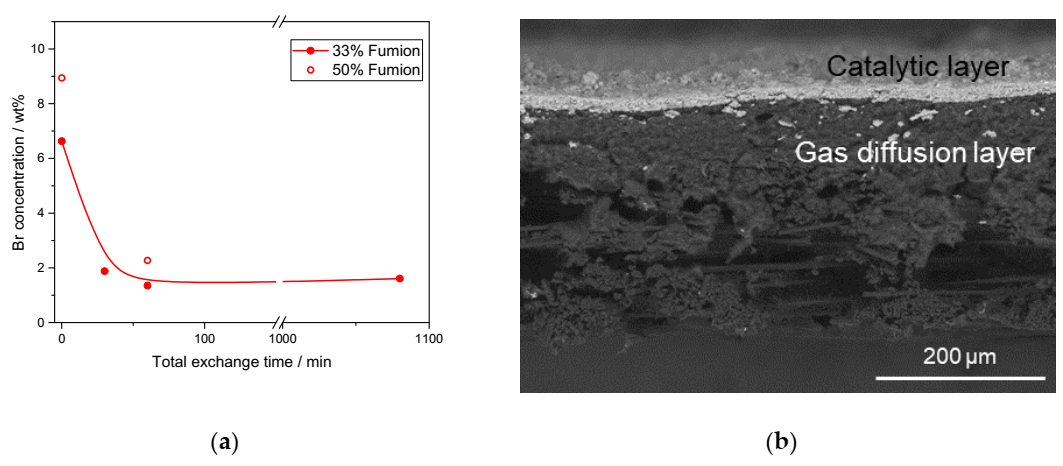
We investigated the effect of KCl exchange duration on the content of bromide in the electrodes, as represented in
Figure 3a, as this step is the most important for a proper electrode composition. The Br
− content was determined by energy dispersive X-ray analysis (EDX) coupled to a scanning electron microscope (SEM). The average values are plotted from at least 5 composition determinations in different areas of each electrode. The catalytic layer is about 9 ± 1 μm thick, as depicted in
Figure 3b.
Clearly, the Br
− content decreases from almost 7 wt% in the untreated electrode to about 2 wt% upon only 30 min exchange, indicating that most of the counteranion is rapidly removed from the ionomer in the electrodes. We tested a longer exchange procedure by leaving the electrode overnight up to a total of 18 h. The Br
− concentration at the electrode was 1.3 wt% and did not significantly change when compared to the electrodes treated for 60 min. This indicates, on the one hand, that there is some residual bromide inside the catalytic layer that is not removed by conventional ion exchange procedures. It can be related to the porous structure of the catalytic layer and the insertion of an ionomer in narrow pores during the ink preparation. Soboleva and coworkers observed that the ionomer distributes on the surface of carbon agglomerates, first covering the intra-agglomerate pores smaller than 20 nm [
28], which would support this hypothesis. On the other hand, it appears that upon a certain duration of ion exchange (>60 min), the bromide content does not change, indicating the approach to maximum Br
− removal. The amount of chloride was found to be negligible if compared to the electrode composition before the ion exchange procedure (<0.5 wt%), thus indicating that Cl
− ions are adequately removed in the treatment with KOH. A similar extent of Br
− removal was observed for a 50 wt% Fumion electrode compared to the 33 wt% Fumion electrode.
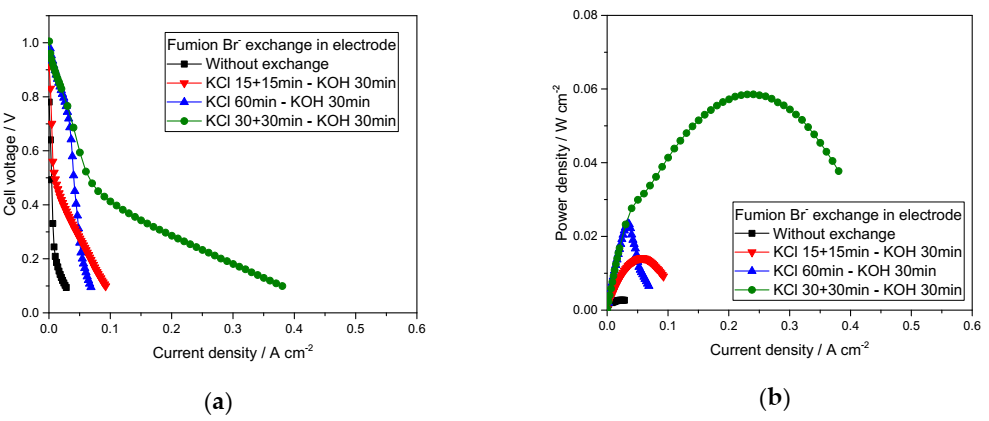
Figure 4 shows the influence of ionomer exchange process on the single cell performance. It must be pointed out that all the exchanged electrodes differed among them in the process of KCl treatment. Clearly, electrodes without the exchange process do not work properly, as the hydroxide conduction is impeded by the presence of bromide anions. Still we observed that, upon some initial activation cycles comprising polarization curves, this MEA is activated to some extent (up to 9 mW cm
−2), but the performance is still very low compared to the MEAs built with electrodes exchanged before assembly.
Two MEAs were based on electrodes exchanged twice in KCl (red and green curves of
Figure 4), with a different duration (15 or 30 min per step), while one MEA was assembled with electrodes exchanged in a single step for 60 min (blue curves in
Figure 4). Interestingly, the total duration of ion exchange mainly affects the low current density region, by comparing KCl 15 + 15 min (red) and KCl 30 + 30 min (green) MEAs, with a cell potential difference among them of about 0.4 V. This is a clear indication of the necessity of a minimum exchange time to effectively remove Br
− ions at the catalyst/ionomer interface, this removal greatly influencing the cell behavior.
On the other hand, using two exchange steps instead of only one clearly promotes the current density at low cell potential by comparing KCl 60 min and KCl 30 + 30 min (blue and green curves of
Figure 4a, respectively). Both MEAs behave exactly the same up to 0.05 A cm
−2. Upon this current density value (0.05 A cm
−2), the MEA based on the electrodes exchanged twice presents a much lower resistance to ion conduction, exhibiting much larger current densities than the counterpart MEA based on electrodes exchanged in a single step. It can be attributed to a larger effectiveness in the ion exchange process when the KCl solution is renewed in the two-step method as the anion interchange relies on anion concentration gradients.
One of the most important parameters conditioning the MEA behavior is the concentration of ionomer (Fumion) in the catalyst layer for both the anode and the cathode. The relative influence of the confluence of three phases in order to maximize electrode performance has been well known for over 20 years [
25]. In the case of proton-conducting ionomers like Nafion
®, an amount close to 30–33 wt% has been historically considered as an optimum to prepare catalyst layers based on carbon-supported platinum catalysts. The optimum AEI amount depends on both the pore structure of the catalyst and the characteristics of the polymers constituting the ionomer. As illustrated in
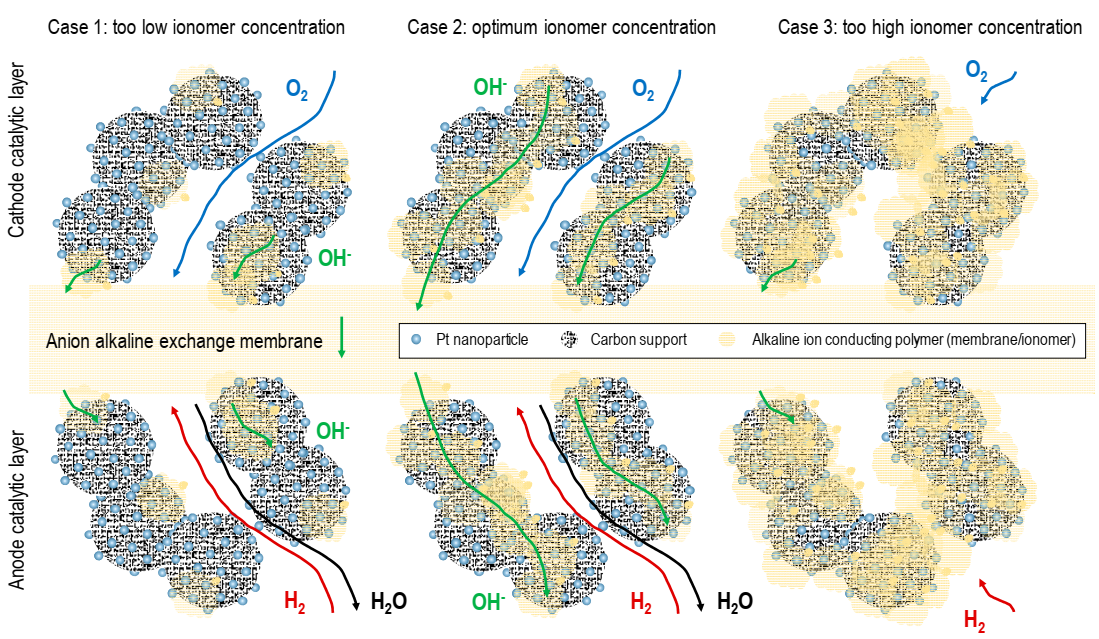
Figure 5, in an AAEM system, O
2 reacts at the cathode providing hydroxide anions that cross the catalytic layer through the ionomer, cross the alkaline membrane, and react at the anode with hydrogen to produce water that is evacuated from it. On the one hand, if the ionomer content is too low, there are not enough OH
− conduction paths to allow the reaction to occur in the whole volume of the electrode, but only on those active sites close to the membrane. On the other hand, an excess of ionomer hinders the mass transfer of oxygen, hydrogen and/or water, with a consequent decrease in performance. Thus, the optimization of the catalyst-to-ionomer ratio for a new ionomer as in the case of Fumion is a very important aspect.
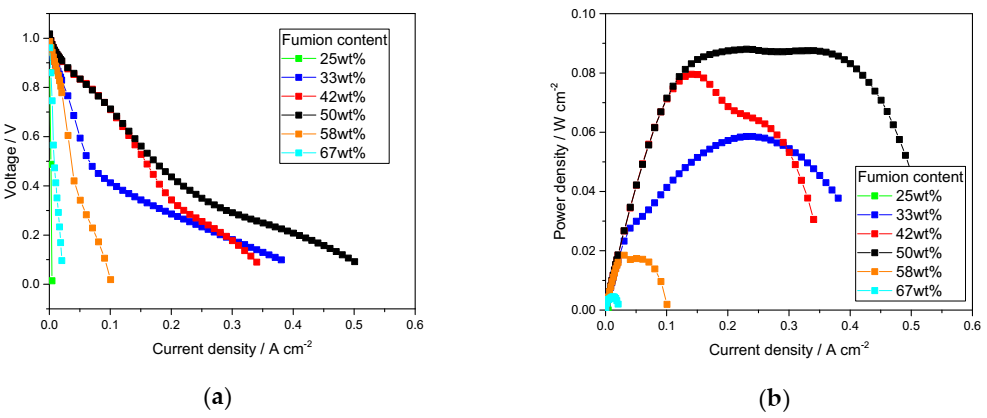
The Fumion content (Br form) was varied from 25 wt% up to 67 wt% at the Pt/C electrode, for both the anode and the cathode. The polarization curves and the power density curves are exhibited in
Figure 6a and
Figure 6b, respectively. Clearly, an ionomer concentration of 25 wt% is not enough to create sufficient ion conducting paths in the catalytic layer, thus this concentration appears to be below the percolation threshold for ion conduction, and the MEA barely performs a few mA cm
−2. This would be associated with Case 1 in
Figure 5. Increasing the Fumion content to 33 wt% has a clear positive effect on MEA behavior. Still, the potential drop in the activation zone when increasing the current density is quite large, with a cell voltage slightly over 0.4 V for a current density of 0.1 A cm
−2. This means that the ionomer content in the catalytic layers is still too low for complete utilization of the Pt/C catalyst. A further increase of Fumion to 42–50 wt% results in a much higher current density at the high voltage region, with barely any difference between curves up to 0.15 A cm
−2. This can be attributed to Case 2 in
Figure 5, i.e., a homogeneous dispersion of AEI on the Pt/C catalyst that minimizes ohmic loses associated with OH conduction at the electrodes (lower voltage/current slope). Fumion content of 58 wt% or above resulted in a significant decrease in cell performance, with power density dramatically dropping more than 75%. This decay can be interpreted as an excess of ionomer blocking the porous structure of the catalyst, as in Case 3 in
Figure 5.
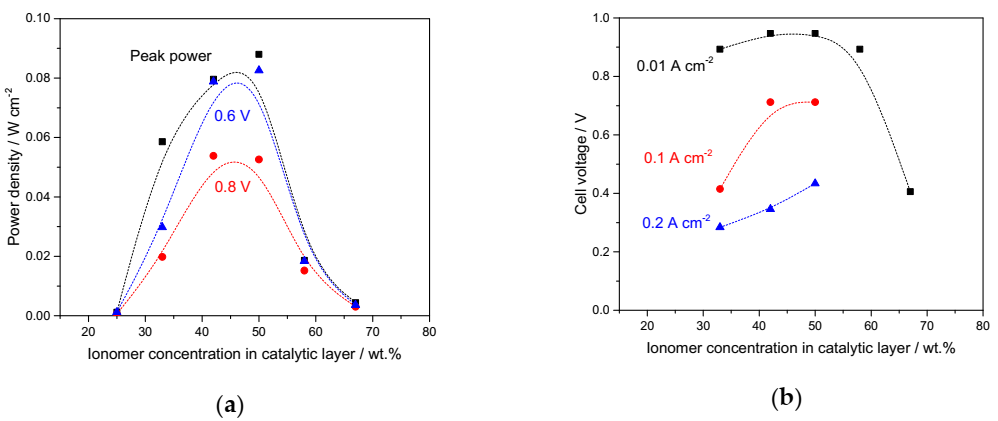
To better illustrate the effect of ionomer concentration on the cell behavior,
Figure 7 includes the variation of power density (
Figure 7a) and cell voltage (
Figure 7b) as a function of the AEI content. It appears that the power density at a relatively high potential presents a maximum value in the interval 40–50 wt% ionomer, whereas the peak power at lower cell voltages are slightly higher at 50 wt% if compared with data recorded with the MEA with 42 wt% (
Figure 7a). A similar conclusion can be drawn from the analysis of cell voltage variation (
Figure 7b). At a low current density (0.01 A cm
−2), the cell voltage barely changes with the ionomer in an interval between 30 and 58 wt%, presenting a maximum voltage at an intermediate concentration. When increasing the current density (0.1–0.2 A cm
−2), the cell voltage is more sensitive to AEI concentration, with maxima at 50 wt% Fumion.
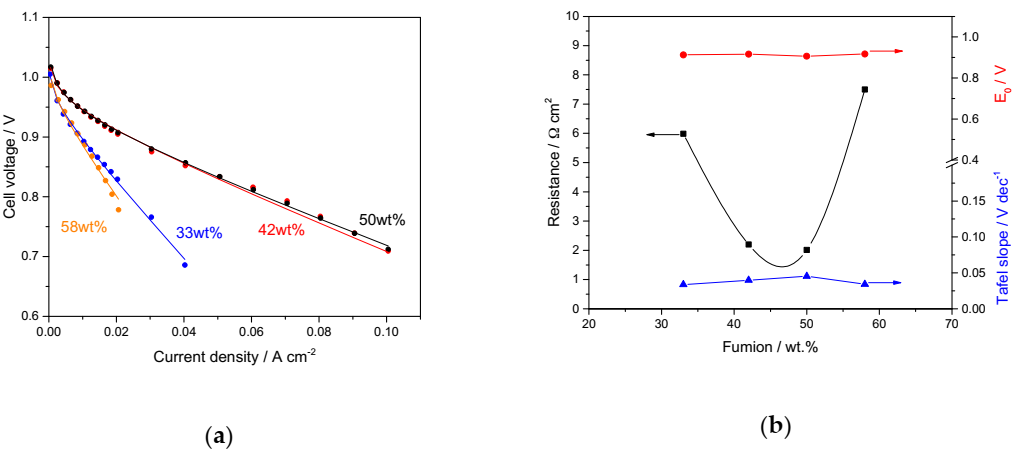
To get a better insight into the voltage-current behavior for the different MEAs, the following equation (Equation (3)) describing the variation of voltage was used to fit the data for intermediate ionomer concentrations (33–58 wt%).
where
E is the cell potential (V),
i is the current density (A cm
−2), b is the Tafel slope (V dec
−1) and R (Ω cm
2) is the cell ohmic resistance.
E0 (V) is a parameter depending on the reversible potential (1.23 V), the exchange current density (
i0) and
b, the Tafel slope, according to Equation (4) [
25].
The fitted plots, together with experimental polarization data, are represented in
Figure 8a for cell voltage values above 0.7 V, while some parameters of interest are plotted against the ionomer concentration in
Figure 8b. Interestingly, cell resistance presents a minimum in the interval 40–50 wt% ionomer. Taking into consideration that all experiments were carried out with the same polymer membrane (FAA-3-20), changes in total resistance must be attributed to the variations in electrode composition. In particular, it appears that the ionomer content greatly influences the total cell resistance. A similar trend was observed for the Nafion
® ionomer, with optimum concentration around 33 wt% [
25]. On the other hand, some electrokinetic parameters like the Tafel slope and the zero-current voltage (
E0) do barely change with ionomer concentration, with values of 0.040 ± 0.005 V dec
−1 for the first one, and 0.91 ± 0.005 V for the second. These parameters are attributed to the catalyst, which does not change within the different MEAs (i.e., Pt/C, 40 wt% Pt).
3. Materials and Methods
With the aim of studying the influence of catalytic layer parameters on the fuel cell performance, we decided to use a commercial Pt/C catalyst (40 wt% Pt, HiSPEC® 4000, Johnson Matthey, London, UK) at both anode and cathode sides. To prepare the electrodes, the desired amount of Pt/C catalyst is well dispersed in an isopropyl alcohol/water solution (67% isopropyl alcohol, Panreac, Spain) with a catalyst concentration of 2 mg mL−1 and with the desired amount of alkaline exchange ionomer in Br form (Fumion, 10 wt%, FAA-3-SOLUT-10, Fumatech GmbH, Bietigheim-Bissingen, Germany). The utilization of isopropyl alcohol (instead of other alcoholic substances like ethanol or methanol) was decided to prevent the damage of the ionomer. This ink was sprayed on the surface of a commercial gas diffusion layer from Sigracet (GDL 39BC, SGL Carbon, Wiesbaden, Germany) until the target loading of platinum is reached (0.5 mg cm−2 ± 0.08 mg cm−2) for all the electrodes.
The commercial Fumion ionomer solution contains bromide ions to preserve the polymer characteristics for longer periods of time. In order to remove Br− from the electrodes, they were exchanged with a 0.5 M KCl solution by full immersion of the electrode, followed by treatment in a 0.1 M KOH solution. Both solutions were prepared in a water/isopropyl alcohol mixture (3/1 volume ratio) due to the high hydrophobicity of the as-prepared electrodes. Then the electrodes were thoroughly washed with water just before membrane-electrode assembly. Different durations for each one of the stages of electrode ion exchange were investigated to better identify the most convenient process.
The alkaline membranes were also purchased from Fumatech GmbH (Bietigheim-Bissingen, Germany). We investigated three different thicknesses, namely 20 µm (FAA-3-20), 30 µm (FAA-3-30) and 50 µm (FAA-3-50) in dry form. As-purchased membranes are received in bromide form to preserve their original properties. In order to remove Br− anions and exchange quaternary ammonium groups with OH− anions, the membranes were treated following the recommendations of the manufacturer.
Fuel cell experiments were carried out in a 5 cm2 single cell, with serpentine flow channel, Fuel Cell Technologies Inc. (Albuquerque, NM, USA) hardware and a fuel cell station of the same manufacturer. Cell temperature was maintained with external heating at 50 °C as measured at the cathode side, close to the flow channel. Pure hydrogen and oxygen, pre-heated to 55 °C, were fed to the cell, fully humidified, at flow rates corresponding to 1.3 and 1.5 the stoichiometric value, respectively (minimum flow of 20 and 50 cm3 min−1, respectively). A backpressure of the 150 kPa gauge was used in all experiments. Experimental data were fitted to Equation (3) considering the least squares method and some boundary conditions as follows: b was allowed to vary between 0.03 and 0.12 V dec−1, i0 between 10−12 and 10−3 A cm−2 and R between 0.1 and 10 Ω cm2.
The bromide and chloride content at the electrodes were quantified by means of Energy dispersive X-ray (EDX) analyses. An EDX analyzer Röntec XFlash Si(Li) (Röntec GmbH, Berlin, Germany) coupled to a Hitachi S-3400N (Hitachi, Tokyo, Japan) scanning electron microscope (SEM) was used. The chemical composition was calculated from the average values of at least 5 analyses in different zones on the same electrode. SEM images were recorded with backscattered electrons to better assess the catalytic layer, since the presence of platinum from the catalyst results in a much brighter signal than the layers corresponding to the gas diffusion layer at the electrode paper.

 ,
, 


