Article

Acetonitrile’s Effect on the Efficiency of Ethanol Electrooxidation at a Polycrystalline Pt Electrode in Relation to pH-Dependent Fuel Cell Applications

by
Bogusław Pierożynski
1,*,
Tomasz Mikołajczyk
1,*,
Mateusz Łuba
1,
Paweł Wojtacha
2 and
Lech Smoczyński
1
1
Department of Chemistry, Faculty of Environmental Management and Agriculture, University of Warmia and Mazury in Olsztyn, Łódzki Square 4, 10-727 Olsztyn, Poland
2
Department of Industrial and Food Microbiology, Faculty of Food Science, University of Warmia and Mazury in Olsztyn, Cieszyński Square 1, 10-726 Olsztyn, Poland
*
Authors to whom correspondence should be addressed.
Catalysts 2020, 10(11), 1286; https://doi.org/10.3390/catal10111286
Submission received: 3 October 2020 / Revised: 26 October 2020 / Accepted: 3 November 2020 / Published: 5 November 2020
(This article belongs to the Special Issue Catalyst Deactivation in Hydrocarbon Processing)

Abstract

:
The present paper reports cyclic voltammetric and a.c. impedance spectroscopy investigations on the influence of the acetonitrile concentration on the kinetics (and individual product’s efficiency) of the ethanol oxidation reaction (EOR), performed on a polycrystalline Pt electrode surface in 0.5 M H2SO4 and 0.1 M NaOH supporting solutions. The kinetics of the EOR were examined at room temperature over the voltammetric potential range, which covers the electrooxidation of surface-adsorbed COAds species, as well as the formation of acetaldehyde molecules. In addition, the time-dependent efficiency of acetate and acetaldehyde formation in relation to the initial acetonitrile content for both acidic and alkaline electrolytes was evaluated by means of spectrophotometric Ultraviolet/ Visible Spectroscopy (UV-VIS) instrumental analysis.

1. Introduction

The process of the electrochemical oxidation of alcohols has a direct application in the so-called Direct Alcohol Fuel Cells (DAFCs). As ultra-pure hydrogen fuel allows significantly greater electric efficiencies to be reached than aliphatic alcohols in a Proton Exchange Membrane (PEM) fuel cell, H2 production, storage, and large-scale distribution still constitute significant technical problems. Conversely, the use of alcohols as hydrogen carriers in a DAFC device is beneficial, as liquid alcohol involves simplified fuel storage and distribution systems. In fact, methanol and ethanol are the most frequently investigated alcohols for PEM fuel cell applications, where C2H5OH is regarded as a promising substitute for CH3OH, due to its considerably higher (8.0 vs. 6.1 kWh kg1) energy-density and the relatively low toxic properties of ethanol oxidation by-products (acetaldehyde and acetic acid). In addition, it has to be stressed that ethanol is a renewable resource as it can be produced from a variety of available agricultural-based products and biomass substrates [1,2,3,4,5,6,7,8,9,10,11].
The process of ethanol electrooxidation on platinum-based catalyst surfaces (the most important catalyst known in electrochemistry) is a complex anodic reaction, involving the formation of various, surface-adsorbed intermediates. It is commonly accepted [2,11,12,13] that following the surface electrosorption step, the C2H5OH molecule can either dissociate to surface-adsorbed COAds species, or become electrooxidized to form acetaldehyde. Afterwards, in the presence of adsorbed hydroxyl groups, successive oxidation steps lead to the formation of carbon dioxide or acetic acid molecules, which eventually become desorbed from the catalyst surface. A number of various catalyst materials have been extensively studied (both in acidic and alkaline media) in relation to the ethanol electrooxidation reaction. These include bulk polycrystalline and single-crystal planes of Pt [3,9,13,14,15,16,17], PtRu [2,18,19,20], PtRh [2,12,19,20], PtSn [1,2,6,7,15,21], PtPd [8,9], and many other alloys/co-deposits of Pd2Sn [22], Pd2Ru/C [23], or metal oxides [10,11] (typically on carbon substrates). In fact, Pt-PbOx and Pd-CeO2 binary nanocomposite systems were found [11] to be two of the most efficient ethanol oxidation reaction (EOR) catalysts with respect to their C-C bond cleavage capabilities. On the other hand, the electrooxidation of CO species adsorbed on the electrode surface was found to occur at lower potentials on catalysts containing Sn and SnO2 additives when compared to single platinum group metals (e.g., Pd, Pt, and Rh) and their binary composites (e.g., Pt-Rh/C and Pd2Ru/C) [23,24].
Moreover, the development of similar noble metal-based catalysts has been accelerated due to their high electrochemical activity in oxidation reactions of various organic compounds and the oxygen evolution reaction (OER), in relation to water electrolysis processes. The above is dictated by the development of global trends in environmental protection concentrated on the reduction of anthropological pollutants. Modern works on this topic include articles on carbon-supported Pt- and Pd-nanoparticle catalysts, e.g., Ru0.9Pt0.1O2/C, Pt/C-LiCoO2, and PtIr2 alloy/C [25,26,27,28]. An advantage of such systems over bulk-type catalysts is related to their extended electrochemically active surface area (technological applications). However, only research activities conducted on basic (bulk-type) catalysts allow complete investigations of the reaction mechanisms (along with the individual stages), including important information on the catalyst’s structural selectivity (see, e.g., refs. [29,30,31] for details).
As numerous organic molecules are susceptible to the catalytic surface electrosorption and reactivity phenomena, the presence of airborne organic compounds might have a significant impact on the performance of PEM fuel cells. Acetonitrile (AcN), with the chemical formula CH3CN, is a highly polar and volatile organic solvent that is commonly used in various industrial applications, including extraction, plastic molding and casting, and some battery technologies. Therefore, its presence in the air can have a substantial (detrimental or positive) effect on the catalytic performance of noble metal-based electrochemical catalyst materials [32,33,34,35,36,37]. This work presents a comprehensive electrochemical study of the process of ethanol oxidation on a polycrystalline Pt electrode in 0.5 M H2SO4 and 0.1 M NaOH supporting solutions, examined comparatively in the absence and presence of acetonitrile, at the set AcN concentrations.

2. Results and Discussion

2.1. Electrooxidation of Ethanol by Cyclic Voltammetry in the Absence and Presence of Acetonitrile

The cyclic voltammetric behavior of the influence of acetonitrile on the process of ethanol electrooxidation (at 0.25 M C2H5OH) on a polycrystalline Pt electrode surface in 0.5 M H2SO4 and 0.1 M NaOH solutions is shown in Figure 1a–c below. For the experiments carried out in sulphuric acid supporting electrolyte, two oxidation peaks, centered at ca. 0.80 and 1.30 V vs. a reversible Pd hydrogen electrode (RHE), appear upon an anodic sweep (see the green plot in Figure 1a). Then, when the Cyclic Voltammetry (CV) sweep is reversed towards the hydrogen reversible potential, a single anodic peak, centered at about 0.60 V, appears in the CV profile. Ethanol electrooxidation follows a surface adsorption step of ethanol molecules, which most likely takes place over the potential range of ca. 0.20–0.40 V, partly in parallel with underpotentially deposited (UPD) H ionization from the Pt surface (see an inset to Figure 1a). The lowest potential oxidation peak (0.60 V) is typically assigned in the literature to the process of the oxidation of surface-adsorbed COAds species, while that observed at 0.80 V is assigned to the formation of acetaldehyde [3,13,14,16]. On the contrary, the highest potential anodic peak, observed over the potential range of 1.10–1.50 V, corresponds to the oxidation process with the involvement of surface-adsorbed, oxygen-based species.
Then, the introduction of acetonitrile into the electrolyte results in a successive, radical diminution of the maximum measured current-density and the voltammetric charge with respect to the 0.6 and 0.8 V oxidation processes (see the black, red, and blue plots in Figure 1a for the AcN concentrations of 1.85 × 10⁵, 1.85 × 10⁴, and 1.85 × 10³ M, correspondingly). It is strongly believed that this phenomenon is associated with substantial inhibition of the Pt surface adsorption of C2H5OH molecules, due to extensive AcN co-adsorption, along with the repulsive interaction of such-formed entities on the surface of a polycrystalline platinum electrode (see a plausible model for the C2H5OH/CH3CN Pt surface co-adsorptive interaction in Scheme 1 below).
On the other hand, Figure 1b presents the influence of acetonitrile on the process of C2H5OH electrooxidation on a poly Pt electrode, but examined in 0.1 M NaOH solution. Hence, a single oxidation peak, positioned at ca. 0.95 V vs. RHE (again, assigned to the formation of acetaldehyde), appears upon an anodic sweep. Then, when the cyclic voltammetry sweep is reversed towards the hydrogen reversible potential, another oxidation peak (centered at ca. 0.70 V: oxidation of surface-adsorbed COAds species) arises in the CV profile (black plot in Figure 1b; also see the cyclic voltammetric profile of a poly Pt electrode in ethanol-free 0.1 M NaOH solution in an inset to this figure). Contrary to the behavior in sulphuric acid, the influence of AcN on the process of ethanol electrooxidation (apart from some shift of the peak potential points towards less positive potentials) is radically less evident in sodium hydroxide supporting electrolyte, even at the highest concentration of acetonitrile (compare the black plots with red, blue, and green plots in Figure 1b, respectively).
Interestingly, a significantly higher acetonitrile concentration (0.25 M AcN) was needed to cause a radical impediment (through Pt surface blockage) of the ethanol oxidation process in NaOH (Figure 1c). A key point in the observed difference for the EOR between H2SO4 (with almost complete surface blockage in the presence of 0.25 M AcN, observed over the potential range of 0.4–1.1 V) and NaOH supporting electrolytes is related to the concurrent adsorption of hydroxyl (OH) anions, which become electrosorbed in sodium hydroxide over the potential range characteristic of the process of ethanol oxidation. Surface-adsorbed OH species not only tend to stabilize (via dipole–dipole interactions) the Pt-adsorbed ethanol molecules, but also prevent the extensive adsorption of acetonitrile molecules. The latter is in line with the conclusions of recently published work from this laboratory (see Ref. [8,38] given there), where, contrary to the conditions encountered in sulphuric acid, acetonitrile adsorption in NaOH was practically limited to the potential range positive to that of UPD of H.

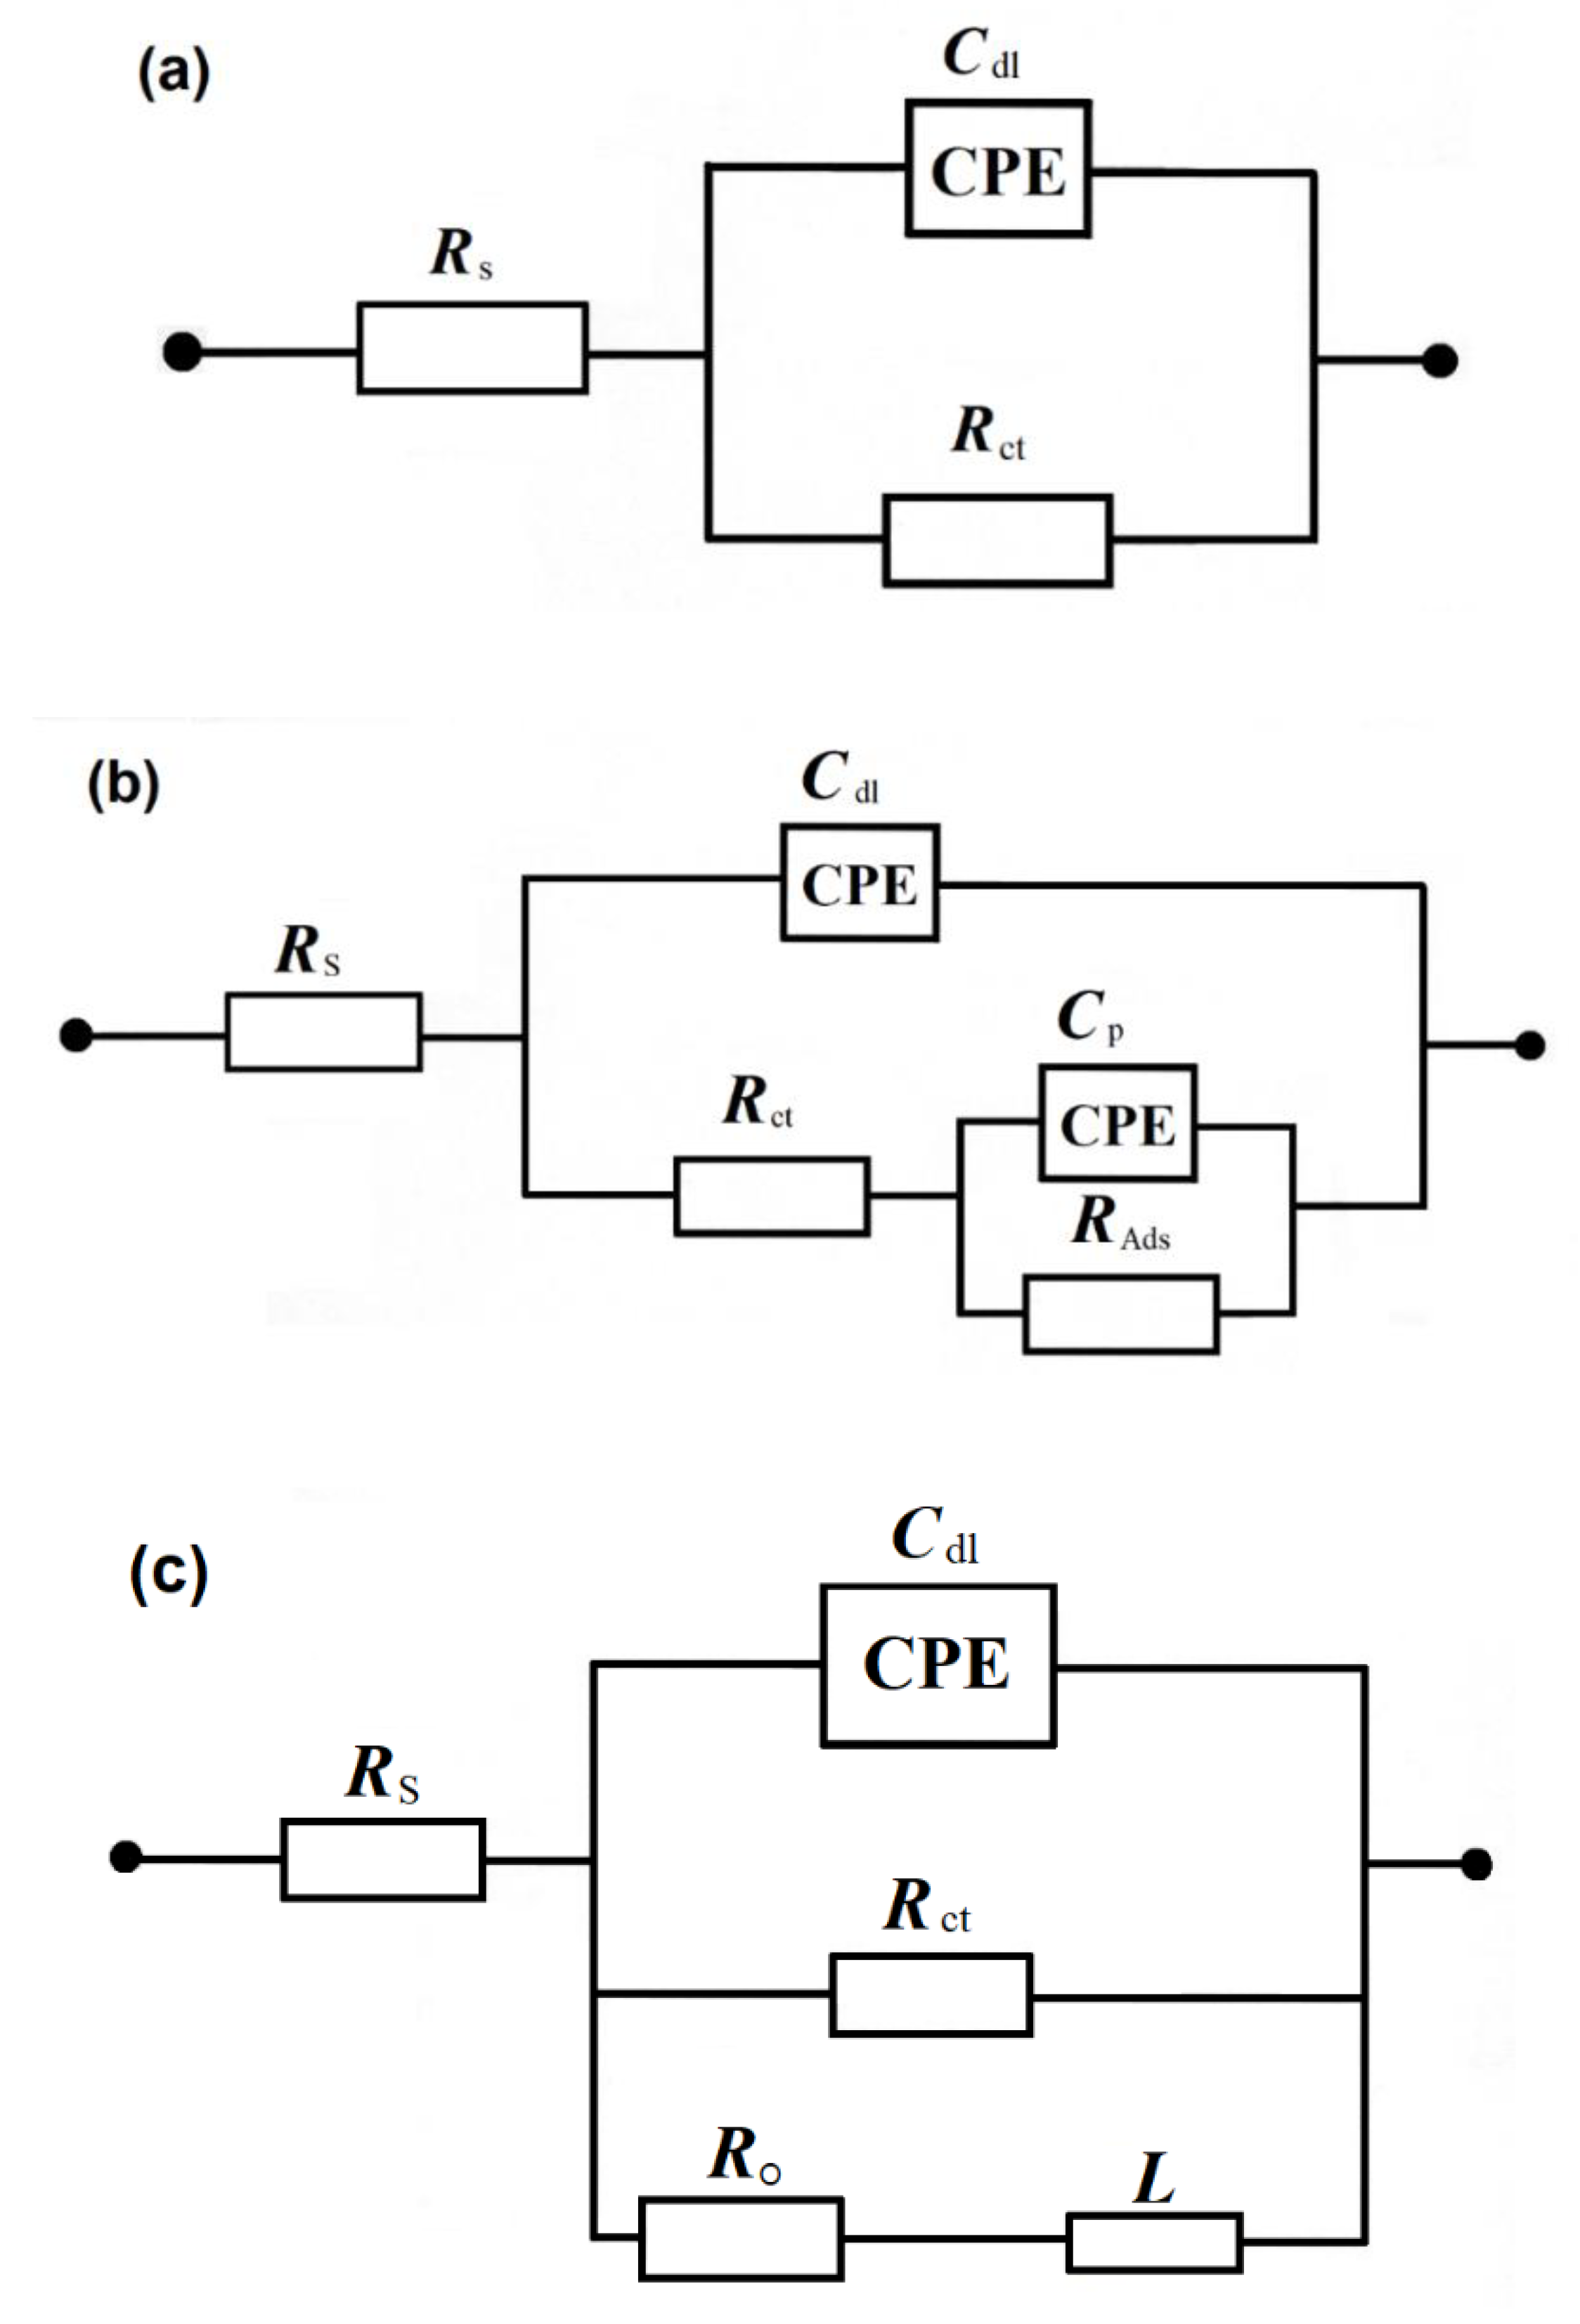
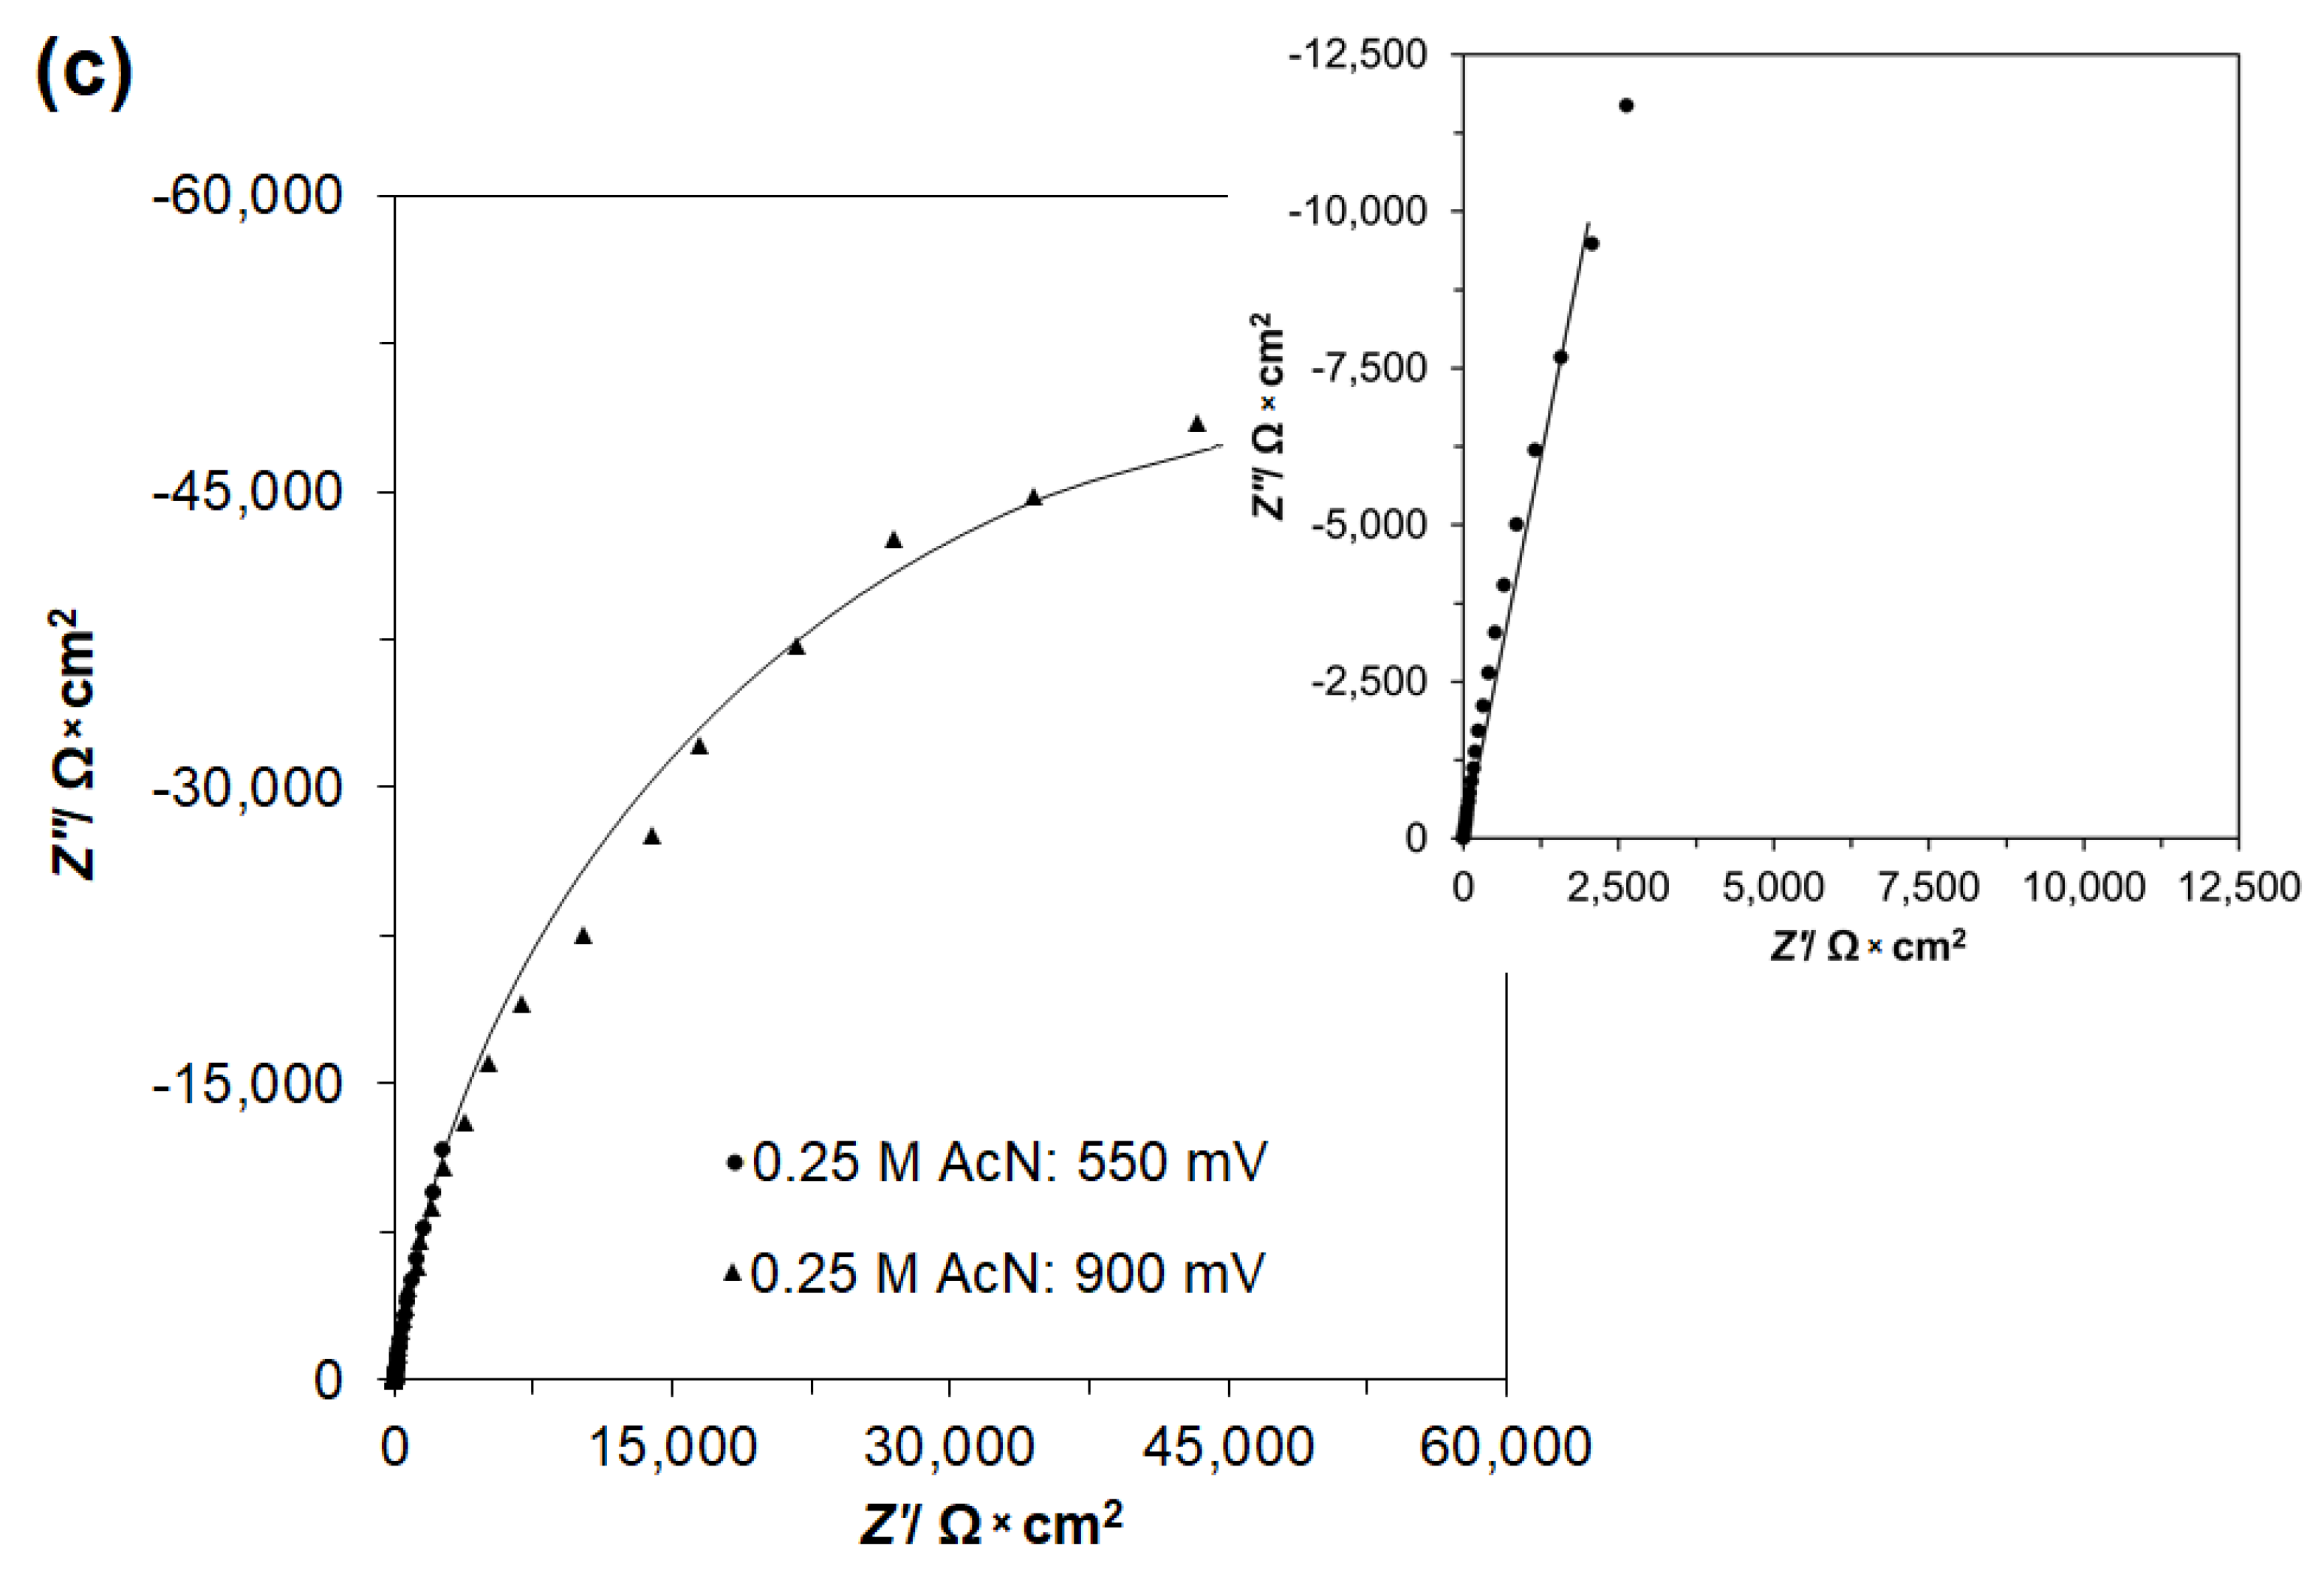
2.2. Influence of AcN on Ethanol Electrooxidation by a.c. Impedance Spectroscopy

The a.c. impedance behavior of the process of ethanol electrooxidation (in the absence and presence of CH3CN) on the polycrystalline Pt electrode surface in 0.5 M H2SO4 and 0.1 M NaOH supporting solutions is presented in Table 1 and Table 2, as well as Figure 2a–c (equivalent circuit models employed to fit the recorded impedance data), Figure 3a–c and Figure 4a–c.
A single partial semicircle (related to the process of ethanol electrooxidation in H2SO4) appears at the potential of 550 mV in the Nyquist impedance plot (see Figure 2a and Figure 3a below). It should be noted, however, that a radical detrimental effect of acetonitrile on the recorded charge-transfer resistance Rct parameter could only be observed for the two highest AcN concentrations of 1.85 × 10³ and 0.25 M AcN. Here, the Rct resistance values were 1524, 2460, and 131,404 Ω × cm2 for AcN-free, 1.85 × 10³, and 0.25 M AcN (see Figure 3c) working in 0.5 M H2SO4 + 0.25 M C2H5OH electrolyte, correspondingly. This behavior reflects a prevailing, acetonitrile Pt surface adsorption effect over that for ethanol molecules (also see Scheme 1 above), being simultaneously in line with the cyclic voltammetry features observed in Figure 1a. Then, for the potential ranges of 650–900 mV ([AcN] = 0 and 1.85 × 10⁵ M) and 700–900 mV ([AcN] = 1.85 × 10⁴ and 1.85 × 10³ M), the impedance spectra are characterized by two partial semicircles (an inset to Figure 3b shows an example of a high frequency arc). Here, the high frequency semicircle response represents the reaction charge-transfer process (Rct, Cdl), whereas a low frequency response would be associated with the surface adsorption of reaction intermediates (RAds, Cp). As can be seen in Table 1, all recorded RAds and also some high potential Rct resistances exhibited negative values (also refer to the corresponding Nyquist plots with a negative real impedance part in Figure 3b). The above is indicative of instability within the examined electrochemical system, which most likely involves surface oscillation of the adsorbed reaction intermediates (also see Refs. [39,40,41,42,43] for details). Most importantly, increasing the AcN concentration (along with rising AcN platinum surface adsorption) generally caused augmentation of the Rct and RAds resistance parameters (their absolute values), where simultaneously absolute values of the adsorption resistance parameter became considerably reduced upon a rising electrode potential (see Table 1 for details).
On the other hand, the double-layer capacitance values Cdl showed significant fluctuations, from about 20 up to ca. 72 μF × cm2 (irrespective of the AcN concentration), where Cdl increased above the value of 20 μF × cm2 commonly used in the literature for smooth and homogeneous surfaces [44,45] could imply some contribution from the surface adsorption processes. At the same time, the pseudocapacitance Cp parameter exhibited reduction upon a rising electrode potential, e.g., from 69.1 μF × cm2 at 650 mV to 48.8 μF × cm2 at 900 mV vs. RHE for the AcN-free H2SO4/C2H5OH solution. A deviation from the purely capacitive behavior required the use of the Constant Phase Element (CPE) components in the equivalent circuits (see Figure 2a,b). Here, this “capacitance dispersion” effect could be assigned to increasing Pt surface inhomogeneity, and a combination of repeatedly carried out flame-annealing procedures and extended potentiostatic impedance measurements [46,47,48]. In addition, the values of dimensionless φ1 and φ2 parameters for the CPE components oscillated between 0.62 and 0.94.
Furthermore, Table 2 and Figure 2a,c and Figure 4a–c present the a.c. impedance spectroscopy examination of the ethanol (again, at 0.25 M C2H5OH) electrooxidation reaction at the polycrystalline Pt electrode, but in 0.1 M NaOH supporting solution. In the absence of acetonitrile for the potentials of 600 and 675 mV (refer to the respective CV profile in Figure 1b), the corresponding Nyquist impedance spectra are characterized by a partial semicircle over the high frequency range and an inductive loop, exhibited over the low frequency end (Figure 4a). The presence of the inductive loop (also see the associated inductive resistance RO and inductance L parameters in Table 2) is most likely related to the process of oxidative COAds species removal from the Pt surface, thus leading to the release of platinum active sites [6,8]. Then, a single semicircle is present at 800 mV in the impedance spectrum, in relation to the surface formation of the acetaldehyde molecule (Figure 4b). The presence of CH3CN in NaOH does not seem to have any detrimental effect on the process of C2H5OH electrooxidation, until the AcN concentration exceeds the value of 1.85 × 10³ M. On the contrary, the recorded charge-transfer resistance values seem to be inversely proportional to the rise in acetonitrile concentration (e.g., refer to a series of Rct values, derived at 600 mV, of 2211, 1648, 1558, and 598 Ω × cm2, recorded for the CH3CN concentrations of 0, 1.85 × 10⁵, 1.85 × 10⁴, and 1.85 × 10³ M, respectively).
Therefore, it could be concluded that CH3CN (except for the highest 0.25 M concentration) was found to cause significant facilitation of the EOR in NaOH supporting solution, which the authors believe could be due to additional [CH3…..H] interactions (facilitating alcohol dehydrogenation) between the surface-adsorbed species, as illustrated in Scheme 2 below. This finding could additionally be supported by a radical difference in the recorded voltammetric current-densities between acidic and alkaline supporting electrolytes, as shown in Figure 1a,b, correspondingly. In addition, as argued by Briega-Martos et al. in Ref. [49] (on the role of acetonitrile in electrocatalytic enhancement of the HCOOH oxidation reaction), the fact that relatively low acetonitrile concentrations lead to EOR facilitation might also result from the so-called CH3CN “promoting effect”, due to its ability to block Pt sites from the extended formation of COAds species or through stabilizing dipole–dipole interactions with the surface-adsorbed reaction intermediates, e.g., acetaldehyde.
In fact, in the presence of 0.25 M AcN, the Rct resistance becomes radically increased (especially at the potential of 800 mV to over 16.000 Ω × cm2, see Figure 4c). These findings are totally in line with those previously documented (for 0.1 M NaOH solution) by the cyclic voltammetry behavior in Figure 1b,c, where the recorded maximum voltammetric current-density in Figure 1c (0.25 M CH3CN) only reached about 20% of that recorded in the presence of 1.85 × 10³ M AcN. Moreover, the Cdl parameter exhibited similar fluctuation (ca. 19–109 μF × cm2) to that observed for sulphuric acid supporting solution presented in Table 1, whereas the values of dimensionless parameters φ3 and φ4 oscillated between 0.87 and 0.99. Deterioration of the EOR kinetics at a very high concentration of acetonitrile is undoubtedly a result of very limited C2H5OH adsorption, due to the prevalent Pt surface co-adsorption of CH3CN molecules.

2.3. Spectrophotometric UV-VIS Analysis of Ethanol Oxidation Products

The assessment of acetaldehyde and acetate contents was performed by means of the UV-VIS spectrophotometry technique. The derived concentration values of ethanol oxidation by-products were in fairly good agreement with the results of the electrochemical measurements for both supporting solutions.
Increased CH3CN concentrations in the H2SO4-based solution resulted in a significant reduction of the EOR by-products’ generation rate. After 3 min of continuous electrooxidation, the concentration of acetaldehyde reached ca. 0.12, 0.04, and 0.03 M for the following solutions: AcN-free, 1.85 × 10⁵, and 0.25 M CH3CN, correspondingly. Analogous behavior was observed for the recorded acetate concentrations of about 0.10, 0.02, and 0.02 M for the baseline solutions of AcN-free, 1.85 × 10³, and 0.25 M CH3CN, respectively. Then, after the initial three minutes of the process, the current-density became significantly impeded for all examined sulfuric acid-based experimental samples, resulting in no noticeable differences between the by-product concentrations in the further ongoing EOR process. The above was most likely caused by the poisoning effect of the Pt electrochemically active surface by the reaction products, mainly the COAds species.
Figure 5a,b below present the changes of CH3CHO and CH3COO- concentrations, recorded as the time of the ethanol electrooxidation process in 0.1 M NaOH-based solution, respectively. Here, the reaction time (up to 30 min), along with initial AcN content, had practically no influence on the resulting concentrations of the products. The catalytic decomposition of ethanol (under the influence of acetonitrile upon solution electrolysis) led (primarily) to the formation of acetaldehyde and acetic acid (or rather acetate ions) molecules. The observed fluctuation of the recorded concentrations of acetaldehyde and acetate over the duration of electrolysis resulted from the fact that both CH3CHO and CH3COO species are characterized by a high water solubility and volatility (high vapor pressure), in addition to their well-known surface adsorption properties. In other words, during the course of the experiment, one should expect equilibrated concentration (with some fluctuation) behavior of the product, rather than its continuous increase, which is totally in line with the findings of Figure 5.

3. Materials and Methods

3.1. Solutions and Solutes

High-purity electrolytes were made from water derived from an 18.2 MΩ Direct-Q3 UV ultra-pure water purification system from Millipore-Merck (Burlington, MA, USA). Aqueous, 0.5 M H2SO4, and 0.1 M NaOH solutions were prepared from sulphuric acid of the highest purity available (SEASTAR Chemicals, Sidney, BC, Canada) and AESAR, 99.996% sodium hydroxide pellets, correspondingly. Ethanol (POCH, pure, p.a., Gliwice, Poland) was used to prepare acidic and alkaline solutions at concentrations of 0.25 M C2H5OH. In addition, acetonitrile (electronic grade, 99.999% trace metals basis, Sigma-Aldrich (Saint Louis, MO, USA)) was introduced to the solutions by means of Eppendorf micro-pipettes to obtain AcN concentrations of 1.85 × 10⁵, 1.85 × 10⁻⁴, 1.85 × 10⁻³, and 0.25 M. Before conducting the experiments, all solutions were de-aerated with high-purity argon (Ar 6.0 grade, Linde (Kraków, Poland)), whose flow was maintained above the solutions’ mirror during all electrochemical experiments.

3.2. Electrochemical Cell and Electrodes

An electrochemical cell, made of Pyrex glass, was used during the course of this work. The cell comprised three electrodes: A polycrystalline Pt (1 mm diameter 99.9985% Pt wire: AESAR/Puratronic, SA = 0.64 cm2) working electrode (WE) in a central part; a reversible Pd hydrogen electrode (RHE; coiled 0.5 mm diameter, 99.9% purity Pd wire, Sigma-Aldrich (Saint Louis, MO, USA), sealed in soft glass) as a reference; and a Pt counter electrode (CE; coiled 1.0 mm diameter, 99.9998% purity Pt wire, Johnson Matthey, Inc. (London, UK), also sealed in soft glass), in separate cell sections. Before its use, the Pd RHE was cleaned in hot sulphuric acid, followed by cathodic charging with hydrogen in 0.5 M H2SO4 (at a current of IC = 20 mA), until large quantities of H2 bubbles in the electrolyte were distinctly observed. Both the working and counter electrodes, prior to their use, were flame-annealed and quenched with ultra-pure water.
In order to minimize the ohmic resistance (IR) drop, the Luggin capillary was placed at the center of the cell (also, a 0.5 mm diameter Pt wire was inserted between and within the tip of the Luggin capillary and the RHE reference compartment). Prior to each series of experiments, the electrochemical cell was taken apart and soaked in hot sulphuric acid for 3 h. After cooling down to ca. 30–35 °C, the cell (along with all of its components) was carefully rinsed with Millipore ultra-pure water.

3.3. Electrochemical and other Equipment

Cyclic voltammograms were recorded at room temperature (296 K), at a sweep rate of 50 mV s−1, by means of the Solartron 12,608 W Full Electrochemical System (1260 frequency response analyzer–FRA + 1287 electrochemical interface (EI)) (Solartron Group, Farnborough, UK). For a.c. impedance measurements, the 1260 FRA generator provided an output signal of a 5 mV amplitude and the frequency range was kept between 1.0 × 10⁵ and 0.5 × 10⁻¹ Hz. The instruments were controlled by ZPlot 2.9 or Corrware 2.9 software for Windows (Scribner Associates, Inc., Southern Pines, NC, USA). The impedance results presented in this work were obtained through the selection and analysis of representative data series, where two to three impedance measurements were carried out at each potential value. The reproducibility of such-recorded results was below 10% from one measurement to another. The impedance data analysis was performed with the ZView 2.9 (Scribner Associates, Inc., Southern Pines, NC, USA) software package, where the spectra were fitted by means of a complex, non-linear, least-squares immitance fitting program—LEVM 6—written by Macdonald [50]. Two equivalent circuits for identified charge-transfer surface processes, including constant-phase elements (CPEs) to account for distributed capacitance, were employed to analyze the obtained impedance results, as shown in Figure 2a–c in the Results and Discussion section.

3.4. Assessment of Acetaldehyde and Acetate Contents upon Progress of the Ethanol Electrooxidation Reaction

Ethanol electrooxidation trials (at 0.25 M C2H5OH) were performed for both H2SO4 and NaOH supporting solutions over the period of 30 min for the following AcN concentrations: 0, 1.85 × 10⁻³, and 0.25 M CH3CN. The trials involved continuous CV cycling (at the sweep rate of 50 mV s−1) over the working electrode potential range of 0.4–1.0 V/RHE.
In order to evaluate the content of acetaldehyde, the reaction of aldehydes with a Schiff’s reagent (commercial reagent, Chempur, Piekary Śląskie, Poland) was used. The collected samples (acidic ones after alkalization to a pH of about 9.0) were initially mixed with Schiff’s reagent at a 1:2 volume ratio and incubated for 10 min at room temperature. On the contrary, a color reaction with iron III chloride was used to determine the concentration of acetate ions in working electrolyte samples. For this purpose, the samples were mixed with 0.1 M FeCl3 × 6H2O solution (POCH, Gliwice, Poland) again at a 1:2 volume ratio, and incubated for 10 min at room temperature. Then, absorbance values were derived through spectrophotometric measurements, carried out at wavelengths of λ = 550 nm (acetaldehyde samples) and λ = 450 nm (acetate specimens) by means of an EPOCH 2 plate reader (BioTek, Winooski, VT, USA). The obtained results were then compared with the standard curves.

4. Conclusions

The ethanol oxidation reaction (EOR) gains its technological importance through the application of ethanol solution in direct ethanol fuel cell devices. A combination of a.c. impedance spectroscopy and cyclic voltammetry electrochemical techniques, and spectrophotometric UV-VIS analysis (necessary to assess the efficiency of key reaction products), allowed us to effectively examine the influence of acetonitrile (an important industrial solvent and possible environmental contaminant) on the kinetics of the ethanol electrooxidation reaction, performed on a polycrystalline platinum electrode surface.
The obtained results provided evidence for a significant and damaging role of Pt surface-adsorbed acetonitrile in the process of ethanol oxidation in sulphuric acid solution. On the contrary, under alkaline experimental conditions, adsorbed CH3CN molecules (at relatively low concentrations) could function as the reaction-promoting element through mutual dipole–dipole stabilizing interactions, which, except for acetonitrile, also include hydroxyl OH species and surface-adsorbed reaction intermediates. In the latter case, the EOR becomes radically facilitated, which implies the significant importance of alkaline-based DAFC technologies, under frequently encountered environmental (industrial) conditions.

Author Contributions

Conceptualization, B.P.; methodology, B.P.; investigation, M.Ł., T.M., and P.W.; data curation, T.M. and M.Ł.; writing—original draft preparation, B.P.; editing, B.P. and T.M.; supervision, L.S. All authors have read and agreed to the published version of the manuscript.

Funding

Project financially supported by the Minister of Science and Higher Education in the range of the program entitled “Regional Initiative of Excellence” for the years 2019–2022, Project No. 010/RID/2018/19, amount of funding 12,000,000 PLN.

Acknowledgments

This work has been financed by the internal research grant no. 20.610.001-300, provided by The University of Warmia and Mazury in Olsztyn. Mateusz Luba would also like to acknowledge a scholarship from the program Interdisciplinary Doctoral Studies in Bioeconomy (POWR.03.02.00-00-1034/16-00), funded by the European Social Fund.

Conflicts of Interest

The authors declare no conflict of interest.

References

  1. Rousseau, C.; Countaneceau, C.; Lamy, C.; Leger, J.M. Direct ethanol fuel cell (DEFC): Electrical performances and reaction products distribution under operating conditions with different platinum-based anodes. J. Power Sources 2006, 158, 18–24. [Google Scholar] [CrossRef]
  2. Song, S.Q.; Zhou, W.J.; Zhou, Z.H.; Jiang, L.H.; Sun, G.Q.; Xin, Q.; Leontidis, V.; Kontou, S.; Tsiakaras, P. Direct ethanol PEM fuel cells: The case of platinum based anodes. Int. J. Hydrog. Energy 2005, 30, 995–1001. [Google Scholar] [CrossRef]
  3. Abd-El-Latif, A.A.; Mostafa, E.; Huxter, S.; Attard, G.; Baltrischat, H. Electrooxidation of ethanol at polycrystalline and platinum stepped single crystals: A study by differential electrochemical mass spectrometry. Electrochim. Acta 2010, 55, 7951–7960. [Google Scholar] [CrossRef]
  4. Han, S.B.; Song, Y.J.; Lee, J.M.; Kim, J.Y.; Park, K.W. Platinum nanocube catalysts for methanol and ethanol electrooxidation. Electrochem. Commun. 2008, 10, 1044–1047. [Google Scholar] [CrossRef]
  5. Shao, M.H.; Adzic, R.R. Electrooxidation of ethanol on a Pt electrode in acid solutions: In situ ATR-SEIRAS study. Electrochim. Acta 2005, 50, 2415–2422. [Google Scholar] [CrossRef]
  6. Gupta, S.S.; Singh, S.; Datta, J. Temperature effect on the electrode kinetics of ethanol electro-oxidation on Sn modified Pt catalyst through voltammetry and impedance spectroscopy. Mater. Chem. Phys. 2010, 120, 682–690. [Google Scholar] [CrossRef]
  7. Switzer, E.E.; Olson, T.S.; Datye, A.K.; Atanassov, P.; Hibbs, M.R.; Cornelius, C.J. Templated Pt–Sn electrocatalysts for ethanol, methanol and CO oxidation in alkaline media. Electrochim. Acta 2009, 54, 989–995. [Google Scholar] [CrossRef]
  8. Mahapatra, S.S.; Dutta, A.; Datta, J. Temperature effect on the electrode kinetics of ethanol oxidation on Pd modified Pt electrodes and the estimation of intermediates formed in alkali medium. Electrochim. Acta 2010, 55, 9097–9104. [Google Scholar] [CrossRef]
  9. Hassan, K.M.; Hathoot, A.A.; Maher, R.; Azzem, M.A. Electrocatalytic oxidation of ethanol at Pd, Pt, Pd/Pt and Pt/Pd nano particles supported on poly 1,8-diaminonaphthalene film in alkaline medium. RSC Adv. 2018, 8, 15417–15426. [Google Scholar] [CrossRef] [Green Version]
  10. Abdel, R.M.H. Nickel Oxide Nanoparticles Supported on Graphitized Carbon for Ethanol Oxidation in NaOH Solution. J. Clust. Sci. 2019, 30, 1003–1016. [Google Scholar] [CrossRef]
  11. Monyoncho, E.A.; Woo, T.K.; Baranova, E.A. Ethanol electrooxidation reaction in alkaline media for direct ethanol fuel cells. In SPR-Electrochemistry; Banks, C., McIntosh, S., Eds.; Royal Society of Chemistry: London, UK, 2019; Volume 15, pp. 1–57. [Google Scholar]
  12. Gupta, S.S.; Datta, J. A Comparative Study on Ethanol Oxidation Behavior at Pt and PtRh Electrodeposits. J. Electroanal. Chem. 2006, 594, 65–72. [Google Scholar] [CrossRef]
  13. Xia, X.H.; Liess, H.D.; Iwasita, T. Early stages in the oxidation of ethanol at low index single crystal platinum electrodes. J. Electroanal. Chem. 1997, 437, 233–240. [Google Scholar] [CrossRef]
  14. Gomes, J.F.; Busson, B.; Tadjeddine, A.; Tremiliosi-Filho, G. Ethanol electro-oxidation over Pt(h k l): Comparative study on the reaction intermediates probed by FTIR and SFG spectroscopies. Electrochim. Acta 2008, 53, 6899–6905. [Google Scholar] [CrossRef]
  15. El-Shafei, A.A.; Eiswirth, M. Electrochemical activity of Sn-modified Pt single crystal electrodes for ethanol oxidation. Surf. Sci. 2010, 604, 862–867. [Google Scholar] [CrossRef]
  16. Pierozynski, B. Kinetic Aspects of Ethanol Electrooxidation on Catalytic Surfaces of Pt in 0.5 M H2SO4. Int. J. Electrochem. Sci. 2012, 7, 3327–3338. [Google Scholar]
  17. Pierozynski, B. On the Ethanol Electrooxidation Reaction on Catalytic Surfaces of Pt in 0.1 M NaOH. Int. J. Electrochem. Sci. 2012, 7, 4261–4271. [Google Scholar]
  18. Fujiwara, N.; Siroma, Z.; Yamazaki, S.; Ioroi, T.; Senoh, H.; Yasuda, K. Direct ethanol fuel cells using an ion exchange membrane. J. Power Sources 2008, 185, 621–626. [Google Scholar] [CrossRef]
  19. Pierozynski, B. Electrooxidation of Ethanol on PtRh and PtRu Surfaces Studied in 0.5 M H2SO4: Relation to the Behaviour at Polycrystalline Pt. Int. J. Electrochem. Sci. 2012, 7, 4488–4497. [Google Scholar]
  20. Pierozynski, B. Ethanol Electrooxidation on PtRh and PtRu Catalytic Surfaces in 0.1 M NaOH. Int. J. Electrochem. Sci. 2012, 7, 6406–6416. [Google Scholar]
  21. Simoes, F.C.; dos Ainos, D.M.; Vigier, F.; Leger, J.M.; Hahn, F.; Coutanceau, C.; Gonzalez, E.R.; Tremiliosi-Filho, G.; de Andrade, A.R.; Olivi, P.; et al. Electroactivity of tin modified platinum electrodes for ethanol electrooxidation. J. Power Sources 2007, 167, 1–10. [Google Scholar] [CrossRef]
  22. Luo, Z.; Lu, J.; Flox, C.; Nafria, R.; Genc, A.; Arbiol, J.; Llorca, J.; Ibanez, M.; Morante, J.R.; Cabot, A. Pd2Sn [010] nanorods as a highly active and stable ethanol oxidation catalyst. J. Mater. Chem. A 2016, 4, 16706–16713. [Google Scholar] [CrossRef]
  23. Guo, J.; Chen, R.; Zhu, F.-C.; Sun, S.-G.; Villullas, H.M. New understanding of ethanol oxidation reaction mechanism on Pd/C and Pd2Ru/C catalysts in alkaline direct ethanol fuel cells. Appl. Catal. B Environ. 2018, 224, 602–611. [Google Scholar] [CrossRef] [Green Version]
  24. Delpeuch, A.B.; Maillard, F.; Chatenet, M.; Soudant, P.; Cremers, C. Ethanol oxidation reaction (EOR) investigation on Pt/C, Rh/C, and Pt-based bi- and tri-metallic electrocatalysts: A DEMS and in situ FTIR study. Appl. Catal. B Environ. 2015, 181, 672–680. [Google Scholar] [CrossRef]
  25. Yi, J.; Lee, W.H.; Choi, C.H.; Lee, Y.; Park, K.S.; Min, B.K.; Hwang, Y.J.; Oh, H.-S. Effect of Pt introduced on Ru-based electrocatalyst for oxygen evolution activity and stability. Electrochem. Commun. 2019, 104, 1–5. [Google Scholar] [CrossRef]
  26. Su, C.; Yang, T.; Zhou, W.; Wang, W.; Xu, X.; Shao, Z. Pt/C-LiCoO2 composites with ultralow Pt loadings as synergistic bifunctional electrocatalysts for oxygen reduction and evolution reaction. J. Matter Chem. A 2016, 4, 4516–4524. [Google Scholar] [CrossRef] [Green Version]
  27. Sasaki, K.; Marinkovic, N.; Isaacs, H.S.; Adzic, R.R. Synchrotron-Based in situ characterization of Carbon-supported platinum and platinum monolayer electrocatalysts. ACS Catal. 2016, 6, 69–76. [Google Scholar] [CrossRef]
  28. Da Silva, G.C.; Fernandes, M.R.; Ticianelli, E.A. Activity and Stability of Pt/IrO2 Bifunctional Materials as Catalysts for the Oxygen Evolution/Reduction Reactions. ACS Catal. 2018, 8, 2081–2092. [Google Scholar] [CrossRef]
  29. Pierozynski, B.; Morin, S.; Conway, B.E. Influence of adsorption of guanidonium cations on H upd at Pt(hkl) surfaces: Lattice-specific anion-mimetic effects. J. Electroanal. Chem. 1999, 467, 30–42. [Google Scholar] [CrossRef]
  30. Wang, Y.; Zou, S.; Cai, W.B. Recent advances on electro-oxidation of ethanol on Pt- and Pd-based catalysts: From reaction mechanisms to catalytic materials. Catalysts 2015, 5, 1507–1534. [Google Scholar] [CrossRef]
  31. Hitmi, H.; Belgsir, E.; Léger, J.-M.; Lamy, C.; Lezna, R. A kinetic analysis of the electro-oxidation of ethanol at a platinum electrode in acid medium. Electrochim. Acta 1994, 39, 407–415. [Google Scholar] [CrossRef]
  32. Reshetenko, T.V.; St-Pierre, J. Study of the acetonitrile poisoning of platinum cathodes on proton exchange membrane fuel cell spatial performance using a segmented cell system. J. Power Sources 2015, 293, 929–940. [Google Scholar] [CrossRef] [Green Version]
  33. Briega-Martos, V.; Costa-Figueiredo, M.; Orts, J.M.; Rodes, A.; Koper, M.T.M.; Herrero, E.; Feliu, J.M. Acetonitrile adsorption on Pt single-crystal electrodes and its effect on oxygen reduction reaction in acidic and alkaline aqueous solutions. J. Phys. Chem. C 2019, 123, 2300–2313. [Google Scholar] [CrossRef] [Green Version]
  34. Ahlberg, E.; Friel, M. The cathodic polarization of iron in acidic acetonitrile-water solutions. Electrochim. Acta 1989, 34, 771–780. [Google Scholar] [CrossRef]
  35. Ledezma-Yanez, I.; Diaz-Morales, O.; Figueiredo, M.C.; Koper, M.T.M. Hydrogen oxidation and hydrogen evolution on a platinum electrode in acetonitrile. ChemElectroChem 2015, 2, 1612–1622. [Google Scholar] [CrossRef]
  36. Smiljanić, M.L.; Srejić, I.L.; Marinović, V.M.; Rakočević, Z.L.; Štrbac, S.B. Inhibiting effect of acetonitrile on oxygen reduction on polycrystalline Pt electrode in sodium chloride solution. Hem. Ind. 2012, 66, 327–333. [Google Scholar] [CrossRef] [Green Version]
  37. Srejić, I.; Smiljanić, M.; Rakočević, Z.; Štrbac, S. Oxygen reduction on polycrystalline Pt and Au electrodes in perchloric acid solution in the presence of acetonitrile. Int. J. Electrochem. Sci. 2011, 6, 3344–3354. [Google Scholar]
  38. Mikolajczyk, T.; Luba, M.; Pierozynski, B.; Smoczynski, L. A detrimental effect of acetonitrile on the kinetics of underpotentially deposited hydrogen and hydrogen evolution reaction, examined on Pt electrode in H2SO4 and NaOH solutions. Catalysts 2020, 10, 625. [Google Scholar] [CrossRef]
  39. Ma, B.; Dong, L. Electrochemical impedance analysis of methanol oxidation on carbon nanotube-supported Pt and Pt-Ru nanoparticles. J. Solid State Electrochem. 2013, 17, 2783–2788. [Google Scholar] [CrossRef]
  40. Danaee, I.; Jafarian, M.; Forouzandeh, F.; Gobal, F.; Mahjani, M.G. Electrochemical impedance studies of methanol oxidation on GC/Ni and GC/NiCu electrode. Int. J. Hydrog. Energy 2009, 34, 859–869. [Google Scholar] [CrossRef]
  41. Bommersbach, P.; Mohamedi, M.; Guay, D. Electro-oxidation of Ethanol at Sputter-Deposited Platinum-Tin Catalysts. J. Electrochem. Soc. 2007, 154, B876–B882. [Google Scholar] [CrossRef]
  42. Benetton, X.D.; Navarro-Avila, S.G.; Carrera-Figueiras, C. Electrochemical Evaluation of Ti/TiO2-polyaniline Anodes for Microbial Fuel Cells using Hypersaline Microbial Consortia for Synthetic-wastewater Treatment. J. New Mater. Electrochem. Syst. 2010, 13, 1–6. [Google Scholar]
  43. Han, L.; Ju, H.; Xu, Y. Ethanol electro-oxidation: Cyclic voltammetry, electrochemical impedance spectroscopy and galvanostatic oscillation. Int. J. Hydrog. Energy 2012, 37, 15156–15163. [Google Scholar] [CrossRef]
  44. Lasia, A.; Rami, A. Kinetics of hydrogen evolution on Ni-Al alloy electrodes. J. Appl. Electrochem. 1992, 22, 376–382. [Google Scholar]
  45. Chen, L.; Lasia, A. Study of the Kinetics of Hydrogen Evolution Reaction on Nickel-Zinc Alloy Electrodes. J. Electrochem. Soc. 1991, 138, 3321–3328. [Google Scholar] [CrossRef]
  46. Pajkossy, T. Impedance of rough capacitive electrodes. J. Electroanal. Chem. 1994, 364, 111–125. [Google Scholar] [CrossRef]
  47. Conway, B.E. Impedance Spectroscopy: Theory, Experiment, and Applications; Barsoukov, E., Macdonald, J.R., Eds.; Wiley: Hoboken, NJ, USA, 2005; p. 494. [Google Scholar]
  48. Pell, W.G.; Zolfaghari, A.; Conway, B.E. Capacitance of the double-layer at polycrystalline Pt electrodes bearing a surface-oxide film. J. Electroanal. Chem. 2002, 532, 13–23. [Google Scholar] [CrossRef]
  49. Briega-Martos, V.; Solla-Gullon, J.; Koper, M.T.M.; Herrero, E. Electrocatalytic enhancement of formic acid oxidation reaction by acetonitrile on well-defined platinum surfaces. Electrochim. Acta 2019, 295, 835–845. [Google Scholar] [CrossRef]
  50. Macdonald, J.R. Impedance Spectroscopy: Emphasizing Solid Materials and Systems; Wiley: New York, NY, USA, 1987. [Google Scholar]
Figure 1. (a) Cyclic voltammograms for ethanol electrooxidation on a polycrystalline Pt electrode, carried out in 0.5 M H2SO4 and 0.25 M C2H5OH at a sweep rate of 50 mV s−1, in the absence and presence of CH3CN (at the concentrations indicated); the inset shows a cyclic voltammogram for a polycrystalline Pt electrode in pure 0.5 M H2SO4; (b) as in (a) above, but for 0.1 M NaOH supporting solution; (c) as in (a,b) above, but in the presence of 0.25 M CH3CN.
Catalysts 10 01286 g001
Scheme 1. Chemisorption and mutual interaction of CH3CN and C2H5OH molecules on the Pt surface.
Catalysts 10 01286 sch001
Figure 2. Three equivalent circuits (ac), used for fitting the obtained a.c. impedance spectroscopy data in this work, where RS is the solution resistance; Cdl is the double-layer capacitance; Rct is the charge-transfer resistance parameter for the electrooxidation of ethanol; RAds and Cp are resistance and pseudocapacitance parameters for adsorbed reaction intermediates, respectively; and Ro and L are inductive resistance and inductance parameters, respectively. The circuits include constant phase elements (CPEs) to account for distributed capacitance.
Catalysts 10 01286 g002
Figure 3. (a) Complex-plane impedance plot for a polycrystalline Pt electrode in contact with 0.5 M H2SO4 and 0.25 M C2H5OH, recorded at 550 mV vs. a reversible Pd hydrogen electrode (RHE) (at 293 K), in the absence and presence of CH3CN (at the concentrations indicated). The solid lines correspond to representation of the data according to the equivalent circuit shown in Figure 2a; (b) as in (a) above, but for the potential of 900 mV (in reference to Figure 2b), where the inset shows an example of a high frequency semicircle response; (c) as in (a,b) above, but in the presence of 0.25 M CH3CN.
Catalysts 10 01286 g003aCatalysts 10 01286 g003b
Scheme 2. Chemisorption and mutual interactions of CH3CN and C2H5OH molecules on the Pt surface in NaOH supporting solution.
Catalysts 10 01286 sch002
Figure 4. (a) Complex-plane impedance plot for a polycrystalline Pt electrode in contact with 0.1 M NaOH and 0.25 M C2H5OH, recorded at 600 mV vs. RHE (at 293 K), in the absence and presence of CH3CN (at the concentrations indicated). The solid lines correspond to representation of the data according to the equivalent circuit shown in Figure 2c; (b) as in (a) above, but for the potential of 800 mV (in reference to Figure 2a); (c) as in (a,b) above, but in the presence of 0.25 M CH3CN (in reference to Figure 2a).
Catalysts 10 01286 g004
Figure 5. Representation of acetaldehyde (a) and acetate (b) concentrations recorded during the initial 30 min of ethanol electrooxidation, carried out in 0.1 M NaOH supporting electrolyte.
Catalysts 10 01286 g005aCatalysts 10 01286 g005b
Table 1. Resistance and capacitance parameters for the electrooxidation of ethanol (at 0.25 M C2H5OH) on a polycrystalline Pt electrode in 0.5 M H2SO4 (at 293 K) in the absence and presence of acetonitrile (at four indicated acetonitrile (AcN) concentrations), obtained by finding the equivalent circuits which best fitted the impedance data, as shown in Figure 2a,b.
E/mVRct/Ω × cm2Cdl/µF × cm−2RAds/Ω × cm2Cp/ µF × cm−2
0.5 M H2SO4 + 0.25 M C2H5OH
5501524 ± 3429.3 ± 0.9--
6502831 ± 24353.2 ± 0.4−3371 ± 26369.1 ± 3.1
700948 ± 6037.9 ± 0.5−1055 ± 3797.0 ± 5.2
800−439 ± 1131.1 ± 0.5−301 ± 160.2 ± 1.1
900−1043 ± 8336.9 ± 0.6−854 ± 648.8 ± 0.6
0.5 M H2SO4 + 0.25 M C2H5OH + 1.85 × 10⁻⁵ M AcN
5501587 ± 3919.6 ± 0.4--
6503852 ± 50542.6 ± 0.3−7697 ± 38761.1 ± 1.3
7002294 ± 21933.3 ± 0.4−2188 ± 5667.7 ± 1.6
800−451 ± 1722.9 ± 0.4−442 ± 322.6 ± 0.6
900−1408 ± 11228.7 ± 0.4−1021 ± 740.3 ± 0.8
0.5 M H2SO4 + 0.25 M C2H5OH + 1.85 × 10⁻⁴ M AcN
5501330 ± 1442.1 ± 0.5--
6503000 ± 13154.6 ± 1.0--
7001664 ± 2632.7 ± 0.5−1000 ± 111664.1 ± 46.7
800−2506 ± 45920.8 ± 0.4−379 ± 4108.2 ± 1.7
900−784 ± 12435.6 ± 0.5−214 ± 4254.7 ± 11.0
0.5 M H2SO4 + 0.25 M C2H5OH + 1.85 × 10⁻³ M AcN
5502460 ± 6171.6 ± 1.4--
6503028 ± 6250.5 ± 0.4--
7004192 ± 16737.7 ± 0.4−12,716 ± 2406101.4 ± 9.0
8009168 ± 232817.2 ± 0.2−20,223 ± 195727.8 ± 1.2
900−5929 ± 189528.4 ± 0.7−5936 ± 10530.2 ± 0.5
0.5 M H2SO4 + 0.25 M C2H5OH + 0.25 M AcN
550131,404 ± 11,76957.9 ± 0.5--
90052,759 ± 317443.6 ± 0.8--
Table 2. Resistance and capacitance (and inductance) parameters for the electrooxidation of ethanol (at 0.25 M C2H5OH) on a polycrystalline Pt electrode in 0.1 M NaOH (at 293 K), in the absence and presence of acetonitrile (at four indicated AcN concentrations), obtained by finding the equivalent circuits which best fitted the impedance data, as shown in Figure 2a,c.
E/mVRct/Ω × cm2Cdl/µF × cm−2RO/ Ω × cm2L/H
0.1 M NaOH + 0.25 M C2H5OH
6002211 ± 9126.4 ± 1.1604 ± 47247 ± 10
6752842 ± 25727.5 ± 1.9494 ± 38155 ± 8
800121 ± 169.3 ± 0.3--
0.1 M NaOH + 0.25 M C2H5OH + 1.85 × 10⁻⁵ M AcN
6001648 ± 5328.0 ± 1.2713 ± 55328 ± 16
6751428 ± 10230.4 ± 2.9482 ± 100264 ± 26
800141 ± 181.4 ± 1.8--
0.1 M NaOH + 0.25 M C2H5OH + 1.85 × 10⁻⁴ M AcN
6001558 ± 6127.9 ± 1.41123 ± 95315 ± 25
675659 ± 1826.6 ± 1.7--
800101 ± 185.0 ± 1.7--
0.1 M NaOH + 0.25 M C2H5OH + 1.85 × 10⁻³ M AcN
600598 ± 728.5 ± 0.9805 ± 70380 ± 22
675215 ± 234.2 ± 1.2--
80061 ± 1109.4 ± 5.4--
0.1 M NaOH + 0.25 M C2H5OH + 0.25 M AcN
6001770 ± 1319.0 ± 0.3--
80016,046 ± 46124.3 ± 0.3--
Publisher’s Note: MDPI stays neutral with regard to jurisdictional claims in published maps and institutional affiliations.

