Article

A Scalable High-Throughput Deposition and Screening Setup Relevant to Industrial Electrocatalysis

1
Avantium Chemicals BV, Zekeringstraat 29, 1014 BV Amsterdam, The Netherlands
2
VSParticle BV, Molengraaffsingel 10, 2629 JD Delft, The Netherlands
3
ZEF BV (Zero Emission Fuels), Leeghwaterstraat 39, 2628 CB Delft, The Netherlands
4
Van’t Hoff Institute for Molecular Sciences, University of Amsterdam, 1090 GD Amsterdam, The Netherlands
*
Author to whom correspondence should be addressed.
Catalysts 2020, 10(10), 1165; https://doi.org/10.3390/catal10101165
Submission received: 14 September 2020 / Revised: 5 October 2020 / Accepted: 9 October 2020 / Published: 12 October 2020

Abstract

:
The identification and optimization of electrode materials is of great importance in the study of (flow and solid state) batteries, industrial electrocatalysis and analytical devices such as sensors. To identify useful materials from a virtually unbound set of metals, alloys and semiconductors, high-throughput techniques are of vital importance. In this paper we present a high-throughput setup that consists of 64 parallel plate electrochemical flow cells, with the anode and cathode compartments separated by a membrane. These cells can be operated sequentially or batch-wise in parallel, using a matrix-addressing approach that allows for scaling up to larger electrode matrices with minimal instrumentation cost. The setup was validated for the preparation and screening of electrode materials under hydrodynamic conditions at industrially relevant current densities, which showed that it could be used to identify optimal catalysts and the robustness of catalyst preparation. The results of the small scale experiments followed theoretical predictions and were used to optimize larger scale experiments.

Graphical Abstract

1. Introduction

New or improved technology often emerges by virtue of the development of novel materials. Existing materials historically serve as an inspiration for the discovery of next generation materials, but this incremental process has obvious limitations. High throughput and combinatorial (HTC) methodologies have alleviated some of these limitations through automation, increasing reproducibility and the size of the parameter set used to generate these materials. Analysis of large libraries of materials is further aided by the advance in open source data analysis.
Excellent reviews on high throughput (HT) experimentation have been published over the years, and although not up-to-date with current literature, serve as good overviews on methodology for materials science [1,2] and electrochemistry [3]. Older reviews showcase data analysis for high throughput experiments [4], and an overview of current state-of-the-art can be found on the various platforms used in the open source community and literature on omics (genomics, proteomics…) research [5].
In this article we describe a high throughput setup for the screening of electrode materials used for electrosynthesis in electrochemical parallel plate reactors. In this case, the use of HTC methods can be justified for the discovery of as of yet unknown electrochemical transformations and for the optimization of existing processes. The latter, process optimization, comes in many forms, such as the discovery of new and improved catalysts or operating conditions, and catalyst optimization to improve process stability or robustness. Proper experimental design can give additional insight into which parameters influence the process and to what extent.
Two shortcomings of published HT setups for industrial electrocatalyst research addressed in this article are (1) the dissimilarity between small scale screening setups and larger scale flow cells and (2) the scalability of the HT setup to exponentially larger setups (i.e., more cells) for brute force screening. For industrial purposes, useful results are only those that can be verified and applied directly in a larger scale process. As such, the small scale experiments should match the larger scale process as much as possible. Therefore, we have miniaturized and multiplied the parallel plate reactor to form a matrix of flow cells that can be run at industrial current densities. One implication of using discrete cells (as opposed to e.g., scanning an electrode over a continuous catalyst gradient) is that the catalyst throughput is limited by the number of cells which, as turns out, is limited by the cost of the automation electronics, unless particular care is taken to change the cost scaling.
The presented HT setup was used to plate nickel oxy-hydroxy anodes and then screen these electrode materials towards the oxidation of isopropanol to acetone. In another experiment, nanostructured electrode materials were deposited by spark ablation and screened for the oxidation of water. The results of both experiments were directly applicable to larger scale operation.

2. Results

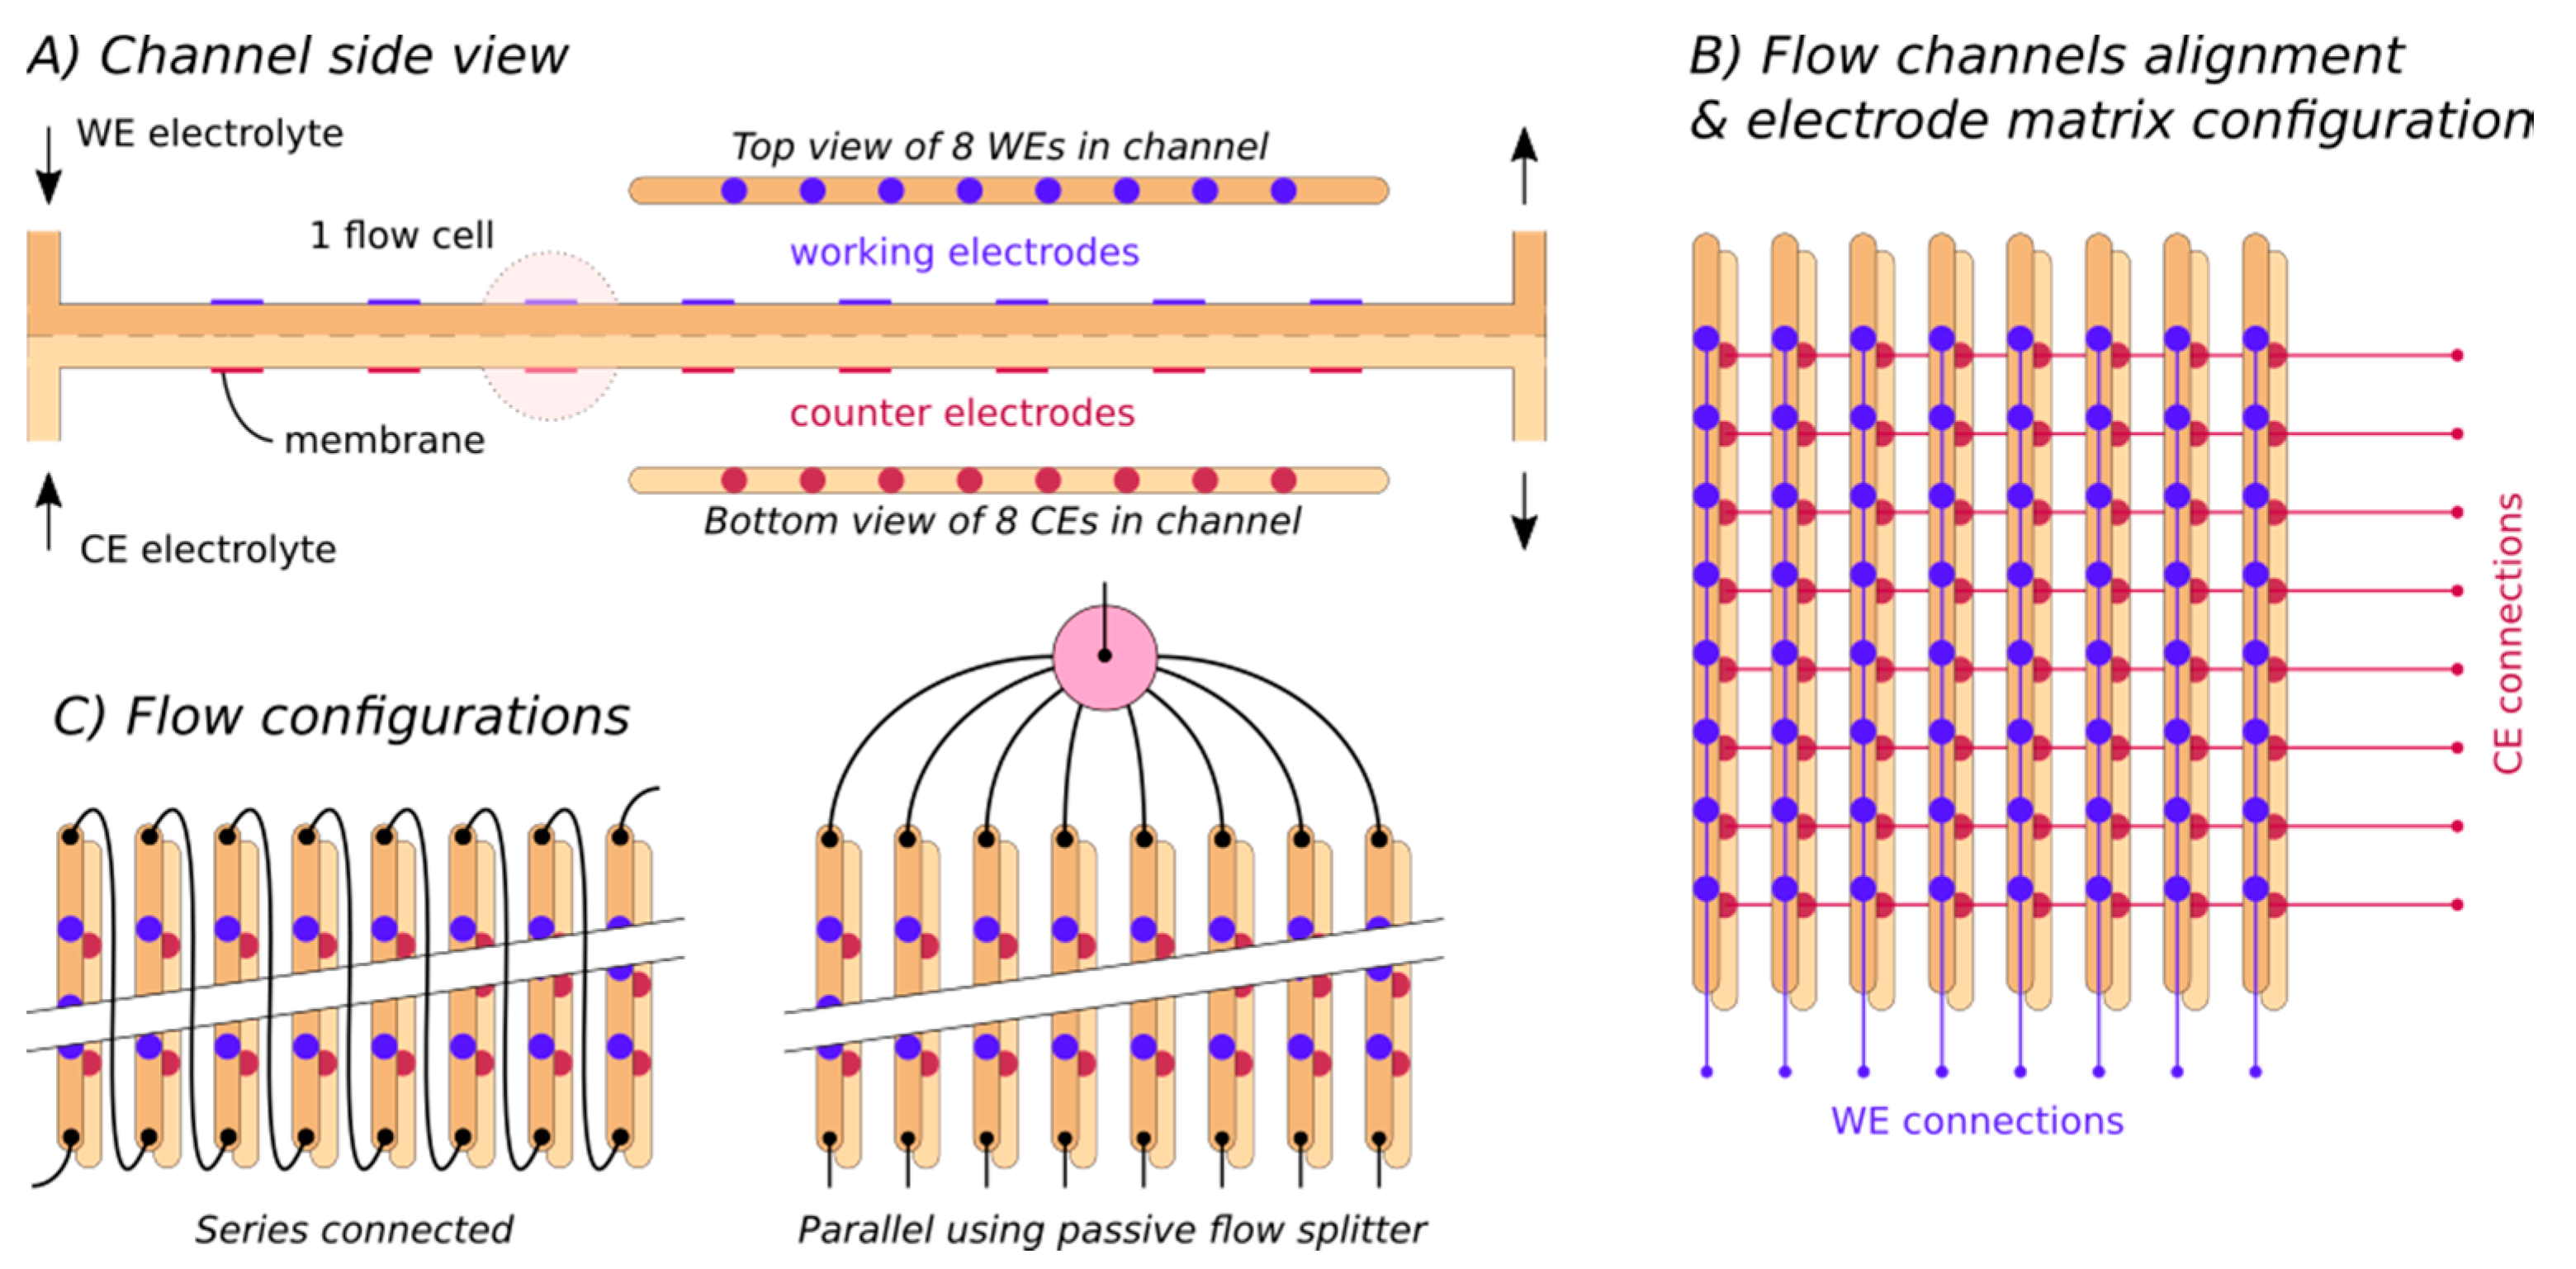
2.1. The High-Throughput Setup

The high-throughput (HT) setup presented here consists of flow channels, which are internally separated by a membrane. Each flow channel has two inlet and two outlet ports (electrolyte for the working electrodes (WE) and electrolyte for the counter electrodes (CE)), and the electrolytes flow past eight working electrodes (on one side) and eight counter electrodes (on the other side of the membrane). As such, each flow channel can be regarded as eight parallel plate electrochemical flow reactors coupled in series, as is shown in Figure 1A. There are eight such flow channels in the HT setup next to each other, such that the 64 WE electrodes and 64 CE electrodes are laid out in a rectangular matrix grid.
The electrodes are connected in sets of eight. Figure 1B shows how along the flow channels (vertical; “columns”) the WEs are connected together, and only eight electrical connections are available on the outside. The CEs are connected together perpendicular to the flow channels (horizontal; “rows”), and again only eight electrical connections are available on the outside. All 64 cells inside the HT setup are thus connected to the electronics (vide infra) with only 16 electrical connections. These connections can be seen at the far right of the electrode boards in Figure 2.
The setup can be operated in various configurations. In the top of Figure 1C it can be seen how the flow channels are connected in series: electrolyte is pumped into one channel, and from there goes into the second channel, etcetera, and out from the eighth channel. This configuration is used in sequential operation: when one cell is measured at a time. In the bottom of Figure 1C, a parallel flow configuration is shown, where one incoming flow is split into eight flows, which is fed into each channel. This configuration is used in semi-parallel operation: when eight cells are measured at the same time.

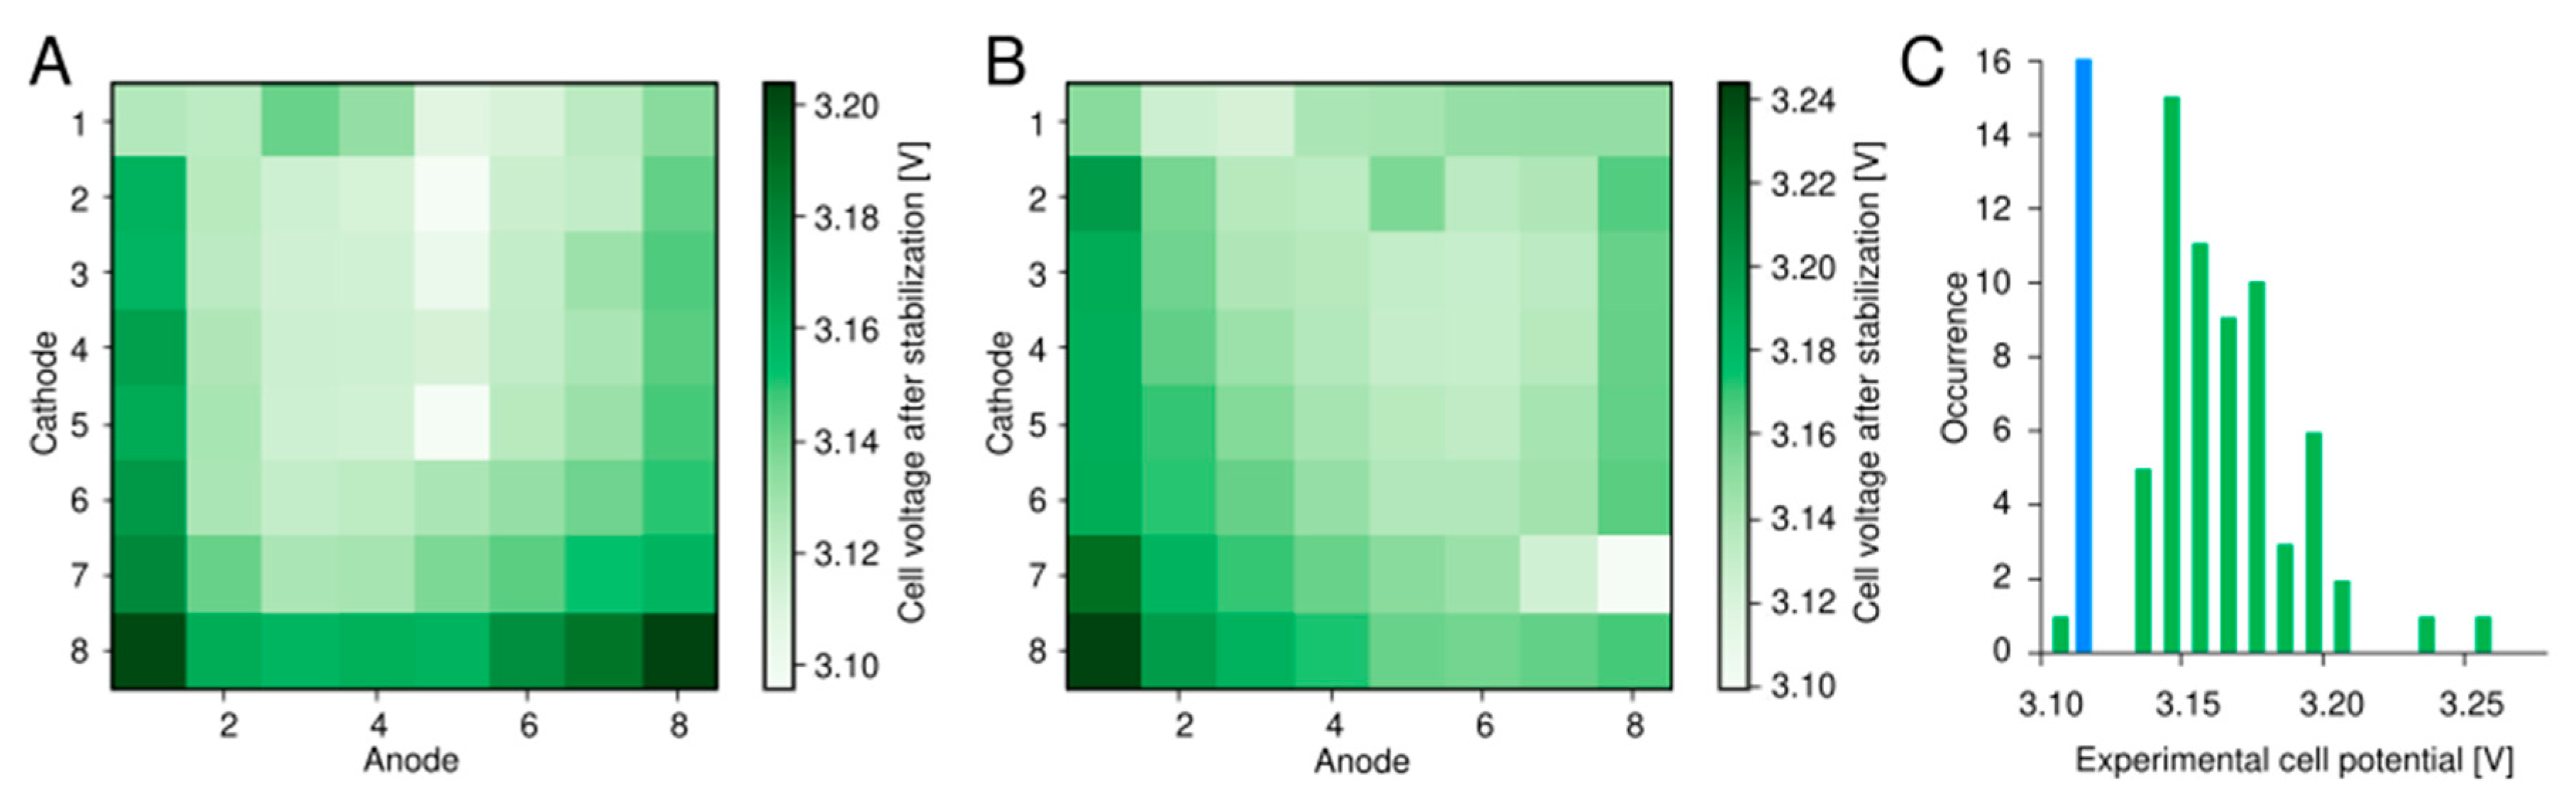
2.2. Setup Validation Using PEM Water Electrolysis

To find out whether the 64 flow cells in the HT setup are indeed operating as individual cells, proton exchange membrane (PEM) water electrolysis was studied at 64 gold anodes and 64 nickel cathodes using a Nafion membrane, with all cells connected in series (sequential operation). All experiments were conducted at a 20 mA/cm2 current density and a linear flow velocity of 6.7 mm/s and cell voltage was monitored over time. Figure 3A shows the spatial distribution of the cell voltage over the 8 × 8 matrix. While keeping everything the same, the flows were reversed and the experiment repeated, with a spatial distribution as in Figure 3B.
For both experiments, the average cell voltages were 3.15 V with a standard deviation of 25 mV and the visual characteristic (Figure 3C) of a statistical distribution that is bounded on one side. The calculated theoretical cell voltage for this reaction under the used conditions is 3.11 V. This value seems to form a lower bound to the experimental cell potentials.

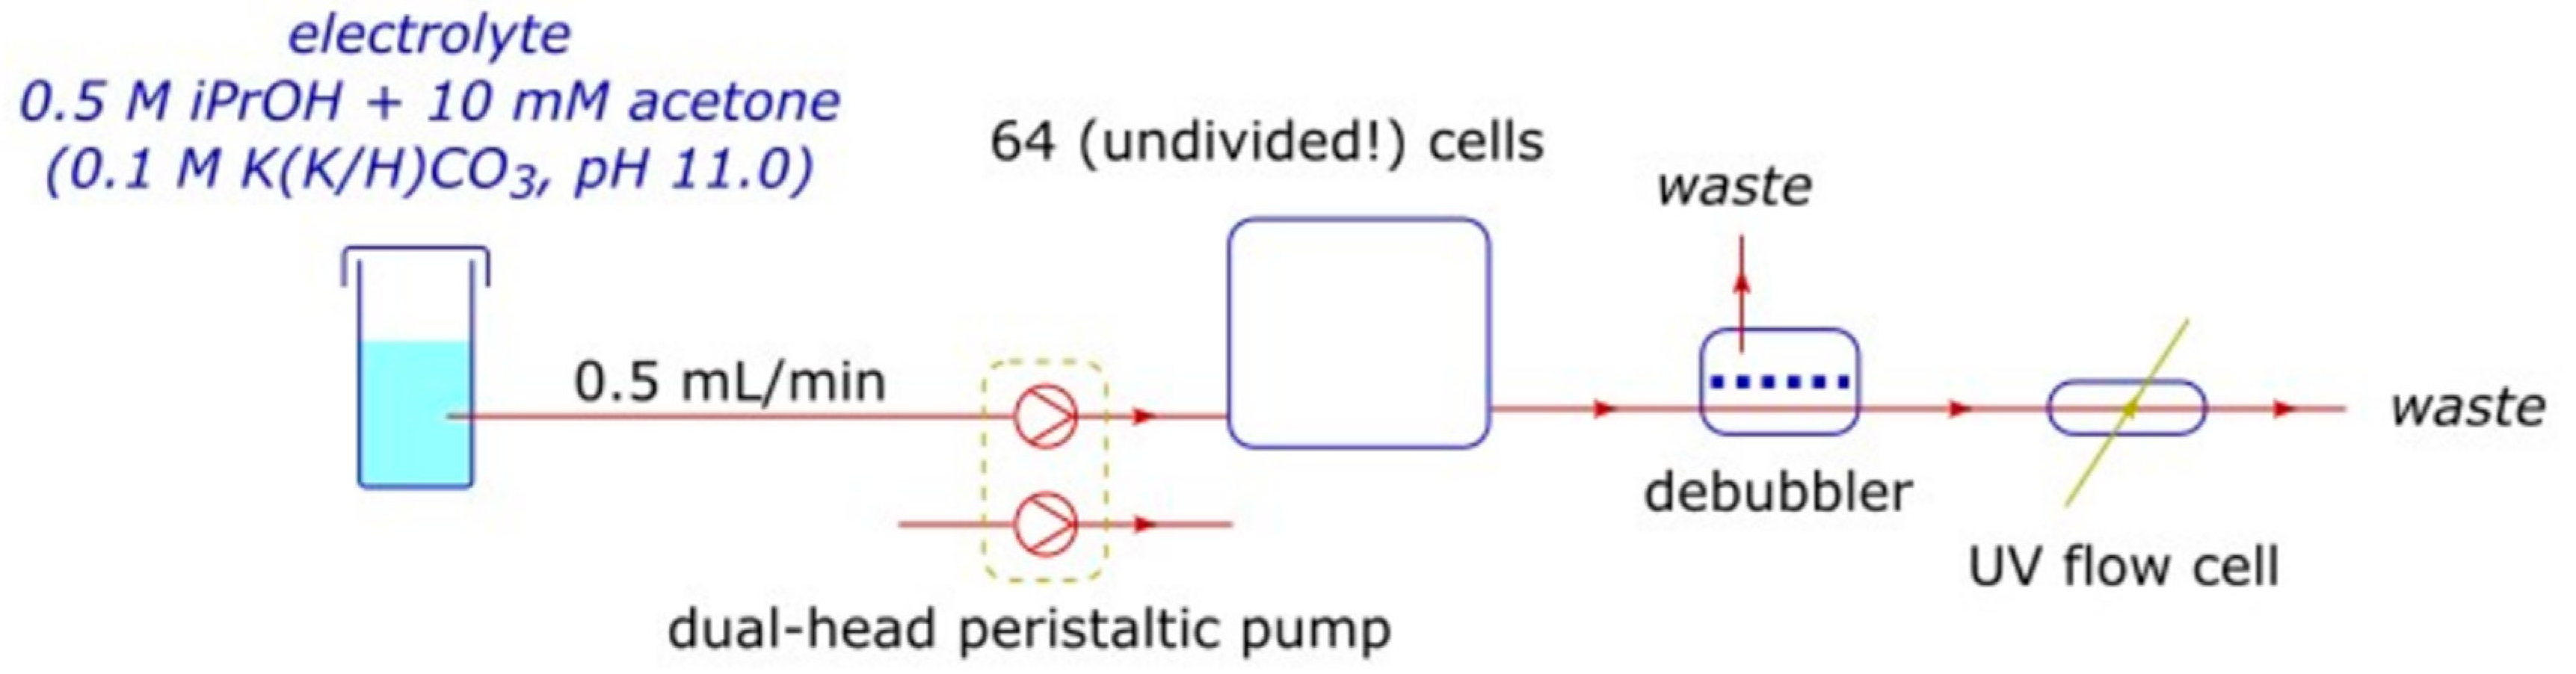
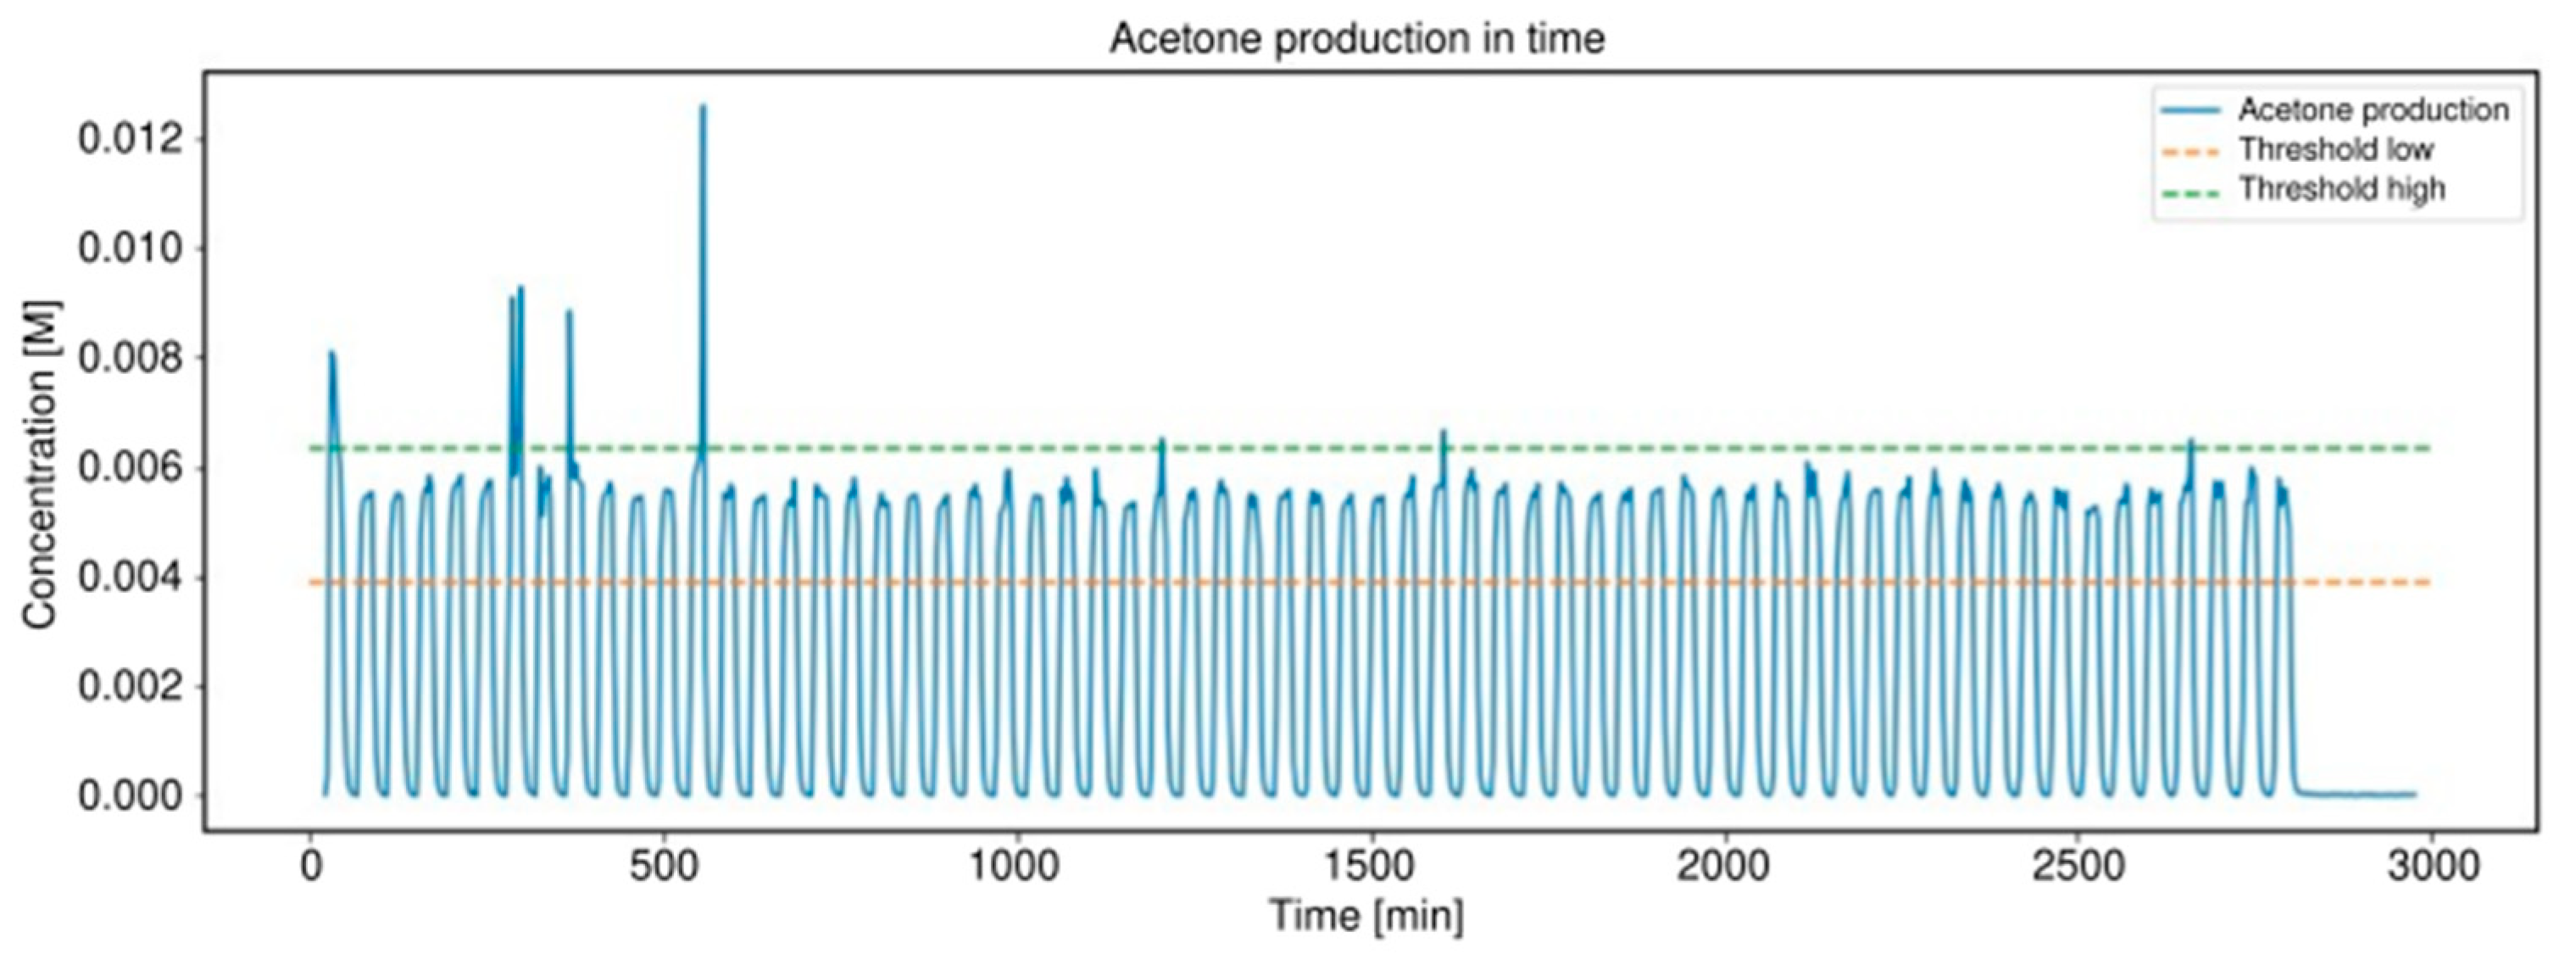
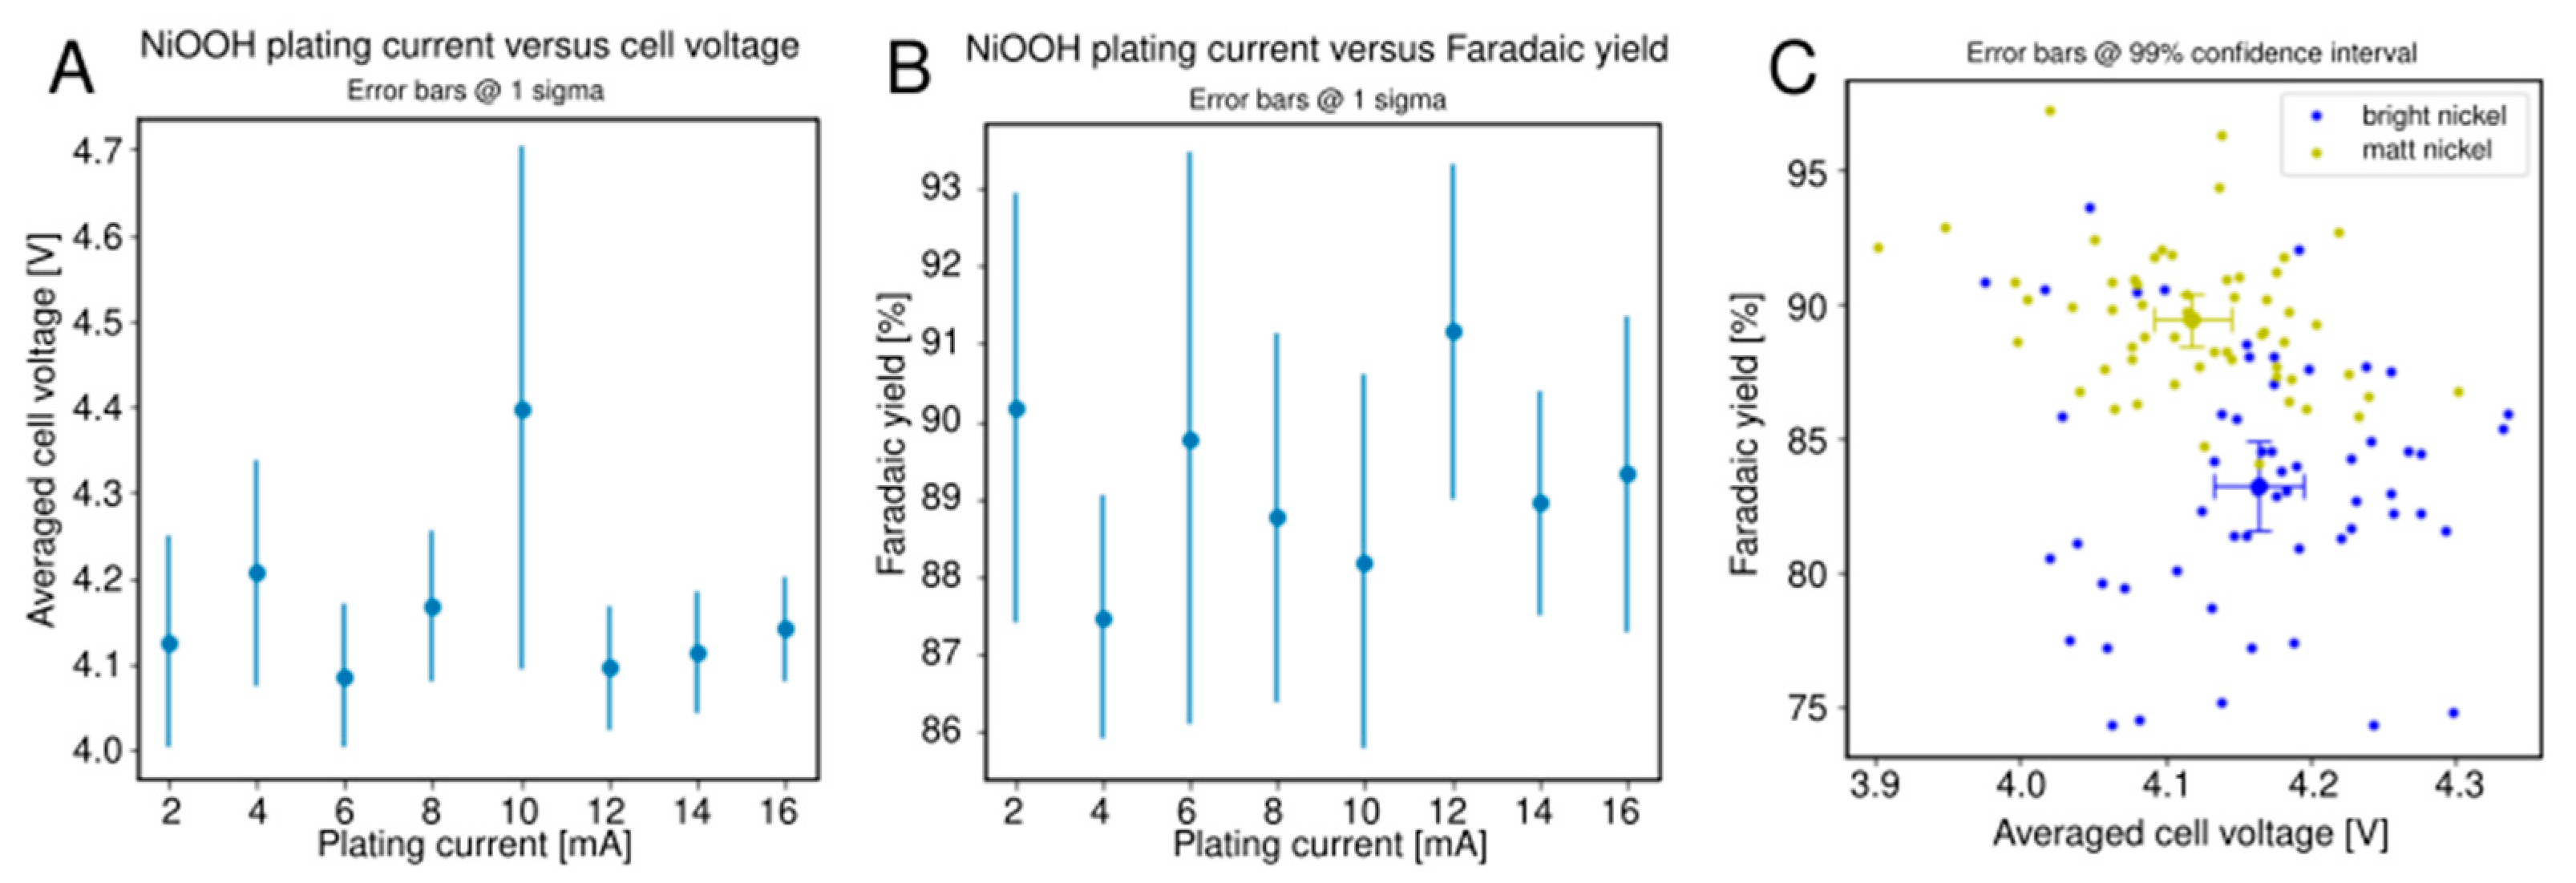
2.3. Alcohol Oxidation

The same sequentially operated system that was used for the setup validation, was used for the oxidation of isopropanol to acetone (an overall 2-electron oxidation) at nickel and nickel oxyhydroxy electrodes at a current density of 160 mA/cm2. No membranes were used in this setup (Figure 4), as the cathode favors hydrogen production over ketone reduction. A 0.1 M (bi)carbonate electrolyte at pH 11.0 containing substrate (0.5 M isopropanol) and a small amount of product (10 mM acetone) was pumped through the HT setup. The outflow was passed through a membrane debubbler (to remove hydrogen gas plugs from the tubing) and then through an ultraviolet (UV) spectroscopy flow cell for the quantification of the formed acetone.
Two experiments were performed: (1) an automated, electrochemical preparation of 64 nickel oxy-hydroxy (Ni(O)OH) electrodes inside the HT setup at different current densities with subsequent screening of this library for the isopropanol oxidation reaction and (2) a control screening where the isopropanol oxidation was performed at 64 identical nickel electrodes. The library of Ni(O)OH electrodes was generated by electroplating from a Watts bath using a literature method [6] at eight different current densities using an automated approach inside the HT setup. Current density was varied between 40 and 320 mA/cm2 (linear spacing) at a constant total charge passed at random positions in the electrode matrix. This method was chosen as to optimize the electrode material synthesis and to test the robustness of the preparation.
The screening experiments were performed at a current of 8.14 mA per electrode (J = 166 mA/cm2) and a flow rate of 0.42 mL/min (v = 10 m/s), giving a maximum increase in the acetone concentration of 6.03 mM (at 100% anodic Faradaic efficiency). Quantification of the UV spectra gave concentrations of 10 mM (between measurements; when no current was applied) to around 15 mM (during measurements; when current was applied). The response (increase in acetone concentration) over 64 measurements is visualized in Figure 5.
The results of the screening of the Ni(O)OH library are shown in Figure 6. The spatial variation of cell voltage and Faradaic yield over the 8 × 8 matrix can be seen in the left and middle panel. This shows that the third “column” is an outlier, due to partial masking of the electrodes because of a misaligned gasket. In the right panel the cell voltage is plotted against the Faradaic yield. Treating the data in “column” 3 as outlier gave a cell voltage average of 4.12 V with a standard deviation of 0.07 V and a Faradaic yield with an average of 89.4 % and a standard deviation of 2.6%.
To gain insight into the correlation of the material synthesis conditions with the reaction efficiency, the cell voltage and Faradaic yield were plotted against the deposition current density (Figure 7). No effect was observed for either the averages or the standard deviations and it was concluded that the influence of plating current density on the observed metrics was negligible. The control experiment, where no Ni(O)OH was deposited and the base Ni layer was used as electrode material instead, gave a cell voltage average of 4.16 V with a standard deviation of 0.08 V and a Faradaic yield with an average of 83.3% and a standard deviation of 4.6%. The comparison between experiments is visualized in Figure 8 (right). Again column 3 was excluded because of the gasket partially masking the electrodes. The results are summarized in Table 1, where it can be seen that between bright and microrough nickel, there is no difference in cell potential (within 99% confidence interval), but there is a significant difference in Faradaic yield.

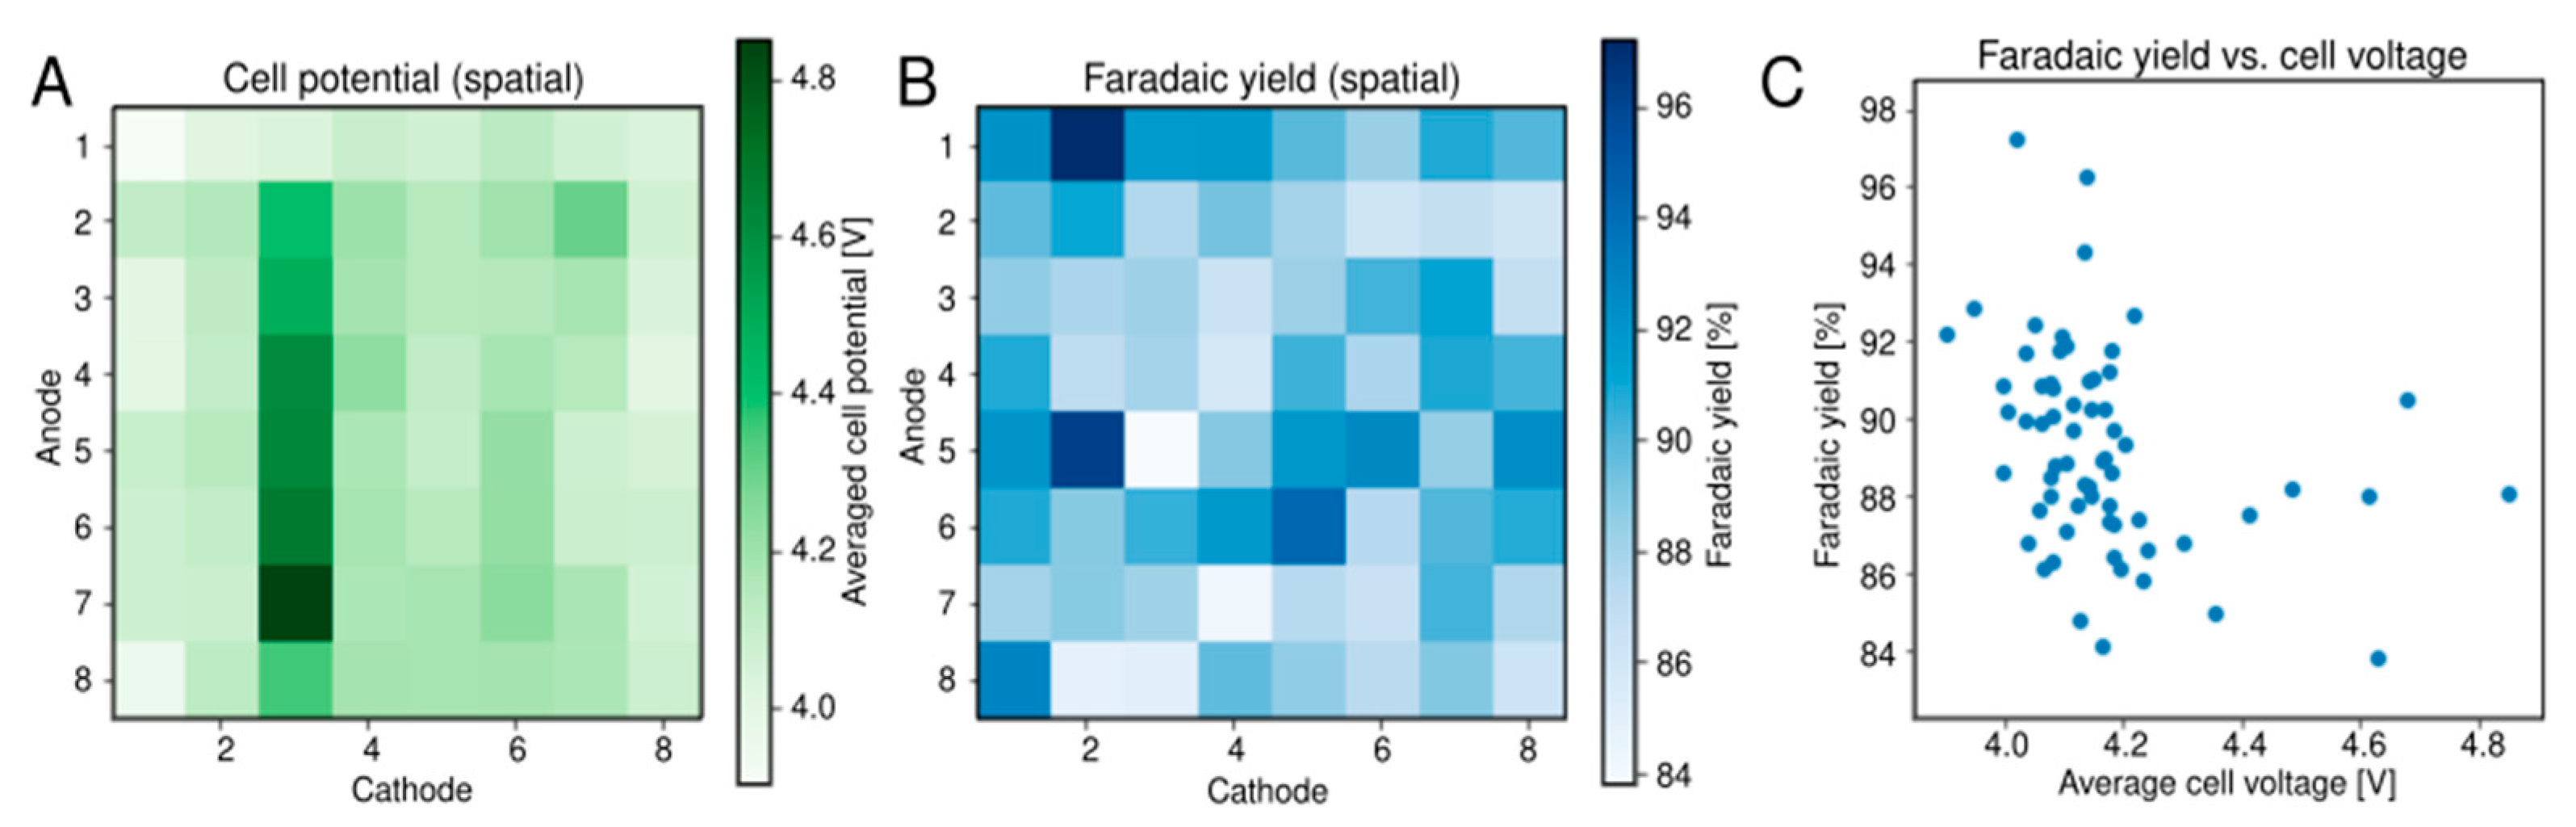
2.4. Alkaline Water Electrolysis

In the alkaline water electrolysis experiment the cell potential is the only output variable. Therefore, multiple measurements can be performed at the same time, and the experiment was run in semi-parallel operation with eight batches of eight fully parallel measurements. A library of 64 catalytic anodes was prepared using spark ablation by depositing eight different ratios of nickel and iron nanoparticles at eight different deposition times (Figure 8). Cathodes were bright nickel.
The electrolytes (30% KOH) were circulated through the anode and cathode compartments which were separated by a reinforced polyphenylene sulfide (PPS) membrane. After ramping up the current density to 200 mA/cm2, the cell potential generally stabilized within two hours to values between 2.3 and 2.6 V. Two capillary flow channels (out of 16) became blocked during the experiment and the corresponding data was treated as outliers and removed.
Plotting the stabilized cell potential versus the two varied parameters (Figure 9A,B) it can be seen that the potential increases linearly with the %nickel generator power in the nanoparticle catalyst composition and decreases logarithmically with the deposition time until 160 s, after which it starts increasing again. The contour plot in Figure 9C shows this behavior more clearly, including a region (at 0% nickel generator power (=100% iron generator power) and deposition times around 100 s) corresponding to optimal conditions: a cell potential of 2.35 V.

3. Discussion

3.1. The High-Throughput Setup and Its Validation

An experimental HT setup was conceived in our laboratories to accelerate the processes of catalyst discovery and optimization. These novel or optimized catalysts are intended to be used in larger scale setups, and as such it is vital that the small-scale electrochemical cells used in the HT setup compare well to the larger scale electrochemical cells, which are typically parallel plate electrochemical cells. To create a many-cell system, multiple miniature flow cells can be connected in series or ‘output-to-input.’ When this configuration is ‘folded up,’ a two-dimensional grid of cells forms, where the electrolytes flow through the cell in a serpentine fashion. In this configuration, all working and counter electrodes are spaced in a two-dimensional grid, which allows for easy manufacturing of electrode grids and eventual scaling out to very large electrode grids. When a two-dimensional ‘matrix of electrochemical cells’ is constructed in this way, care must be taken that (1) electrodes connections to the potentiostats/galvanostats are done in a scalable manner so that it becomes viable to screen large amounts of cells (e.g., 4096) and that (2) the electrochemical cells do not influence each other.
Electrode connections to a grid/matrix of electrodes is generally done using N switches for N electrodes (each electrode is connected to a switch) [3]. This does not scale economically, since the price of e.g., 4096 switches (relays or analog switch integrated circuits) plus associated circuit boards, wiring and connectors limits the practical number of cells in a HT setup. A more economical approach would be a setup where the amount of switches does not scale linearly with N (the amount of cells) but scales e.g., with the square root of N. In matrix selection, one selects a row and a column (or: x and y position) in a square matrix (or: point in a grid) and the cell where the row and column overlap is the selected cell. The amount of switches needed for matrix selection are 2 × √N: √N switches for the rows of counter electrodes and √N switches for the columns of working electrodes. This scales economically to e.g., 4096 electrodes, since that would use only 2 × √4096 = 128 switches and opens up the possibility of brute-force screening or deposition experiments. However, with row and column connections, a possible conflict could be that ‘the other seven’ (unselected) electrodes in the connected row and column are also (partially) active, since they are electrically connected to the electrodes and might also be in contact with the same electrolyte solution.
Experiments were performed to find out whether the cells in the HT setup are truly independent and whether the matrix selection uniquely selects one counter/working electrode combination out of 64. A validation experiment with PEM water electrolysis was performed which yielded 64 cell potentials—one for each cell. These potentials were plotted in an 8 × 8 grid to observe how the position of a cell in the matrix influences the potential. The observed variation was not dependent on whether cells were positioned in the middle, side or corner of the matrix, which was expected in case the cells influenced each other. Then in a second experiment the flow was reversed, and in the case cells would influence each other through the electrolyte, a different pattern of cell potentials should be observed. This was not the case and it was thus concluded that the observed (minor) variation of potentials was due to other factors, such as differences in flow rate and/or effective electrode size (due to electrode masking by the gasket), different electrode composition/fouling, etc. The validation experiment also demonstrated that the electrochemistry performed in this setup matches theory predictions and that the observed cell potentials have low variability.

3.2. Alcohol Oxidation

To demonstrate that the HT setup can be used for electrochemical transformations that are relevant to modern electrosynthesis, the oxidation of alcohols to ketones was studied at nickel and nickel oxyhydroxide electrodes. This transformation is thoroughly described in literature, is robust and works under a variety of conditions at high yield and selectivity [7]. Moreover, since the substrate (isopropanol) is transparent in the UV whereas the product (acetone) absorbs at 285 nm, we could follow the change in product concentration of the reactor’s effluent in realtime. The electrolyte was spiked with a small amount of acetone to ‘clean’ the system from colored substances that would otherwise show up in the spectra when acetone would be formed electrochemically. Moreover, a degasser was added before the UV flow cell to remove plugs of gas that would show up in the UV spectra as fluctuating data points. The UV spectra were quantified as their first derivative spectra (to remove fluctuating baseline effects) by deconvolution using the reference (first derivative) spectra of all known components. The use of a membrane was not necessary, since the product (acetone) is reduced much less effectively than the proton at a nickel cathode [8]. The pH was chosen as low as possible so that the reaction would still occur, but colored substances did not leach from the system (and interfere with analysis).
Using 64 identical bright nickel electrodes, a cell potential of 4.16 V ± 0.08 V (1 stdev) and a Faradaic yield of 83.3% ± 4.6% (1 stdev) was obtained. Since the variation is stochastic, this variability is attributed to sources such as: fluctuations in flow rates and patterns, variable electrode size and composition (WE and CE) and analysis errors. One way to partially circumvent this variability is to increase the number of observations for a given set of parameters, so that the confidence interval becomes narrower. In a HT setup that would be usable for screening of relatively small changes, one needs to take out the source of as much system variability as possible and/or increase the number of cells in the setup.
To observe the effect of nickel deposition current density on the alcohol oxidation reaction, a library of 8 × 8 microrough nickel electrodes was used in a screening experiment. In this experiment, a layer of nickel oxyhydroxide forms on top of the microrough nickel deposits, whose varying roughness could or should translate into varying electrochemical surface areas and thus varying cell potentials when a constant current density is used in the screening [6]. Contrary to expectation, the current density did not have a measurable effect on either the cell potential or the Faradaic yield. However, comparing the two experiments on the averages and 99% confidence intervals, it can be seen that the Faradaic yield is significantly higher for the microrough deposits (89.4% with a 0.9% ci) than it is for the bright nickel control experiment (83.3% with a 1.7% ci), but that the cell potential falls within the same 99% confidence interval.
We can thus carefully propose that the deposited microrough electrode material gives a 6% higher Faradaic yield than the bright nickel electrodes at a similar cell potential, and also that the deposition of this microrough deposit is insensitive to the plating current density in the studied range.

3.3. Alkaline Water Electrolysis

The alkaline water electrolysis is an important electrochemical reaction, since it is a viable candidate (next to PEM electrolysis) for the large-scale generation of hydrogen [8]. Catalysts are in active development, and brute force screening of large libraries of various compositions might yield electrode materials not found otherwise [9,10]. In this experiment, catalytically active nanoparticles were generated using spark ablation, transported using an inert carrier gas and deposited directly onto the electrodes. Because the surface of the particles cannot react with a capping agent or ligand, the nanoparticles are effectively ‘naked’ and attach readily to the electrodes, without the need for binders, post-processing or other tricks that are necessary when nanoparticles are deposited using wet processing techniques [11].
We varied two parameters in an 8 × 8 electrode matrix: The Fe/Ni ratio, via the relative power of the spark generators, and film thickness, via the deposition time, of mixed films of nickel and iron nanoparticles deposited on a plated nickel base material. The rate of ablation in spark discharge is proportional to the input power. Because Fe and Ni have similar physical properties, their molar ablation rates are very similar (ca. 0.3 μmol/J). For these two reasons it is reasonable to assume that the relative power of the two spark generators corresponds to the relative molar ratio. It is worth noting that the combination of spark ablation with the nanomaterial printer also allows other parameters to be varied such as particle size, film morphology, as well as the composition of individual particles in a controlled and rapid manner.
The experiment was performed in the semi-parallel configuration, and 8 electrodes were measured simultaneously. The eight flows in the anolyte and catholyte flow channels were generated by the use of a 1-to-8 manifold and eight capillaries to generate a pressure drop of 0.6 bar and thereby equal flows in all eight channels. Because of the reduced diameter in the capillaries, the system was prone to blockage, and during the experiment indeed one capillary on either side got partially blocked, leading to two columns with increased cell potential due to lower flow rate and buildup of gas and thus lower effective electrode surface area. The data from both these columns was treated as outliers.
The data shows a clear effect of both the Ni/Fe ratio and the deposition time on the cell potential. A higher percentage of nickel nanoparticles leads to a higher potential, and thus decreased performance. Also, a longer deposition time leads to a lower cell potential, although above a certain deposition time the cell potential again increases. The results indicate that as more iron is deposited, more of the nickel base layer is covered with iron nanoparticles and catalysis improves, but that too much iron leads to less efficient catalysis. This observation is consistent with the good electrocatalytic properties of iron-doped nickel described in literature [12].

4. Experimental Section

4.1. Materials and Methods

4.1.1. Terminology

  • Measurement: application of current to one cell out of 64 electrochemical cells (anode/cathode combination) while monitoring cell voltage and/or analyzing the reactor outflow.
    Experiment: a complete set of 64 measurements, where each measurement is performed at a different electrochemical cell in the 8 × 8 matrix.
    Row/column: the 8 × 8 electrode matrix is always depicted with the WEs connected vertically and the CEs connected horizontally. Analogous to matrix terminology, the rows are the horizontally connected (counter) electrodes and the columns are the vertically connected (working) electrodes.
  • Sequential operation: the experiment is performed as 64 measurements in series (after each other).
  • Semi-parallel operation: the experiment is performed in eight batches of eight fully parallel measurements.

4.1.2. High Throughput (HT) Setup

An overview of the HT stack can be seen in Figure 10. The stack components were designed and manufactured as follows.
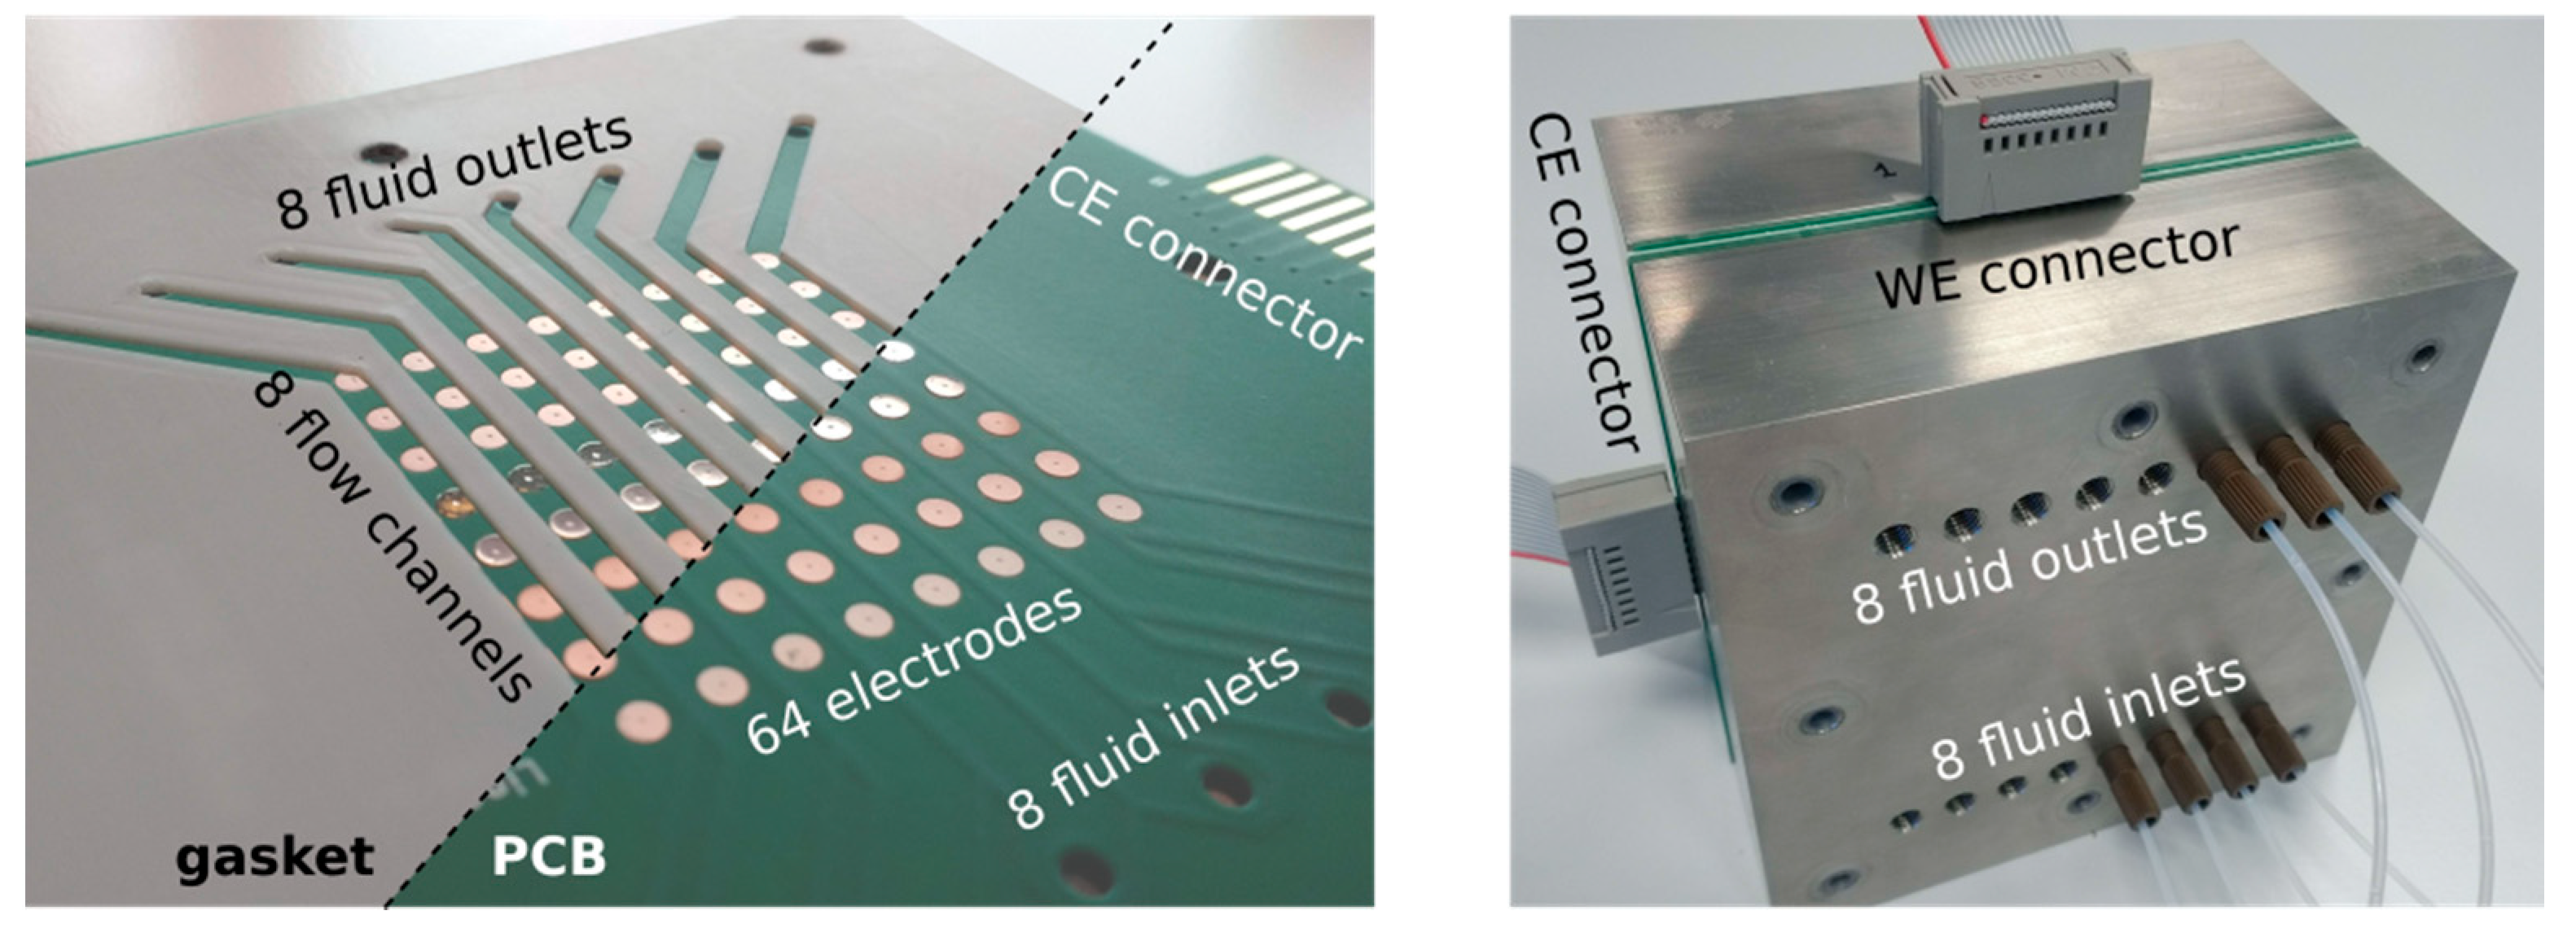
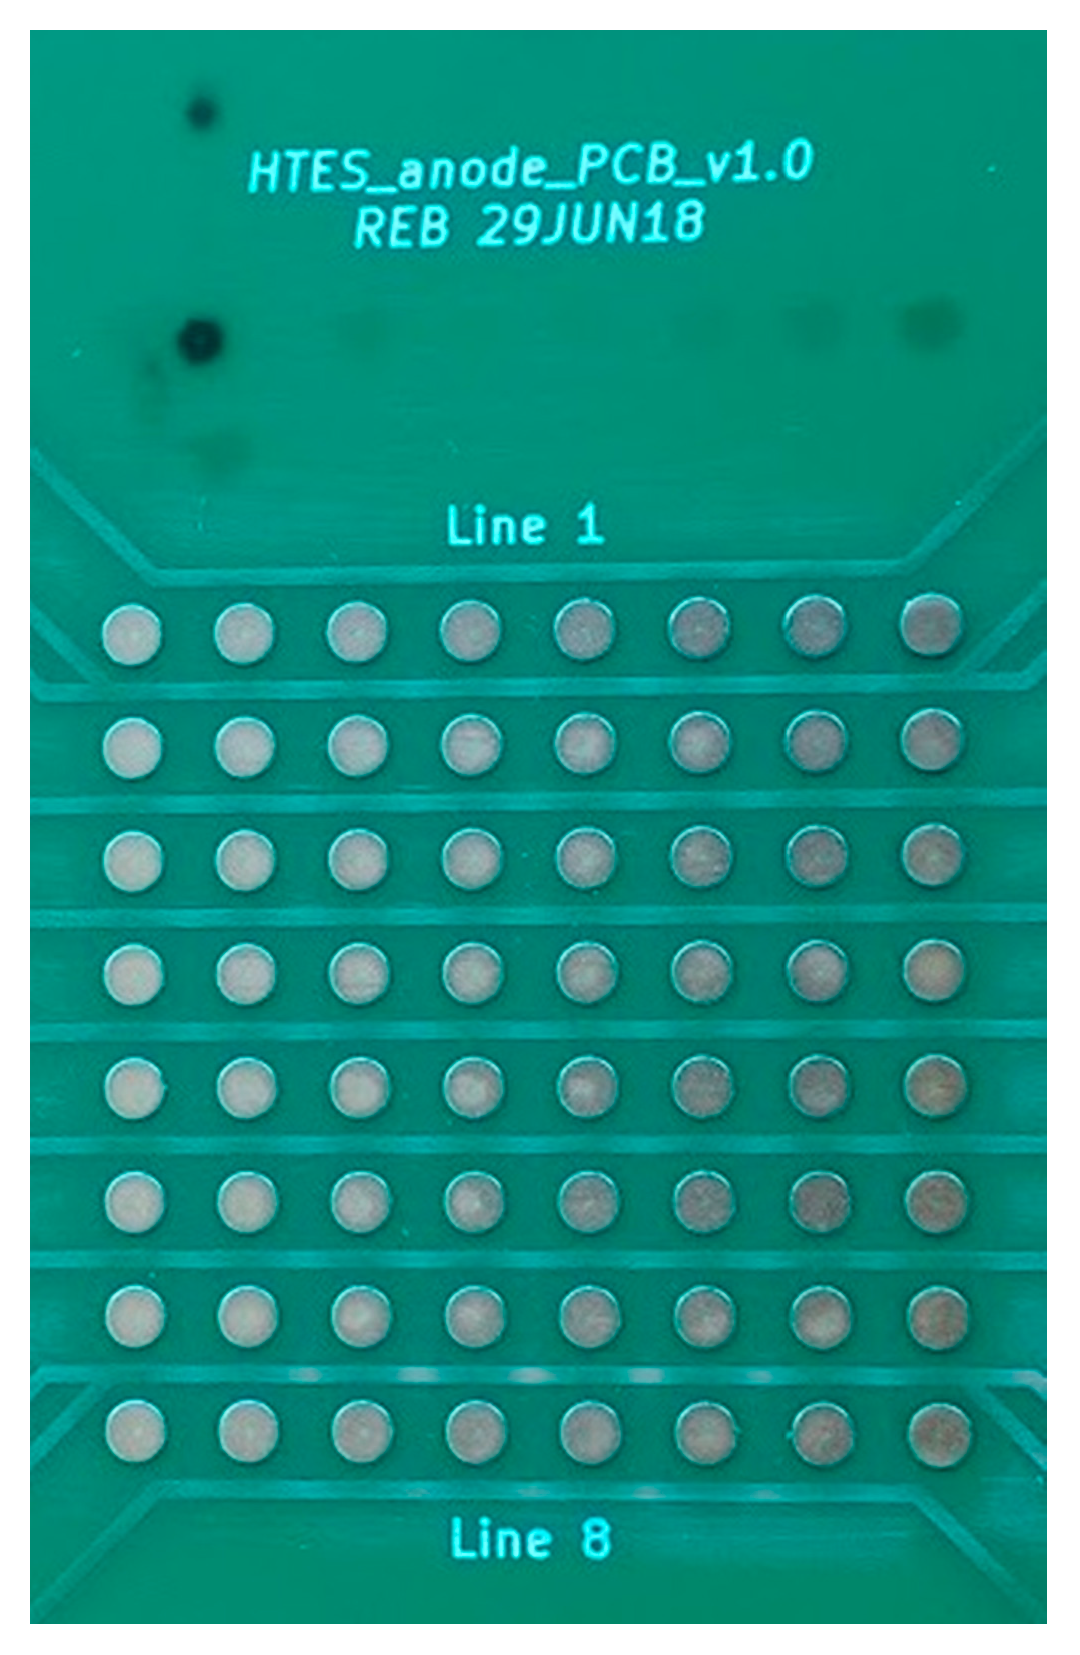
  • Electrodes with 2.5 mm diameter (4.9 mm2) were etched onto standard FR4 printed circuit boards (PCBs) with 70 µm copper and an electroless nickel immersion gold (ENIG) finish (Eurocircuit NV, Mechelen, Belgium), containing 16 through holes per PCB for electrolyte inlet (8) and outlet (8). Renderings of the PCBs can be seen in Figure 11.
  • Flow channel gaskets were cut out from 1 mm thick polytetrafluoroethylene (PTFE) sheets (Waboplast, Wormer, The Netherlands).
  • The membrane used for PEM water splitting was Nafion 115 (127 µm thickness), for alkaline water electrolysis a porous separator made of reinforced PPS (Zirfon Pearl, Agfa, Mortsel, Belgium) and for alcohol oxidation no membrane was used.
  • The PCB/gasket/membrane/gasket/PCB stack was pressed together by two 40 mm thick stainless steel 316 end plates, each having 16 fluidic connections (1/4-28 unified fine thread (UNF) flat bottom) on the outside and 16 O-ring grooves (ethylene propylene diene monomer rubber (EPDM) O-rings) on the inside for leak-tight connection to the electrode PCBs.
  • Wetted materials for the setup (excluding fluidics) were stainless steel 316 (SS316), EPDM, PCB solder mask (unknown, possibly a UV-cured polymer), PTFE, membrane material and electrode material.

4.1.3. Fluidics

  • Tubing was either PTFE or fluorinated ethylene propylene (FEP) (1/8 inch and 1/16 inch), with ethylene tetrafluoroethylene (ETFE) ferrules and polyether ether ketone (PEEK) flow splitters and adapters.
    Pumps were either PU-2080 high-performance liquid chromatography (HPLC)-type pumps (Jasco, Easton, MD, USA) or 120U/DM2 peristaltic pumps (Watson-Marlow, Wilmington, MA, USA).
    The UV-visible spectrophotometer was a Lambda 35 (Perkin Elmer, Waltham, MA, USA) equipped with a 176.700-QS flow cell (Hellma, Müllheim, Germany).
  • The membrane (hydrophobic PTFE, 0.05 μm pore size; SF18004, Tisch Scientific, North Bend, OH, USA) of the bubble trap debubbler (Darwin Microfluidics, Paris, France) was replaced after every experiment.

4.1.4. Electrode Preparation

  • Gold electrodes (soft gold, >99.9% Au, 30 μm) were plated by Haveman (Voorburg, The Netherlands) on top of the as-received PCBs.
  • Nickel electrodes (100 μm). An as-received PCB was cleaned by rubbing with ethanol and air dried. A bright nickel layer was deposited for 50 min at 100 mA/cm2 and 55 °C using a Watts bath consisting of 200 g/L NiSO4·6H2O, 100 g/L NiCl2·6H2O, 50 g/L boric acid, 3 g/L sodium lauryl sulfate and 1 g/L saccharin (stirred overnight and filtered), using a nickel anode at ca. 7 mm distance without agitation. The PCB was then rinsed with deionised water and ethanol, rubbed with ethanol, air dried and used as such or as base material for deposition of other electrode materials.
  • Microrough nickel used for alcohol oxidation. Eight different current densities (linearly spaced between 40–320 mA/cm2) at a total charge passed of 10 C/cm2 was used to plate microrough nickel deposits from a Watts bath at room temperature (40 g/L B(OH)3, 35 g/L NiCl2·6H2O, 300 g/L NiSO4·6H2O) onto the 64 nickel electrodes (randomly spaced).
    Nickel/iron nanoparticles (alkaline water electrolysis). An 8 × 8 library of Ni/Fe nanoparticle deposits of varying thickness and composition was generated using spark ablation and an aerosol printer. Mixed aerosols were generated by two parallel VSP-G1 spark generators equipped with 2 × Fe (99.9%) and 2 × Ni (99.9%) electrodes, each using 1 slm Ar as carrier gas. The Ni/Fe ratio was varied by changing the relative power (which is proportional to the ablation rate, see Section 3.3) of the individual spark generators from 0–100% in 8 linear steps, while keeping the combined power constant at 13 W. The electrodes were deposited by inertial impaction of the mixed aerosol [13], in a prototype nanomaterial printer equipped with a motorized XYZ stage. For each aerosol composition 8 spots were deposited onto the Ni electrodes of the PCB with varying deposition time, logarithmically spaced from 1–320 s per spot. Using a script to control the nanoparticle print process the electrode array was produced within 1.6 h. Each combination of deposition time and Ni/Fe power ratio was deposited once, giving a total of 64 electrode materials (Table 2).

4.1.5. Experimental Setup, Parameters and Analysis

Chemicals

All chemicals were obtained from Sigma Aldrich (St. Louis, MO, USA) and were of analytical grade and were used as received.

PEM Water Splitting

Anolyte: 0.5 M Na2SO4 acidified to pH 3.8 with H2SO4. Catholyte: 0.5 M Na2SO4, basified to pH 11 with NaOH. Membrane: Nafion 115 (127 µm thickness). Experiment with 64 identical measurements: current density 20 mA/cm2 and electrolyte flosw rates 1.0 mL/min. The theoretical cell voltage for PEM water splitting was calculated as the sum of:
  • The electrode overpotentials ηanode and ηcathode which are of the form η = α + β log(j) with:
    Anode: water oxidation at Au in sulfuric acid solution at pH 4: α = 0.98 V and β = 0.045 and j = 20 mA/cm2 leads to ηanode = 0.90 V [14].
    Cathode: proton reduction at Ni in hydroxide solution at pH 11: α = 0.65 V and β = 0.10 and j = 20 mA/cm2 leads to ηcathode = −0.48 V [15].
  • The pH corrections for both electrode reactions using the Nernst equation: (a) Vanode = 1.23 V − 3.8 × 0.059 = 1.01 V, (b) Vcathode = 0 V − 11 × 0.059 = −0.65 V.
  • A negligible membrane potential of 2.5 mV and an iR drop of 70 mV. Membrane and iR potential drop was calculated from V = IR = I × l / (σ × A) where l is either the membrane or fluid layer thickness and σ is the conductivity of the membrane or the electrolyte.

Alcohol Oxidation

The electrolyte was 0.5 M isopropanol in 0.1 M KHCO3 basified to pH 11.0 with KOH (then addition of 10 mM acetone). In experiments with 64 identical measurements the electrolyte was pumped at a flow rate of 0.42 mL/min past all 64 electrodes (no membrane was used), then through a debubbler and through a UV flow cell. Measurement sequence: (1) Current (160 mA/cm2) is ramped in 10 increments over 50 s. (2) Cell potential is recorded each second for 20 min while UV spectra are recorded. (3) Current is ramped down to 0 in 10 increments over 50 s. (4) Waiting time of 20 min is employed for the analysis to reach baseline. Each measurement thus takes around 42 min, and the total run time of the screening is ca. 45 h.
Analysis of UV spectra: Every 3 min a UV spectrum is recorded, giving ca. 6 spectra per cell and ca. 6 spectra per blank between cells. The first derivative of the spectra (with a Savitzky–Golay filter to remove fluctuating baseline and outliers due to gas bubbles) in the wavelength region between 250 and 320 nm was deconvoluted using reference (first derivative) spectra of the electrolyte and acetone, respectively, to obtain the acetone concentration in time (Figure 12).

Alkaline Water Electrolysis

Catholyte and anolyte (both 200 mL of a 30% KOH solution) were recirculated at room temperature through the anode and cathode compartments (separated by a porous separator made of reinforced PPS), respectively, by splitting a 14 mL/min flow into eight equal flows of 1.8 mL/min through a flow splitter (8 × 20 cm pieces of 250 μm ID tubing using a 9-port manifold, giving a pressure drop of ca. 600 mbar). Eight cells were run in parallel, with a measurement time of 3 h, and the total experiment thus took (64/8) × 3 = 24 h. Measurement: current was ramped up and down from 0 to 200 mA/cm2 in 100 steps with a step time of 1 s, and the cell potential was monitored every 10 s. Electrolyte drag was observed from the anode to the cathode compartment on the order of 10 mL/hour/cm2. The cell potential generally stabilized within two hours, after which it remained stable at potentials between 2.3 and 2.4 V. An expression of the form Vcell,stabilized × (1 − exp(−b(t − c)) (b ≈ 0.0005 and c ≈ −5500) was fitted on the cell potential vs. time curves to obtain the stabilized cell potential values Vcell,stabilized in a consistent manner.

4.2. Hardware Description and Experimental Sequence

4.2.1. Sequential Operation

In sequential operation, each cell is measured after the other, and only one cell is active at a time. In this mode, the active cell is selected by selecting the corresponding CE “row” and WE “column” through a selection board consisting of 2 × 8 relays. The active selection was fed into a commercial galvanostat. The relay board and galvanostat were controlled by in-house written software that could select a cell, set a current, start/stop a measurement and read out the cell potential at selected time interval, thus enabling fully automated sequential measurements.

4.2.2. Semi-Parallel Operation

In semi-parallel operation, eight WEs were measured in parallel. For these measurements, custom hardware was designed around a microcontroller with eight pulse-width modulated (PWM) outputs (to set eight currents), eight analog inputs (to read eight cell potentials) and four digital outputs (to control eight relays plus an idle state). Each PWM output was low-pass filtered and used to control a high-side bipolar current source that was optimized for the used current density (mA range), and the current source outputs were connected to the WE “column” connections. These same connections were used to monitor cell potential and fed into a bipolar-to-unipolar converter and into the analog inputs of the microcontroller. The CE “row” connections were switched with 8 relays to analog ground (when selected) or floating (when not selected). The microcontroller contained the calibration data (for the current sources and the potential inputs) and was used to communicate with PC software that controlled the experiment (select CE row, set current per WE, read potentials). This allowed for fully automated semi-parallel measurements, where 8 batches of 8 fully parallel measurements were measured sequentially.

4.2.3. Connections, Matrix Selection, Towards Real High-Throughput

To select one cell out of 64 cells, the corresponding row and column are selected such that the overlap of row and column occur where the operative cell is located:
  • For 64 cells, eight rows and eight columns are required, with a total of 16 connections
  • For N cells, √N rows and √N columns are required, with a total of 2 × √N connections
  • For 4096 cells, 64 rows and 64 columns are required, with a total of 128 connections
Construction of an electronics interface with 128 switches (relays or analog switch ICs) is still affordable. To run the system in semi-parallel operation, 64 “galvanostats” are needed, which are generally expensive, but in this case we can work with a fixed current range for a two-electrode setup, and thus we can use high-side bipolar current sources instead of galvanostats, and they can be made cheaply (less than 10 dollars per channel).

5. Conclusions

We have presented a high-throughput electrochemistry platform comprising a matrix of 64 individually addressable miniaturized flow cells. The setup allows for either 64 sequential measurements or a semi-parallel mode of operation, where eight batches of eight fully parallel measurements are performed. Because of the matrix selection scheme, the electronic interface to the setup scales with the square root of the number of cells, which allows for economical construction of high-throughput setups with a large amount of cells (e.g., 4096), paving the way to brute force combinatorial screening or deposition of electrode materials. The concept can be extended to flow and solid state batteries, and to gas or liquid sensors.
The cell potentials of the electrochemical processes occurring inside the setup match with theory predictions. The outflow of the setup can be coupled to miniaturize continuous processing steps such as gas-liquid membrane separation and to in-line analysis methods such as absorption spectroscopy combined with quantification algorithms. As such, running an automated screening sequence yields temporal data on cell potential and Faradaic yield during the measurement, for each electrochemical cell in the matrix. The setup can also be used for the preparation of a library of electrode materials, as long as the preparation can be controlled by applying a voltage or current to the electrode, e.g., electroplating, anodization or electrostatic deposition.
The anodic oxidation of alcohols on a nickel electrode was used to illustrate that the system is capable of yielding relevant information on a reaction that is studied by Avantium (Amsterdam, The Netherlands). The deposition of nanoparticles using spark ablation demonstrated that this off-the-shelf technology commercialized by VSParticle (Delft, The Netherlands) can be used to quickly generate libraries of nanostructured materials that could immediately be used in a screening experiment to find optimal catalyst preparation conditions for the alkaline water electrolysis process studied by Zero Emission Fuels (Delft, The Netherlands).

Author Contributions

Conceptualization, R.B. and K.J.S.; methodology, R.B. and K.J.S.; software, R.B.; formal analysis, R.B.; project management, R.B.; resources, K.W., T.V.P. and J.v.K.; writing—original draft preparation, R.B.; writing—review and editing, T.V.P., J.v.K. and K.J.S.; funding acquisition, K.J.S. All authors have read and agreed to the published version of the manuscript.

Funding

This research received no external funding.

Acknowledgments

R.B. and K.S. thank Avantium’s VOLTA team for brainstorming sessions on electrosynthesis, and Benno Hartog, Jorrit Rijnders and Bert Meijerink for their support on reactor design. K.W. and T.P. thank Maurits Boeije and Max Koole for discussions on printing the electrode array. J.K. thanks Maurits Boeije and Stijn Strebus for brainstorming and early tests on coatings.

Conflicts of Interest

The authors declare no conflict of interest.

References

  1. Maier, W.F.; Stowe, K.; Sieg, S. Combinatorial and high-throughput materials science. Angew. Chem. Int. Ed. 2007, 46, 6016–6067. [Google Scholar] [CrossRef] [PubMed]
  2. Potyrailo, R.; Rajan, K.; Stoewe, K.; Takeuchi, I.; Chisholm, B.; Lam, H. Combinatorial and high-Throughput screening of materials libraries: Review of state of the art. ACS Comb. Sci. 2011, 13, 579–633. [Google Scholar] [CrossRef] [PubMed]
  3. Muster, T.H.; Trinchi, A.; Markley, T.A.; Lau, D.; Martin, P.; Bradbury, A.; Bendavid, A.; Dligatch, S. A Review of high throughput and combinatorial electrochemistry. Electrochim. Acta 2011, 56, 9679–9699. [Google Scholar] [CrossRef]
  4. Adams, N.; Schubert, U.S. Software solutions for combinatorial and high-throughput materials and polymer research. Macromol. Rapid Commun. 2004, 25, 48–58. [Google Scholar] [CrossRef]
  5. D’Argenio, V. The high-throughput analyses era: Are we ready for the data struggle? High Throughput 2018, 7, 8. [Google Scholar] [CrossRef] [PubMed] [Green Version]
  6. Manandhar, K.; Pletcher, D. The preparation of high surface area nickel oxide electrodes for synthesis. J. Appl. Electrochem. 1979, 9, 707–713. [Google Scholar] [CrossRef]
  7. Lyalin, B.V.; Petrosyan, V.A. Oxidation of organic compounds on NiOOH electrode. Russ. J. Electrochem. 2010, 46, 1199–1214. [Google Scholar] [CrossRef]
  8. Wang, D.; Wang, P.; Wang, S.; Chen, Y.-H.; Zhang, H.; Lei, A. Direct electrochemical oxidation of alcohols with hydrogen evolution in continuous-flow reactor. Nat. Commun. 2019, 10, 2796. [Google Scholar] [CrossRef] [PubMed] [Green Version]
  9. Jaramillo, T.F.; Ivanovskaya, A.; McFarland, E.W. High-throughput screening system for catalytic hydrogen-producing materials. J. Comb. Chem. 2002, 4, 17–22. [Google Scholar] [CrossRef] [PubMed]
  10. Haber, J.A.; Cai, Y.; Jung, S.; Xiang, C.; Mitrovic, S.; Jin, J.; Bell, A.T.; Gregoire, J.M. Discovering Ce-rich oxygen evolution catalysts, from high throughput screening to water electrolysis. Energy Environ. Sci. 2014, 7, 682–688. [Google Scholar] [CrossRef] [Green Version]
  11. Pfeiffer, T.V.; Feng, J.; Schmidt-Ott, A. New developments in spark production of nanoparticles. Adv. Powder Technol. 2014, 25, 56–70. [Google Scholar] [CrossRef]
  12. Lu, X.; Zhao, C. Electrodeposition of hierarchically structured three-dimensional nickel–iron electrodes for efficient oxygen evolution at high current densities. Nat. Commun. 2015, 6, 6616. [Google Scholar] [CrossRef] [PubMed] [Green Version]
  13. Fernández de la Mora, J.; Rao, N.; McMurry, P.H. Inertial impaction of fine particles at moderate Reynolds numbers and in the transonic regime with a thin-plate orifice nozzle. J. Aerosol Sci. 1990, 21, 889–909. [Google Scholar] [CrossRef]
  14. Barnartt, S. The oxygen-evolution reaction at gold anodes: II. Overpotential measurements and reaction mechanism in sulfuric acid solutions. J. Electrochem. Soc. 1959, 106, 991–994. [Google Scholar] [CrossRef]
  15. Brown, A.P.; Krumpelt, M.; Loutfy, R.O.; Yao, N.P. Kinetics of the hydrogen evolution reaction on mild steel and nickel cathodes in concentrated sodium hydroxide solutions. J. Electrochem. Soc. 1982, 129, 2481–2487. [Google Scholar] [CrossRef]
Figure 1. Schematic depiction of the HT setup. (A) Side view of a single channel, with anolyte and catholyte flowing from left to right, past eight CEs or WEs, respectively. (B) Top view of all channels, showing the electrical connections to all 64 electrodes. (C) Top view of all channels, showing two distinct flow configurations (left is series connected, right is parallel connected).
Catalysts 10 01165 g001
Figure 2. Left: Illustration of one PCB with 64 electrodes, showing part of a PTFE gasket visualizing fluid inlets and outlets, flow channels, and electric connector. Right: Partly assembled HT setup stack showing WE and CE connectors, and fluidic inlets and outlets which are repeated on the reverse side.
Catalysts 10 01165 g002
Figure 3. Spatial distribution of cell voltages with cells connected in series (A) and the same with both electrolyte flows in reverse direction (B). (C) shows the distribution of the cell voltages (green) and the theoretical cell voltage of 3.11 V (blue).
Catalysts 10 01165 g003
Figure 4. Experimental setup for the alcohol oxidation experiments.
Catalysts 10 01165 g004
Figure 5. Acetone production (measured concentration minus 10 mM acetone baseline) measured over time using UV-visible spectroscopy with quantification through deconvolution with first-derivative spectra.
Catalysts 10 01165 g005
Figure 6. Spatial distribution of cell voltages (A) and Faradaic yield (B) for the alcohol oxidation reaction at Ni(O)OH. (C) The same data, with cell voltage plotted against Faradaic yield.
Catalysts 10 01165 g006
Figure 7. The effect of plating current on cell voltage (A) and Faradaic yield (B) (8-point average and standard deviation). (C) Comparison between the Ni(O)OH material and the base bright nickel material (excluding outliers in “column” 3).
Catalysts 10 01165 g007
Figure 8. Library with Ni and Fe nanoparticles deposited using spark ablation. Nanoparticle (NP) deposition time is varied in the vertical direction (top is 1 s, bottom is 320 s), NP Ni/NP Fe ratio is varied in the horizontal direction (left is 100% Fe generator power, right is 100% Ni generator power). Top right shows a dark spot which was used to assess the deposition area. The spots underneath the dark spot visualize the effect of an increasing deposition time.
Catalysts 10 01165 g008
Figure 9. (A,B) Univariate plots after removal of outliers. (C) Contour plot showing cell potential variation with nickel/iron generator power ratio and deposition time. The dots are the locations of the experimental data points.
Catalysts 10 01165 g009
Figure 10. 3D rendering of the HT setup. From left to right: end plate, PCB, gasket, membrane, gasket, PCB, end plate. Fluid enters the setup from the left (catholyte) or right (anolyte), flows through the end plate, through the PCB into the flow channel in the gasket, and back out on the other side of the gasket, and through the PCB and end plate again.
Catalysts 10 01165 g010
Figure 11. Back (top row) and front (bottom row) copper of the anode (left column) and cathode (right column) PCBs. The connections on the side of the PCBs are connected from the back with a ‘via’ underneath each circular electrode. On the front side, copper traces are used to mark the fluidic channels and to form a seal with the PTFE gaskets by protruding out of the PCB surface by 70 µm (the copper thickness). On the back side, these traces are repeated so that additional force is applied by the stainless steel end plates onto the sealing surfaces. Eight mounting holes are located at the corners and halfway each edge.
Catalysts 10 01165 g011
Figure 12. Typical recorded first-derivative spectrum and its deconvolution using reference spectra of acetone and electrolyte.
Catalysts 10 01165 g012
Table 1. Results of the alcohol oxidation experiments. (Stdev = standard deviation, ci = confidence interval).
Bright Nickel (Control)Microrough Nickel
MetricMeanStdev99% ciMeanStdev99% ci
Cell potential4.16 V0.08 V0.03 V4.12 V0.07 V0.03 V
Faradaic yield83.3%4.6%1.7%89.4%2.6%0.9%
Table 2. Parameter levels for the nanoparticle deposits used in the alkaline water electrolysis experiment. The Ni/Fe ratio in the deposit was varied by adjusting the relative power of the two spark generators, keeping the total power constant.
Deposition Time [s]Rel. Power G1 Ni [%]Rel. Power G1 Fe [%]
11000
58515
106931
205446
403862
802377
160892
3200100

