Article

Catalytic Removal of Alizarin Red Using Chromium Manganese Oxide Nanorods: Degradation and Kinetic Studies

1
Department of Chemistry, University of Gujrat, Hafiz Hayat Campus, Gujrat 50700, Pakistan
2
Department of Chemistry, University of Okara, Okara 56300, Pakistan
3
Department of Chemistry, Government College University, Faisalabad 38000, Pakistan
4
Department of Chemistry, Kohat University of Science and Technology, Kohat 26000, Pakistan
5
Department of Chemistry, Quaid-i-Azam University, Islamabad 45320, Pakistan
6
Department of Chemistry and Chemical Engineering, SBA School of Science and Engineering, Lahore University of Management Sciences (LUMS), Lahore 54792, Pakistan
7
Faculty of Pharmacy, Universiti Teknologi MARA Cawangan Selangor Kampus Puncak Alam, Bandar Puncak Alam 42300, Malaysia
8
Atta-ur-Rahman Institute for Natural Products Discovery (AuRIns), Universiti Teknologi MARA Cawangan Selangor Kampus Puncak Alam, Bandar Puncak Alam 42300, Malaysia
9
Department of Biomedical Science, Faculty of Medicine and Health Sciences, Universiti Putra Malaysia, Serdang 43400, Malaysia
10
Halal Institute Research Institute, Universiti Putra Malaysia, Serdang 43400, Malaysia
*
Authors to whom correspondence should be addressed.
Catalysts 2020, 10(10), 1150; https://doi.org/10.3390/catal10101150
Submission received: 7 July 2020 / Revised: 27 August 2020 / Accepted: 28 August 2020 / Published: 6 October 2020
(This article belongs to the Special Issue Photocatalysis and Environment)

Abstract

:
Dye removal through photocatalytic degradation employing nanomaterials as catalysts is a growing research area. In current studies, photocatalytic alizarin red (AR) dye degradation has been investigated by designing a series of Cr based manganese oxide nanomaterials (MH1–MH5). Synthesized nanomaterials were characterized by powder X-ray diffraction, scanning electron microscopy/energy dispersive x-ray, Brunauer–Emmett–Teller, and photoluminescence techniques and were utilized for photocatalytic AR dye degradation under UV light. AR dye degradation was monitored by UV–visible spectroscopy and percent degradation was studied for the effect of time, catalyst dose, different dye concentrations, and different pH values of dye solution. All the catalysts have shown more than 80% dye degradation exhibiting good catalytic efficiencies for dye removal. The catalytic pathway was analyzed by applying the kinetic model. A pseudo second-order model was found the best fitted kinetic model indicating a chemically-rate controlled mechanism. Values of constant R2 for all the factors studied were close to unity depicting a good correlation between experimental data.

Graphical Abstract

1. Introduction

Textile dyes produce large amounts of effluents having contaminants that are often discharged to surface water bodies and groundwater aquifers [1]. These discharges are a major source of concern as they have considerable potential to disturb the local and downstream ecosystems. Printing, textile, papermaking, pharmaceutical, food processing, and cosmetics industries can all be sources of effluent containing significant concentrations of dyes and pigments [2,3,4,5]. Most of the dyes which are being used in the textile industries are usually stable and nonbiodegradable [6]. These dyes belong to the class of synthetic organic compounds and are considered as major environmental pollutants due to their large-scale production, high aromaticity, chemical stability and toxicity [7,8,9]. To reduce the risk of environmental pollution, it is necessary to treat wastewater reserves before discharging them into the environment [10]. Various physical and chemical processes have been employed for dye degradation in wastewater treatment. However, these processes cannot be effectively employed to treat the wide range of wastewater effluents for dye degradation due to their high operation costs, energy consumption, reduced efficiency due to the chemical stability of dyes and/or the complexity of their degradation [11].
However, the recent trend is to combine techniques for sustainability, as an oxidation/catalysis or adsorption/catalysis to overcome the drawbacks of conventional techniques [12]. The photocatalytic degradation of dyes by nanoparticles as catalysts is a growing research area due to its quick oxidation, no formation of polycyclic products, and oxidation of pollutants [13]. Particles in the nanometer size range have a very large surface area, thereby offering many binding sites to the reacting species. A huge number of transition metal oxides catalysts were synthesized and employed for dye degradation purposes employing direct sunlight or UV light [14]. Metal oxide-based nanomaterials are widely employed due to their flexibility to modulate several characteristics—i.e., structure, composition, morphology, and surface area enhancements [15,16,17]. Oxides like TiO2, ZnO, and CdS are effective with UV light, easily available, relatively inexpensive and chemically stable photocatalysts [18,19,20,21]. Doped/undoped manganese oxides nanomaterials are promising materials due to their low cost, high stability, and good environmental compatibility [22].
Alizarin red (AR) has been widely employed in the textile industry [23]. It is a major textile effluent and has been used for the photocatalytic degradation of alizarin red in an aqueous medium [24]. Various studies were performed for photodegradation of AR dye using various photocatalysts. Joshi and Shrivastava used ZnO and TiO2 as photocatalysts for AR dye degradation under UV and attained maximum removal in 200 min with very low initial dye concentration (20–60 ppm) [25]. Kansal et al. [26] used ZnO nanoparticles for AR dye degradation and achieved 77% degradation in 90 min by using a UV chamber.
In the present study, chromium-doped manganese oxide nanomaterials (MH1–MH5) were synthesized by the hydrothermal method. The effect of the time of contact between the synthesized nanomaterials and the AR dye, different catalyst doses, various dye concentrations in the aqueous solutions, and variating pH of the dye solutions on nanomaterials were investigated. The kinetic parameters have been evaluated to study the reaction mechanisms.

2. Results and Discussion

2.1. Characterization of Nanomaterials (MH1–MH5)

2.1.1. Elemental Analysis by EDX

The elemental analysis of all the synthesized materials (MH1–MH5) was carried out by energy dispersive X-ray (EDX) analysis technique coupled with scanning electron microscopy (SEM). The spectrographs obtained in this case are presented in supplemental data (Figure S1). The elemental composition found in this respect is reported in Table 1 along with other parameters.
The results in Table 1 for nanomaterials (MH1–MH5) indicate that the analyzed elemental compositions are in close agreement with the expected elemental percentages in accordance with the reactants used for synthesis. The high-intensity peaks of Mn for MH1–MH5 indicate the presence of Mn with a major elemental composition, with percentage ranging from 48.05 to 54.88%. For the percentage composition ranges for Cr (5.06–6.26%) and O (37.90–43.68%), a minor presence was observed. EDX patterns are shown for MH1–MH5 in supplemental data (Figure S1).

2.1.2. Powder X-Ray Diffraction (PXRD) Analysis

The phase composition and particle size of the synthesized materials were characterized by PXRD and the data obtained are reported in Table 2. The PXRD patterns of nanomaterials (MH1–MH5) are presented in Figure 1. Powder patterns for samples were matched to standard patterns of nanomaterials. Specific hkl values were evaluated corresponding to 2 theta values. These hkl values were matched with standard PXRD patterns for α-MnO2 (JCPD No.44-0141), (JCPD No. 01-1127), CrO3 (JCPD No. 74-0326, 70-3766). The PXRD of (MH1–MH5) depicted the presence of α-MnO2 as a major phase with slight incorporation of CrO3 and MnCrO4. It was indicated by the powder patterns that the peak for α-MnO2 showed a gradual decrease in intensity as the concentration of Cr increased from MH1 to MH5 indicated by the peaks for CrO3. The major phase α-MnO2 is tetragonal in structure having P4_2/mnm space group. These peak assignments in PXRD jointly with EDX results indicate that the MH1–MH5 samples are monocrystalline materials with the elemental composition given in Table 2.
After the PXRD phase assignments, other parameters—i.e., the crystallite size, dislocation densities, crystallite volume, and microstrain, were calculated for all the synthesized materials and are reported in Table 2. The particle size calculation was performed using the Debye Sherrer formula [27] as follows:
D = 0.91λ/βcosθ
where D is the particle size of the sample and λ is the wavelength of the X-ray diffraction beam and has a value of 1.5405980. The angle at which diffraction occurs is cos θ, and β is the FWHM (full width at half maximum) value [28].
The volume (V) of crystalline material was calculated using the relation (V= D3) [29]. The dislocation density (δ), which represents the extent of defects in the sample, is defined as the length of the dislocation lines per unit volume of the crystal and is calculated using Equation (2) [30].
δ = 1/D2
The strain-induced broadening in powders due to crystal imperfection and distortion is calculated as a microstrain (ε) [31]. Positive values of ε represent a tensile strain while negative values represent a compressive strain. Strain-induced broadening (microstrain) in nanomaterials was calculated by Equation (3) [31] as follows:
ε = β/4tanθ
The average crystallite sizes for (MH1–MH5) at their corresponding intensities were 44.02 for MH1, 38.90 for MH2, 49.60 for MH3, 50.22 for MH4 and 36.82 for MH5. It was noted that the crystallite size is increased by the inclusion of chromium which causes the crystal stress as depicted in Table 2. The values of dislocation densities show the extent of defects, which are fewer in nanomaterials (MH1–MH5). Nanomaterials with smaller crystallite sizes showing greater stabilities. Values for crystalline volume indicates that there is proper incorporation of chromium ions into regular lattice sites of O in the samples. The inclusion of Cr ions in the α-MnO2 structure causes an increase in the strain and increases crystal imperfections. Positive values depicted the tensile microstrain in MH1–MH5 nanomaterials which can be due to the lattice shrinkage.

2.1.3. Scanning Electron Microscopy (SEM) Analysis

Surface morphological characteristics were analyzed for all the synthesized series of nanomaterials by SEM and are reported in Table 3. SEM images of representative material MH5 are shown in Figure 2 while other nanomaterials (MH1–MH4) are enlisted in the supplemental data (Figure S2a–d) and the surface morphological characteristics are reported in Table 3. SEM images indicated that synthesized nanomaterials (MH1–MH5) are crystalline and monodisperse. The surface morphological characteristics indicated crystalline rod-like structures for all the synthesized nanomaterials.

2.1.4. Brunauer–Emmett–Teller (BET) Analysis

The specific surface area of nanomaterials (MH1–MH5), calculated by multipoint BET, and pore structure parameters were calculated from the DFT method (based on molecular modelling and takes into account direct interaction of adsorbate with the adsorbent surface) and are enlisted in Table 4. The specific surface area of nanomaterials was in the range of 20–46 m2/g. MH3 has the maximum surface area of 46.32 m2/g, whereas MH5 has a surface area of 20.45 m2/g but smaller pore volumes—0.038 and 0.032, respectively—indicating materials were microporous. Values of the constant (C) for MH2, MH3, and MH4 were <100, which indicates a strong adsorbate–adsorbent interaction. For MH1 and MH5, the values are high due to the high porosity of the material. Comparison of the experimental data with the BET results showed that varying the Cr concentration during the synthesis of nanomaterials (Section 2.2), significantly affected the specific surface area and pore size distribution of nanomaterials.

2.1.5. Photoluminescence (PL) Study

The PL emission spectra of nanomaterials (MH1–MH5) have been obtained through a PL spectrophotometer with an exciton wavelength of 420 nm. The Cr-doped manganese oxide nanomaterials exhibited some sharp and broad PL peaks in the visible region from 420 to 700 nm. Figure 3 shows the PL spectra of nanomaterials (MH1–MH5) giving prominent peaks at 435, 452, 488, 588 and 630 nm corresponding to 2.85, 2.74, 2.54, 2.11 and 1.97 eV energy range. In this region, the emission results from the radiative recombination of the photogenerated hole with an electron occupying oxygen vacancy [32]. An increase in the emitted intensity in the visible region was observed in PL peaks with increasing Cr-doping [33] which most probably originated from the near band edge (NBE) due to the recombination of free exciton through exciton–exciton collision processes [32]. The narrower PL peaks also designate a lower trap density [34] in the synthesized materials which is advantageous for them to be applied as efficient photocatalysts [35]. Hence, synthesized nanomaterials may show prominent catalytic efficiencies.

2.2. Catalytic Activity Studies

2.2.1. Photocatalytic Degradation of AR by Nanocatalysts (MH1–MH5)

Photocatalytic AR dye degradation activity (see Section 3.4) carried out under a UV light and sample aliquots were taken at different time intervals. Absorbance at 505 nm was measured by the UV spectrophotometer for all the aliquots taken during the photocatalytic AR dye degradation under the UV light at different time intervals. For the absorbance, the percentage of dye degradation was calculated as described in Section 3.4. The peaks at 505 nm tend to decrease with the increase in the photocatalytic reaction time indicating the decomposition of the aromatic ring. Similarly, different factors like the effect of time, catalytic dose, initial dye concentrations, and pH were investigated by calculating the percentage of dye degradation.
The absorption spectrum of the dye solution (without catalyst) before and after keeping it without UV light irradiation for 180 min is given in Figure S3a (supplemental data) whereas the UV spectra of AR solution at start and after 180 min of UV light irradiation is given in Figure S3b (supplemental data). No change was observed in the AR dye solution after keeping it 180 min without UV light irradiation whereas a very minute change was observed for the dye solution irradiated with UV light for 180 min. The photocatalytic AR dye degradation with all synthesized nanomaterials (MH1–MH5) at various time intervals was calculated and showed more than 80% degradation of dye as shown in Figure S4 (supplemental data). Hence, the effect of different factors on the percent dye degradation is elaborated for most active catalysts in discussion below.

2.2.2. Effect of Time

Photocatalytic dye degradation under UV light was investigated at different time intervals—i.e., 30, 60, 90, 120, 150, and 180 min and the percentage of dye degradation values calculated are shown in Table 5. Nanomaterials (MH1–MH5) have shown a degradation of more than 40% dye after 30 min of photocatalytic dye degradation under UV light. An increase in the percentage of dye degradation was observed with every increasing time interval. A dye degradation of more than 80% was calculated at the end of photocatalytic activity by nanomaterials. Among all the nanomaterials MH1 and MH5 showed maximum photocatalytic efficiencies with 88.99 and 88.89% dye degradation, respectively (Figure 4). The correlation between the percentage of dye degradation and photocatalytic activity time was found to be significant as indicated by R2 values (Figure 5). The correlation between the percentage of dye degradation and photocatalytic activity time for (MH2–MH4) are presented in Figure S5 (supplemental data).

2.2.3. Effect of Photocatalyst Dosage

The effect of the catalyst dose on the dye degradation was investigated by changing the catalysts (MH1–MH5) dosage—i.e., 0.020, 0.025, 0.030, 0.035, and 0.040 g/L for 60 min irradiation of UV light as shown in Figure 6. The percent degradation of the AR dye (200 ppm) was calculated for (MH1–MH5) nanomaterials and is given in Table 6. The percentage of dye degradation was found increase with increasing catalyst dose from 0.020 g/L to 0.040 g/L for nanomaterials. An increase in the percentage of dye degradation was observed by increasing the dose of the catalysts. A dye degradation of more than 38% was observed for 0.020 g of catalysts (MH1–MH5) dose which got increased to more than 80% for all the nanomaterials by increasing dose to 0.040 g. The highest dye degradations (83.78 and 84.34%) were achieved after 60 min irradiation of UV light for dosage 0.040 g/L of MH4 and MH5. The maximum increase in the dosage of nanomaterials (MH1–MH5) (0.040 g/L) results in a maximum dye degradation, possibly contributed by an increased surface provided by catalyst resulting in more photons AR arriving at the surface of catalysts. The correlation between the percentage of dye degradation and catalysts doses were found to be significant as the R2 values calculated were close to 1 (Figure 7). The correlations between the percentage of dye degradation and catalyst dose for (MH1–MH3) are presented in Figure S6 (supplementary data).

2.2.4. Effect of Dye Concentration

The effect of AR dye solution concentration on its degradation percentage was investigated by changing the solution concentrations—i.e., 50, 100, 150, 200, and 250 ppm—for photocatalytic activity with 60 min UV light irradiation (shown in Figure 8). The percentage of dye degradation of different AR dye solution concentrations was calculated for (MH1–MH5) nanomaterials and is given in Table 7. The percentage of dye degradation of AR was found to be decreased with increasing concentrations of dye solution from 50 ppm to 250 ppm for nanomaterials. More than 80% dye degradation was observed for when 50 ppm solution of AR was employed for catalysts (MH1–MH5), which decreased to 60% for all the nanomaterials with increasing solution concentrations up to 250 ppm.
The highest dye degradations (83.87% and 83.54%) were achieved after 60 min irradiation of UV light for 50 ppm of dye solution by catalysts MH3 and MH5. In contrast, increasing dye concentrations gradually from 50 ppm to 250 ppm tended to decrease the percentage of dye degradation to 61.11% for MH3 and 63.21% for MH5. The correlation between the percentage of dye degradation and dye concentrations was found to be significant as the R2 value calculated was close to 1 (Figure 9). The correlation between the percentage of dye degradation and different dye concentrations for (MH1–MH3) are presented in Figure S7 (supplemental data).
The decreased degradation at higher AR dye concentrations is ascribed to the adsorption of more dye molecules on the surface of the catalyst. This results in a decrease in the number of active sites on the catalyst surface. Additionally, an increase in dye concentration causes a decrease in the number of photons reaching the surface of catalysts, resulting in less UV light available for the exciton of catalyst particles due to more possible absorption by dye molecules.

2.2.5. Effect of pH of the Medium

The effect of pH of AR dye solution (200 ppm) on its percent degradation was investigated by changing the solution pH from acidic (pH = 3, 5), neutral (7) and basic (9, 11) for photocatalytic activity with 60 min UV light irradiation (shown in Figure 10). The percentage degradations of different AR dye solutions with different pH were calculated for (MH1–MH5) nanomaterials and are given in Table 8. The percentages of dye degradation were found to be increased with increasing solution pH of AR from acidic to basic medium. Almost 25–29% dye degradation was observed at acidic pH (3 and 5). The percentage degradation of AR was increased up to 48–50% with a neutral medium (pH 7) of dye solution. In total, 64–79% dye degradation was observed at basic pH (9, 11) of dye solution. The highest dye degradation (76.97% and 78.51%) was achieved after 60 min irradiation of UV light for pH 11 of dye solution by catalysts MH4 and MH5. The correlation between the percentage of dye degradation and pH of AR dye solution was found to be significant as the R2 value calculated was close to 1 (Figure 11). The correlation between the percentage of dye degradation and different pH of dye solution for MH1–MH3 are presented in Figure S8 (supplemental data). MH5 was an efficient catalyst, among all showing more than 80% dye degradation for all the factors studied, indicating the positive influence on degradation by increasing Cr doping.

2.3. Kinetic Study

Pseudo kinetic models, such as pseudo-first-order kinetics and pseudo-second-order, are frequently used to explain the adsorption kinetics of solid/liquid systems [36,37,38]. The kinetics of dye degradation on the surface of nanomaterials (MH1–MH5) was illustrated best by the pseudo-second-order kinetic model. The equation of the pseudo-second-order reaction is as follows:
t/Ct = 1/k2Ct2 + t/Co
Pseudo-second order chemical reaction kinetics of dye degradation at different time intervals provides the best correlation of the experimental data, which are close to the unity depicted in Figure 12, and the reaction mechanism is found to be chemically rate-controlling [36]. As UV-light falls upon the metal oxide catalyst, electrons (e-) of the nanoparticles are excited from the valence band (VB) to the conduction band (CB), which results in generating the positive hole (h+) in the valence band. The electrons in the CB or stored in nanorods are trapped by the O2 molecule to form a reactive superoxide anion radical (O2−). In contrast, the positive holes present in the VB react with water molecule and form hydroxyl radicals (OH). These created radicals are highly reactive toward the photo degradation of AR dye [8]. A proposed mechanism of AR dye degradation is illustrated in Figure 13.
For all the factors, the correlation was found for dye concentration after 60 min or photocatalytic activity under UV light with the factor studied enlisted in Table 9. Values of correlation constant R2 at different time intervals of photocatalytic activity were close to unity, as shown in Figure S9 of the supplementary data. Values of correlation constant R2 for different catalyst doses, dye concentrations, and pH values were close to unity, as shown in Figures S10–S12 (supplemental data).

3. Materials and Methods

3.1. Chemicals and Reagents

KMnO4, K2Cr2O7, HCl and AR dye were purchased from Sigma Aldrich (Saint Louis, MO, USA). All the chemicals were of analytical grade and used without further purification.

3.2. Synthesis of Chromium Manganese Oxide Nanomaterials (MH1–MH5)

The MH1 sample was synthesized as 0.948 g of KMnO4 and 0.24 g of K2Cr2O7 were dissolved in 50 mL of water and shifted to a Teflon line parr reactor. In total, 20 mL of HCl was added subsequently to the mixture. The reaction mixture was stirred for 30 min and the parr reactor was sealed at heated at 180 °C for 24 h. After, the heat treatment reactor was cooled down to the room temperature and opened. A dark brown powdered solid was obtained at the base of reactor. The powdered solid was filtered off and washed with adequate water. The MH2–MH5 samples were prepared by the same method used for MH1 by using 0.41, 0.35, 0.18 and 0.30 g of K2Cr2O7 for synthesis, respectively. The synthesized MH1–MH5 were obtained as a dark brown powder and were characterized and utilized for catalytic studies. Their found unit formula, powder X-ray diffraction (PXRD) peaks and composition (by energy dispersive X-ray (EDX)), along with the synthetic conditions, are summarized in Table 1.

3.3. Characterization Techniques

Powder X-ray diffraction (PXRD) measurements were performed in an X-ray diffractometer (Bruker, AXS D8; Yokohama-shi, Japan) with Cu-Kα radiation (1.5406 Å) at a scanning rate of 10° per min in the 2θ range from 10° to 90°. The morphological features of catalysts were characterized by a scanning electron microscope (SEM) (JEOL, JSM-6360 EO; Tokyo, Japan), and the elemental composition was estimated by an energy dispersive X-ray (EDX) diffractometer (JEOL JSM-6360 LV; Tokyo, Japan). The surface area and pore structure parameters were calculated by a Brunauer–Emmett–Teller (BET) analysis performed through Quantachrome Nova 2200e (Tokyo, Japan). A sonicator (Bransonic 2510EMT bath; Darmstadt, Germany) was used for the surface area deployment of nanomaterials. A PTFE(polytetrafluoroethylene)-lined, Stainless Steel, Parr 5521 high-pressure compact Autoclave was used for the temperature and pressure treatments. A UV lamp (length: 288 mm, pipe diameter: 16 mm, voltage: 220 V, power; 8 W, wavelength range: 240–285 nm) was used as a light source for photocatalytic alizarin red (AR) dye degradation activity. The catalytic dye degradation was studied by an ultraviolet (UV) spectrophotometer (Shimadzu; Osaka, Japan) in the frequency range of 250–800 nm.

3.4. Photocatalytic Activity

Photocatalytic alizarin red (AR) dye degradation was conducted according to previous reports [19,39,40] with some modifications. A 200 ppm solution of AR dye was prepared in water. Blank experiments were conducted for the AR dye solution without the presence of catalyst. One of the blank experiments was conducted by keeping the sample of dye solution for 180 min without UV light irradiation and the absorption spectra were taken at different time intervals. Another experiment was done by irradiating the dye solution for 180 min and the UV spectra were measured at various time intervals by taking sample aliquots.
To measure the photocatalytic activity in the presence of a catalyst, 50 mL of 200 ppm AR dye solution was subjected to stirring in beaker under UV light source in the presence of 0.02 g catalysts (MH1). Aliquots of 5 mL from reaction mixture were taken at different time intervals of 0, 30, 60, 90, 120, 150 and 180 min. is Catalysts in sample aliquots were spun down by a centrifuge for 1 min and were separated from reaction mixture. The separated catalyst was not added back to the reaction mixture. After the separation of the catalyst, the UV spectrum was measured from the UV spectrophotometer for all the taken aliquots at different time intervals. From the spectrum, absorbance at 501 nm was noted and the percentage degradation of AR was calculated for all the sample aliquots by following Equation (5) [39].
% Degradation = Co − Ct/Co × 100
where Co is the initial concentration and Ct is the concentration at different sampling times. The concentration of AR after the reaction time was measured by the calibration curve between the absorbance and known AR concentration. The unknown AR concentration for the measured absorbance at different time intervals was calculated by the linear equation of known data. The same method was adopted to check the catalytic activity for all other catalysts (MH2–MH5).
The percentage degradation of the AR dye was calculated by variating the initial dye concentration (50, 100, 150, 200 and 250 ppm), the change in catalyst dose (0.015, 0.02, 0.025, 0.03 g, 0.035 g 0.040 g) and the pH of the dye solution (3, 5, 7, 9, 11) after 60 min of photocatalytic activity under UV light irradiation by following the same procedure as described above. To study the effect of different pHs of the AR dye solution, the pH was adjusted by employing HCl for an acidic pH and NaOH for a basic medium.

4. Conclusions

The presented work describes photocatalytic AR dye degradation by a series of Cr-based manganese oxide nanomaterials (MH1–MH5). All the catalysts have shown more than 70% AR dye degradation, exhibiting the good catalytic efficiencies for dye removal. MH1 and MH5 showed more than 85% dye degradation for the effect of time intervals, whereas MH4 and MH5 showed more than 80% dye degradation for different catalyst doses. MH3 and MH5 showed more than 60% dye degradation for different dye concentrations employed. MH4 and MH5 showed more than 70% dye degradation for different pH values of dye solution. The catalytic pathways were analyzed by applying the kinetic model. The pseudo second order was found to be the best fitted kinetic model, indicating a chemically rate controlled mechanism. Values of constant R2 for all the factors studied were close to unity, depicting good correlation between the factors studied. MH5 was an efficient catalyst among all, showing more than 80% dye degradation for all the factors studied.

Supplementary Materials

The following are available online at https://www.mdpi.com/2073-4344/10/10/1150/s1. Figure S1: Energy dispersive X-ray (EDX) Spectra of Chromium Doped Manganese Oxide Nanomaterials (MH1-MH5), Figure S2: SEM Images of MH1, MH2, MH3, MH4, Figure S3(a): UV Absorption Spectrum of AR Dye; Figure S3(b): UV Absorption Spectra of AR Dye; Figure S4: Percent AR Dye Degradation at Different Time Intervals (30, 60, 90, 120, 150 and 180 min) by Photocatalysts (MH1-MH5); Figure S5: Correlation between Time and %Degradation of Alizarin Red (AR) Dye (200ppm) by 0.02g of Nanomaterials MH2-MH4; Figure S6: Correlation between %Degradation of Alizarin Red (AR) Dye (200 ppm) and Different Catalyst Doses of MH1-MH3after 60min of Photocatalytic Activity; Figure S7: Correlation between %Degradation of Alizarin Red (AR) Dye by 0.02g of Nanomaterials MH1-MH3 at Different Dye Concentrations (50-250ppm); Figure S8: Correlation between %Degradation of Alizarin Red (AR) Dye (200ppm) by 0.02g of Nanomaterials MH1-MH3 and Different Time Intervals; Figure S9: Correlation between Alizarin Red (AR) Dye Concentration of Photocatalytic Activity by 0.02g of Nanomaterials (MH1-MH5) at Different Time Intervals; Figure S10: Correlation between Alizarin Red (AR) Dye Concentration after 60min of Photocatalytic Activity by Nanomaterials (MH1-MH5) at Different Catalyst Doses; Figure S11: Correlation between Alizarin Red (AR) Dye Concentration after 60min of Photocatalytic Activity by Nanomaterials (MH1-MH5) at Different Dye Concentrations; Figure S12: Correlation between Alizarin Red (AR) Dye Concentration after 60min of Photocatalytic Activity by Nanomaterials (MH1-MH5) at Different pH.

Author Contributions

Conceptualization, M.H. and A.A.A.; Methodology, M.H., S.K. and A.A.A.; Investigation, M.H., S.K., R.G. and N.R.; Resources, S.M., M.Z., S.A.A.S., Z.A.Z. and A.B.; Writing—Original Draft Preparation, M.H., A.A.A. and S.K. Writing—Review and Editing, A.A.A., S.M., N.R. and R.G.; Funding Acquisition, A.A.A. and Z.A.Z. Project Administration, A.A.A. and Z.A.Z. All authors have read and agreed to the published version of the manuscript.
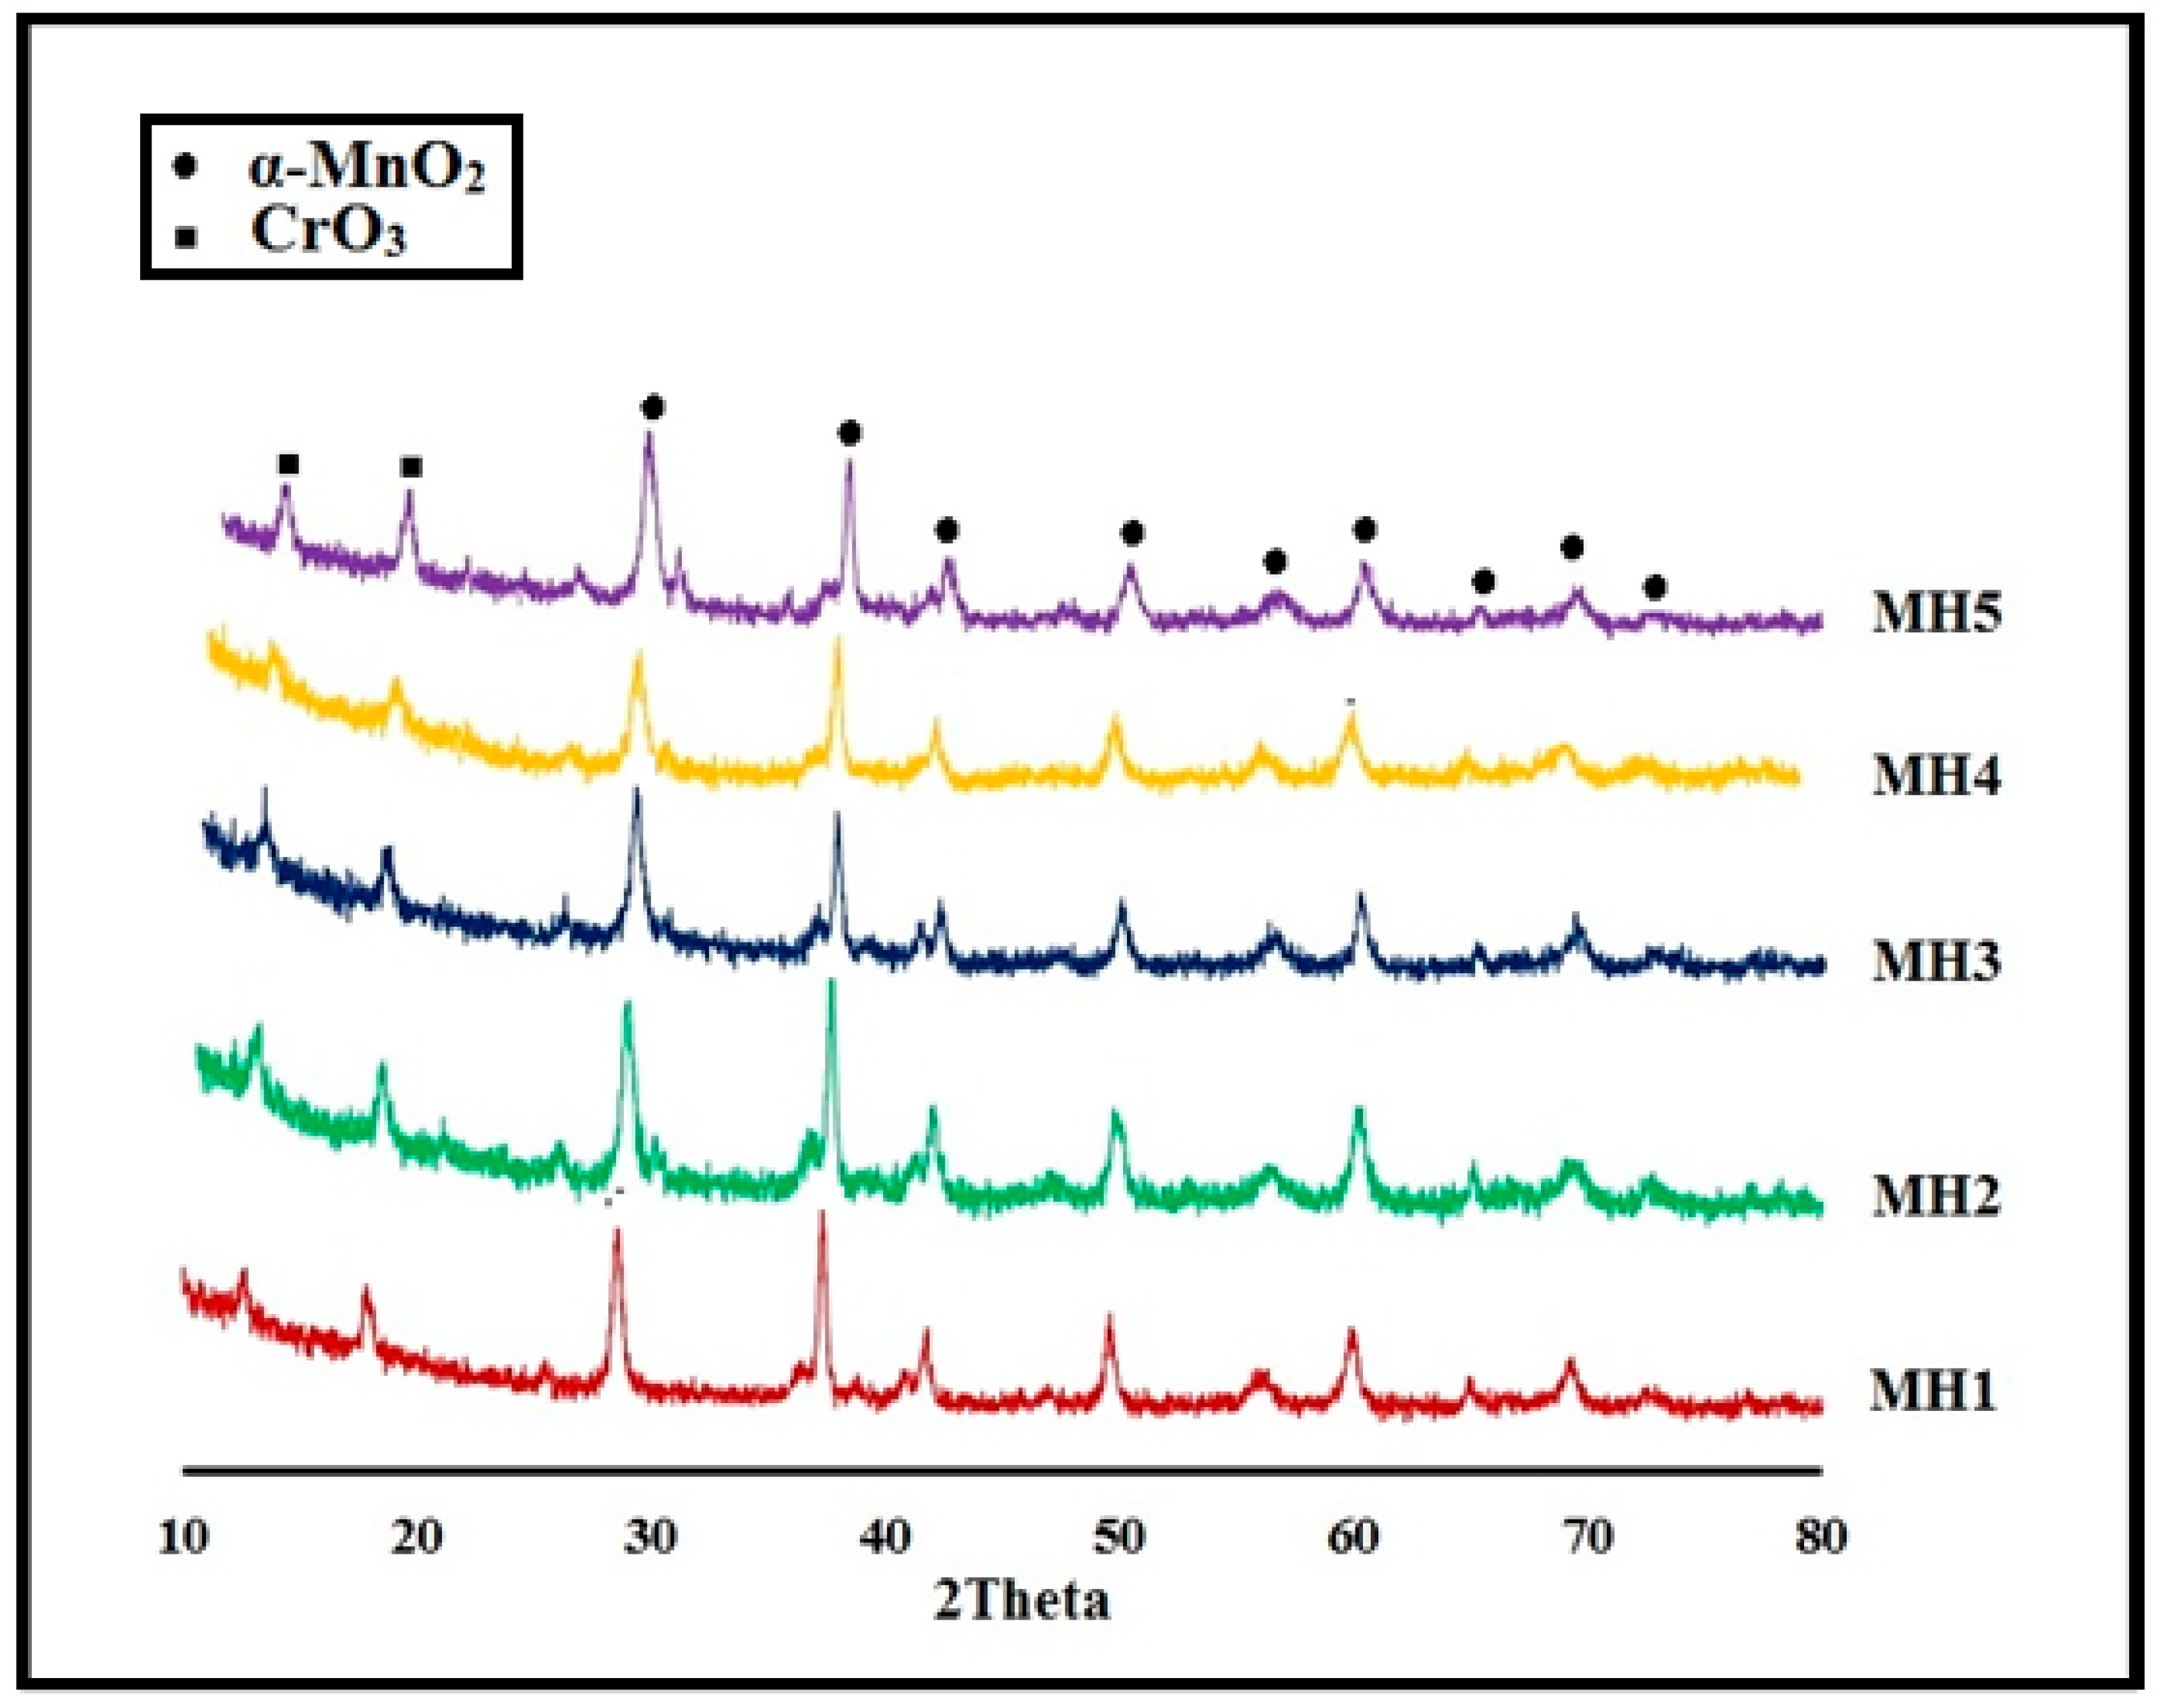
Funding

This research was mainly financially supported by Higher Education Commission Islamabad, Pakistan under HEC-NRPU project No. 6492.

Acknowledgments

The authors would also like to acknowledge the Ministry of Higher Education (MOHE) Malaysia for financial support under the Fundamental Research Grant Scheme (FRGS) with sponsorship reference numbers FRGS/1/2019/STG05/UITM/02/9. The author would also like to acknowledge Universiti Teknologi MARA for the financial support under the reference number 600-IRMI/FRGS 5/3 (424/2019).

Conflicts of Interest

Authors have no conflict of interest.

References

  1. Jain, R.; Sharma, S.; Manoj, S.; Bansal, S.; Gupta, K. Application of titanium dioxide semiconductor photocatalysis in the photomineralization of dyes in textile industry effluents. Indian J. Environ. Prot. 2004, 23, 63–68. [Google Scholar]
  2. Natarajan, S.; Bajaj, H.C.; Tayade, R.J. Recent advances based on the synergetic effect of adsorption for removal of dyes from waste water using photocatalytic process. J. Environ. Sci. 2018, 65, 201–222. [Google Scholar] [CrossRef] [PubMed]
  3. Oller, I.; Malato, S.; Pérez, J.S. Combination of Advanced Oxidation Processes and biological treatments for wastewater decontamination—A review. Sci. Total Environ. 2011, 409, 4141–4166. [Google Scholar] [CrossRef] [PubMed]
  4. Li, Z.; Liu, J.; Zhang, F.-J.; Oh, W.-C. UV and visible light photodegradation effect on Fe–CNT/TiO2 composite catalysts. Bull. Mater. Sci. 2013, 36, 293–299. [Google Scholar] [CrossRef]
  5. Hussain, K.I.; Usman, M.; Siddiq, M.; Rasool, N.; Nazar, M.F.; Ahmad, I.; Holder, A.A.; Altaf, A.A. Application of micellar enhanced ultrafiltration for the removal of sunset yellow dye from aqueous media. J. Dispersion Sci. Tech. 2017, 38, 139–144. [Google Scholar] [CrossRef]
  6. Ponnusamy, V.; Lakshmi, G. Enhanced photocatalytic performance of (ZnO/CeO2)-β-CD system for the effective decolorization of Rhodamine B under UV light irradiation. Appl. Water Sci. 2017, 7, 4025–4036. [Google Scholar] [CrossRef]
  7. Mantzavinos, D.; Psillakis, E. Enhancement of biodegradability of industrial wastewaters by chemical oxidation pre-treatment. J. Chem. Technol. Biotechnol. 2004, 79, 431–454. [Google Scholar] [CrossRef]
  8. Saeed, K.; Zada, N.; Khan, I. Photocatalytic degradation of alizarin red dye in aqueous medium using carbon nanotubes/Cu-Ti oxide composites. Sep. Sci. Technol. 2018, 54, 2729–2737. [Google Scholar] [CrossRef]
  9. Saroj, S.; Kumar, K.; Pareek, N.; Prasad, R.; Singh, R. Biodegradation of azo dyes Acid Red 183, Direct Blue 15 and Direct Red 75 by the isolate Penicillium oxalicum SAR-3. Chemosphere 2014, 107, 240–248. [Google Scholar] [CrossRef]
  10. Iqbal, M.J.; Ashiq, M.N. Thermodynamics of adsorption of dyes from aqueous media on activated charcoal. J. Res. Sci. 2007, 18, 91–99. [Google Scholar]
  11. Rauf, M.; Ashraf, S. Radiation induced degradation of dyes—An overview. J. Hazard. Mater. 2009, 166, 6–16. [Google Scholar] [CrossRef]
  12. Akpan, U.; Hameed, B. Parameters affecting the photocatalytic degradation of dyes using TiO2-based photocatalysts: A review. J. Hazard. Mater. 2009, 170, 520–529. [Google Scholar] [CrossRef] [PubMed]
  13. Qu, X.; Alvarez, P.J.J.; Li, Q. Applications of nanotechnology in water and wastewater treatment. Water Res. 2013, 47, 3931–3946. [Google Scholar] [CrossRef] [PubMed]
  14. Nakata, K.; Fujishima, A. TiO2 photocatalysis: Design and applications. J. Photochem. Photobiol. C Photochem. Rev. 2012, 13, 169–189. [Google Scholar] [CrossRef]
  15. Arias, N.P.; Dávila, M.T.; Giraldo, O.H. Electrical behavior of an octahedral layered OL-1-type manganese oxide material. Ionics 2012, 19, 201–214. [Google Scholar] [CrossRef]
  16. Giraldo, O.; Arias, N.; Becerra, M. Electrical properties of TiO2-pillared bidimensional manganese oxides. Appl. Clay Sci. 2017, 141, 157–170. [Google Scholar] [CrossRef]
  17. Niederberger, M.; Pinna, N. Metal Oxide Nanoparticles in Organic Solvents; Springer Science and Business Media: New York, NY, USA, 2009. [Google Scholar]
  18. Arami, M.; Limaee, N.Y.; Mahmoodi, H.; Tabrizi, N.S. Removal of dyes from colored textile wastewater by orange peel adsorbent: Equilibrium and kinetic studies. J. Colloid Interface Sci. 2005, 288, 371–376. [Google Scholar] [CrossRef]
  19. Kausar, S.; Altaf, A.A.; Hamayun, M.; Rasool, N.; Hadait, M.; Akhtar, A.; Muhammad, S.; Badshah, A.; Shah, S.A.A.; Zakaria, Z.A. i-Propylammonium Lead Chloride Based Perovskite Photocatalysts for Depolymerization of Lignin Under UV Light. Molecules 2020, 25, 3520. [Google Scholar] [CrossRef]
  20. Danish, M.; Tayyab, M.; Akhtar, A.; Altaf, A.A.; Kausar, S.; Ullah, S.; Iqbal, M. Effect of soft template variation on the synthesis, physical, and electrochemical properties of Mn3O4 nanomaterial. Inorg. Nano-Metal Chem. 2020, 1–7. [Google Scholar] [CrossRef]
  21. Altaf, A.A.; Ahmed, M.; Hamayun, M.; Kausar, S.; Waqar, M.; Badshah, A. Titania nano-fibers: A review on synthesis and utilities. Inorg. Chim. Acta 2020, 501, 119268. [Google Scholar] [CrossRef]
  22. Duan, J.; Zheng, Y.; Chen, S.; Tang, Y.; Jaroniec, M.; Qiao, S.Z. Mesoporous hybrid material composed of Mn3O4nanoparticles on nitrogen-doped graphene for highly efficient oxygen reduction reaction. Chem. Commun. 2013, 49, 7705–7707. [Google Scholar] [CrossRef] [PubMed] [Green Version]
  23. Sood, S.; Mehta, S.K.; Umar, A.; Kansal, S.K. The visible light-driven photocatalytic degradation of Alizarin red S using Bi-doped TiO2 nanoparticles. New J. Chem. 2014, 38, 3127–3136. [Google Scholar] [CrossRef]
  24. Sun, J.; Lu, H.; Du, L.; Lin, H.; Li, H. Anodic oxidation of anthraquinone dye Alizarin Red S at Ti/BDD electrodes. Appl. Surf. Sci. 2011, 257, 6667–6671. [Google Scholar] [CrossRef]
  25. Joshi, K.; Shrivastava, V. Degradation of alizarine red-S (A textiles dye) by photocatalysis using ZnO and TiO2 as photocatalyst. Int. J. Environ. Sci. 2011, 2, 8–21. [Google Scholar]
  26. Kansal, S.K.; Lamba, R.; Mehta, S.; Umar, A. Photocatalytic degradation of Alizarin Red S using simply synthesized ZnO nanoparticles. Mater. Lett. 2013, 106, 385–389. [Google Scholar] [CrossRef]
  27. Jagodzinski, H. The Role of Munich in X-Ray Crystallography and the Development of Powder Diffraction. Mater. Sci. Forum 1991, 79, 1–16. [Google Scholar] [CrossRef]
  28. Cullity, B.; Stock, S. Elements of X-ray Diffraction, 3rd ed.; Prentice Hall: New York, NY, USA, 2001; pp. 174–177. [Google Scholar]
  29. Aé, L.; Kieven, D.; Chen, J.; Klenk, R.; Rissom, T.; Tang, Y.; Lux-Steiner, M.C.; Rissom, T. ZnO nanorod arrays as an antireflective coating for Cu(In,Ga)Se2 thin film solar cells. Prog. Photovolt. Res. Appl. 2010, 18, 209–213. [Google Scholar] [CrossRef]
  30. Saleem, M. Effect of zinc acetate concentration on the structural and optical properties of ZnO thin films deposited by Sol-Gel method. Int. J. Phys. Sci. 2012, 7, 2971–2979. [Google Scholar] [CrossRef]
  31. Bindu, P.; Thomas, S. Estimation of lattice strain in ZnO nanoparticles: X-ray peak profile analysis. J. Theor. Appl. Phys. 2014, 8, 123–134. [Google Scholar] [CrossRef] [Green Version]
  32. Wang, B.; Iqbal, J.; Shan, X.; Huang, G.; Fu, H.; Yu, R.; Yu, D. Effects of Cr-doping on the photoluminescence and ferromagnetism at room temperature in ZnO nanomaterials prepared by soft chemistry route. Mater. Chem. Phys. 2009, 113, 103–106. [Google Scholar] [CrossRef]
  33. Kernazhitsky, L.; Shymanovska, V.; Gavrilko, T.; Naumov, V.; Fedorenko, L.; Kshnyakin, V.; Burtsev, A.; Baran, J. Effect of Cr-Doping on Luminescence of Nanocrystalline Anatase TiO2 Powders. Ukr. J. Phys. 2016, 61, 482–488. [Google Scholar] [CrossRef] [Green Version]
  34. Chu, J.; Sher, A. Device Physics of Narrow Gap Semiconductors; Springer Science and Business Media: New York, NY, USA, 2010. [Google Scholar]
  35. Xu, F.; Yuan, Z.-Y.; Du, G.-H.; Ren, T.-Z.; Volcke, C.; Thiry, P.; Su, B.-L. A low-temperature aqueous solution route to large-scale growth of ZnO nanowire arrays. J. Non-Cryst. Solids 2006, 352, 2569–2574. [Google Scholar] [CrossRef]
  36. Ho, Y.; McKay, G. Pseudo-second order model for sorption processes. Process Biochem. 1999, 34, 451–465. [Google Scholar] [CrossRef]
  37. Ho, Y.; McKay, G. Kinetic Models for the Sorption of Dye from Aqueous Solution by Wood. Process Saf. Environ. Prot. 1998, 76, 183–191. [Google Scholar] [CrossRef] [Green Version]
  38. Liu, Z.; Zhang, F.-S. Removal of lead from water using biochars prepared from hydrothermal liquefaction of biomass. J. Hazard. Mater. 2009, 167, 933–939. [Google Scholar] [CrossRef]
  39. Kansal, S.; Singh, M.; Sud, D. Studies on TiO2/ZnO photocatalysed degradation of lignin. J. Hazard. Mater. 2008, 153, 412–417. [Google Scholar] [CrossRef]
  40. Kausar, S.; Altaf, A.A.; Hamayun, M.; Danish, M.; Zubair, M.; Naz, S.; Muhammad, S.; Zaheer, M.; Ullah, S.; Badshah, A. Soft template-based bismuth doped zinc oxide nanocomposites for photocatalytic depolymerization of lignin. Inorg. Chim. Acta 2020, 502, 119390. [Google Scholar] [CrossRef]
Figure 1. PXRD pattern of nanomaterials (MH1–MH5). (Powder patterns are matched with standard patterns—i.e., α-MnO2 ((JCPD No.44-0141), (JCPD No. 01-1127), CrO3 (JCPD No. 74-0326, 70-3766)).
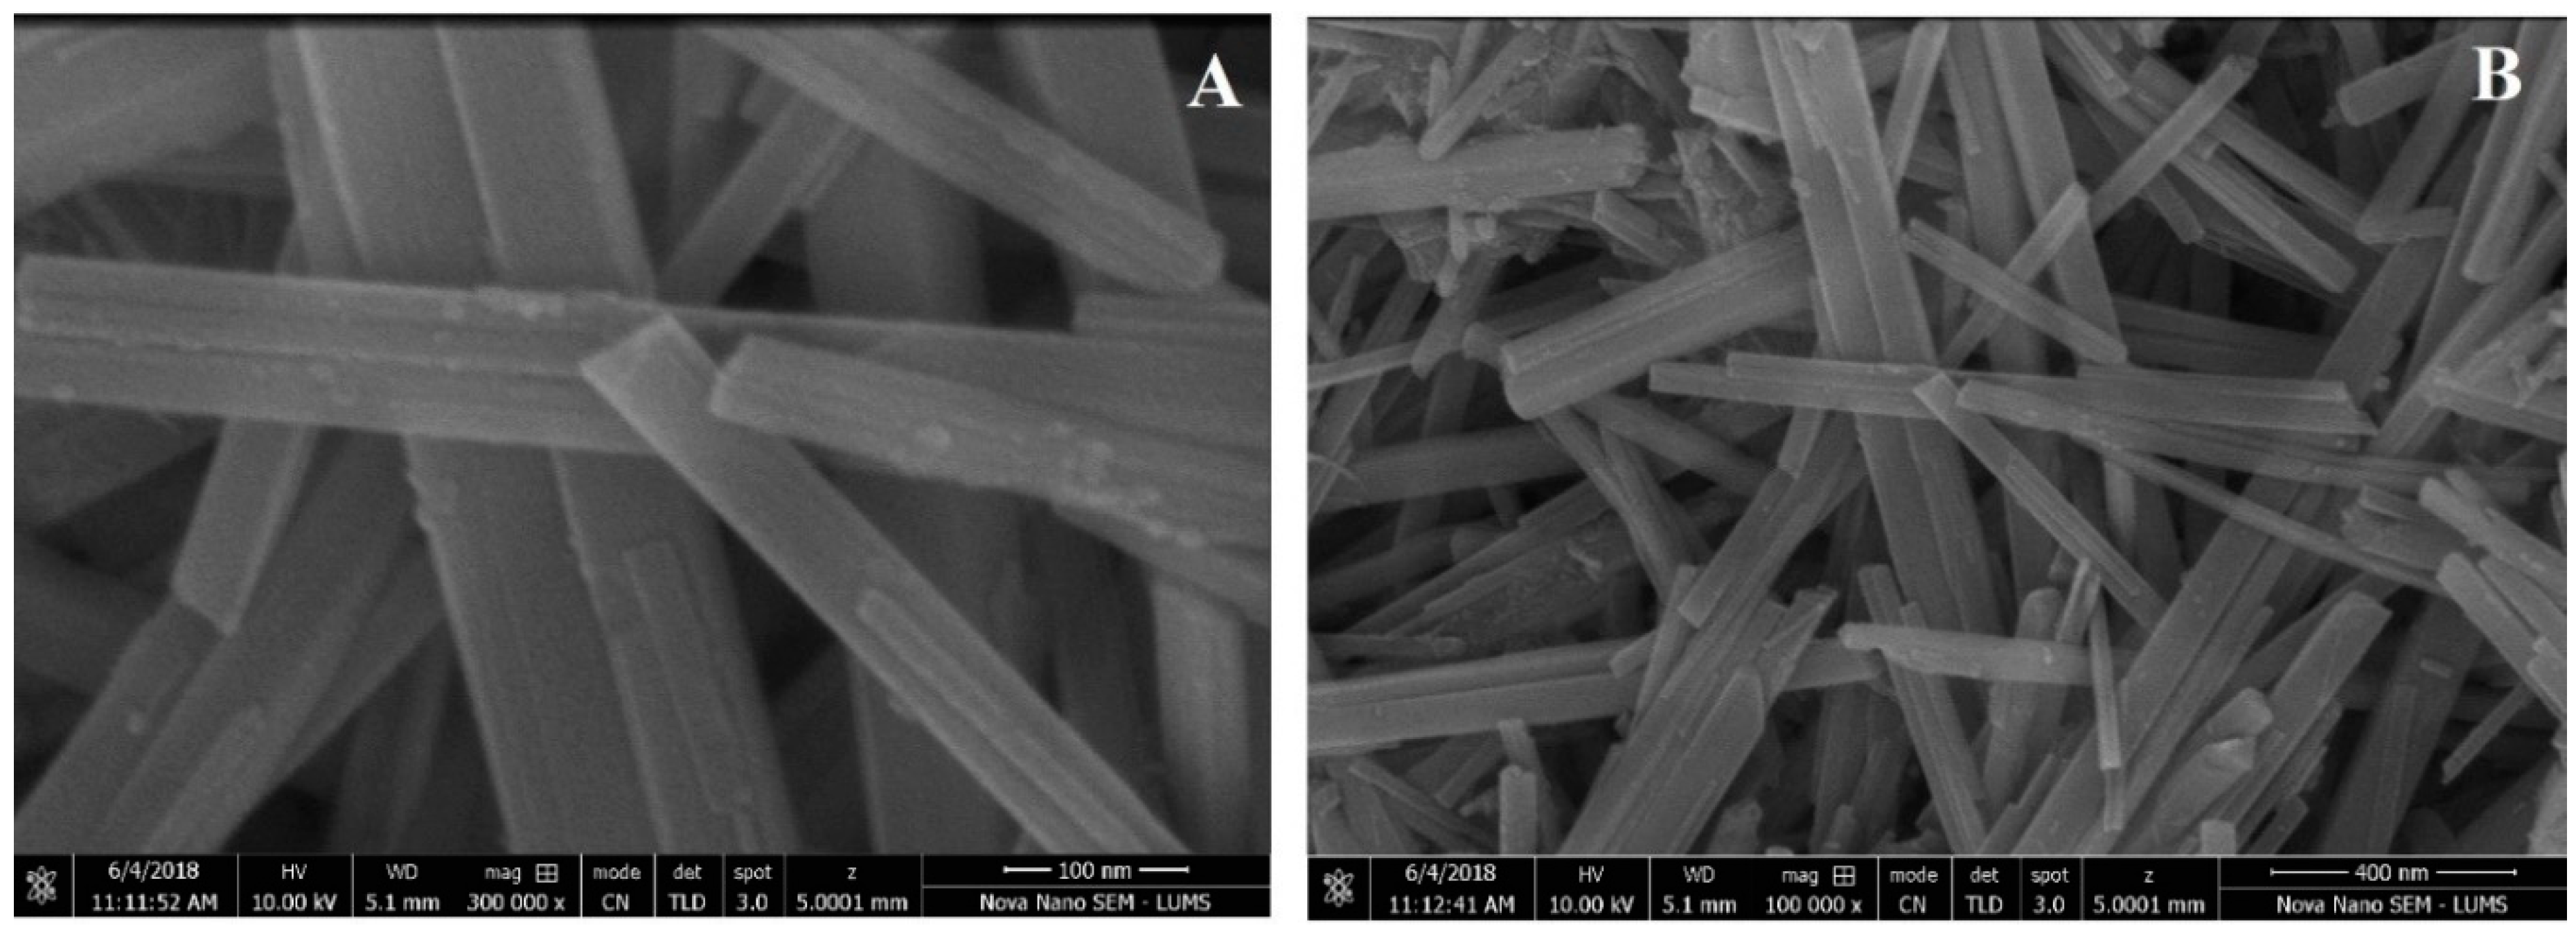
Catalysts 10 01150 g001
Figure 2. SEM images of the representative sample MH5 ((A) (100 nm) and (B) (400 nm)).
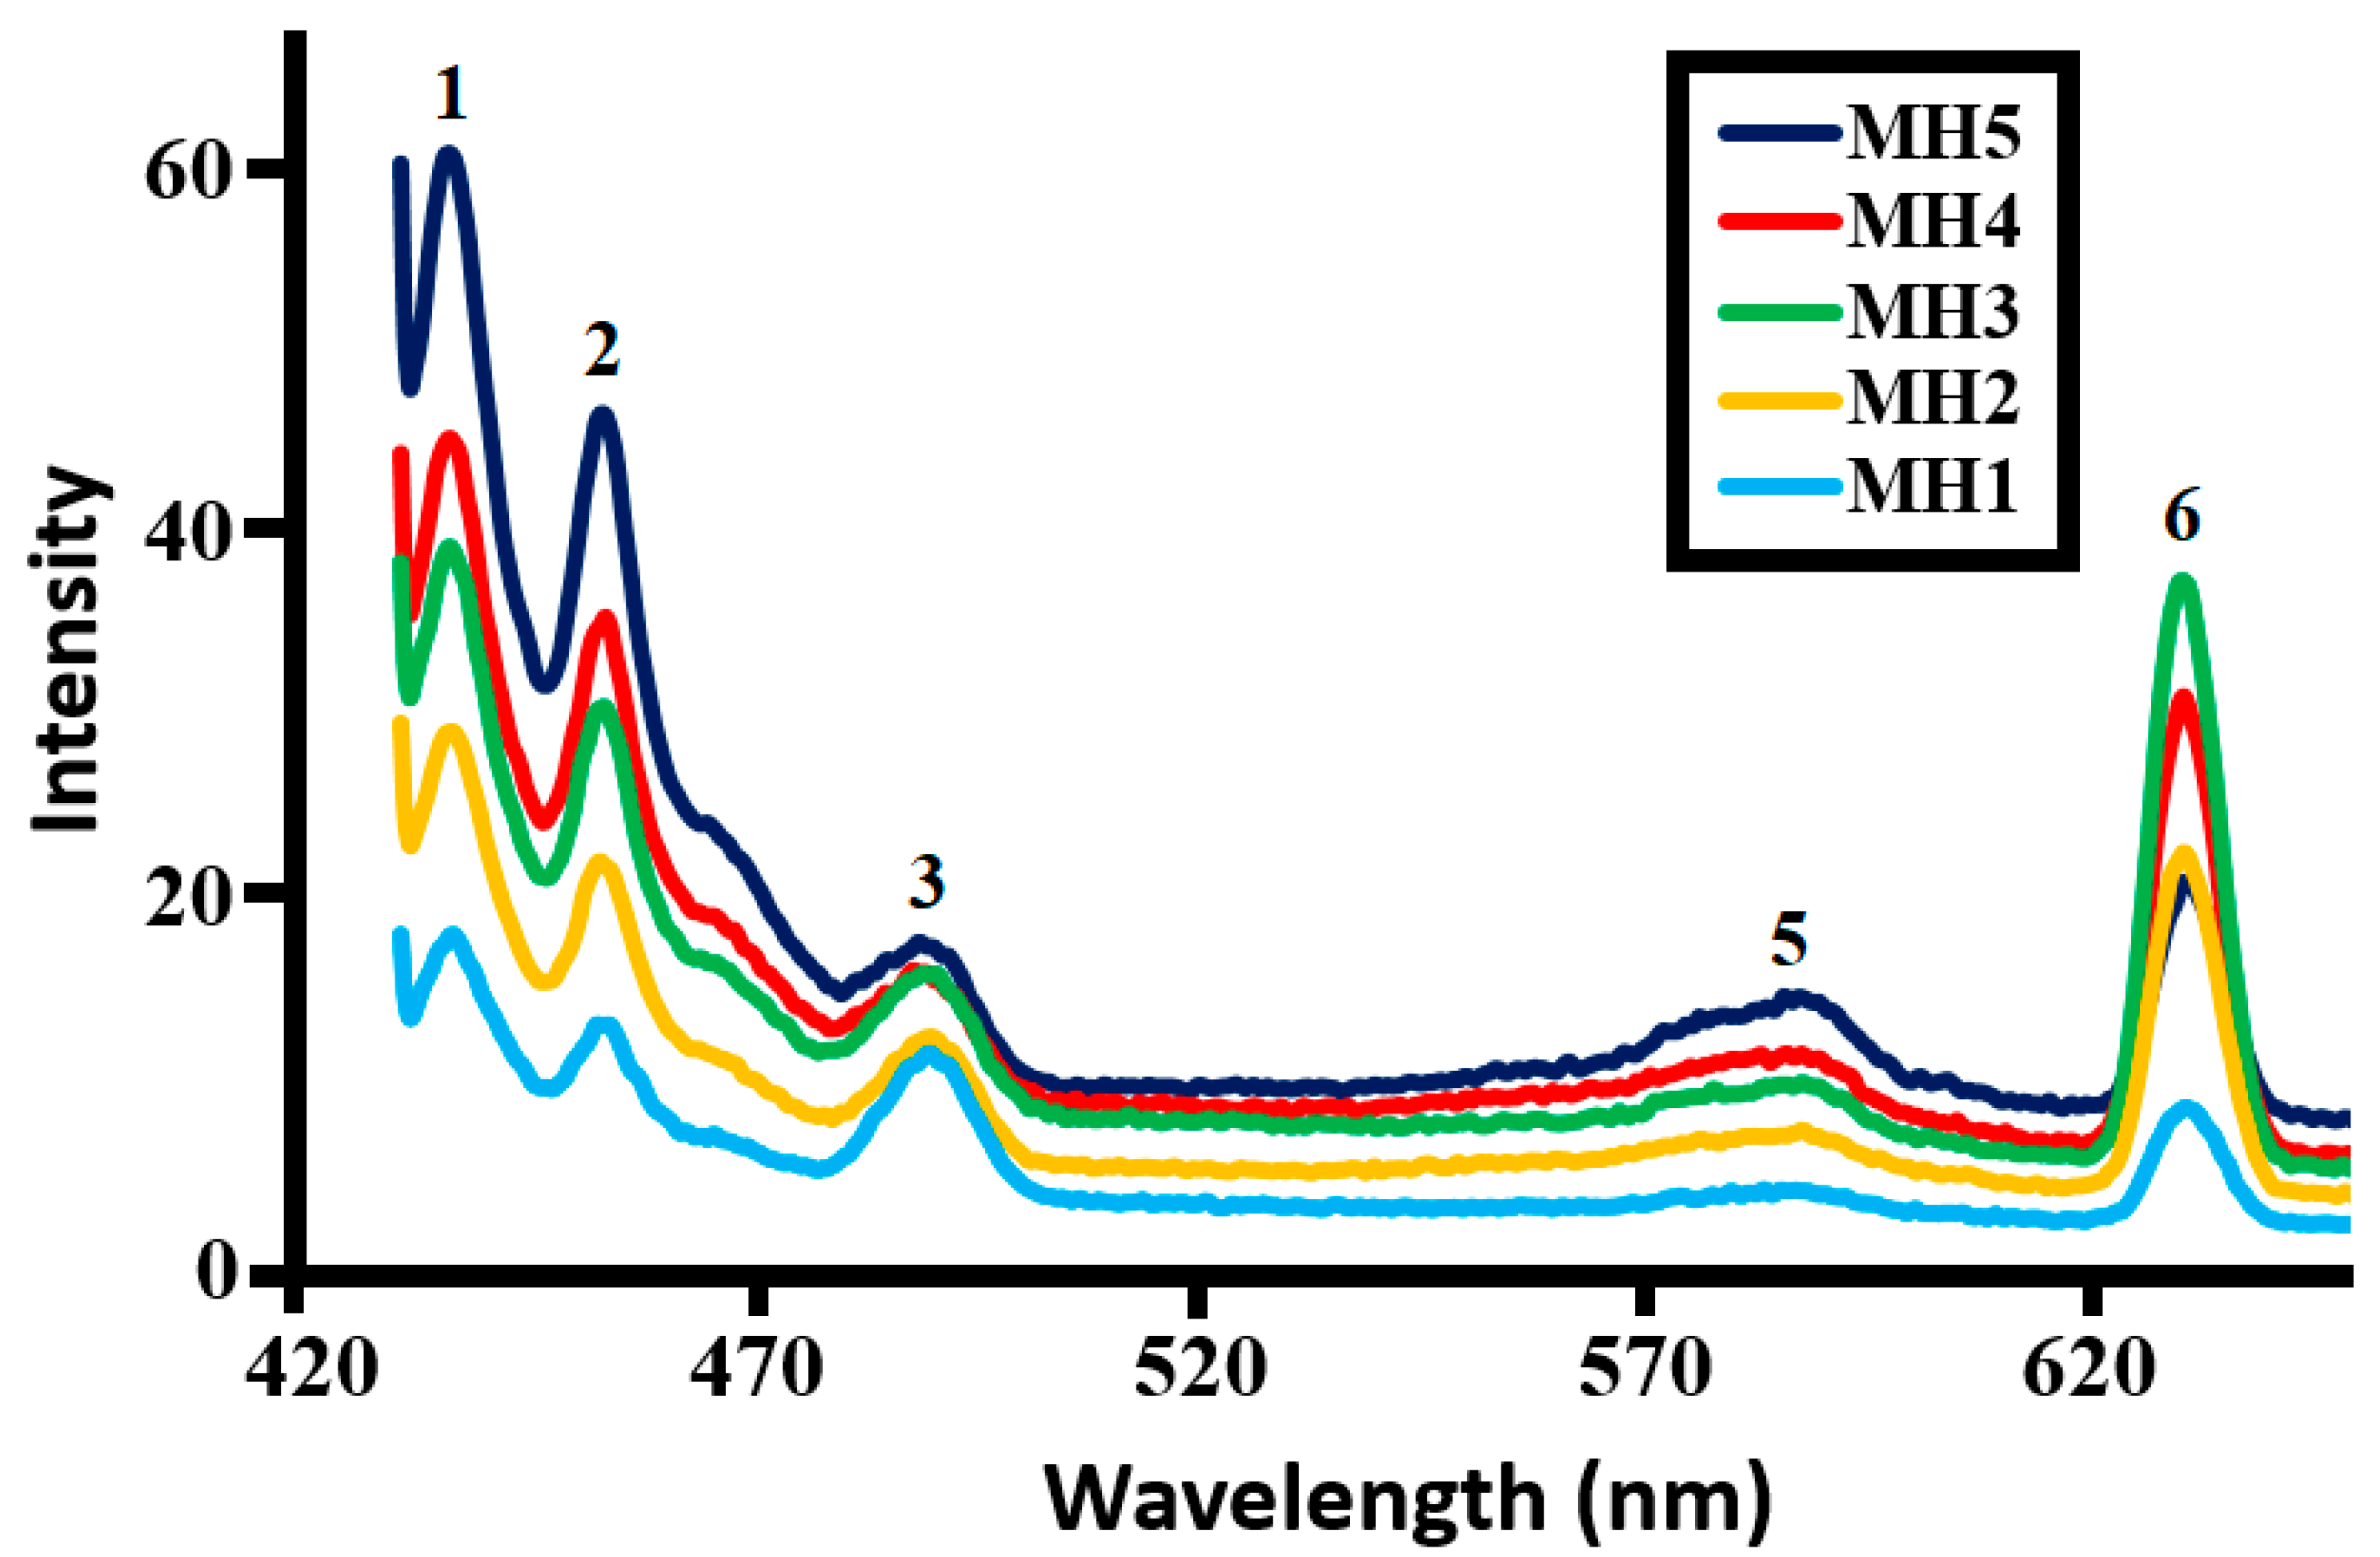
Catalysts 10 01150 g002
Figure 3. Photoluminescence (PL) spectra of the nanomaterials (MH–MH5).
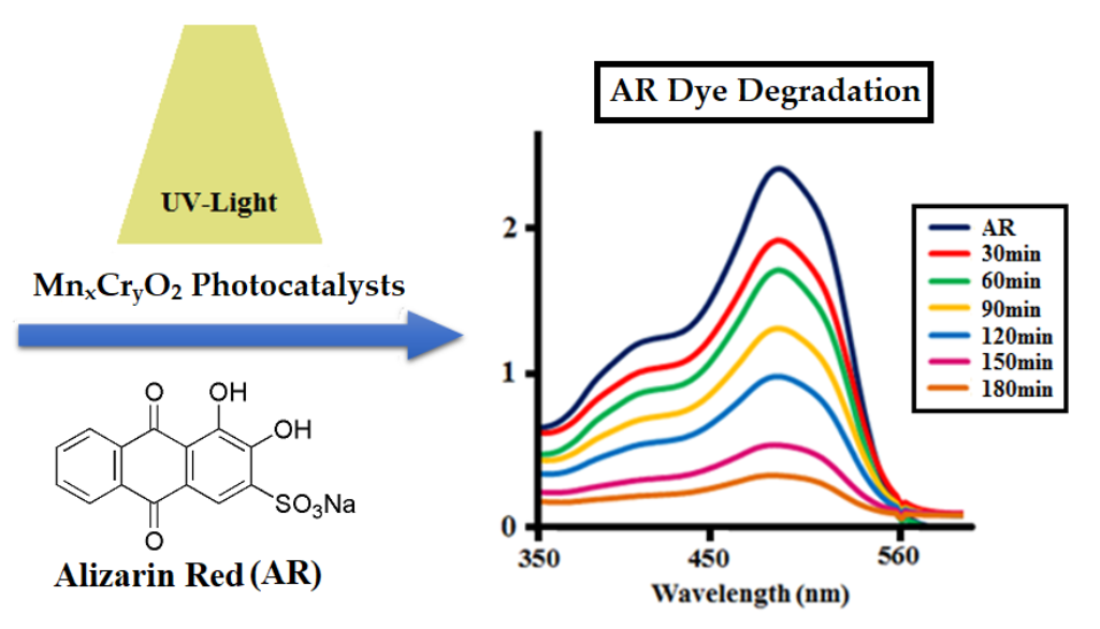
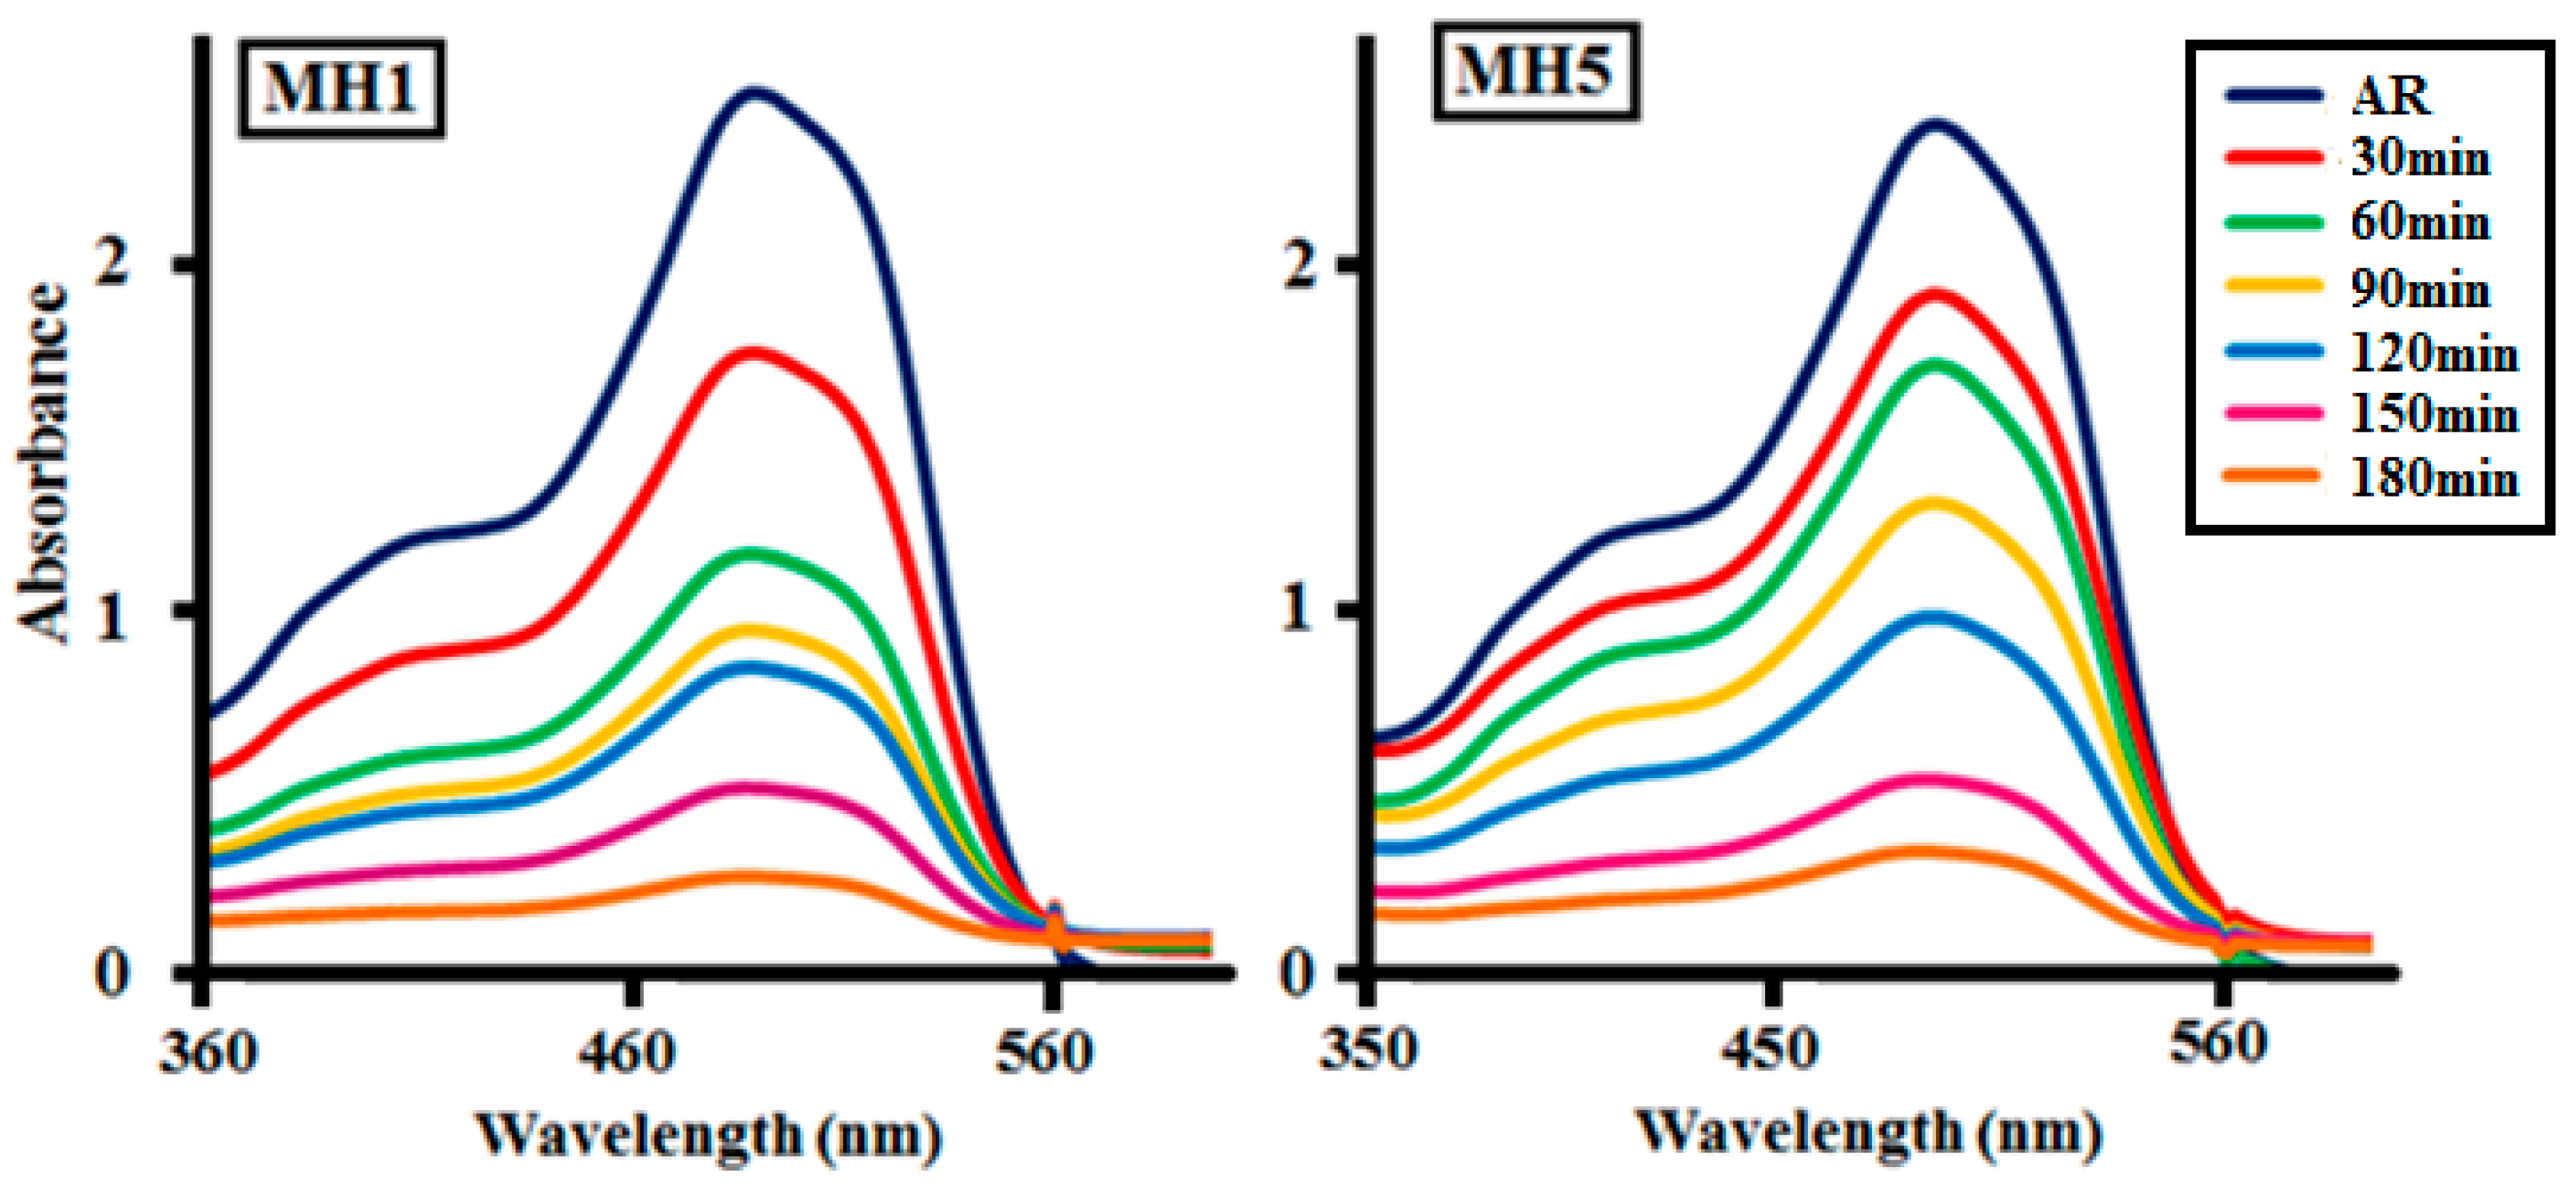
Catalysts 10 01150 g003
Figure 4. Photocatalytic degradation of alizarin red (AR) dye (250 ppm) at different time intervals by 0.025 g of MH1 and MH5.
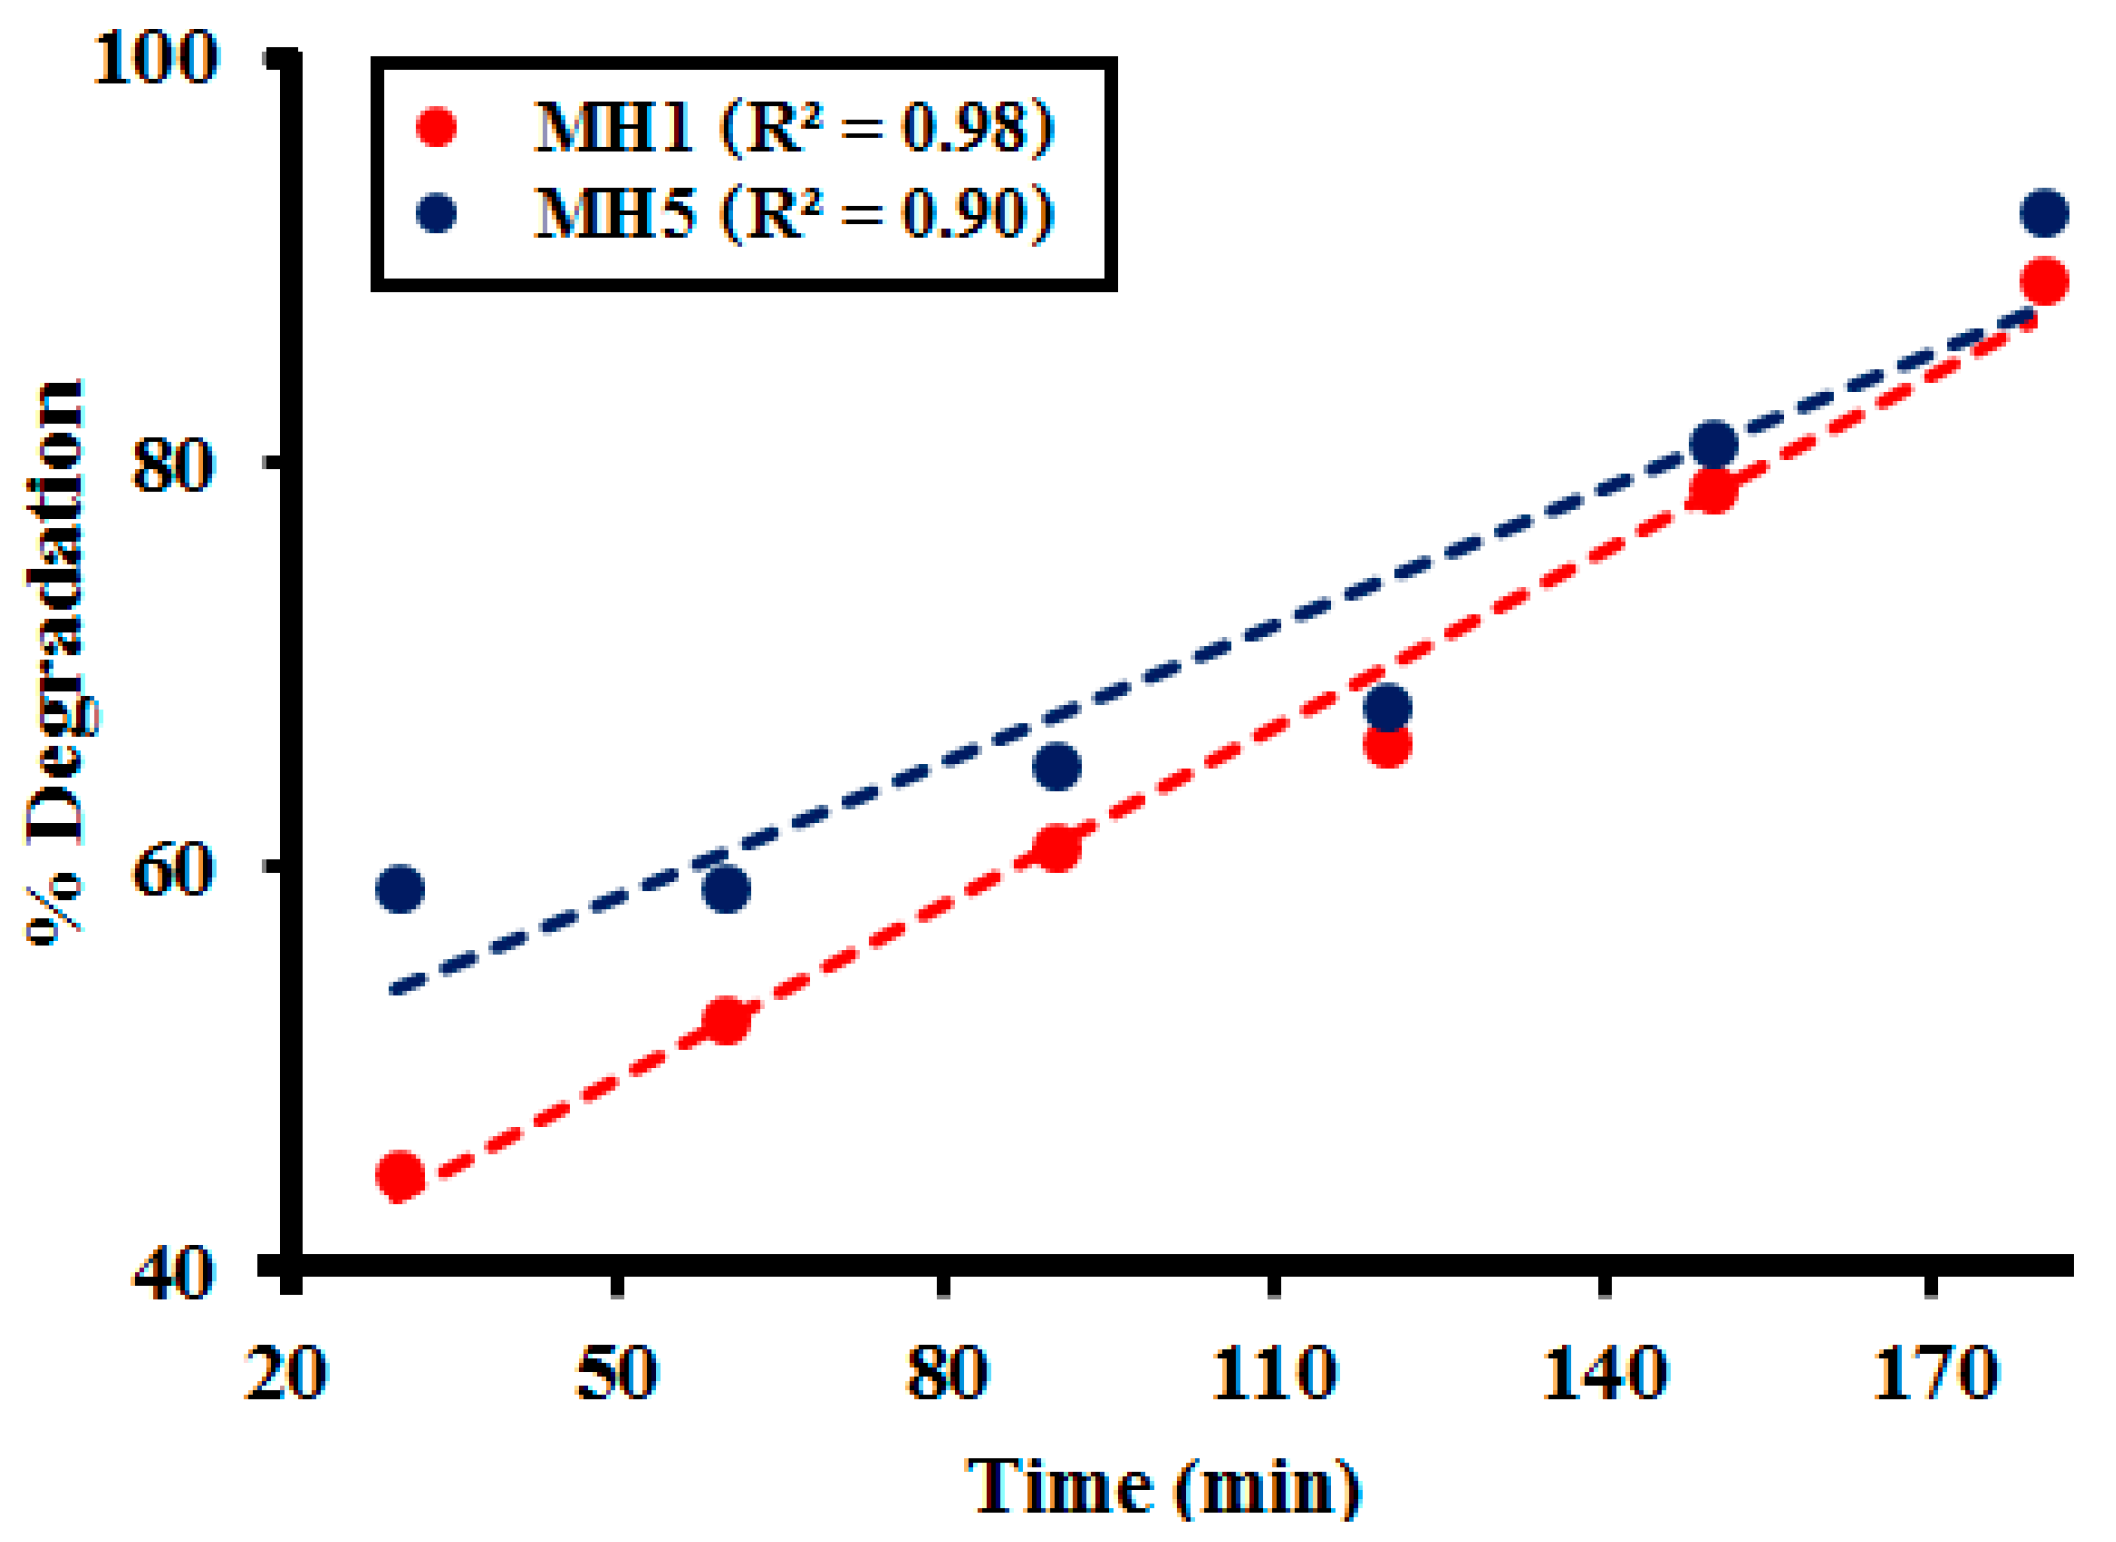
Catalysts 10 01150 g004
Figure 5. Correlation between time and percentage degradation of alizarin red (AR) dye (250 ppm) by 0.025 g of nanomaterials MH1 and MH5.
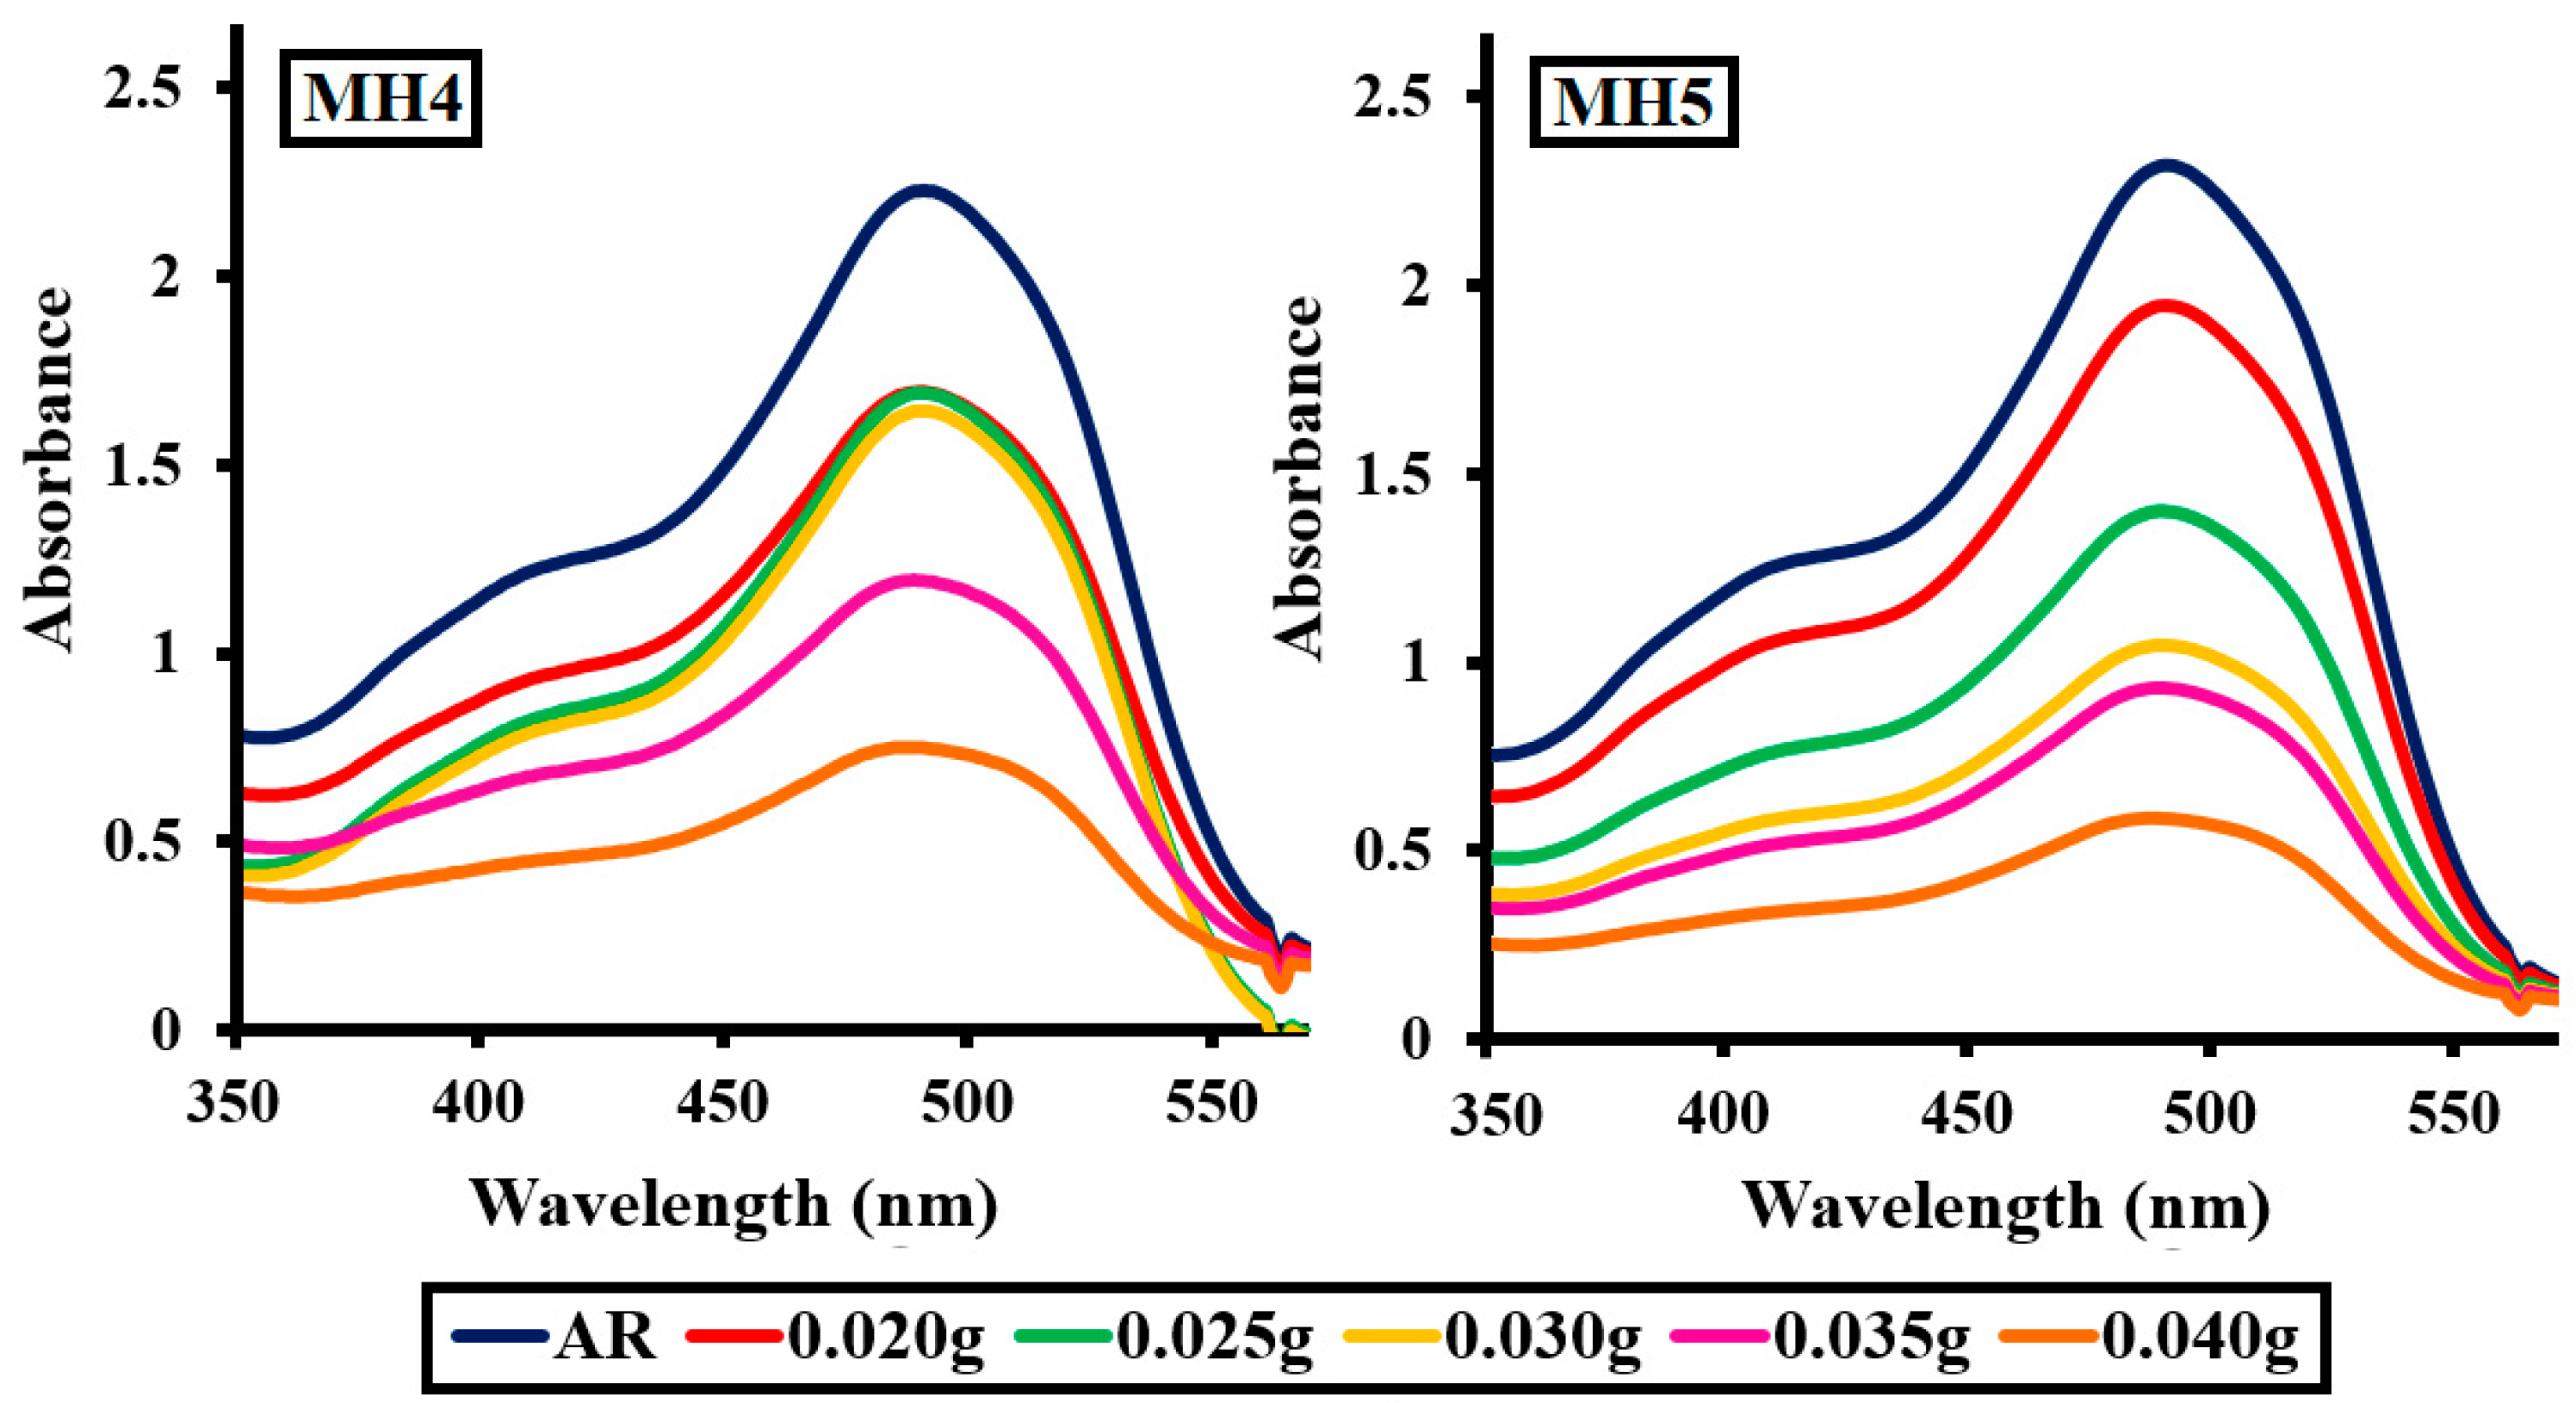
Catalysts 10 01150 g005
Figure 6. Photocatalytic degradation of alizarin red (AR) dye (250 ppm) at different catalyst doses of MH4 and MH5 after 60 min of photocatalytic activity.
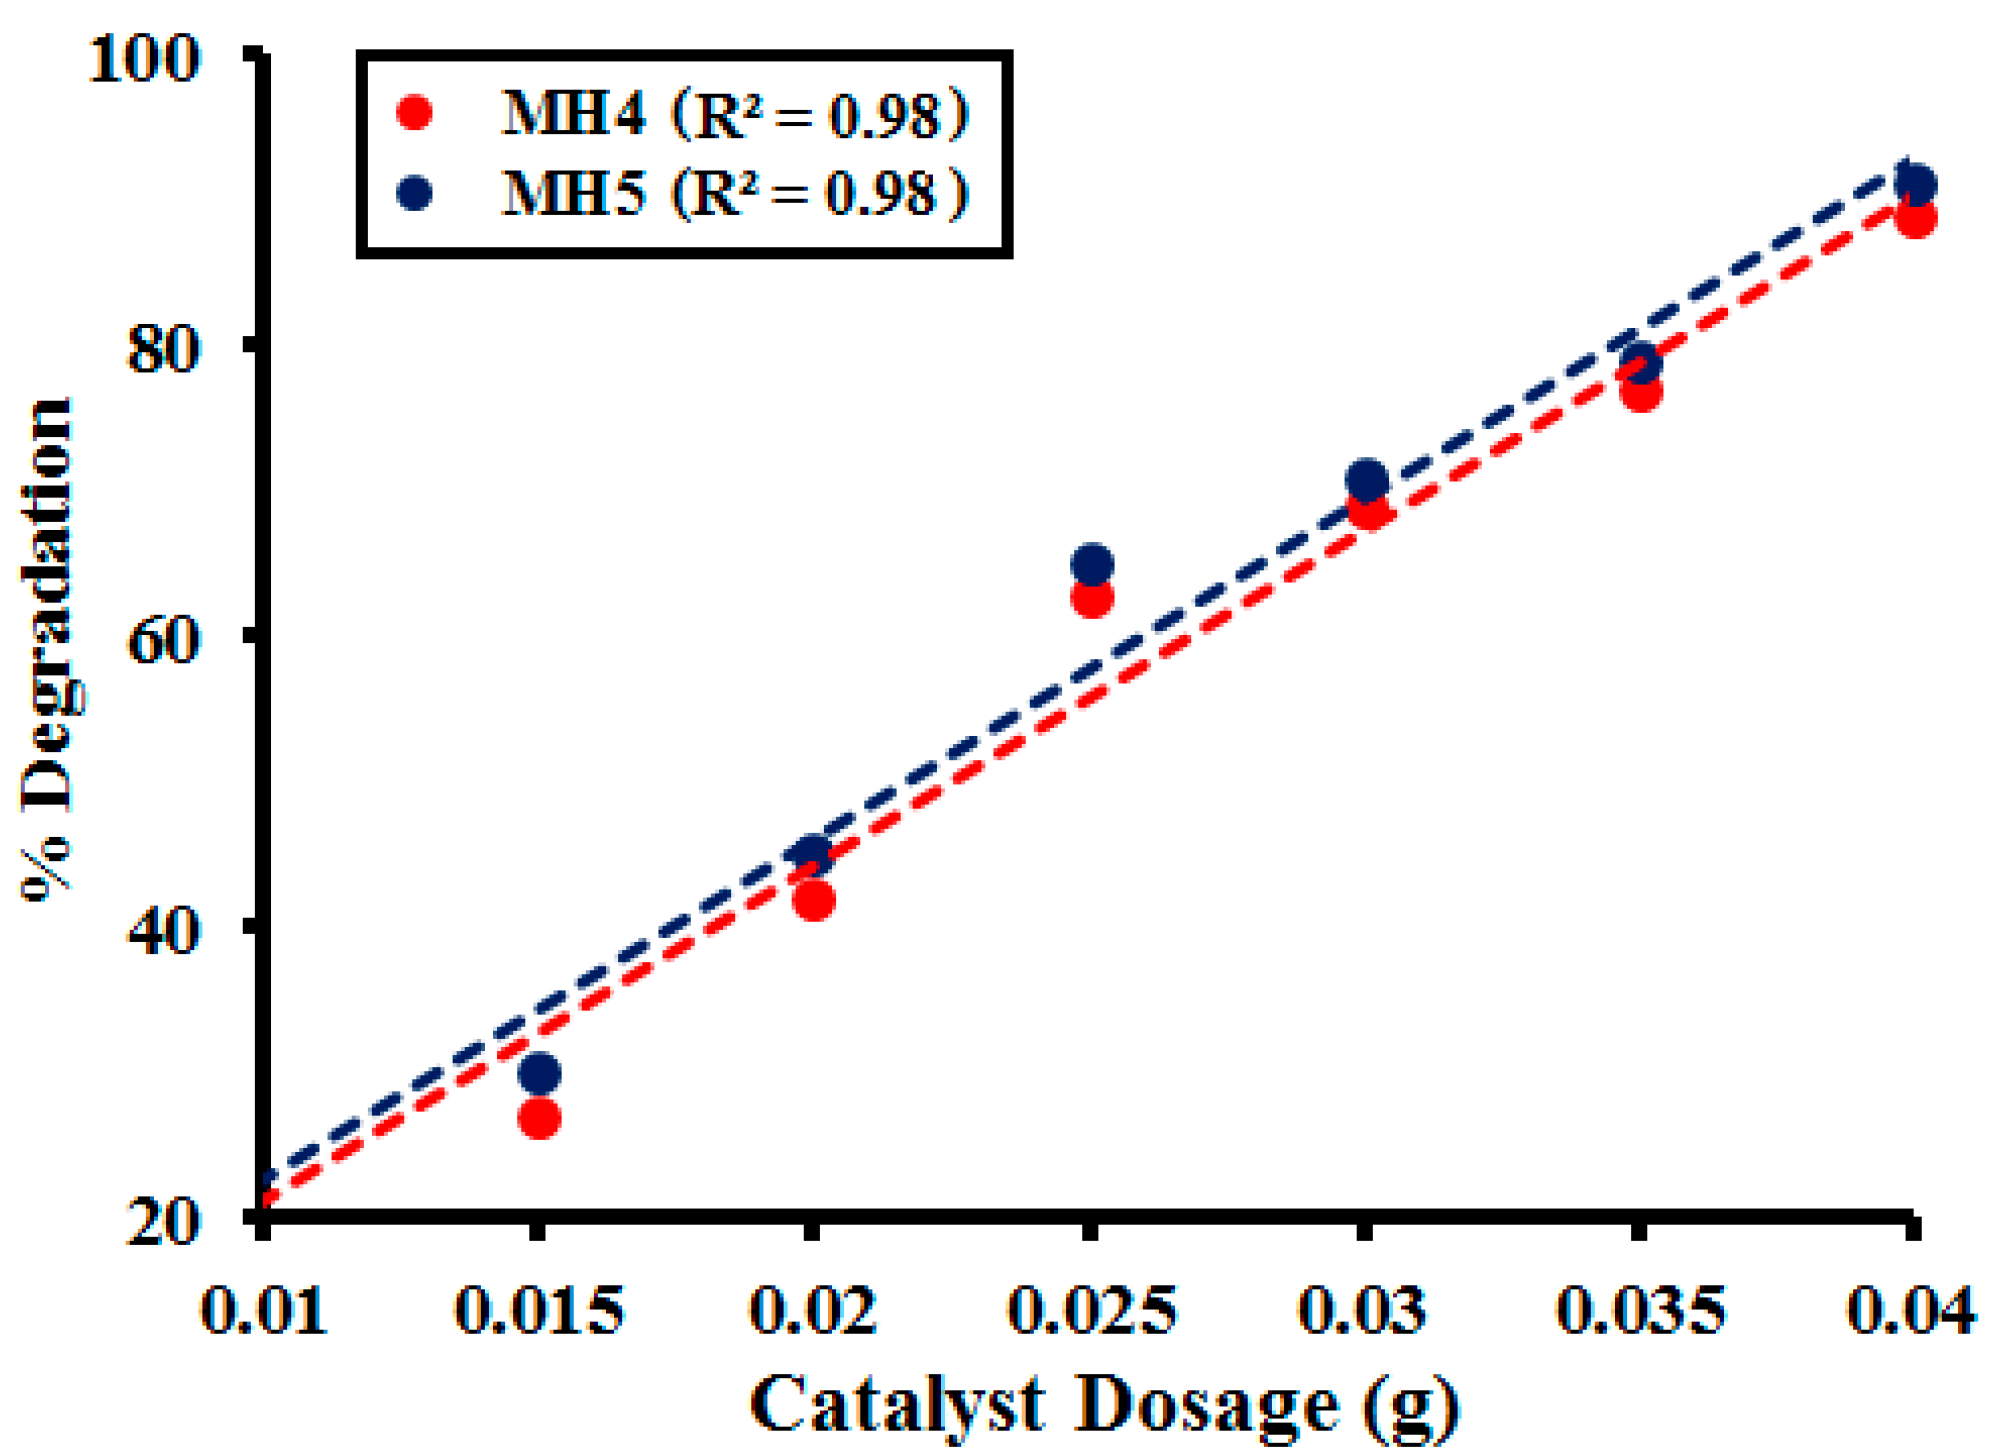
Catalysts 10 01150 g006
Figure 7. Correlation between different catalyst doses of MH4 and MH5 and percentage degradation of alizarin red (AR) Dye (250 ppm) after 60 min of photocatalytic activity.
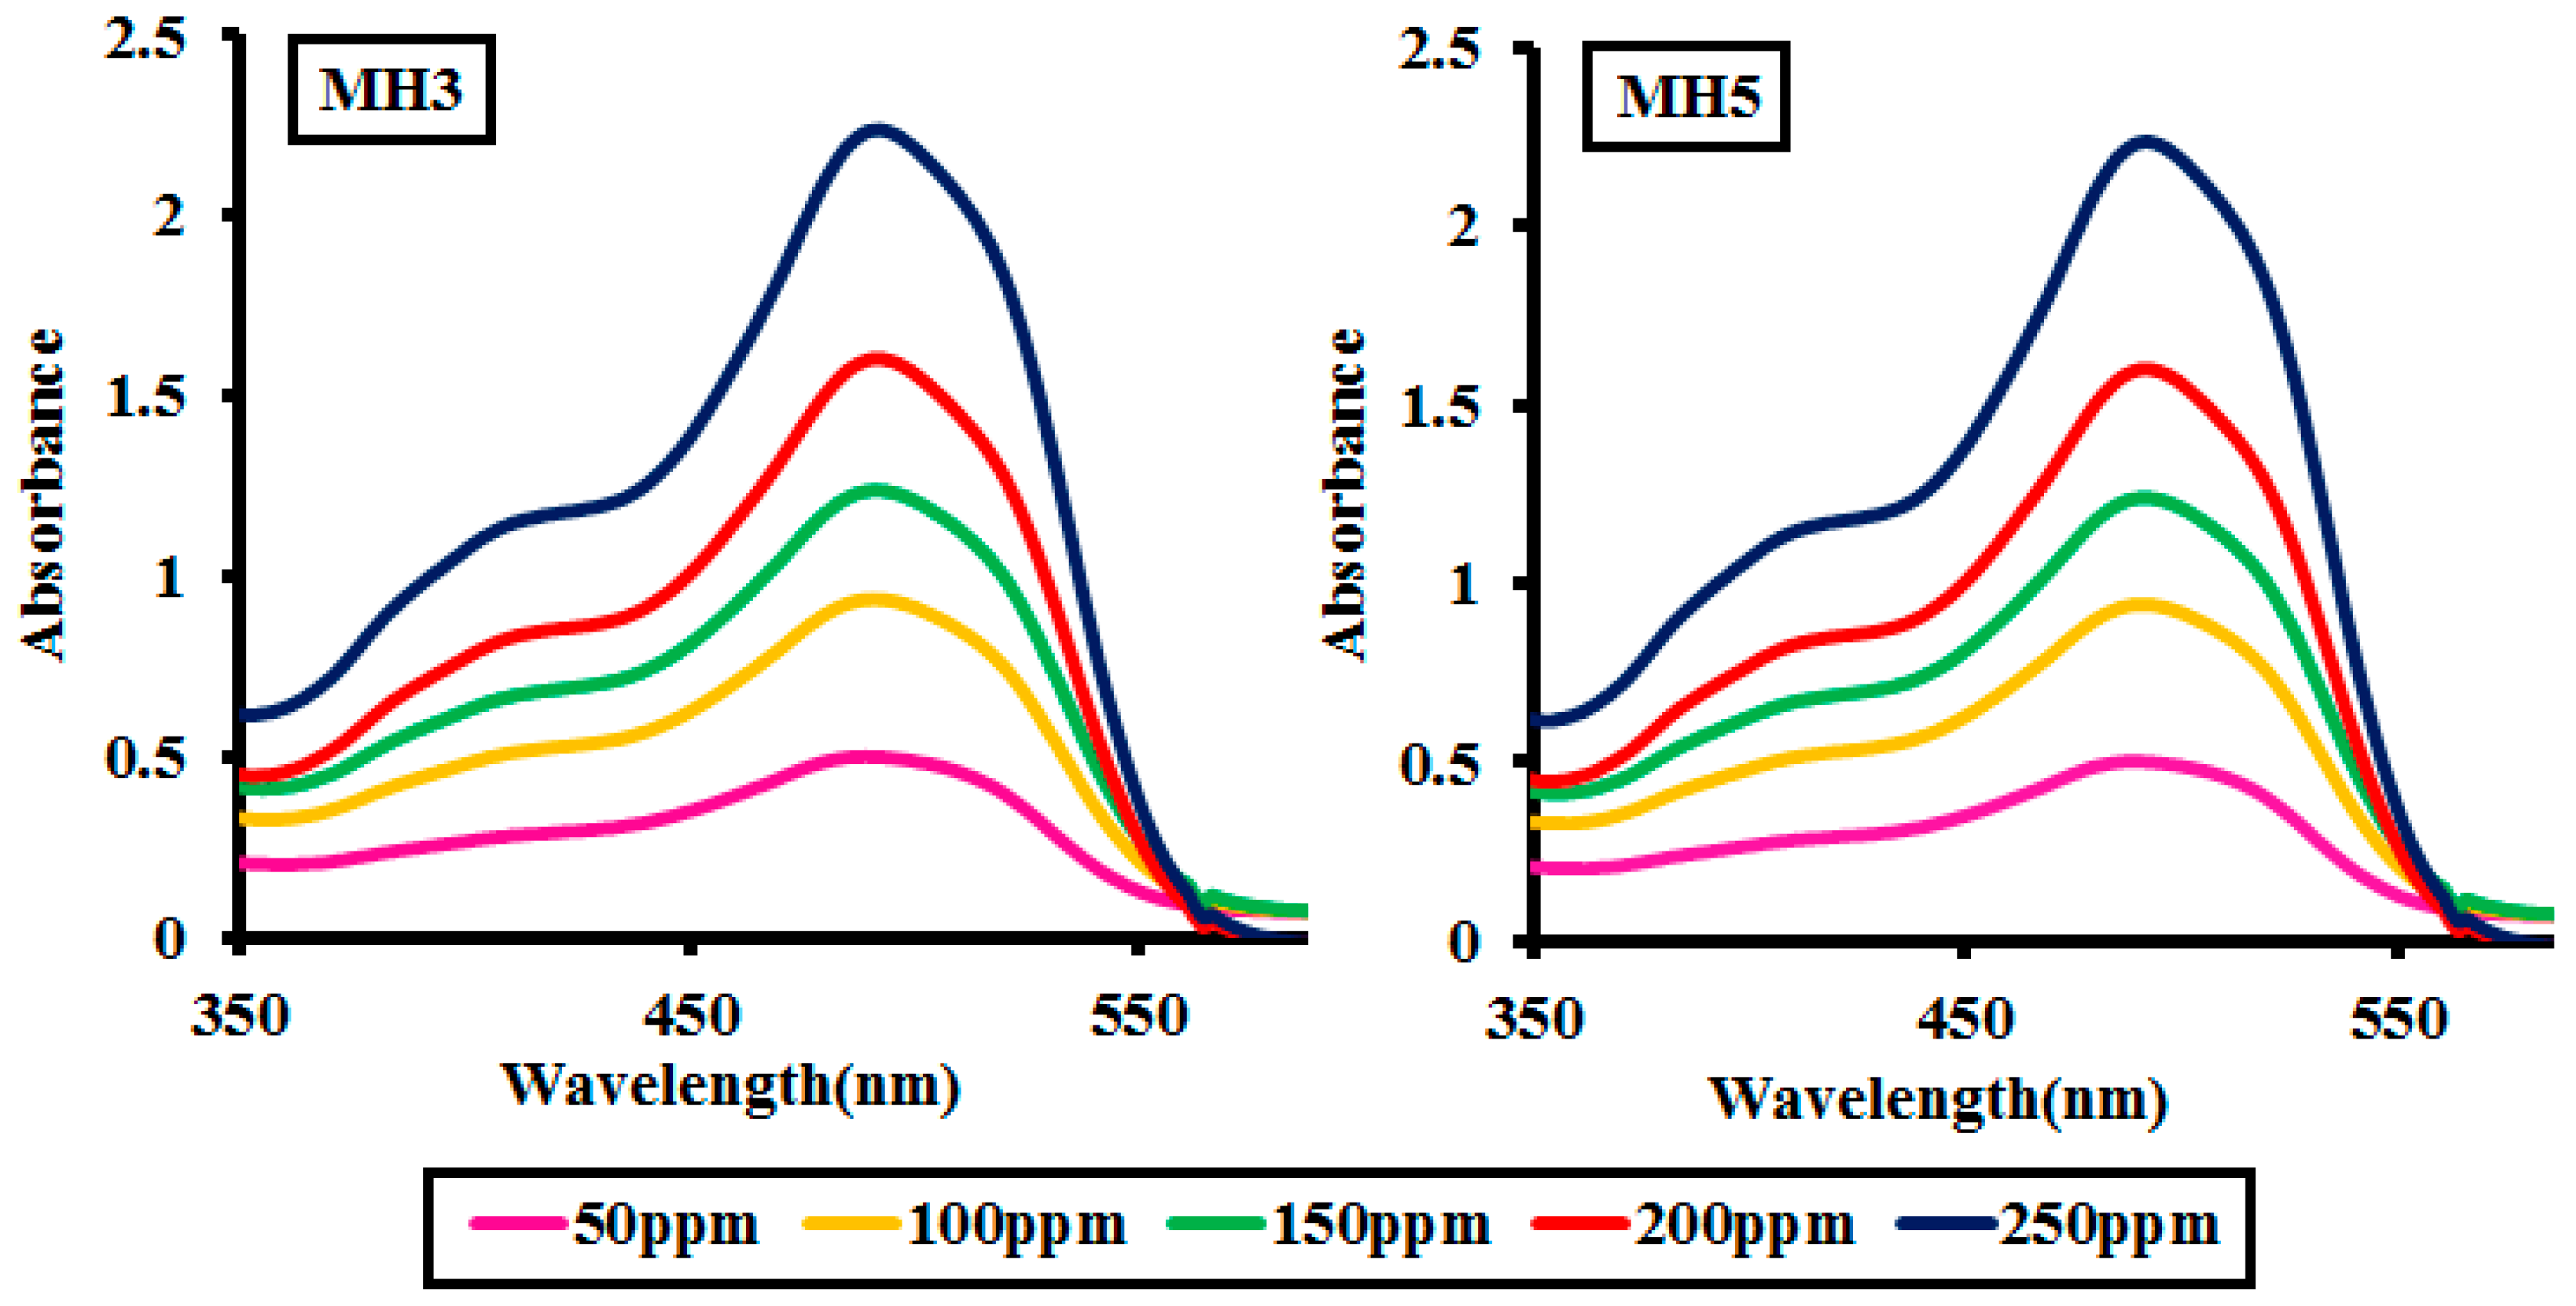
Catalysts 10 01150 g007
Figure 8. Photocatalytic degradation of alizarin red (AR) dye at different dye concentrations (50–250 ppm) by 0.025 g of MH3 and MH5 after 60 min of photocatalytic activity.
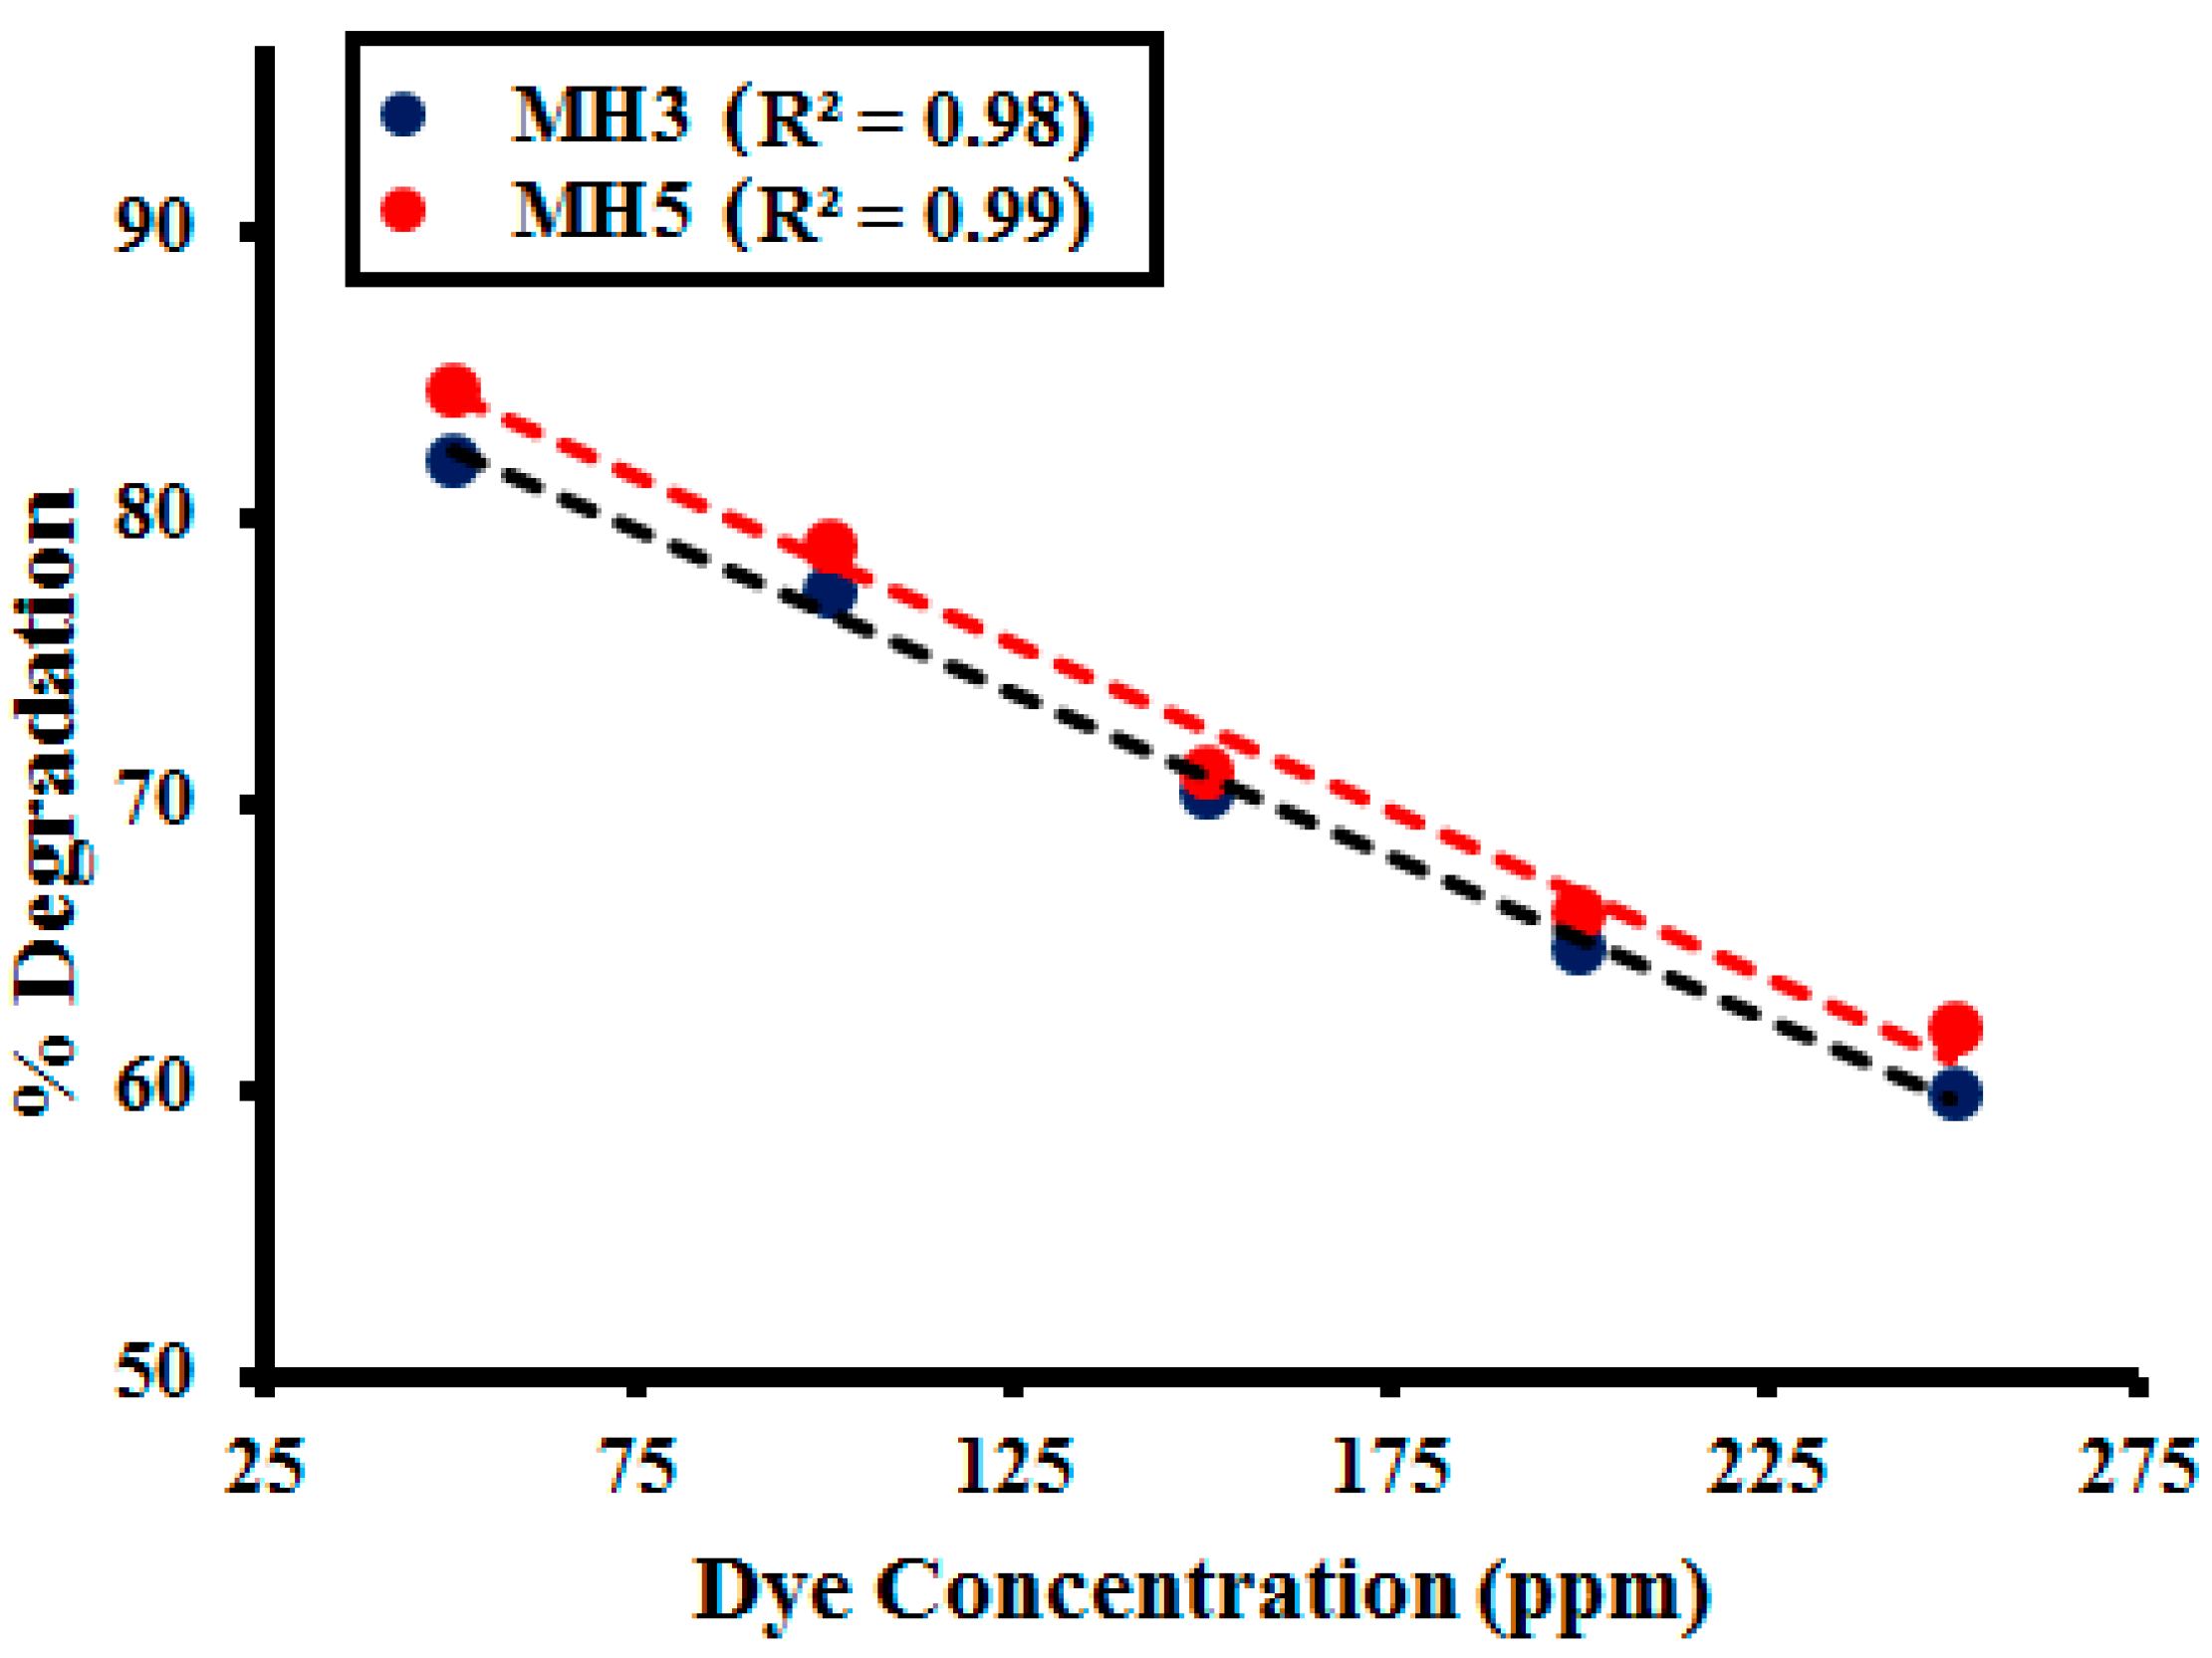
Catalysts 10 01150 g008
Figure 9. Correlation between different dye concentrations (50–250 ppm) and percentage degradation of alizarin red (AR) dye by 0.025 g of nanomaterials MH1 and MH5 after 60 min of photocatalytic activity.
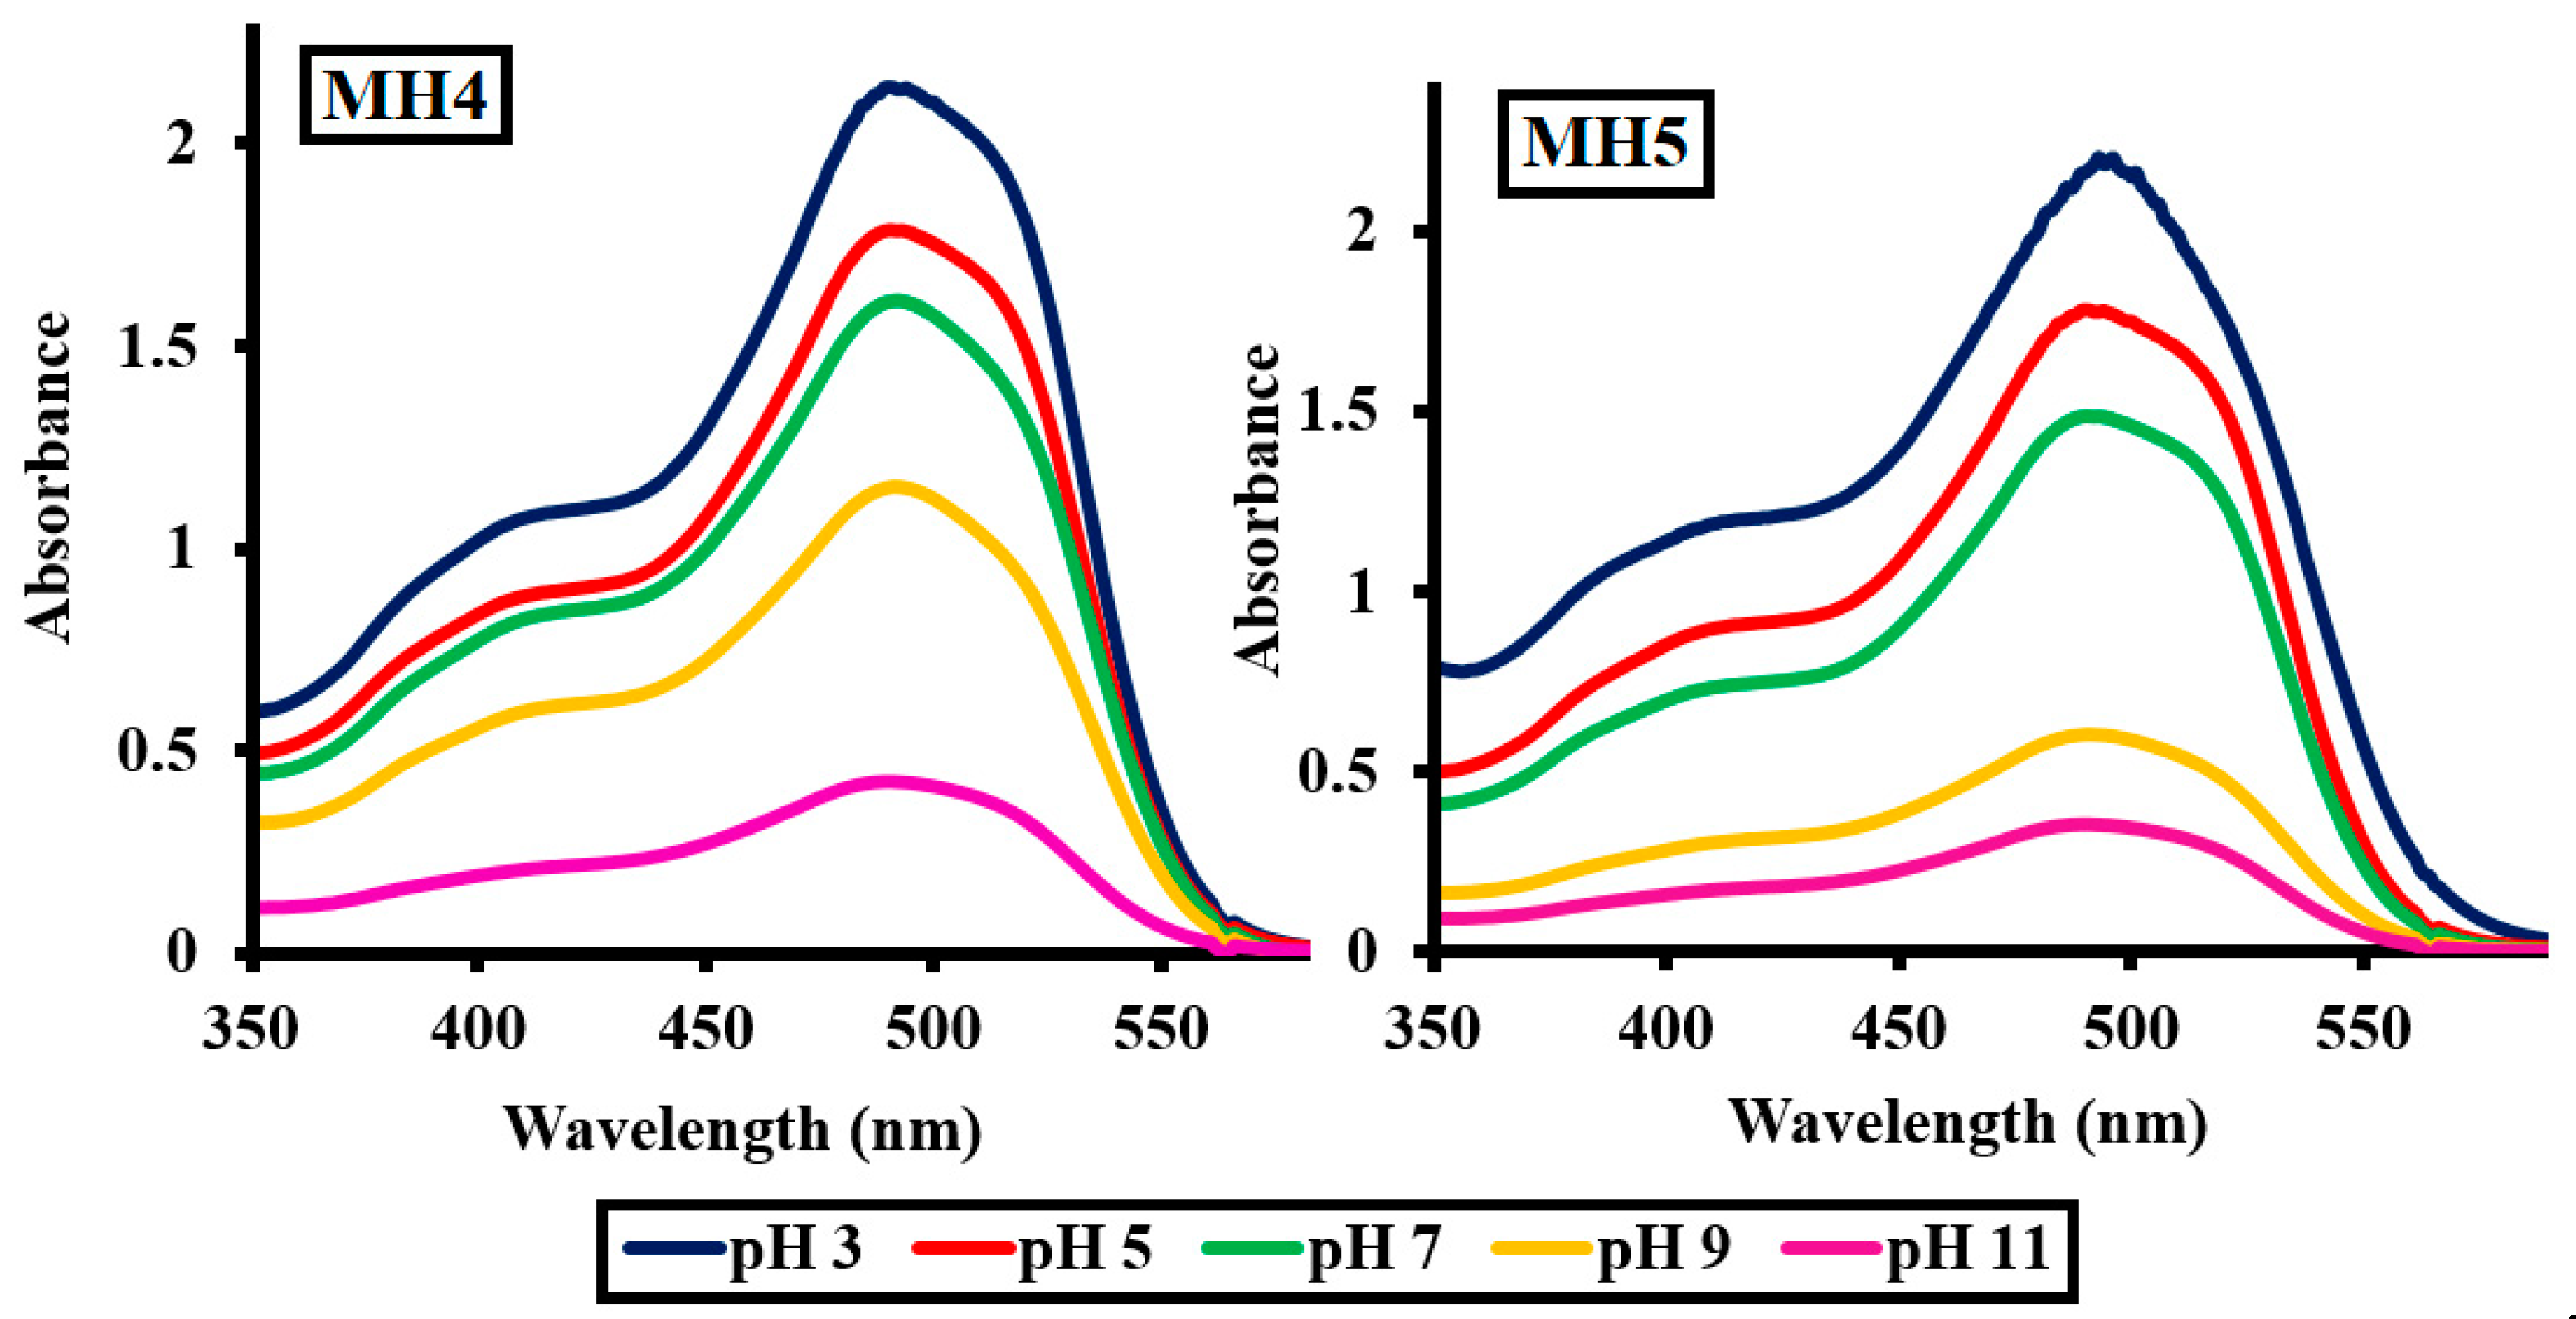
Catalysts 10 01150 g009
Figure 10. Photocatalytic degradation of alizarin red (AR) dye (250 ppm) after 60 min employing different pH by 0.025 g of MH1 and MH5.
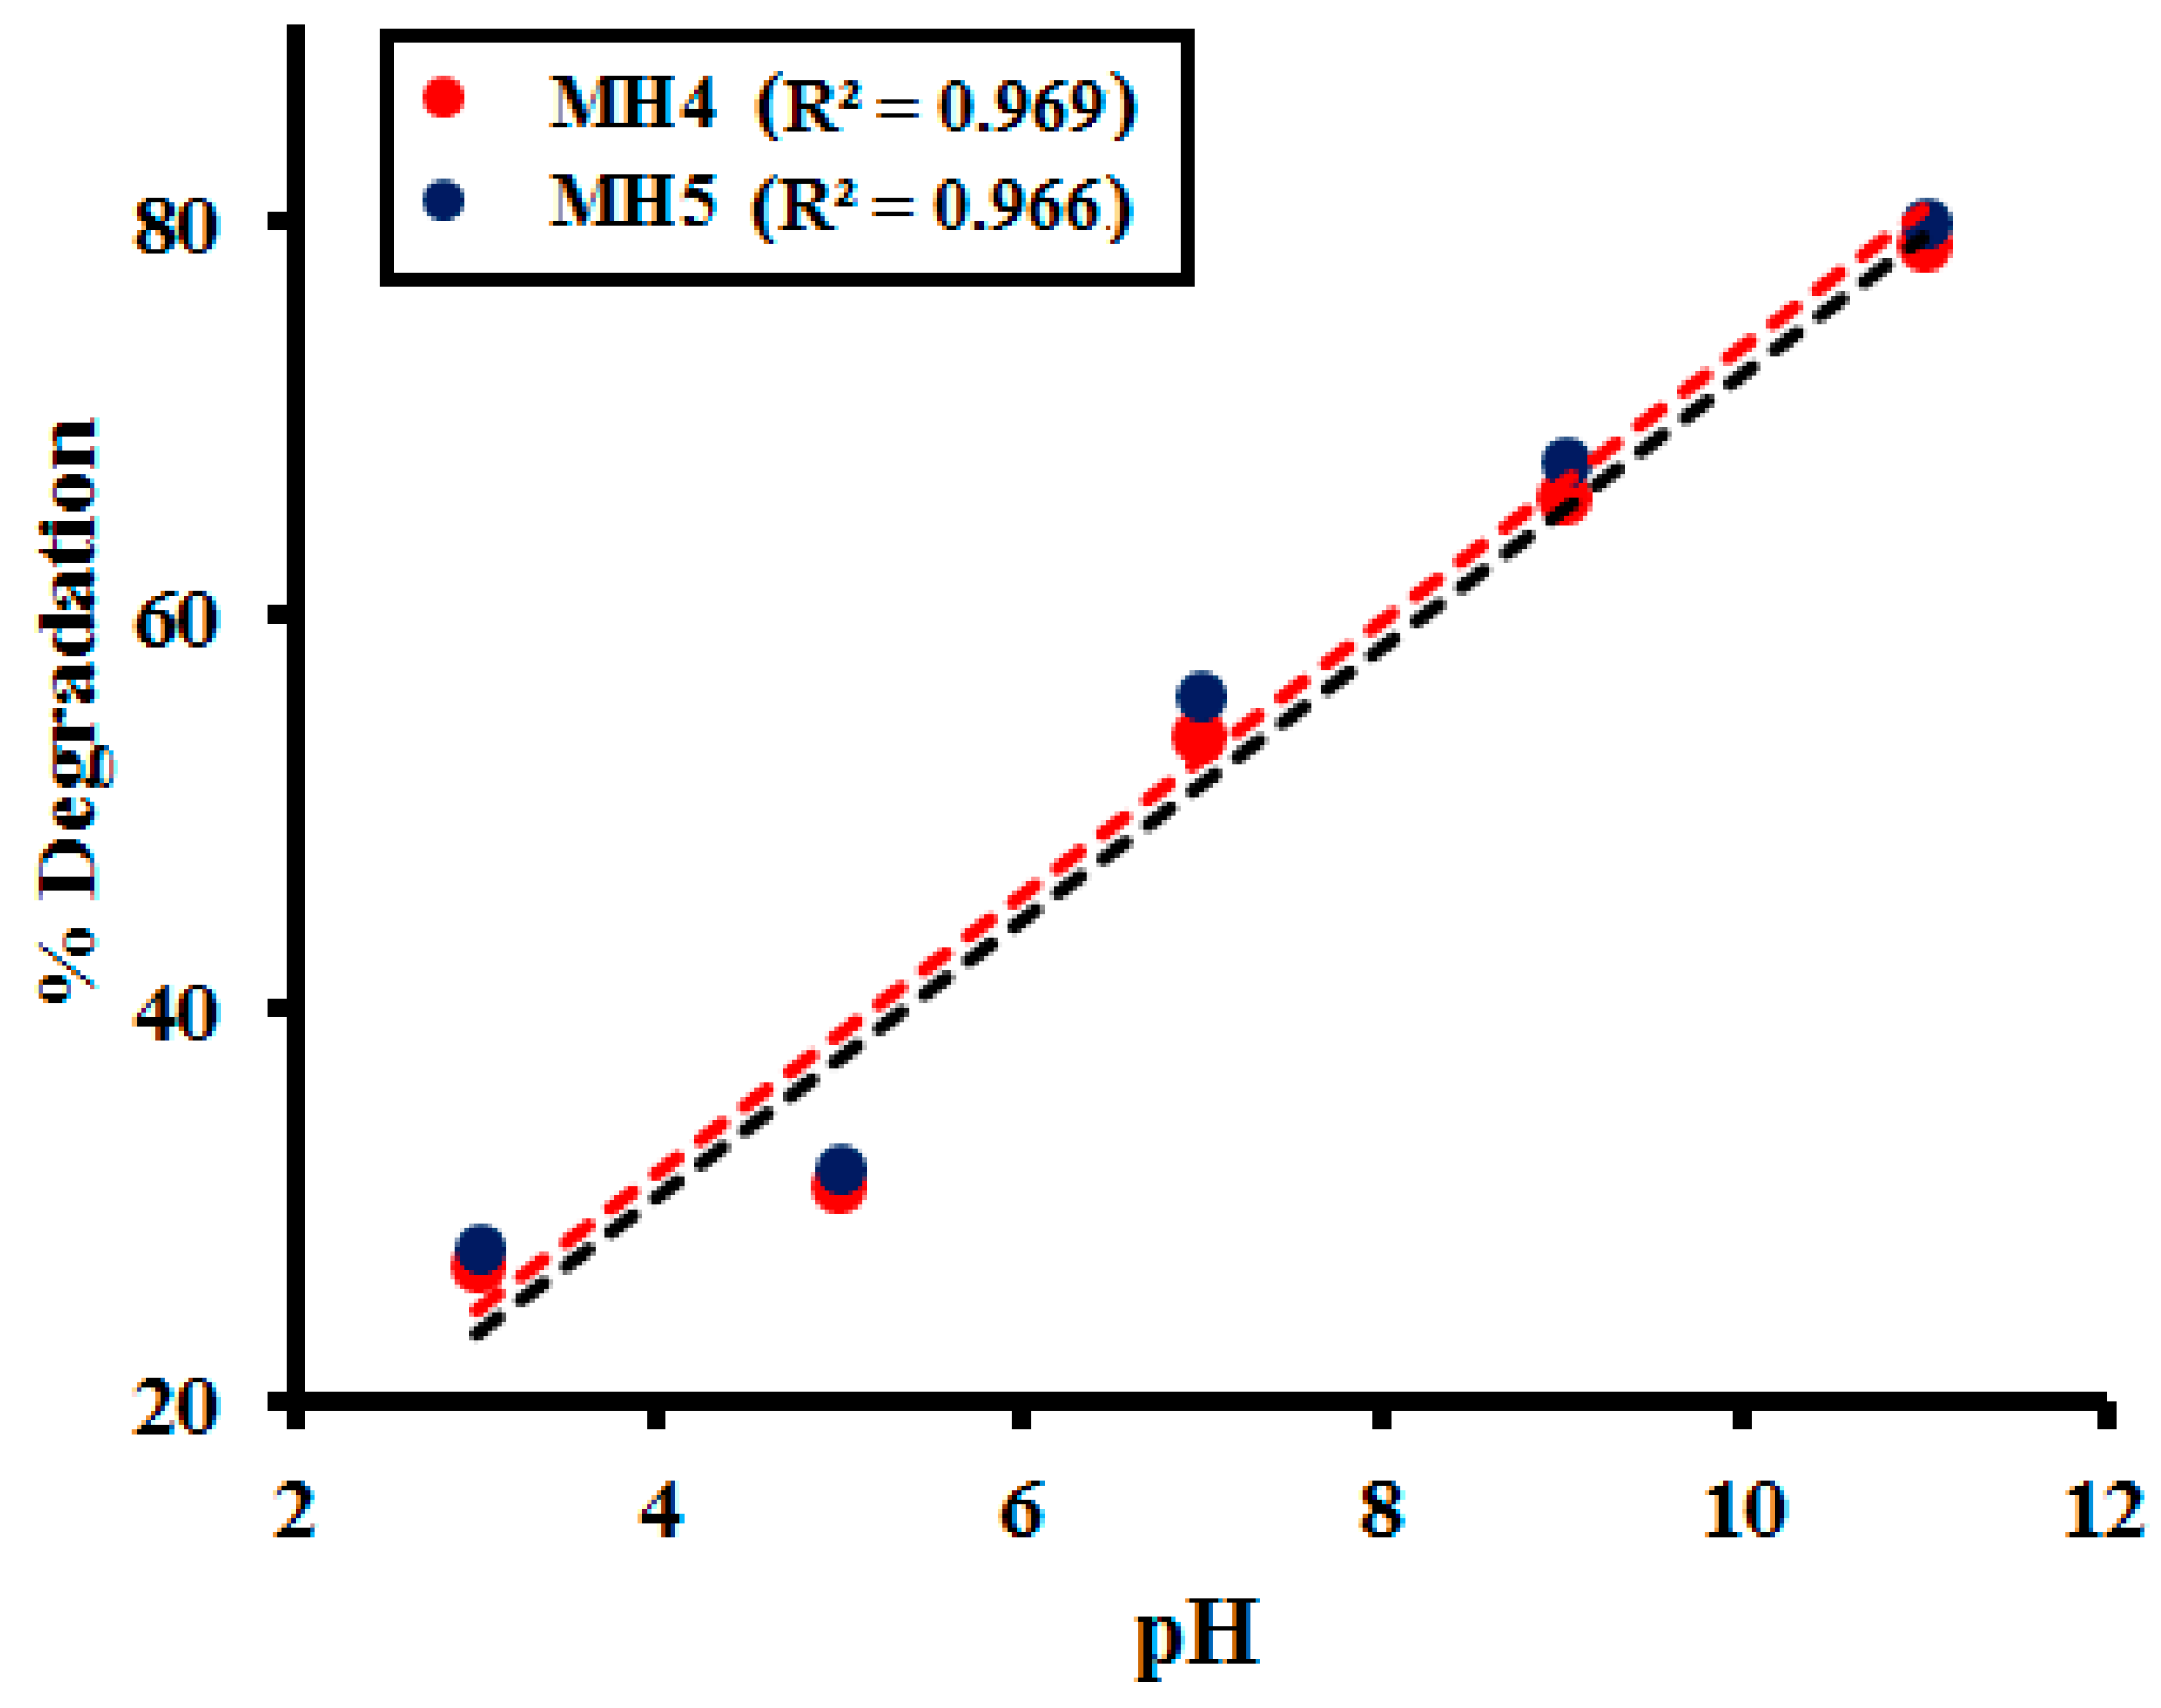
Catalysts 10 01150 g010
Figure 11. Correlation between different pH and percentage degradation of alizarin red (AR) dye (200 ppm) by 0.02 g of nanomaterials MH1 and MH5 after 60 min of photocatalytic activity.
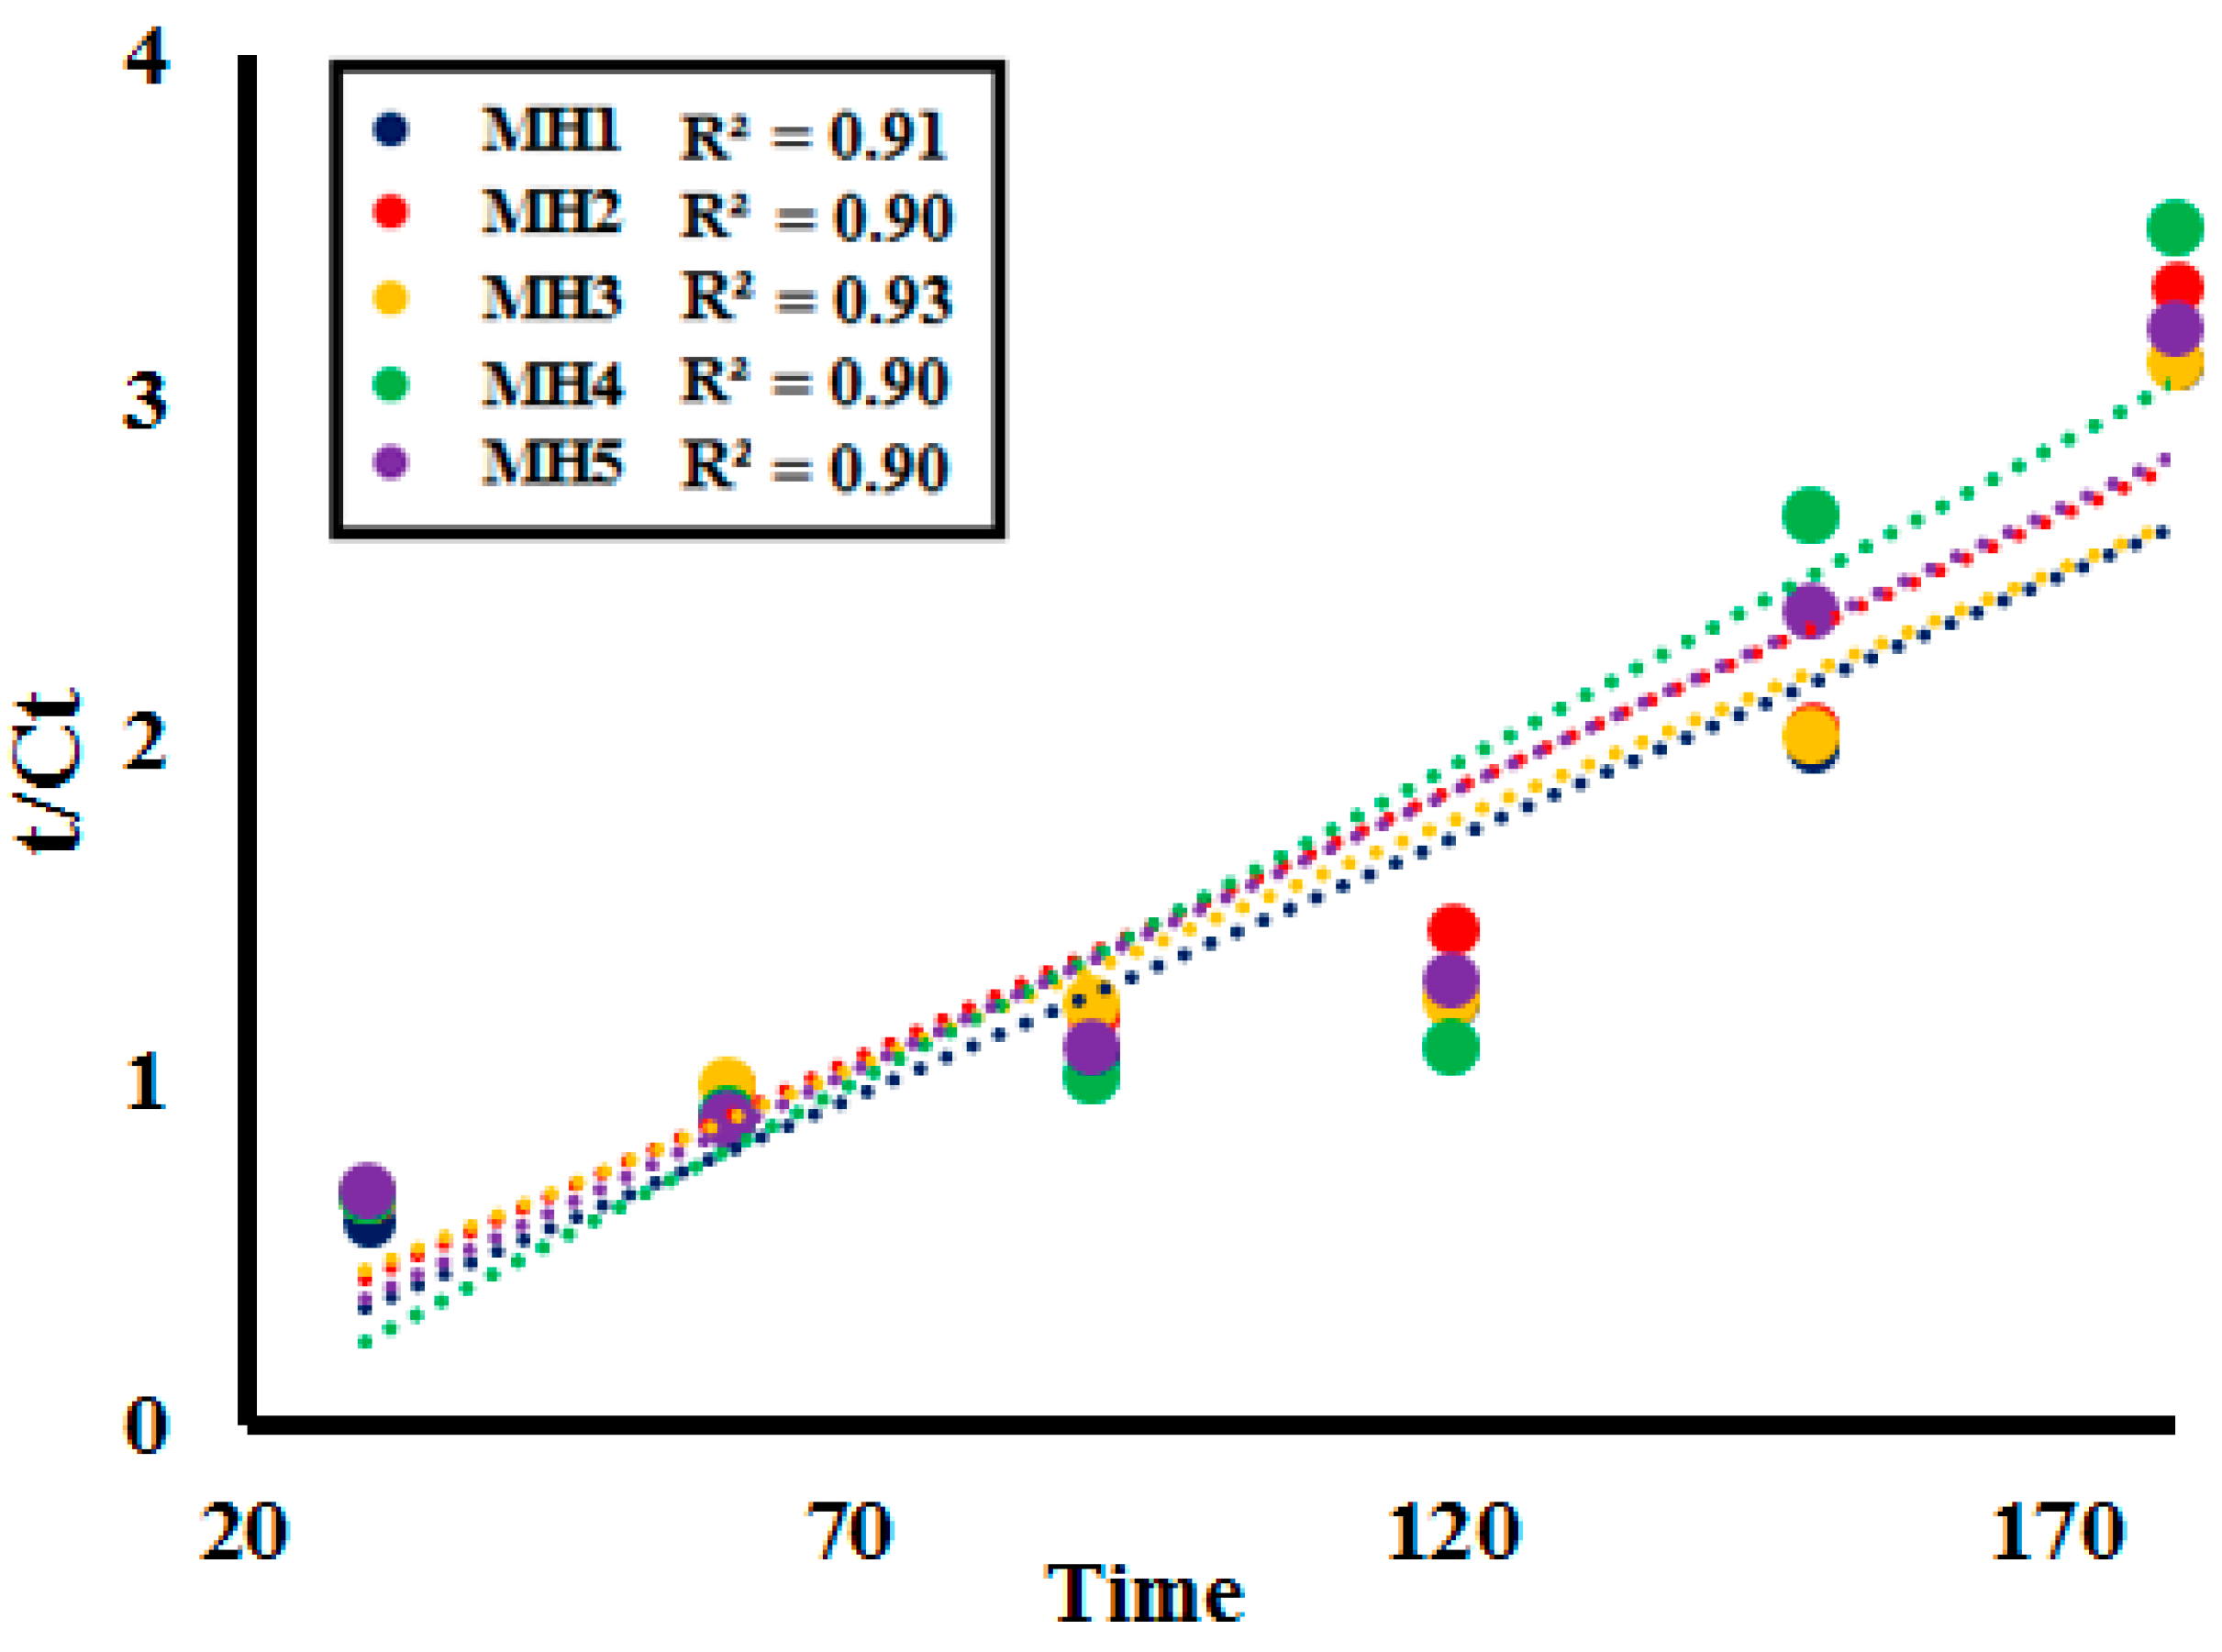
Catalysts 10 01150 g011
Figure 12. Pseudo second order kinetics of alizarin red (AR) dye degradation at different time intervals by nanomaterials (MH1–MH5).
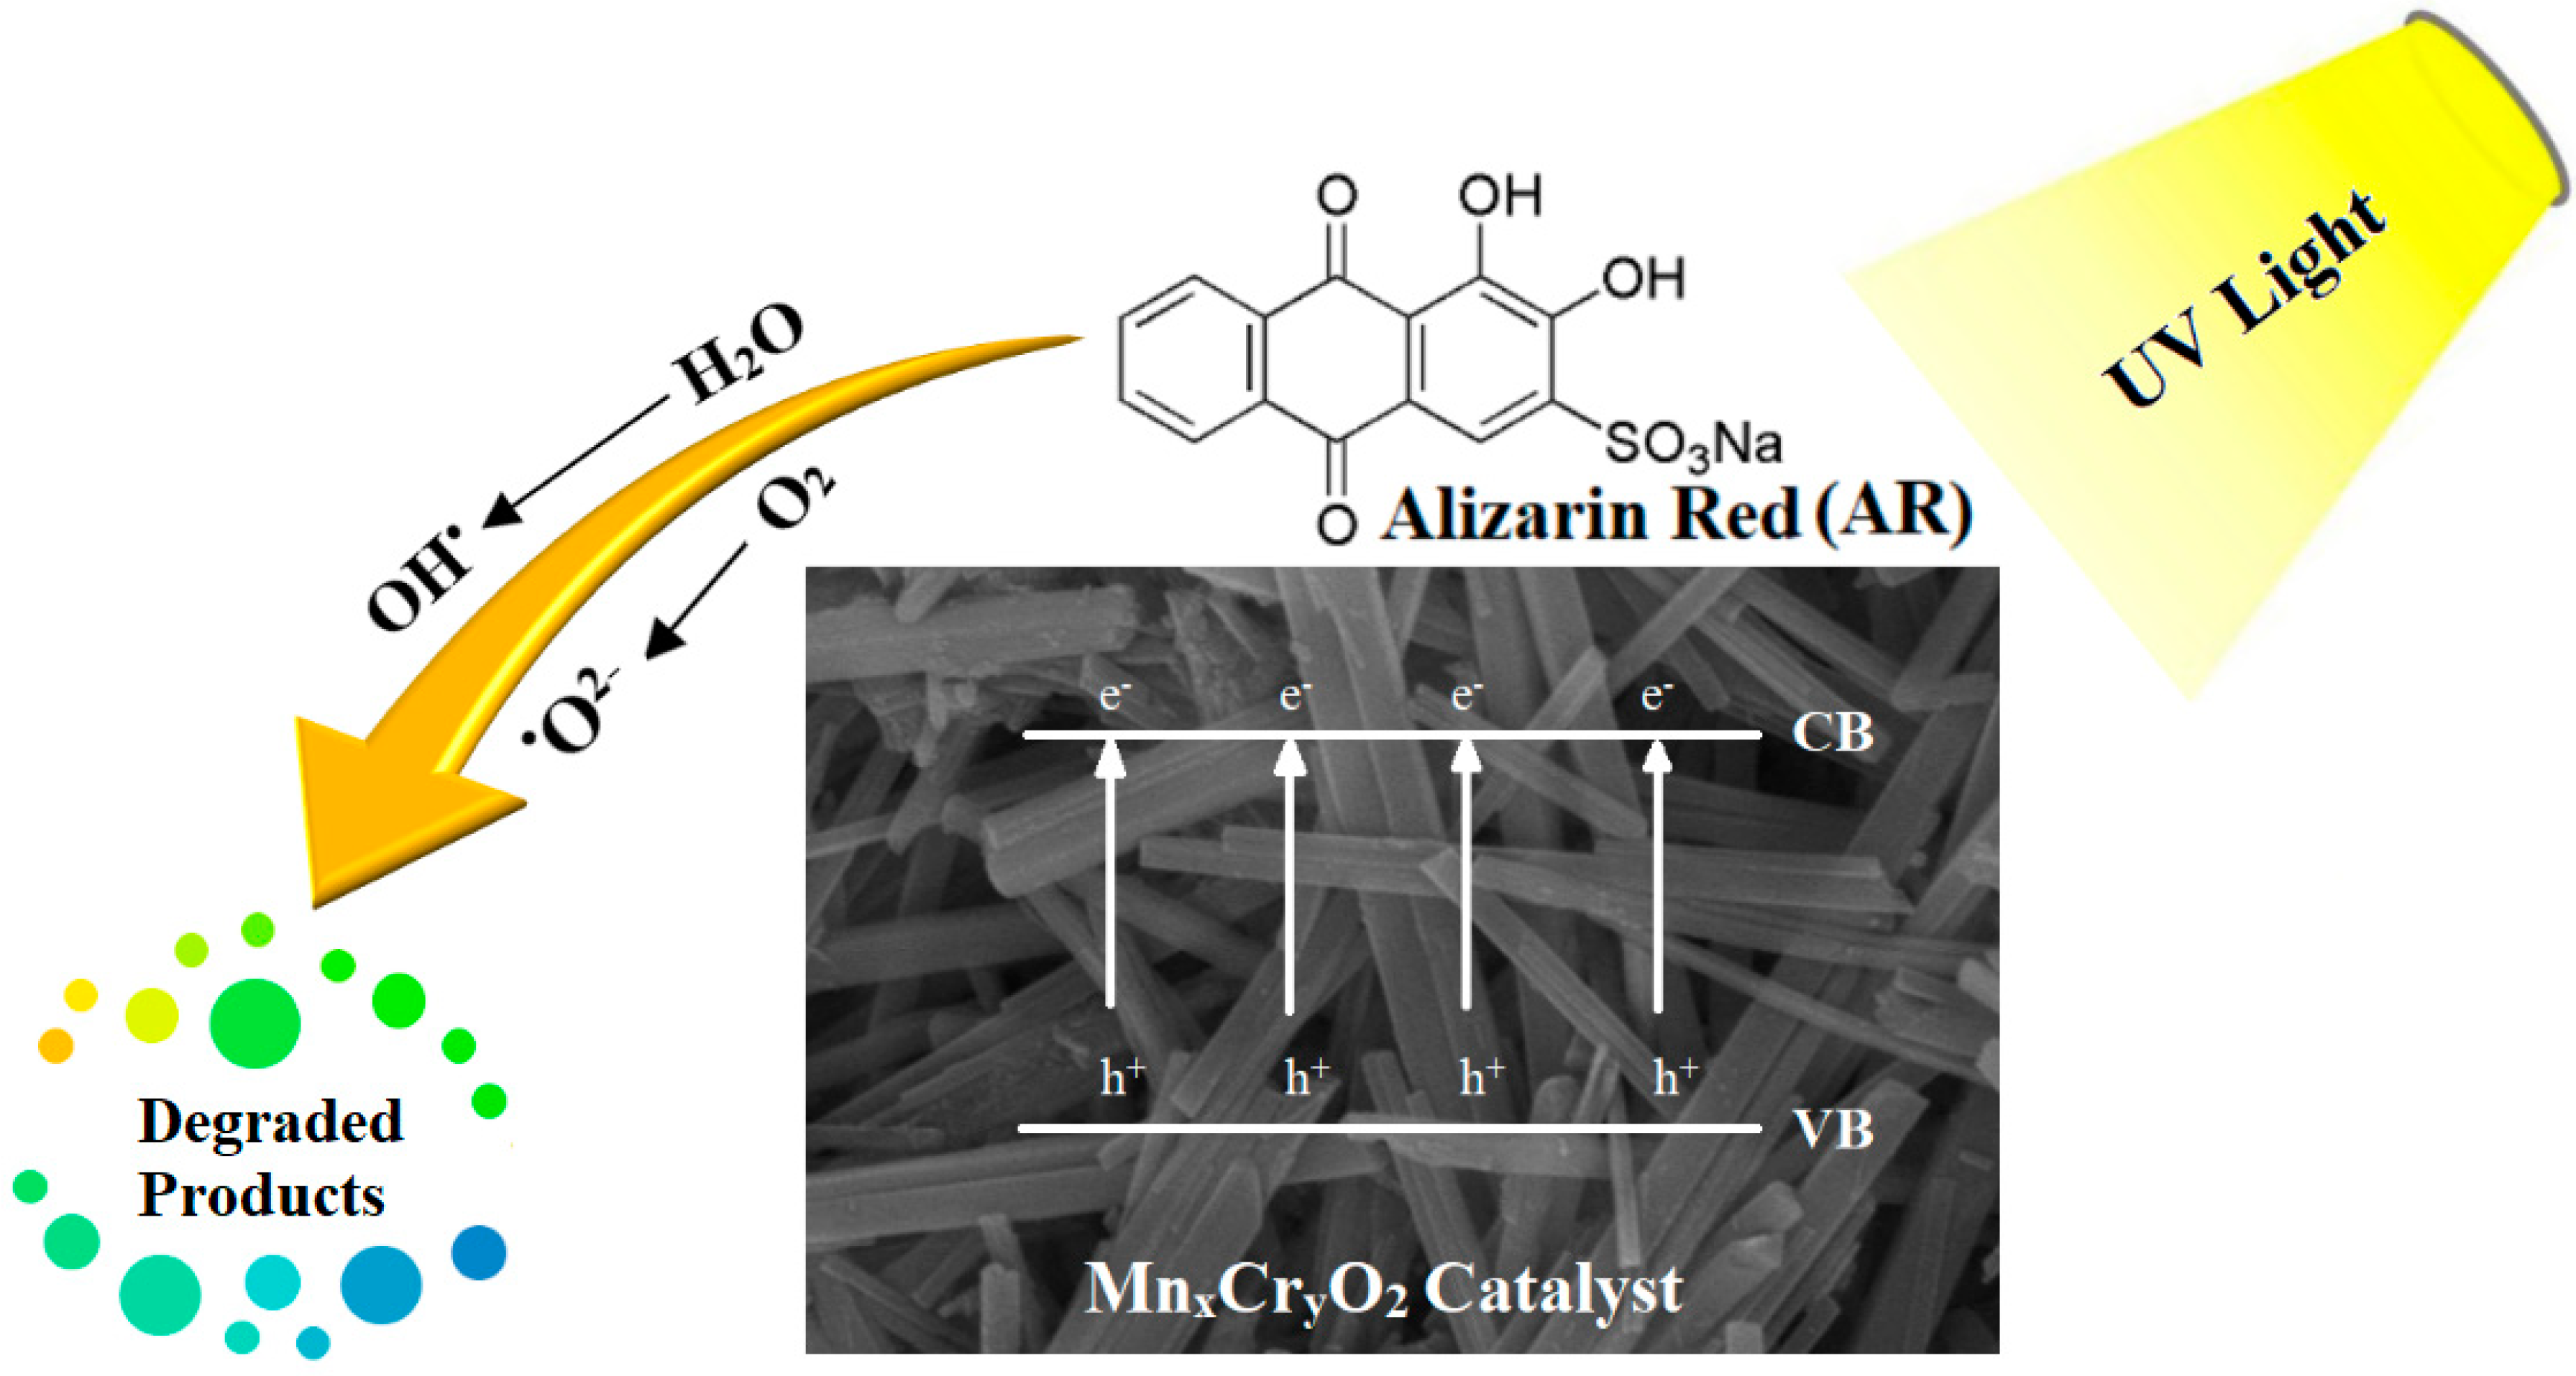
Catalysts 10 01150 g012
Figure 13. Proposed mechanism of AR dye degradation over surface of catalyst.
Catalysts 10 01150 g013
Table 1. Synthetic conditions, powder X-ray diffraction (PXRD) peaks and found composition (energy dispersive X-ray; EDX) of synthesized nanomaterials (MH1–MH5).
SamplesFound Unit FormulaSynthetic ConditionsPXRD Peaks (2θ)Found Composition by EDX
MH1Mn0.99Cr0.1O20.948 g KMnO4, 0.24 g K2Cr2O7, 20mL HCl12.65, 17.89, 28.59, 37.33, 41.77, 49.59, 56.31, 59.87, 69.37Mn (54.69); Cr (6.18); O (39.09)
MH2Mn0.87Cr0.15O20.948 g KMnO4, 0.41 g K2Cr2O7, 20mL HCl12.61, 18.03, 28.71, 37.41, 41.79, 49.67, 59.93, 69.31Mn (48.05); Cr (8.26); O (43.68)
MH3Mn0.99Cr0.13O20.948 g KMnO4, 0.35 g K2Cr2O7, 20mL HCl12.67, 18.09, 28.77, 37.41, 41.85, 49.71, 56.29, 60.11, 69.33Mn (54.88); Cr (7.21); O (37.90)
MH4Mn0.96Cr0.09O20.948 g KMnO4, 0.18 g K2Cr2O7, 20mL HCl13.09, 18.39, 28.85, 37.73, 42.07,50.13, 56.67, 60.25, 70.03Mn (53.05); Cr (5.05); O (41.88)
MH5Mn0.92Cr0.12O20.948 g KMnO4, 0.30 g K2Cr2O7, 20mL HCl12.77, 18.05, 28.65, 37.45, 41.95, 49.79, 56.25, 60.13, 69.03Mn (50.69); Cr (6.41); O (42.88)
Table 2. Synthetic conditions, composition and PXRD parameters of nanomaterials (MH1–MH6).
SamplesFound CompositionAverage Crystallite Size D (nm)Volume V = D3Dislocation Density × 10−3 (nm)−2 (δ)Micro Strain (ε)
MH1Mn0.99Cr0.1O244.02 ± 882,7805.95 × 10−40.035
MH2Mn0.87Cr0.15O238.90 ± 662,2056.98 × 10−40.038
MH3Mn0.99Cr0.13O249.60 ± 5126,6254.19 × 10−40.027
MH4Mn0.96Cr0.09O250.22 ± 7135,5844.20 × 10−40.02
MH5Mn0.92Cr0.12O236.82 ± 349,5767.60 × 10−40.035
Table 3. Morphological characteristics by SEM analysis of nanomaterials (MH1–MH5).
SamplesMaterial NatureDispersityStructural Appearance
MH1MonocrystallineMonodisperse Elongated Rod-like Structures
MH2MonocrystallineMonodisperseElongated Rod-like Structures
MH3MonocrystallineMonodisperseElongated Rod-like Structures
MH4MonocrystallineMonodisperseShort Edged Rods
MH5MonocrystallineMonodisperseElongated Rod-like Structures
Table 4. Brunauer–Emmett–Teller (BET) properties of synthesized nanomaterials (MH1–MH5).
BET PropertiesSamples
MH1MH2MH3MH4MH 5
Surface ARea (SBET) (m2/g)37.15333.99846.32537.51520.906
Pore Volume (Vm) (cc/g)0.0480.0180.0380.0430.032
Pore Width (nm)3.7752.4252.5833.5374.887
Constant C6951.9824.65219.1193.292090.61
Table 5. Photocatalytic degradation of alizarin red (AR) dye (250 ppm) by MH1–MH5 (0.025 g) at different time intervals.
Time (min)MH1MH2MH3MH4MH5
3046.2144.9445.6144.2147.23
6057.1152.4052.1253.0254.15
9061.7861.0062.0963.0762.20
12067.7866.1868.2168.2267.98
15079.2978.7978.7679.5177.13
18089.0688.9986.7688.2389.89
Table 6. Photocatalytic degradation of alizarin red (AR) dye (250 ppm) by different catalytic dosage of MH1–MH5 after 60 min of photocatalytic activity.
Amounts (g)MH1MH2MH3MH4MH5
0.02038.9939.2338.3240.2241.77
0.02557.1152.4052.1253.0254.15
0.03067.3268.2366.2167.8868.54
0.03570.8669.5469.8670.5571.87
0.04081.7682.8781.3683.7884.34
Table 7. Photocatalytic degradation of different concentrations (50–250 ppm) of alizarin red (AR) dye by MH1–MH5 (0.025 g) after 60 min of photocatalytic activity.
Dye Concentration (ppm)MH1MH2MH3MH4MH5
5082.1283.0983.8783.4383.54
10077.477779.2278.8778.12
15070.477171.1270.4572.22
20063.2165.0365.8364.2264.08
25057.1152.4052.1253.0254.95
Table 8. Photocatalytic degradation of alizarin red (AR) dye (200 ppm) by MH1–MH5 (0.02 g) after 60 min of photocatalytic activity.
pHMH 1MH 2MH 3MH 4MH 5
325.6226.2026.8625.9226.14
527.6927.1128.2928.6827.88
749.2248.0149.7849.8950.22
964.6364.9865.2265.1867.63
1176.7176.0276.1076.9778.51
Table 9. Correlation (R2 Values) between factor studied and AR dye concentration after 60 min of photocatalytic activity (R2 Values).
SamplesCorrelation between Factor Studied and AR Dye Concentration after 60 min of Photocatalytic Activity (R2 Values)
TimeCatalyst DoseDye ConcentrationpH
MH10.9590.9690.9320.973
MH20.940.9680.9280.972
MH30.9320.9530.9600.971
MH40.9460.9430.9540.865
MH0.9860.9240.9880.869

