Article

Investigating the Cultural Impact on Predicting Crowd Behavior

by
Fatima Jafar Muhdher
*,
Osama Ahmed Abulnaja
and
Fatmah Abdulrahman Baothman
Faculty of Computing and Information Technology, King Abdulaziz University, Jeddah 21431, Saudi Arabia
*
Author to whom correspondence should be addressed.
Computers 2023, 12(5), 108; https://doi.org/10.3390/computers12050108
Submission received: 16 April 2023 / Revised: 13 May 2023 / Accepted: 18 May 2023 / Published: 21 May 2023
(This article belongs to the Special Issue Human Understandable Artificial Intelligence)

Abstract

:
The Cultural Crowd–Artificial Neural Network (CC-ANN) takes the cultural dimensions of a crowd into account, based on Hofstede Cultural Dimensions (HCDs), to predict social and physical behavior concerning cohesion, collectivity, speed, and distance. This study examines the impact of applying the CC-ANN learning model on more cultures to test the effect of predicting crowd behavior and the relationships among their characteristics. Our previous work which applied the CC-ANN only included eight nations using the six HCDs. In this paper, we including the United Arab Emirates (UAE) in the CC-ANN as a new culture which aided a comparative study with four HCDs, with and without the UAE, using Mean Squared Error (MSE) for evaluation. The results indicated that most of the best-case experiments involved the UAE having the lowest MSE: 0.127, 0.014, and 0.010, which enhanced the CC-ANN model’s ability to predict crowd behavior. Moreover, the links between the cultural, sociological, and physical properties of crowds can be seen from a broader perspective with stronger correlations using the CC-ANN in more countries with diverse cultures.

1. Introduction

In earlier work, we constructed the Cultural Crowd–Artificial Neural Network (CC-ANN), which is a sophisticated learning model that utilizes the Hofstede Cultural Dimensions (HCDs) of crowds to predict their physical behavior (speed and distance) as well as their social behavior (cohesion and collectivity) [1]. The CC-ANN is predictive analytics supervised learning model. The six HCDs that were utilized in our previous study were “Power Distance (PDI), Individualism (IDV), Masculinity (MAS), Uncertainty Avoidance (UAI), Long-Term Orientation (LTO), and Indulgence (IVR)” [1]. The research focused on groups of individuals within a crowd by using the Cultural Crowds (CC) learning model, which was designed to elicit relationships between a crowd’s cultural, social, and physical characteristics via an Artificial Neural Network (ANN) [1]. Our objective was to enhance Crowd Management (CM) by improving crowd collectivity, density, flow rate, and satisfaction. In doing so, we recognized the most impactful HCD in concern with the prediction of crowds’ social and physical behavior [1]. In addition, we discovered that individual cultural features could positively or negatively affect crowd behavior. Therefore, the CC-ANN could be integrated into decision-making tools for cognitive CM systems, such as the prediction of crowd behavior before large groups arrive at an event site to avoid overcrowding or the production of backup plans in unforeseen circumstances. Furthermore, information can be gathered automatically by cognitive system agents supported by Internet of Things technologies and sensors [1].
Based on our previous work [1], the researchers suggested that additional nations and cultures should be included in a further study to gain a more comprehensive insight into the results and relationships. Therefore, this study is considered a step forward, as a new culture was added to the CC-ANN. Regarding our previous study, by integrating the HCD [2,3] and CC [4] datasets by the nation to construct our dataset [1], the entries for the United Kingdom and Portugal comprised less than three records. Thus, they were considered outliers and excluded. Additionally, the entries for the United Arab Emirates (UAE) were excluded because scores for the dimensions of IVR and LTO were unavailable. Therefore, we decided to conduct a further study that included the UAE nation as a new culture with the CC-ANN.
Since we are dealing with cross-cultural crowds, the relationship between culture and the extent to which cultural dimensions influence crowd behavior varies. The difference in results after adding the UAE nation to the study was expected in the first place. Adding different cultures will carry with them different influences on the behavior of their people as crowds. That is, the cultural dimensions will differ in their impact on the behavior of the individuals as crowds. The success of the model does not mean that the results are identical whenever we add a new culture. On the contrary, it is about catching the difference. This difference is what inspired us to conduct this comparative investigation between including and excluding the UAE to see if there are dimensions that have more influence than others on crowd behavior, whether alone or with other dimensions, and whether this affects predicting crowd behavior positively or negatively. The UAE is a different culture, and the difference was not only related to the different scores of the HCDs but also to the values of the other CC inputs. The combination of these inputs is what creates the difference. Because we do not deal with crowds as a fluid, but are dealing with human beings, which are a composite of different backgrounds, and we are trying to understand them more on a micro level.
Constructing the CC-ANN learning model is a goal-oriented research [1]. The first phase was related to considering 6-HCD without the UAE due to the unavailability of two HCDs (IVR and LTO) of the UAE. The second phase, which was based on adding other cultures to develop the CC-ANN model, with the UAE in the case of this study, considered 4-HCD cultural dimensions due to the unavailability of two HCDs (IVR and LTO). The third phase, which is the current study, is the comparative investigation between the first and second phases when noting the existence of a difference between their results. Consequently, we gain more knowledge of the most influential dimensions that were repeated in both phases, whether alone or with other dimensions, which reflects the strength of the extracted relationship. Every time a new country is added to the CC-ANN model, we go through the same phases until we reach a clear picture of the extracted relationships.
The objective of the current work was to offer an overview of the application of the CC-ANN to various cultures across different countries with distinct cultural dimensions to increase our understanding of the potential variations in behavior between individuals from various cultural groups within crowds. In addition, we sought to gain insights into how specific cultural characteristics may influence the perception of crowd behavior. We used two experimental groups, one with and one without the UAE, to achieve this. We evaluated each experiment based on Mean Squared Error (MSE). In addition, the experimental groups were divided into two categories to analyze the results and elicit associations between the cultural background of the grouped individuals and their social and physical behavior. The following two points summarize the essential contributions of the current study regarding the inclusion of the UAE with the CC-ANN:
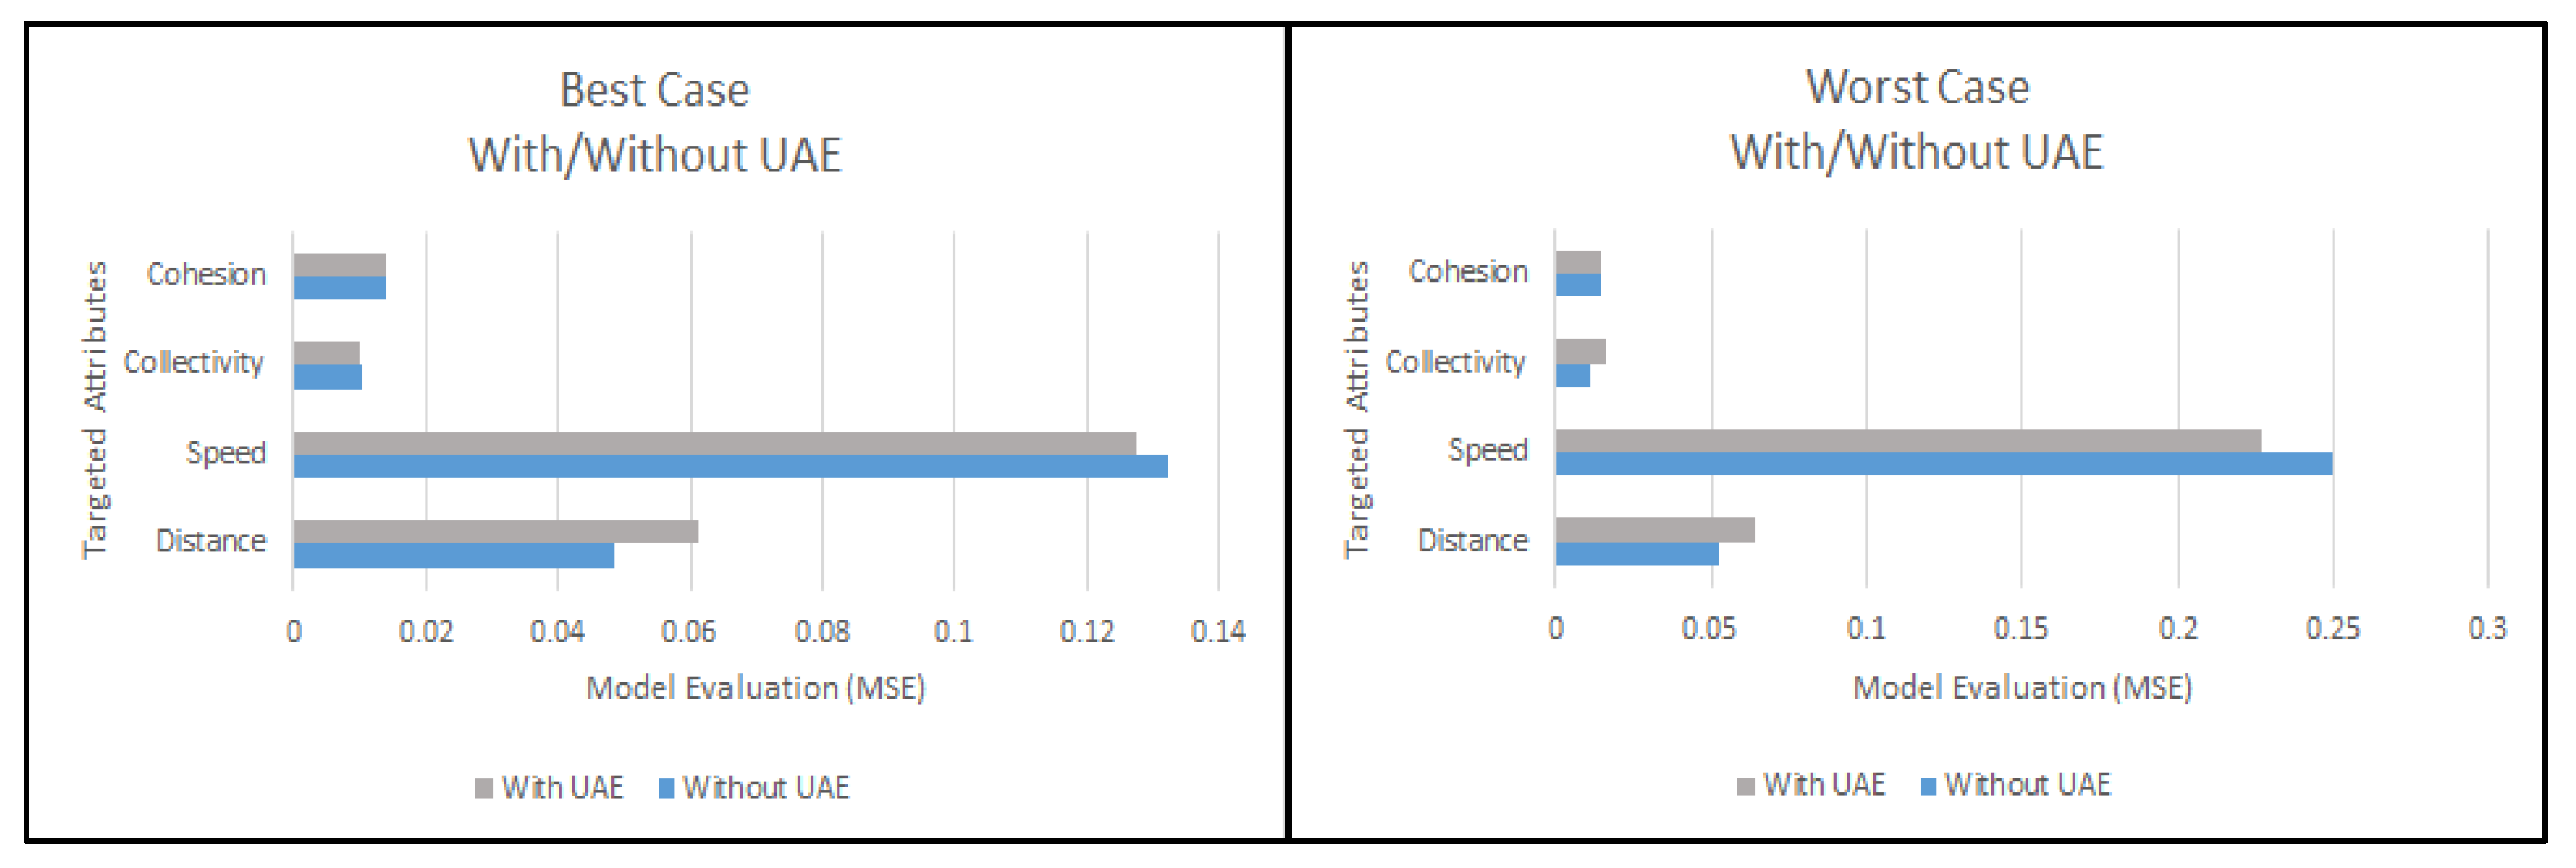
  • Most of the best-case experiments that included the UAE tended to have lower MSEs: 0.127, 0.014, and 0.010. This implies that applying the CC-ANN to a nation with a different culture and cultural dimensions improved the model’s ability to predicate the crowd’s social and physical behavior because it gained more knowledge about other cultures.
  • Most comparable experiments, with and without the UAE, had one common cultural dimension. These similarities reflect a strong correlation between these common cultural dimensions and the target attributes. This implies that applying the CC-ANN to a nation with a different culture and cultural dimensions provides a different perspective with stronger correlations on the influence of cultural background on individuals’ behavior in crowds.
This paper is structured as follows: Section 2 illustrates the significant aspects regarding the CC-ANN model’s design. Section 3 describes the experiments’ designs with and without the UAE. Section 4 details the most important outcomes of the experiments that included the UAE and compares the experiments with and without the UAE. Lastly, Section 5 concludes the research and suggests several recommendations to enhance the CC-ANN.

2. The CC-ANN Learning Model

As previously illustrated, The CC-ANN is a learning model that utilizes the HCDs of crowds to predict their physical behavior (speed and distance) as well as their social behavior (cohesion and collectivity) [1]. This section presents some significant concepts and components related to the CC-ANN model’s design [1]. First, the HCD model and its dataset were used to represent the cultural background of the crowd. Then, the CC model and its related dataset were used to represent the social and physical characteristics of the crowd. Next, the HCD and CC integrated dataset was used later within the ANN model. After that, the ANN model was employed to apply the CC model to predict the crowd’s social and physical target attributes. Finally, the CC-ANN learning model design was formed.

2.1. The HCD Model

The description of culture according to Hofstede is: “The collective programming of the mind that distinguishes individuals of one group of people from another” [5]. Hofstede and his colleagues created a six-dimensional cultural model, which represents six social issues that model society’s impacts on the individual. In addition, it illustrates how their behavior is related to those values. Each dimension is assigned a score on a scale of 0–100. Differences of at least 10 in these scores indicate variations in individual behavior across different countries. Table 1, based on information from the Hofstede Insights website [2], displays the four dimensions included in the current study.

The HCD Dataset

The HCD dataset [3,6], which incorporates cultural dimension scores for 111 nations, is based on Hofstede’s work [5]. Table 2 shows the four HCD scores for the nations included in this study and our previous study [1]. However, the IVR and LTO dimension scores were not available for the UAE. As a result, we conducted all the experiments using only four HCDs: PDI, IDV, MAS, and UAI, including data for the UAE, compared to four HCDs without the UAE.

2.2. The CC Learning Model

The CC model predicts physical behavior in terms of speed and distance and social behavior in terms of cohesion and collectivity while accounting for individuals’ cultural backgrounds. It was inspired by the Big-Four Geometrical Dimensions (Big4GD) model, which comprised four dimensions that describe grouped pedestrians in regard to the space and time relation, namely: Social, Physical, Cultural, and Personal and Emotional dimensions. [4]. Figure 1 illustrates the CC learning paradigm, which incorporates social, physical, and cultural dimensions [1]. This study focuses explicitly on grouped individuals within crowds and therefore examines the following three dimensions:
The physical dimension, which represents physical crowd characteristics such as angular fluctuations, speed, and distance by tracking pedestrians [1,4].
The social dimension, which encompasses the social characteristics of a crowd derived from social interaction and physical characteristics, including cohesion and collectivity [1,4].
The cultural dimension, which reflects the cultural characteristics of the crowd in regard to Hofstede’s essential study [7], as explained in Section 2.1. The current study only included four cultural dimensions (PDI, IDV, MAS, and UAI).
The researchers successfully mapped group-specific factors to the cultural dimensions. Then, all the input and output features were fully connected to assess the significance of each HCD on the prediction of each target attribute [1].

The CC Dataset

The CC videos dataset [8] was developed to investigate the cultural dimensions of crowd behavior. It comprises video clips of crowded scenes from 11 countries based on the Big4GD model and Geometrical Mind (GeoMind) software [4]. It consists of 29 video clips/ [100–900] frames, with extracted characteristics of grouped pedestrians. The video clips were categorized by nationality to explore culturally relevant issues in each country. In this dataset, the social and physical features of the group members were analyzed. The following attributes were adapted in the current study:
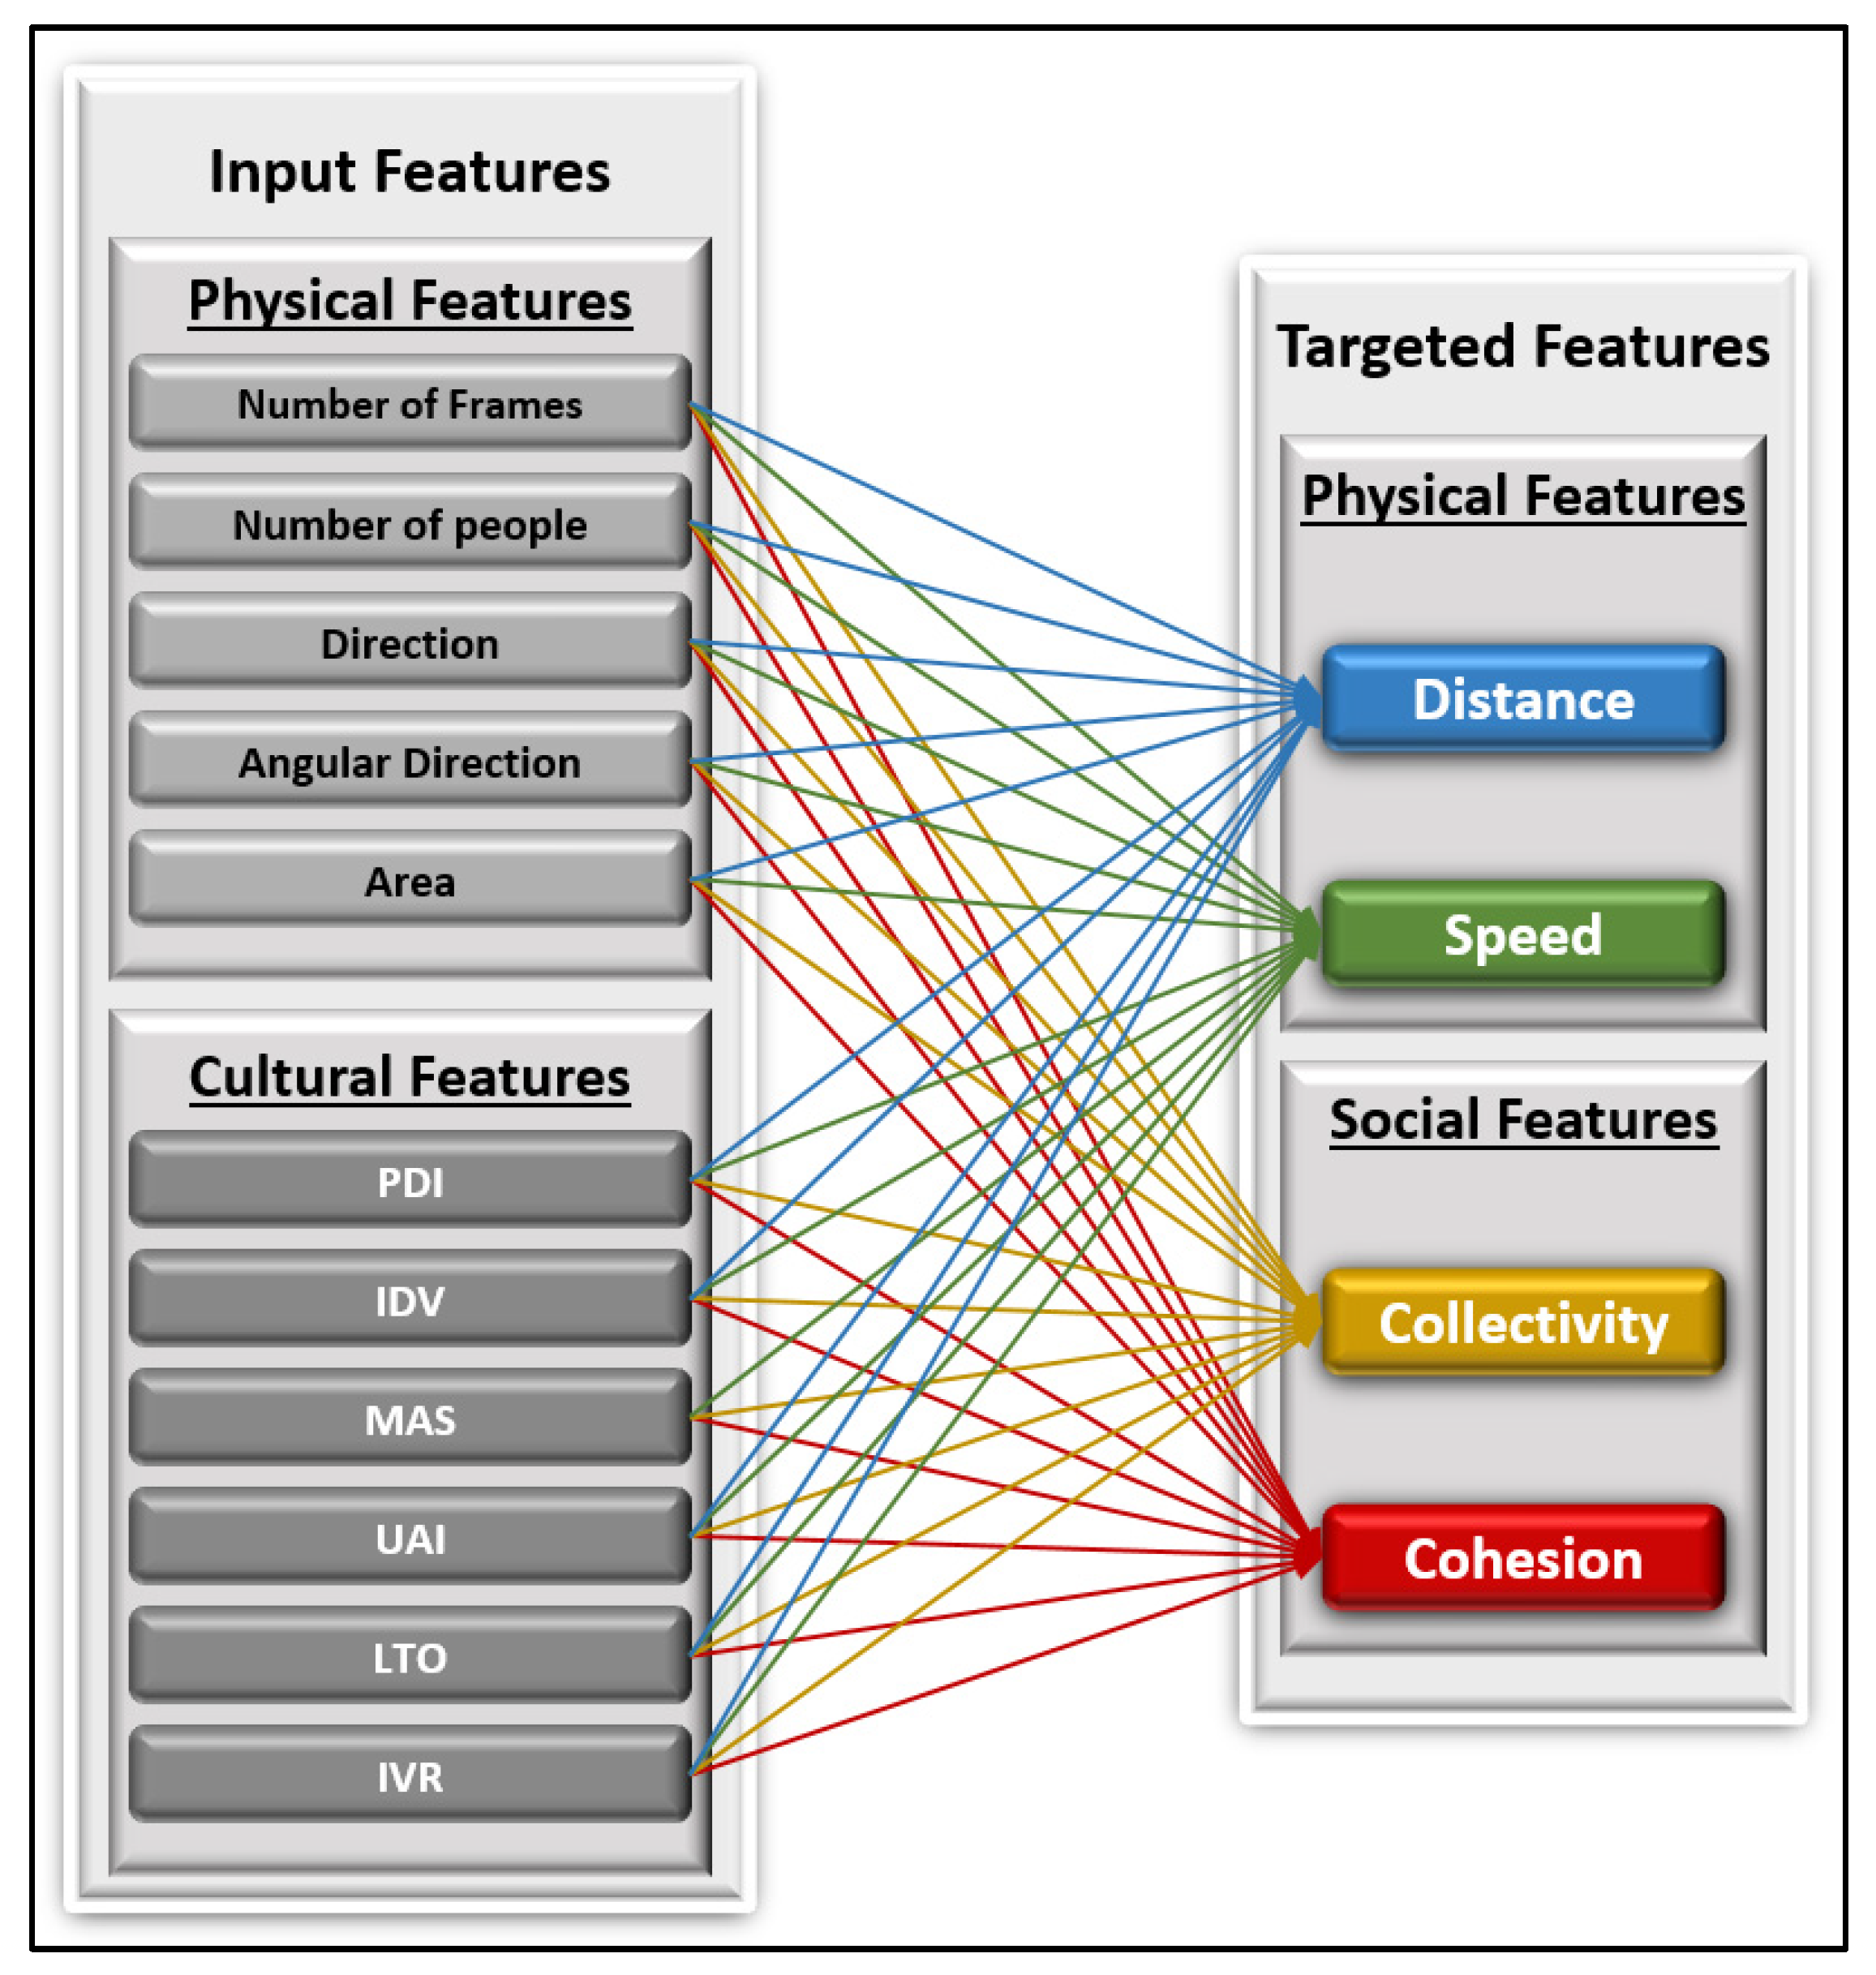
Physical characteristics: speed, distance, number of people, angular variation, area, direction, and number of frames.
Social characteristics: cohesion and collectivity.
Speed is associated with the group’s mean speed.
Distance is proportional to the average distance between group members.
Collectivity denotes the degree to which grouped individuals act as a union [9].
Cohesion specifies the constancy of the group’s relationships [10].
These attributes could be classified into two data types: integers and decimals. The number of people and the number of frames attributes were integers, whereas the rest were decimal values.

2.3. The Dataset

To construct our model, the two previously mentioned datasets, the CC and the HCD datasets, were integrated based on the nation [1]. As mentioned above, the entries for the United Kingdom and Portugal comprised less than three records. Thus, they were considered outliers and excluded. Additionally, the IVR and LTO dimensions were eliminated due to scores for them being unavailable for the UAE. The input and output attributes of the merged dataset were as follows:
  • Input attributes: The four HCDs (PDI, IDV, MAS, and UAI), number of people, angular variation, area, direction, and number of frames. Table 3 shows a statistical analysis of the input attributes.
  • Target attributes: Speed, distance, cohesion, and collectivity.
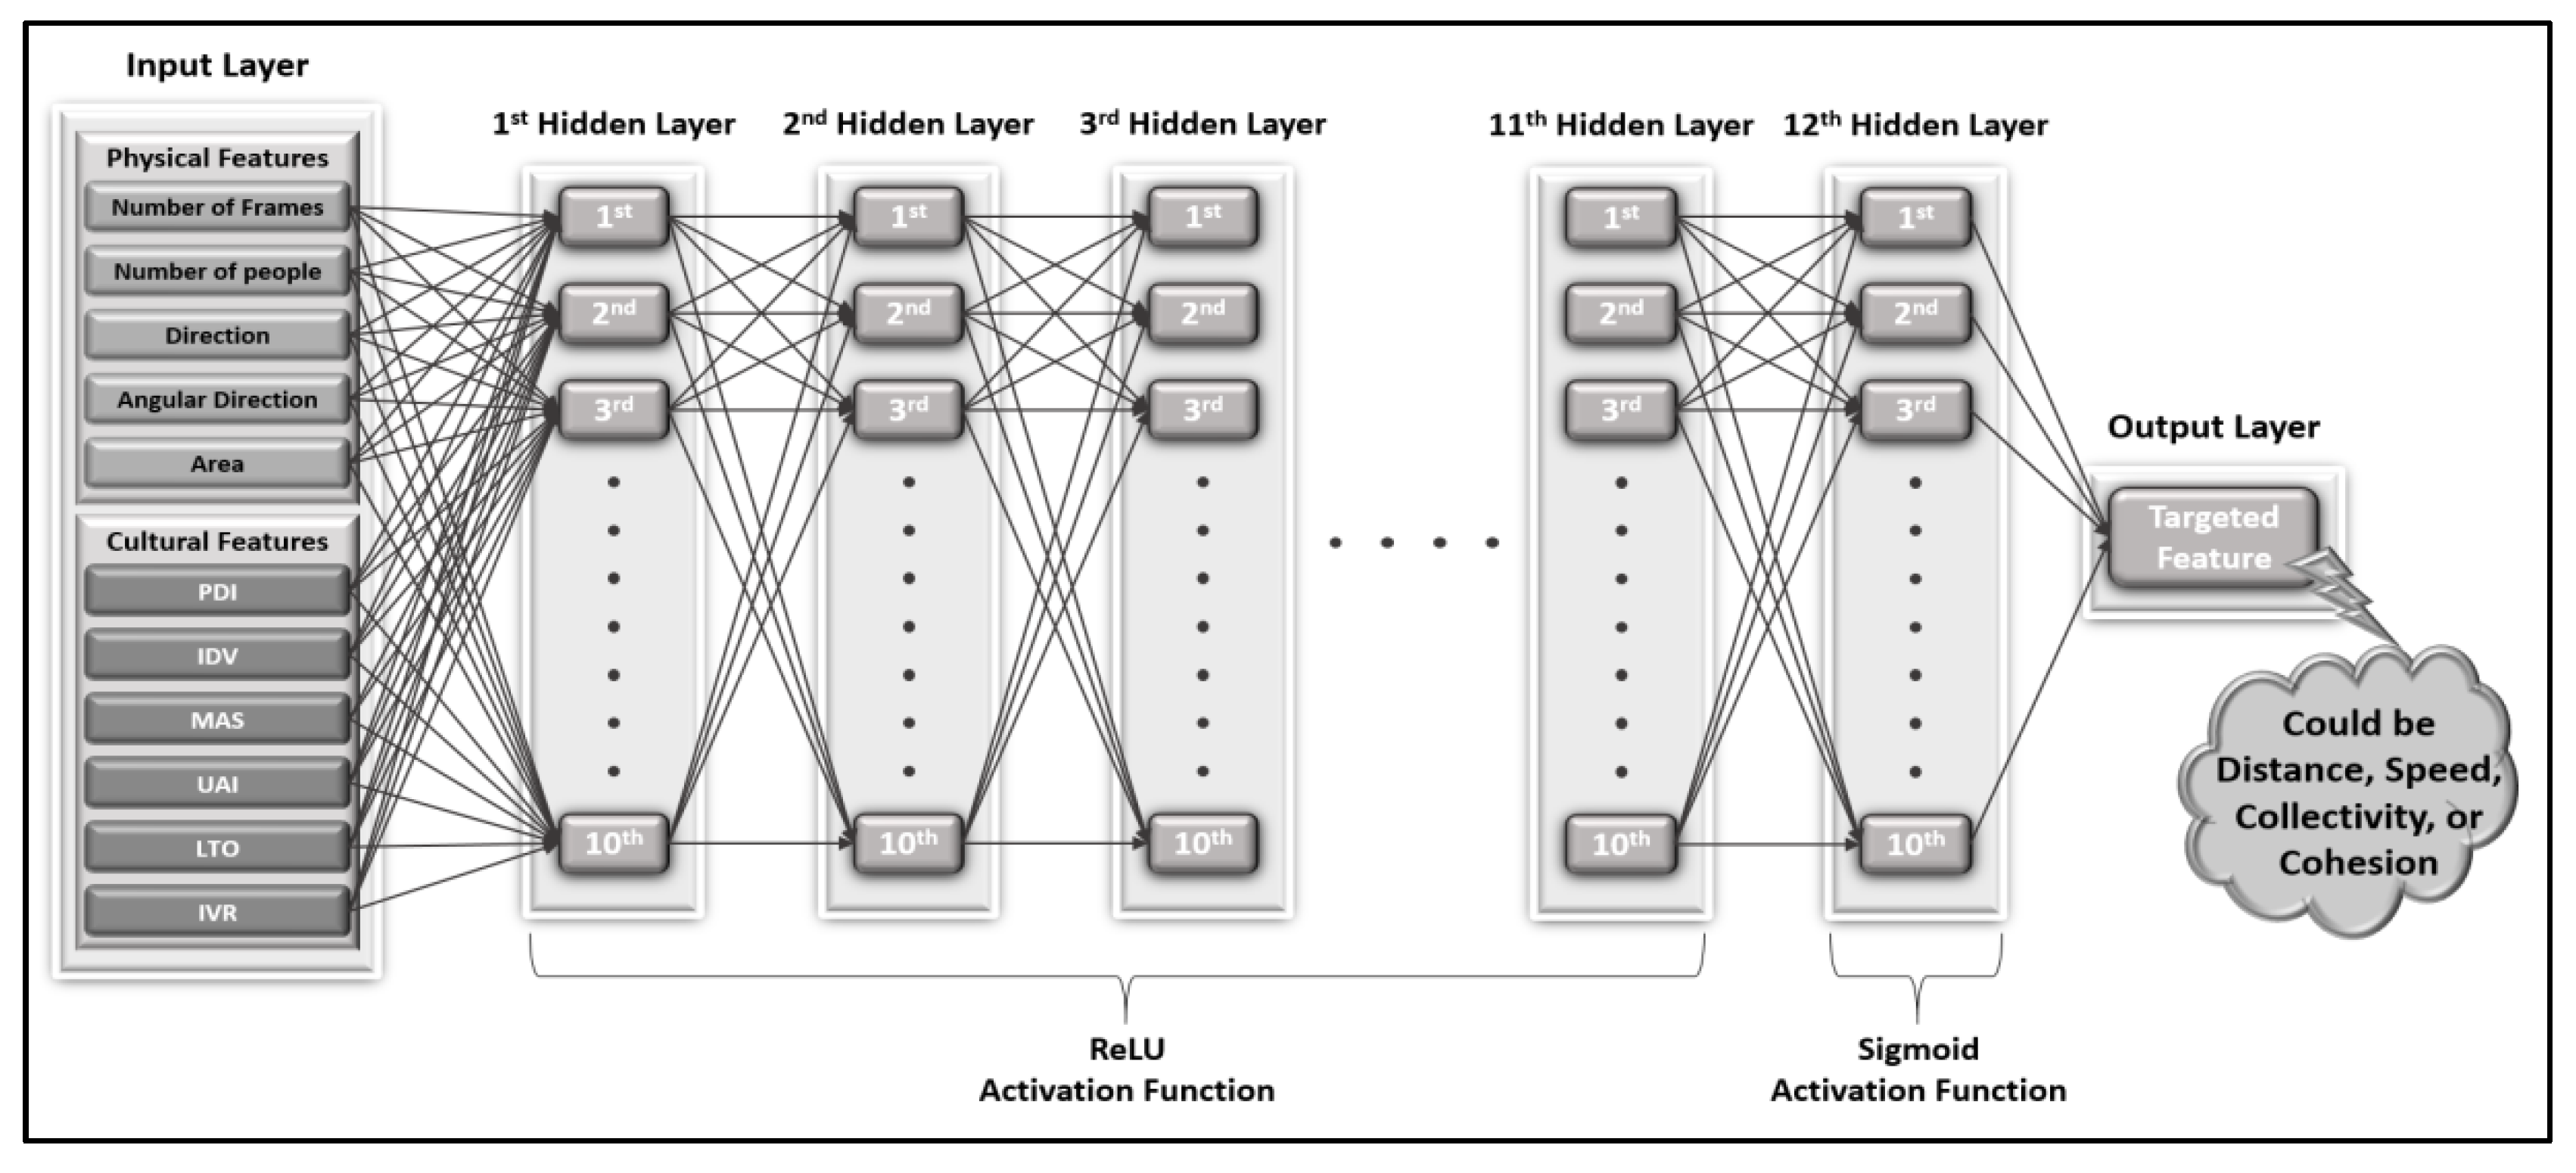
2.4. The ANN Model

As mentioned before, the CC-ANN could be integrated into decision-making tools for cognitive CM systems that would aid the planning of the crowd’s events as strategic decision making. In fact, there are four processes Involved within cognitive models: perception, learning, knowledge acquisition, and memory development. Moreover, the ANN models are suitable to model the cognitive psychology in the four processes, in addition to their capability for high resilience in the case of noisy information. Furthermore, ANN models can classify unknown types. Accordingly, the ANN was applied in the CC learning model covering the three cognitive processes: perception, learning, and knowledge acquisition to achieve cognitivism in the CC-ANN model, as explained in the next section. On the other hand, a memory development cognitive process was not covered due to limited hardware capability and capacity [1].
The learning process of the ANN models is conducted through the comparison between predicted outcomes and actual values. As the backpropagation process iteratively minimizes the estimated error, the weights adjust to improve the parameters of the hidden layers for more accurate predictions. Hyperparameters in ANN models are adjustable during training and can impact the model’s performance, such as the number of neurons in hidden layers. Several approaches could be used to determine the optimal configuration of these hyperparameters, including the grid search method, as described by Kanwar et al. [11]. This method tests all available combinations of hyperparameters to identify the configuration with the minimum mean squared error (MSE) [12]. In our study, we conducted a grid search based on the following hyperparameters:
Number of Epochs: denotes how many times the training algorithm will iterate over the training dataset, both forward and backward, to update the neural network’s parameters.
Batch Size: denotes how many training instances are processed in one epoch.
Optimizer: denotes the algorithm utilized to adjust the weight of each layer after each iteration to minimize the loss function.
Kernel Initialization: denotes the method of initializing the random weights of Keras layers, which affects the model’s performance and convergence rate [13].

2.5. The CC-ANN Learning Model Design

The CC-ANN is a predictive analytics supervised learning model. It utilizes the HCDs of crowds to predict their physical behavior (speed and distance) as well as their social behavior (cohesion and collectivity) [1]. As mentioned before, CC-ANN covers the three cognitive processes: perception, learning, and knowledge acquisition to achieve cognitivism. The perception process was related to feeding the social, physical, and cultural inputs to the CC-ANN model, as shown in Figure 2. The learning process was related to the experiments’ design as illustrated in the experiments section. The knowledge acquisition process was related to analyzing the results and extracting the relationships between the social, physical, and cultural characteristics as illustrated in the results section [1].
CC-ANN model’s design is shown in Figure 2; we applied the CC learning model, including four HCDs, using an ANN [1]. Additionally, the grid search technique was utilized with the previously mentioned hyperparameters to find the best configuration of the ANN as follows:
  • Number of Epochs: 50, 100, and 150.
  • Batch Size: 5, 10, and 20.
  • Optimizer: ‘RMSProp’ and ‘Adam’.
  • Kernel Initialization: glorot uniform, uniform, and normal.
The remaining hyperparameters concerning the number of neurons and hidden layers, bias initialization, weight, and activation functions, were defined via a trial-and-error process. However, the grid search was run for each target attribute individually [1]. The optimal configurations of the hyperparameters with the four included HCDs, on the basis of the lowest MSE, are presented in Table 4. The researchers used identical designs in all the experiments with respect to their target attributes.
The input layer had a varied number of neurons according to the number input features adapted from the HCD dataset to the CC dataset [1]. The presence of only one neuron in the output layer allowed researchers to separately evaluate the target attributes. The CC-ANN comprised 12 hidden layers/10 neurons. The ReLU activation function was applied to the first 11 hidden layers. By contrast, the Sigmoid activation function was applied at the last hidden layer [1]. As the study predicted numerical values directly, the output layer was applied without an activation function. For the evaluation of the CC-ANN model’s performance [1], we used the MSE regression metric in order to determine the variance among the predicted and actual values [12]. That is, comparing CC-ANN’s prediction results to the actual values that were obtained by the GeoMind software, which was used to perform all the analysis during the construction of the Big4GD model and its CC dataset. The CC-ANN [1] was developed using the Keras package and TensorFlow in Python. Keras is an Application Programming Interface (API) of Python used for the construction of fully functional ANN models in deep learning. Its most widely used implementation as a low-level API backend is TensorFlow [13].

3. Experiments

This section describes the experimental design used to investigate the impact of the integration of the UAE within the CC-ANN. Following our methodology, our approach involved the individual prediction of each target attribute, including speed, distance, cohesion, and collectivity. This allowed us to study the impact of the four included HCDs on the CC dataset. Experiments were classified according to whether the four HCDs were fed into the CC input features:
  • The first set of experiments aimed to examine the effect of adding each HCD individually on the ANN’s performance [1]. This set was designed to assess the impact of each HCD on the target attributes and included four experiments.
  • The second set of experiments aimed to examine the effect of adding two HCDs on the ANN’s performance [1]. This set determined the impact of each pair of HCDs (permutation) on the target attributes and included six experiments.
To be precise, we conducted ten experiments, each repeated four times, once for each target attribute. All of the experiments were conducted with and without the UAE. As previously stated, the researchers designed the experiments to assess the influence of cultural dimensions on the prediction of the target attributes related to the social and physical behavior of a crowd. In addition, a 70:30 ratio of the dataset was used as subsets for the training and testing phases, respectively. We conducted a statistical correlation analysis on our dataset to validate the CC-ANN. The purpose of this analysis, which was conducted based on the defined experiments, was to define whether statistically significant relationships existed (where a p-value < 0.05 was considered significant) between the cultural dimensions and the four target attributes [1].

4. Results and Discussion

In essence, the initial part of this section presents the key findings of the experiments that included the UAE, followed by a comparison between the results with the UAE, the current study, and without the UAE, that were included in our previous work [1].

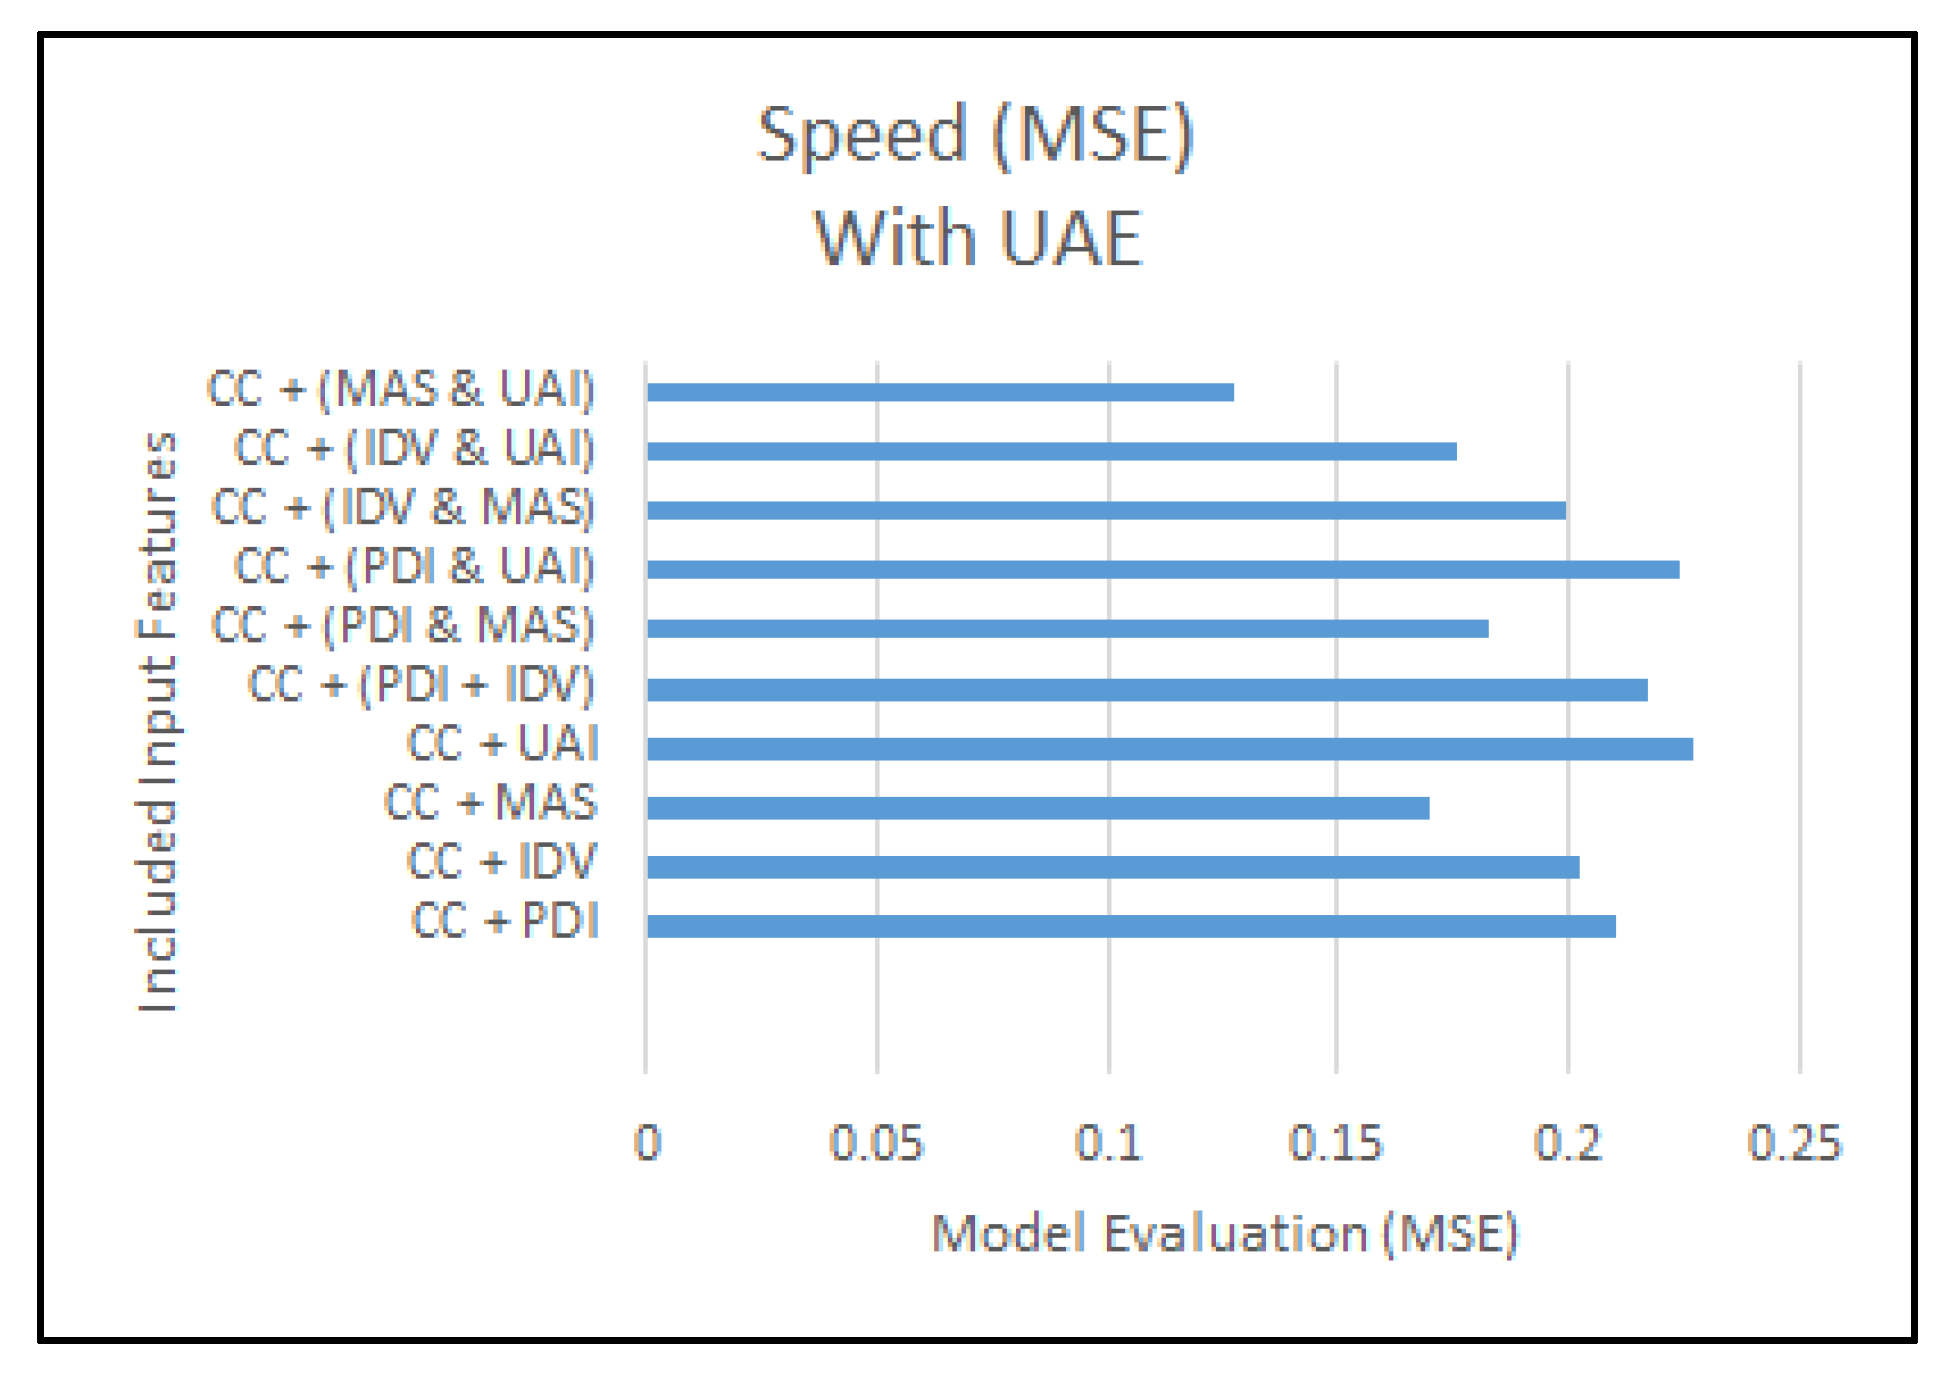
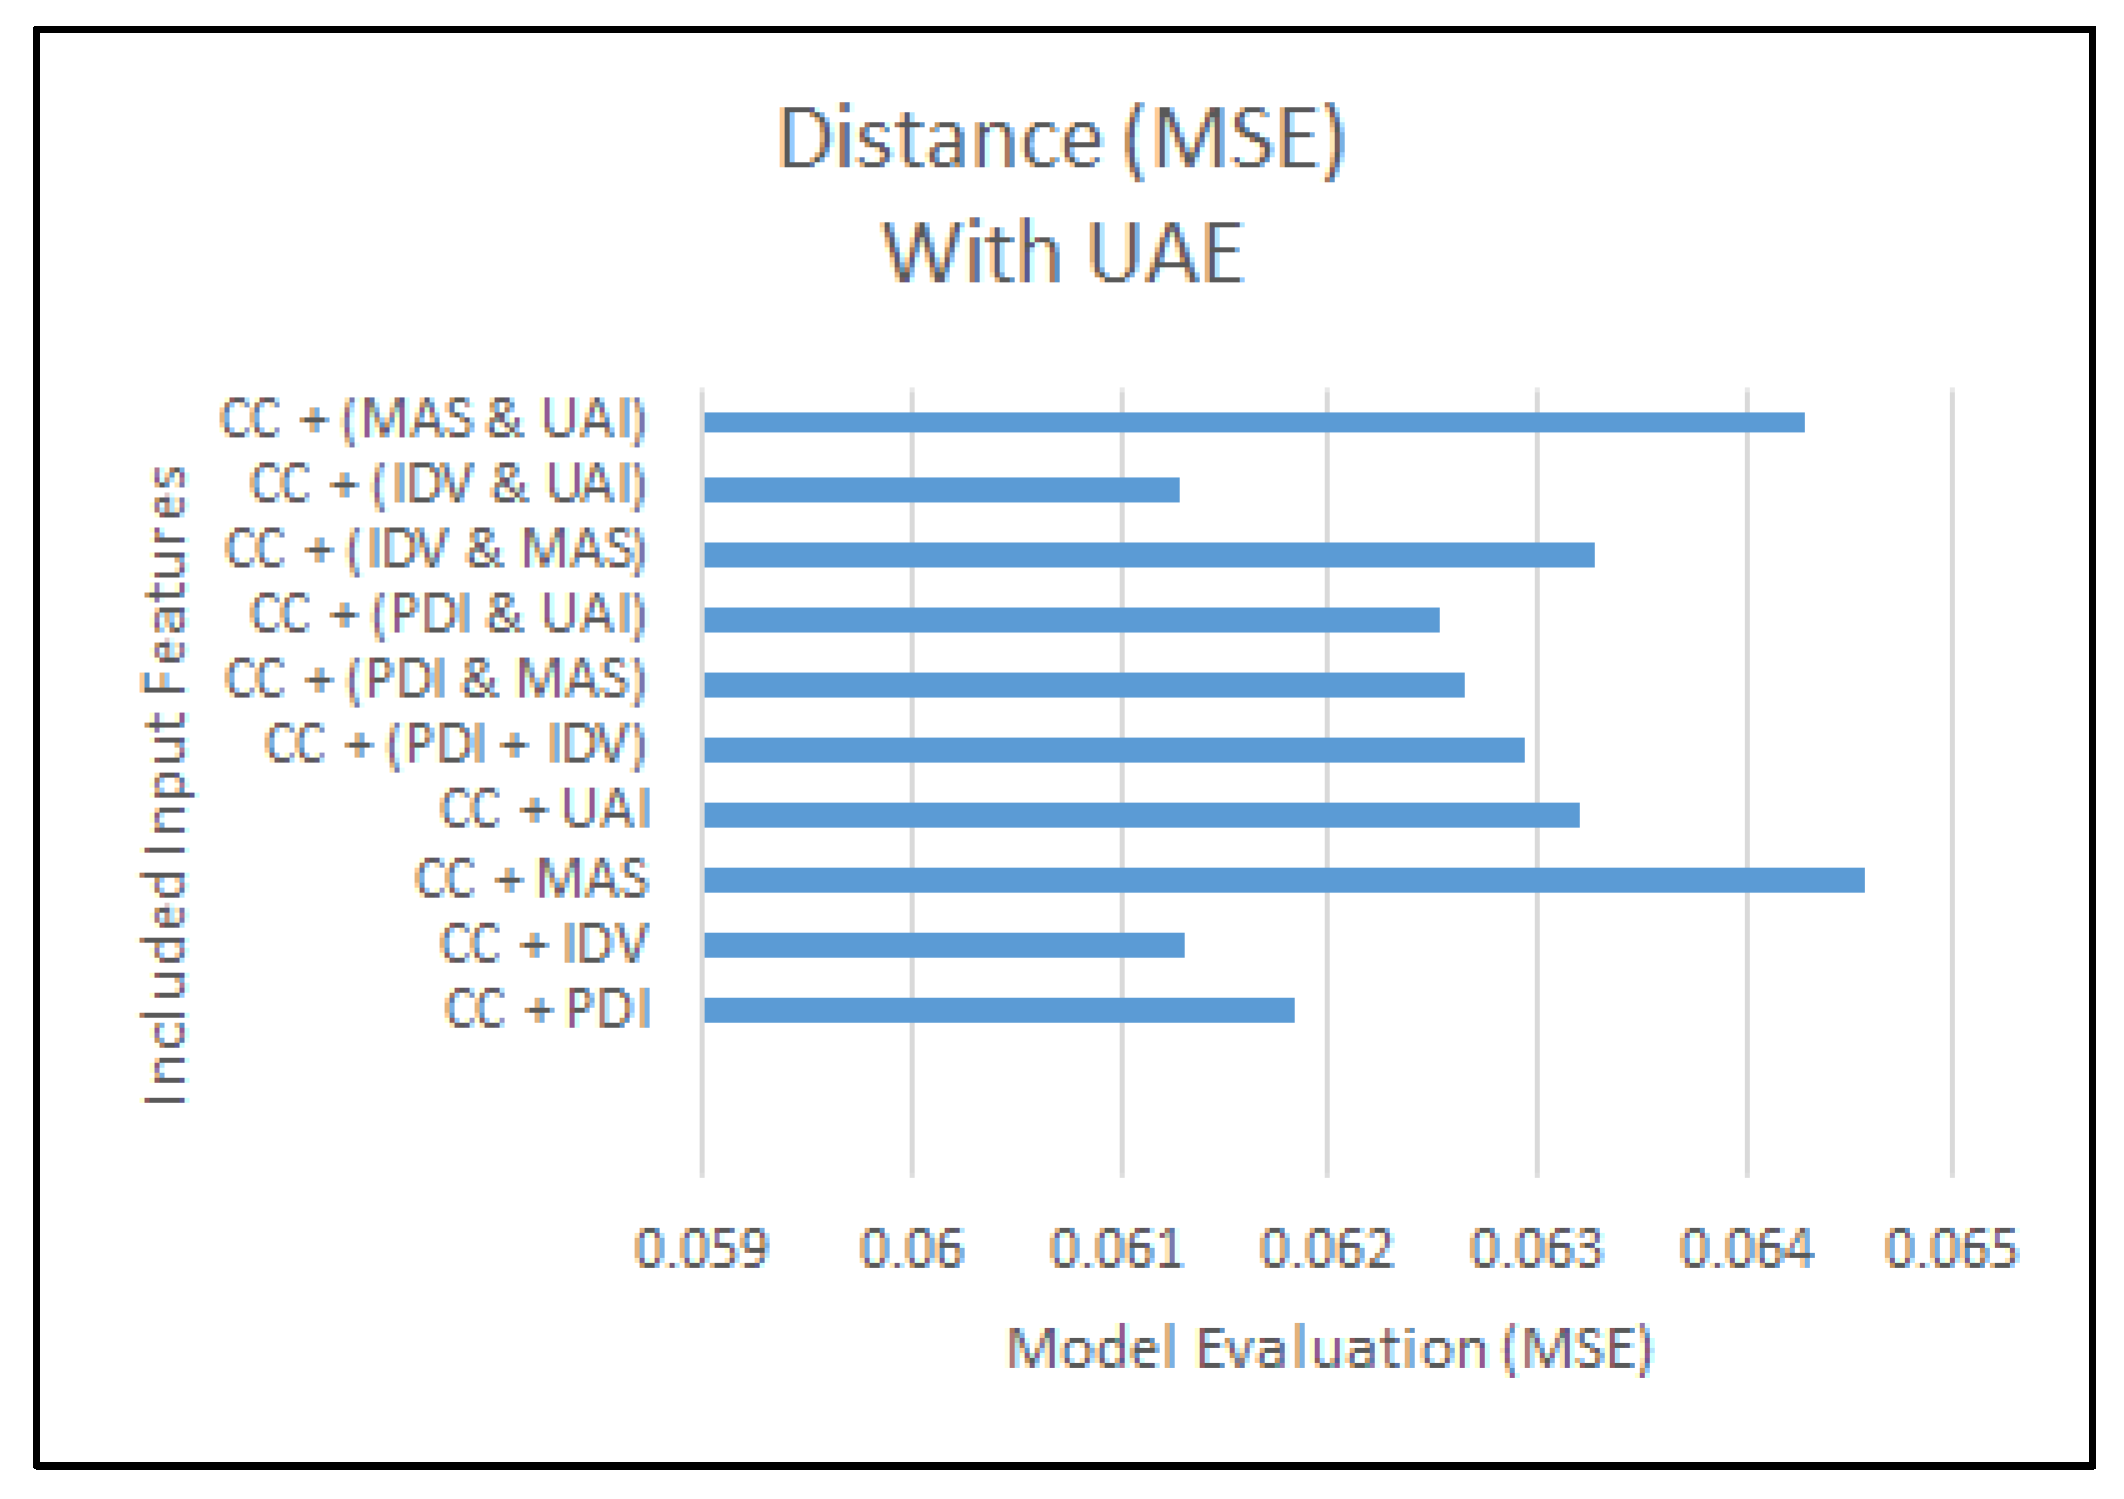
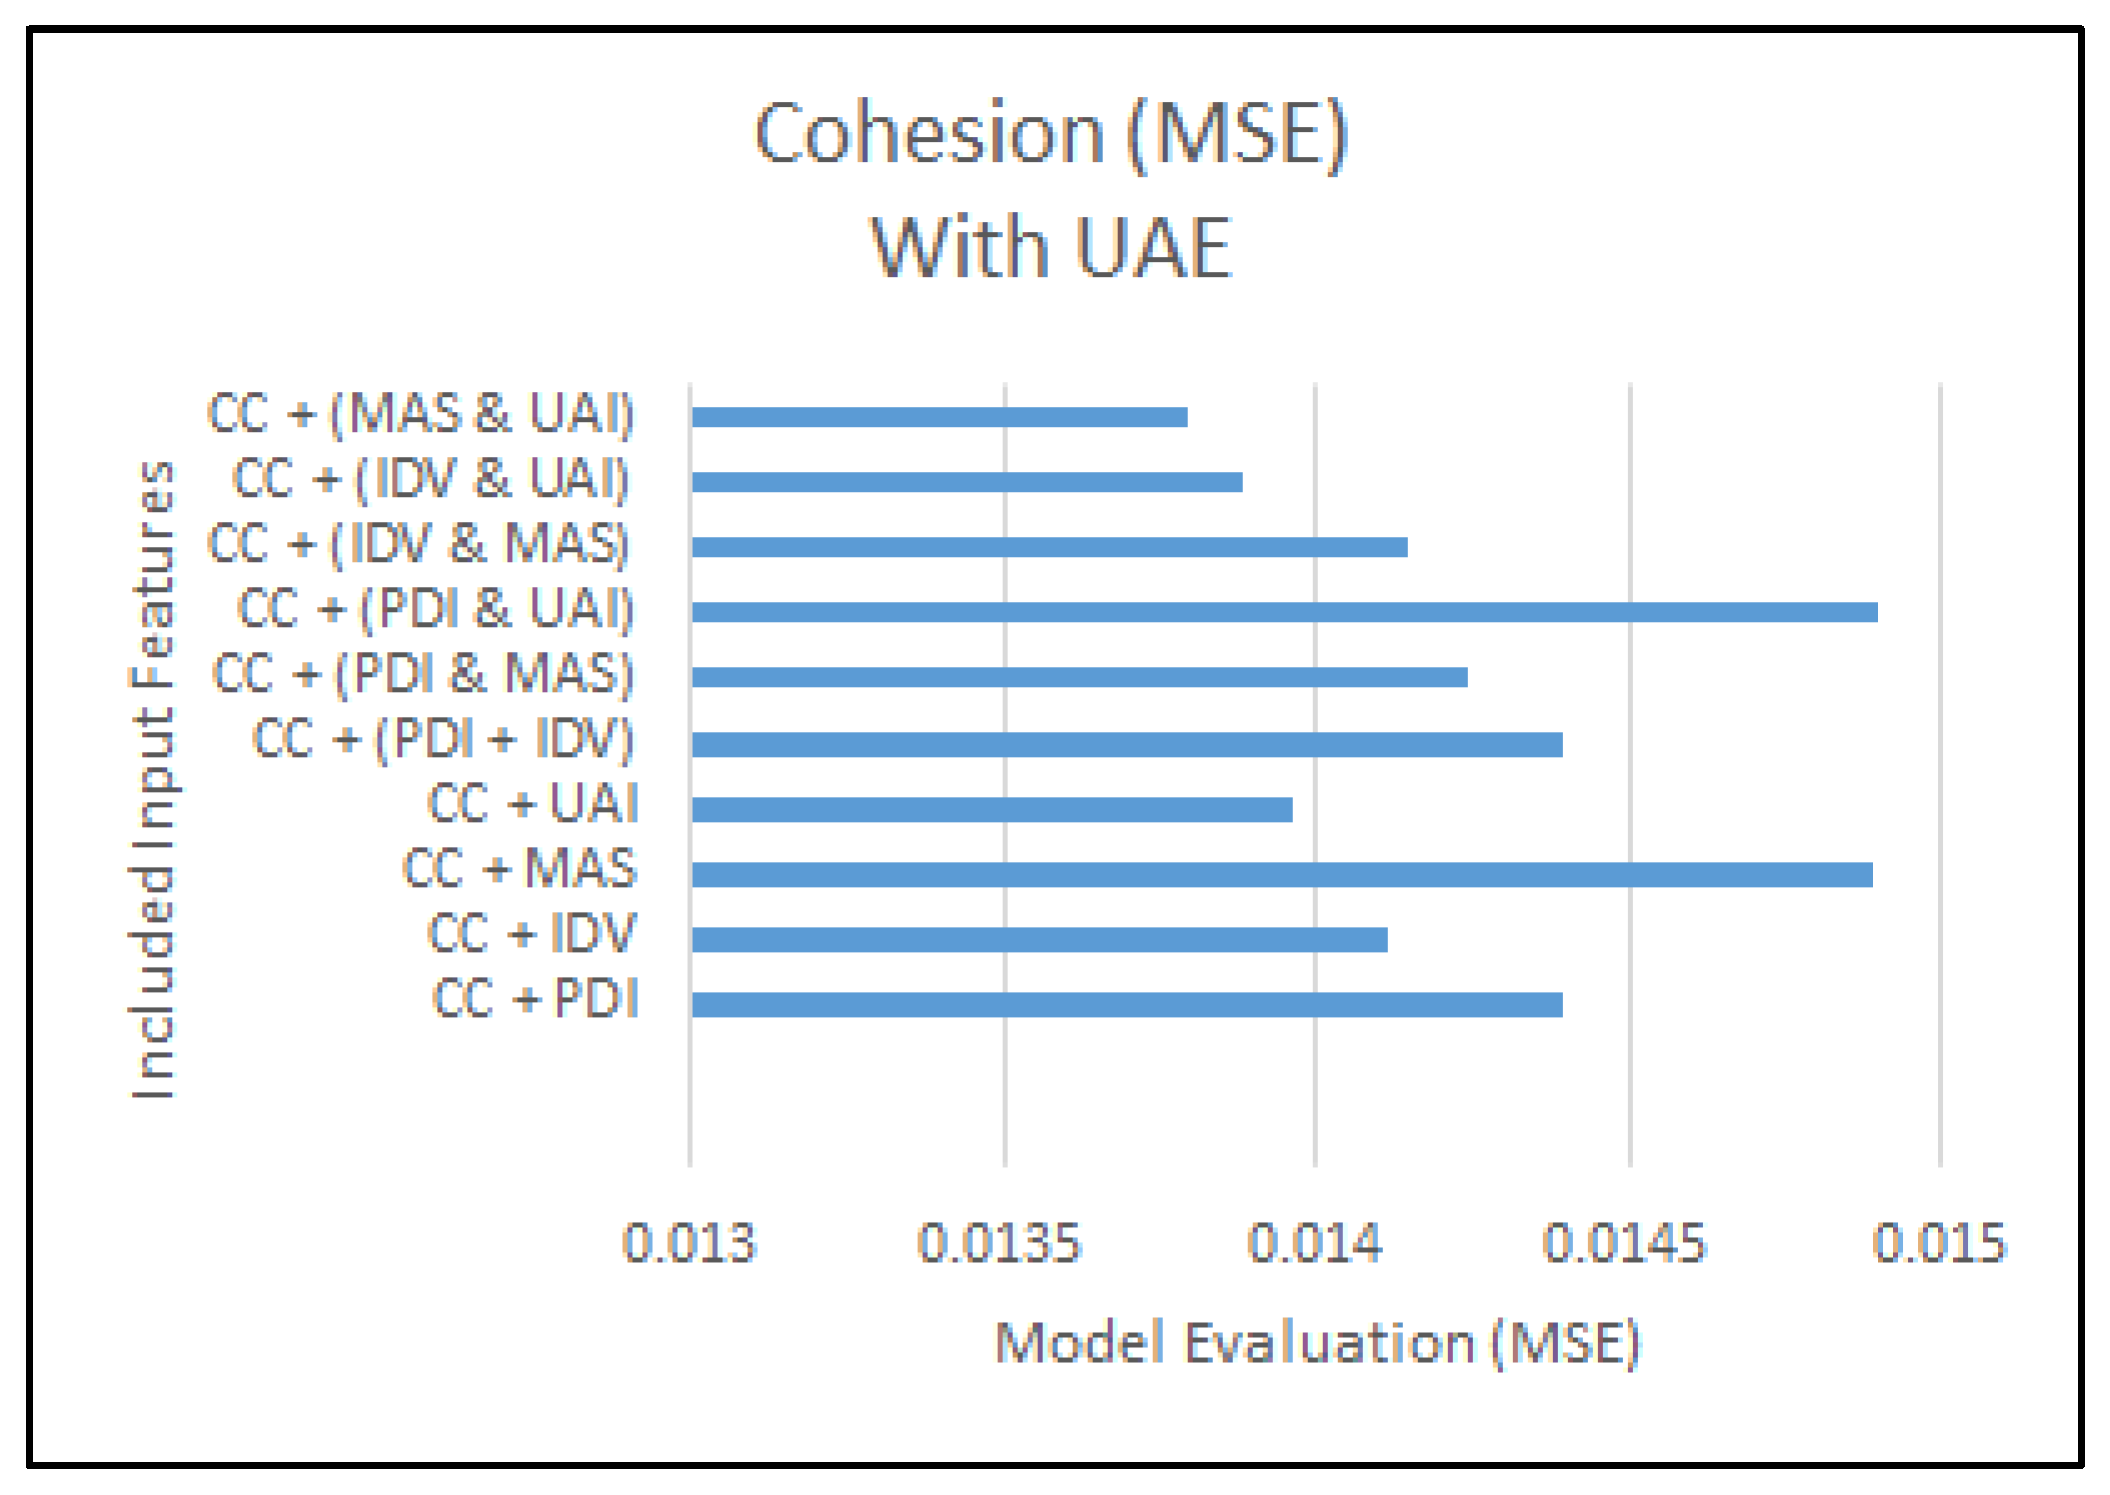
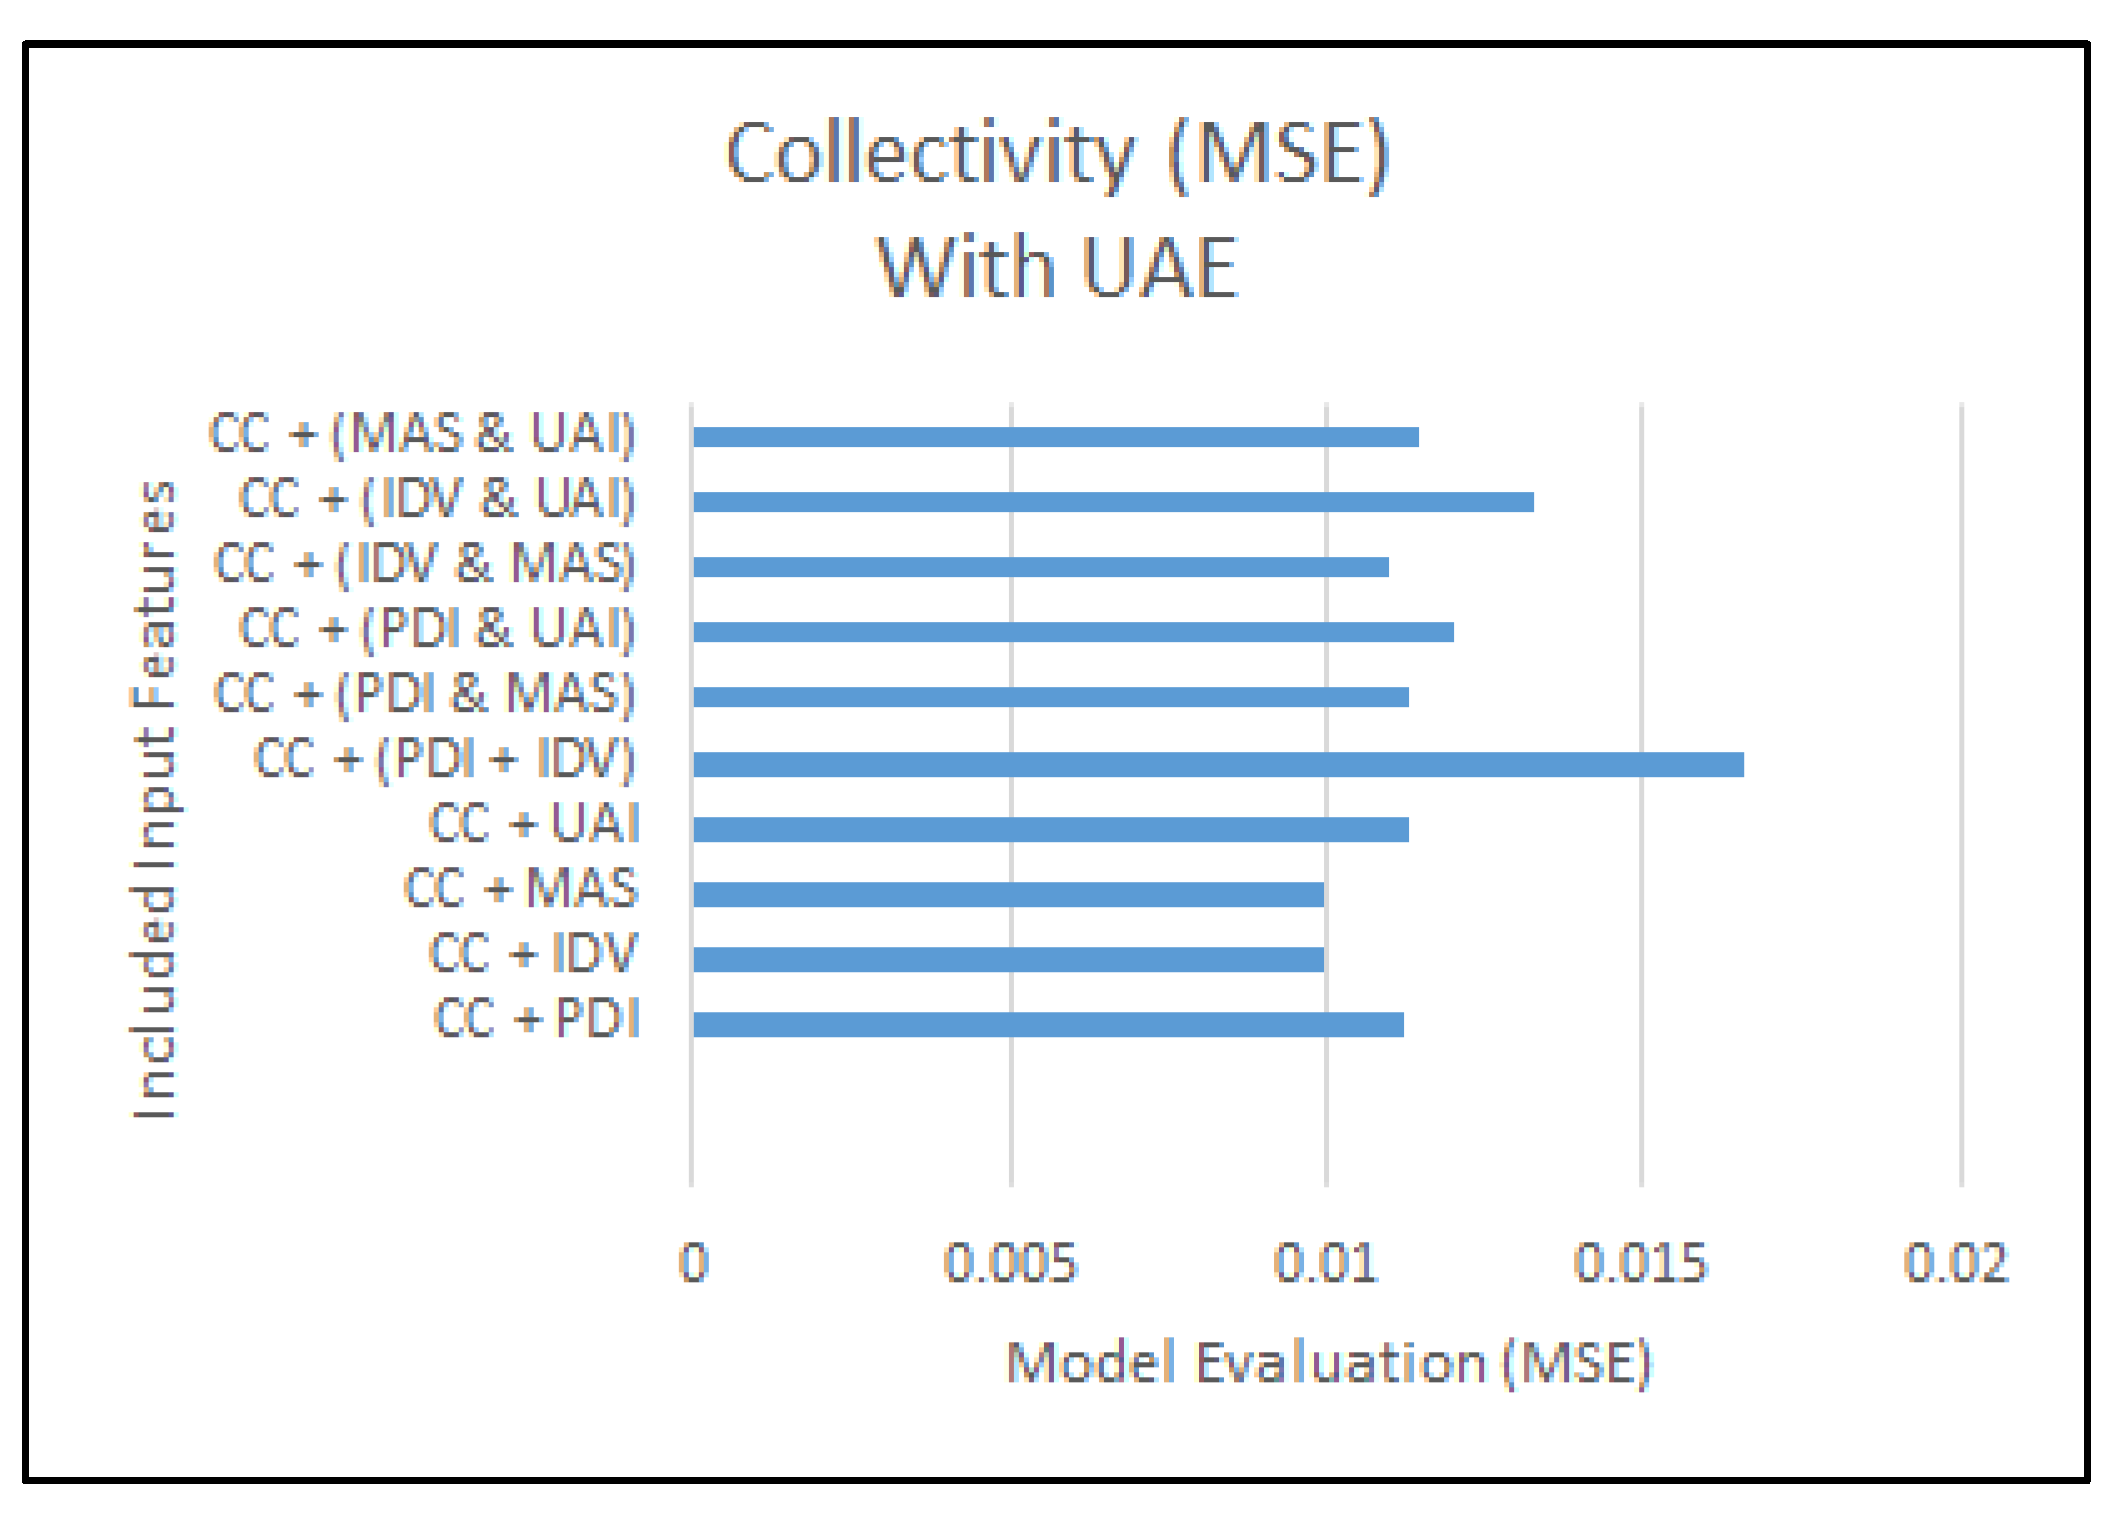
4.1. Experiments Including the UAE

Analyzing the results of the conducted experiments were related to two aspects: the MSE of each experiment and the included HCDs within those experiments. MSE reflects the performance of the CC-ANN in predicting the target attributes. That is, comparing CC-ANN’s prediction results to the actual values that was obtained by the GeoMind software. The included HCDs reflect the relationship between the included cultural dimensions and the target attributes. Table 5 and Figure 3 show the best and worst predictions regarding MSE for each target attribute with respect to the experiments that included the UAE. As stated above, our objective was to examine how HCD features positively or negatively impact target attributes [1]. Consequently, the results analysis aids us in identifying the correlations between HCD features and target attributes, namely speed, distance, cohesion, and collectivity.
Regarding MSE, Table 6 displays the variance between the best and worst scenarios. While the difference may appear small, it can impact the regulatory plans for high-density areas with large crowds. Table 7 exemplifies how this slight variance can influence a regulatory plan for three million individuals. Furthermore, all the designed experiments were statistically significant after analyzing the statistical correlations. It is important to note, however, that not all HCDs were significant in all experiments.
Regarding the speed prediction results, shown in Figure 4, the optimal outcome involved the MAS and UAI dimensions, while the poorest scenario only included the UAI dimension. Therefore, the speed of clustered individuals was linked to the UAI dimension. Consequently, the presence of the UAI dimension negatively affected the model’s ability to predict speed values. Conversely, the model’s speed value prediction capability improved when the MAS dimension was combined with the UAI dimension. Furthermore, as shown in Table 8, the statistical correlation analysis indicated that most speed prediction experiments included at least one statistically significant HCD predictor. Consequently, the speed attribute demonstrated the strongest correlation to HCD compared with the other target attributes.
The distance prediction results presented in Figure 5 showed that the most optimal outcome involved the IDV and UAI dimensions, which improved the model’s distance prediction capability. Conversely, the poorest scenario included the MAS dimension, which negatively impacted the model’s ability in terms of predicting distance values. Furthermore, distance had no statistically significant predictors concerning HCDs in any experiment. Accordingly, the identification of these relationships was essential to our study, as they were not discovered statistically.
In terms of the cohesion prediction results in Figure 6, the most optimal outcome involved the MAS and UAI dimensions, while the poorest scenario included the PDI and UAI dimensions. Therefore, the cohesion of the clustered individuals was correlated with the UAI dimension. Combining the MAS and UAI dimensions improved the ability of the CC-ANN to predict cohesion values. However, combining the PDI and UAI dimensions negatively affected the model’s performance in predicting cohesion values. Furthermore, as shown in Table 9, the statistical correlation analysis indicated that in some cohesion prediction experiments, there was at least one statistically significant HCD predictor present.
According to the collectivity prediction results in Figure 7, the most optimal outcome involved the IDV dimension, while the poorest scenario included the PDI and IDV dimensions. Therefore, the collectivity of the clustered individuals was interrelated with the IDV dimension. However, combining the PDI and IDV dimensions led to confusion in predicting collectivity. Furthermore, collectivity did not have statistically significant predictors concerning HCDs in any experiment. Therefore, the identification of these relationships was essential to our study, as they were not discovered statistically.

4.2. Comparing Experiments (with and without the UAE)

In the final part of this section, the researchers’ comparison of the experiments with and without the UAE is presented. Table 10 presents the best and worst cases in regards to predicting the target attributes among the experiments that did exclude the UAE [1] and were included in the current study. The comparison focused on the following two aspects:
  • The first aspect of the comparison focused on examining the best and worst cases of predicting the four target attributes in terms of MSE, allowing us to determine whether the CC-ANN performed better when the UAE was included or not.
  • The second aspect of the comparison focused on comparing the best and worst cases of predicting the four target attributes in terms of appending HCDs in these cases. This allowed us to demonstrate that applying the CC-ANN to a different nation with a distinct culture, as we did in this study with the UAE, can provide a unique perspective on how cultural backgrounds affect individuals’ behavior in crowds.
Regarding the first comparison case, as presented in Table 11 and Figure 8, most of the best-case experiments that included the UAE tended to have lower MSEs: 0.127, 0.014, and 0.010. Table 12 shows the difference in MSE between the best and worst cases for both experimental groups (with and without the UAE). Accordingly, the negative variance in predicting speed in the best and worst cases, in addition to predicting cohesion and collectivity in the best cases as (−0.00495), (−0.02258), (−0.00020), and (−0.00035), respectively, suggested that including the UAE in those experiments enhanced the CC-ANN model’s ability to predict those target attributes.
The second comparison case found that the best and worst cases were related to appending different HCDs, as shown in Table 11. Conversely, most comparable experiments with and without the UAE had one common cultural dimension, such as the UAI dimension in the best cases of predicting speed and distance and the PDI dimension in the worst cases of predicting cohesion and collectivity. Table 11 displays such dimensions. Furthermore, the MAS dimension was common in the best cases of predicting cohesion. These similarities reflect a strong correlation between these common cultural dimensions and the target attributes.
This implies that applying the CC-ANN to a nation with a different culture and cultural dimensions, such as the UAE in this study, improves the model’s ability to predict the social and physical behavior of a crowd by gaining more knowledge about different cultures. Moreover, it provides a different perspective on the influence of cultural background on individuals’ behavior in crowds.
In fact, within cross-cultural crowds, the relationship between culture and the extent to which cultural dimensions influence crowd behavior varies. In fact, adding different cultures will carry with them different influences on the behavior of their people as crowds. That is, the cultural dimensions will differ in their impact on the behavior of the individuals as crowds. The success of the model does not mean that the results are identical whenever we add a new culture. On the contrary, it is about catching the difference. The difference in results after adding the UAE nation to the study was expected in the first place. The UAE is a different culture, and the difference was not only related to the different scores of the HCDs but also to the values of the other CC inputs. The combination of these inputs is what creates the difference. Because we do not deal with crowds as fluid, but with human beings, who are composite of different backgrounds, and we are trying to understand them more on a micro level. Therefore, more studies and research are needed in future works to cover more countries and cultures.

5. Conclusions

Our prior research led to the development of the CC-ANN learning model, which uses the HCDs to forecast a crowd’s physical behavior, speed and distance, and social behavior, cohesion, and collectivity, while also taking into account the crowd’s cultural background. Due to the absence of the LTO and IVR dimensions, the UAE was left out of the prior analysis. We incorporated the UAE into the CC-ANN for this investigation, but we left out the scores for two HCDs (LTO and IVR) because they were not available. In order to compare the outcomes of our tests with those that did not include the UAE, we used four HCDs (PDI, IDV, MAS, and UAI). All the experiments were evaluated using MSE, and to study the relationships between the cultural background of a crowd and the social and physical behavior of its grouped members, the experiment designs were split into two categories.
To learn more about potential behavioral differences between culturally diverse groups of people within crowds, in this study, we set out to investigate the effects of using the CC-ANN in various cultures in various countries with varying cultural dimensions, such as the UAE. The goal was also to learn more about how particular cultural traits might affect how crowd behavior is perceived. The best and worst cases of predicting the four target attributes with and without the UAE in terms of MSE, as well as the appended HCD in those cases, were taken into consideration for comparison. This was carried out to determine whether adapting the CC-ANN to a different country with a different culture could result in a unique result.
The UAE was included in most of the best-case trials for the forecasting of speed, cohesiveness, and collectivity. These experiments had the lowest MSEs: 0.127, 0.014, and 0.010, respectively. The negative variance implied that integrating the UAE in those tests improved the CC-ANN model’s capacity to predict certain targeted features, depending on the difference between the best and worst situations for both experimental groups, with and without the UAE. In contrast, the majority of comparable studies (both with and without the UAE) shared a single cultural component, such as the UAI dimension in the best cases for predicting speed and distance and the PDI dimension in the worst cases for predicting cohesion and collectivity. Additionally, the best cases of the prediction of cohesiveness frequently shared the MAS dimension. These parallels show a strong relationship between the intended qualities and these shared cultural aspects. The CC-ANN model’s application to a country with a distinct culture offered a fresh viewpoint on the influence of cultural factors on people’s behavior in crowds. This emphasizes the important role that an individual’s cultural background plays in influencing their social and physical behavior in a crowd. Additionally, it highlights the requirement for additional CC-ANN investigations across a range of nations and cultures. These investigations can also aid in identifying connections between the social, physical, and cultural traits of a group.
The major limitation, as mentioned before in our previous work [1], is the lack of CC similar and related works and resources. Consequently, we were not able to compare our work with other similar works. Moreover, there is a lack of datasets with more countries and cultures that could be used to conduct more experiments for developing the CC-ANN learning model. Additionally, we could not provide a memory development cognitive process due to the limited hardware capability and capacity. When more CC related resources are available for each country or culture, further work should be undertaken to study each country separately, where the extracted relationships will be defined more specifically for its culture. In addition, we may be able to classify countries with similar cultures into groups according to similar extracted relationships and study them as one group. Accordingly, we will be able to classify cultures into groups to obtain and extract more stable relationships between their culture and their behavior as crowds. Furthermore, a comprehensive insight into the extracted relationships and results could be provided in future work by including sociologists and psychologists. Therefore, additional experiments would be required to be able to analyze the effect of increasing or decreasing HCD scores on predicting crowd behavior for a specific culture or group of cultures. On the other hand, using a new country, which was not used in the training phase, for testing would be useful to demonstrate the extent strength of the CC-ANN learning model in predicting crowd behavior. In addition, the model should be developed in future studies by considering diverse datasets, which will give us the availability to compare our work with others and improve its credibility. Furthermore, developing the CC-ANN learning model requires additional countries, cultural factors, and big data. Thus, we might improve the model with different crowd scenarios, types, events, and densities. Finally, to improve the CC-ANN model’s cognitivism we need to adapt the Internet of Things technologies and a memory development process.

Author Contributions

Methodology, implementation, validation, analysis, investigation, writing—original draft preparation, and writing—review and editing, F.J.M., O.A.A. and F.A.B. All authors have read and agreed to the published version of the manuscript.

Funding

This research received no external funding.

Data Availability Statement

The data used to support the findings of this study are available from the corresponding author.

Conflicts of Interest

The authors declare no conflict of interest.

References

  1. Baothman, F.A.; Abulnaja, O.A.; Muhdher, F.J. A Novel Cultural Crowd Model toward Cognitive Artificial Intelligence. Comput. Mater. Contin. 2021, 69, 3337–3363. [Google Scholar] [CrossRef]
  2. Country Comparison—Hofstede Insights. Available online: https://www.hofstede-insights.com/country-comparison/ (accessed on 14 March 2023).
  3. The Dimension Scores in the Hofstede Model of National Culture Can Be Downloaded Here. Available online: https://geerthofstede.com/research-and-vsm/dimension-data-matrix/ (accessed on 14 March 2023).
  4. Favaretto, R.M.; Musse, S.R.; Costa, A.B. Detecting Hofstede Cultural Dimensions. In Emotion, Personality and Cultural Aspects in Crowds; Springer: Cham, Switzerland, 2019; pp. 93–103. [Google Scholar] [CrossRef]
  5. Hofstede, G. Dimensionalizing Cultures: The Hofstede Model in Context. Online Read. Psychol. Cult. 2011, 2, 1–26. [Google Scholar] [CrossRef]
  6. Balawi, A. Entrepreneurship ecosystem in the United Arab Emirates: An empirical comparison with Qatar and Saudi Arabia. Int. Entrep. Rev. 2021, 7, 55–66. [Google Scholar] [CrossRef]
  7. Hofstede, G.; Hofstede, G. Culture’s Consequences: Comparing Values, Behaviors, Institutions and Organizations across Nations; Sage Publications: Thousand Oaks, CA, USA, 2001. [Google Scholar]
  8. Favaretto, R.M.; Dihl, L.; Barreto, R.; Musse, S.R. Using group behaviors to detect Hofstede cultural dimensions. In Proceedings of the 2016 IEEE International Conference on Image Processing (ICIP), Phoenix, AZ, USA, 25–28 September 2016; pp. 2936–2940. [Google Scholar] [CrossRef]
  9. Zhou, B.; Tang, X.; Zhang, H.; Wang, X. Measuring crowd collectiveness. IEEE Trans. Pattern Anal. Mach. Intell. 2014, 36, 1586–1599. [Google Scholar] [CrossRef] [PubMed]
  10. Bassi, B. Computer Simulation of Crowd Dynamics and Destructive Crowd Behavior. Ph.D. Thesis, University of Connecticut, Storrs, CT, USA, 2006. [Google Scholar]
  11. Kanwar, N.; Goswami, A.K.; Mishra, S.P. Design Issues in Artificial Neural Network (ANN). In Proceedings of the 2019 4th International Conference on Internet of Things: Smart Innovation and Usages (IoT-SIU), Ghaziabad, India, 18–19 April 2019; pp. 1–4. [Google Scholar] [CrossRef]
  12. Fürnkranz, J.; Chan, P.K.; Craw, S.; Sammut, C.; Uther, W.; Ratnaparkhi, A.; Jin, X.; Han, J.; Yang, Y.; Morik, K.; et al. Mean Squared Error. In Encyclopedia of Machine Learning; Springer: New York, NY, USA, 2011; p. 653. [Google Scholar] [CrossRef]
  13. Ketkar, N. Introduction to Keras. In Deep Learning with Python; Apress: Berkeley, CA, USA, 2017; pp. 97–111. [Google Scholar] [CrossRef]
Figure 1. Cultural Crowds (CC) learning model [1].
Computers 12 00108 g001
Figure 2. The design of the Cultural Crowd–Artificial Neural Network (CC-ANN) learning model [1].
Computers 12 00108 g002
Figure 3. Best/worst cases of predicting the target attributes (Mean Squared Error (MSE)) (with the UAE).
Computers 12 00108 g003
Figure 4. Predicting speed (MSE) (with the UAE).
Computers 12 00108 g004
Figure 5. Predicting distance (MSE) (with the UAE).
Computers 12 00108 g005
Figure 6. Predicting cohesion (MSE) (with the UAE).
Computers 12 00108 g006
Figure 7. Predicting collectivity (MSE) (with the UAE).
Computers 12 00108 g007
Figure 8. Best/worst cases of predicting the target attributes (with and without the UAE).
Computers 12 00108 g008
Table 1. Definitions of the four Hofstede Cultural Dimensions (HCDs).
HCDDefinition
Power Distance (PDI)Related to the acceptable degree of distributing power through society.
Large PDI: Indicates accepting that power distribution and privileges are hierarchical and unequal.
Low PDI: Reflects striving to have equal rights as opposed to privileges.
Individualism (IDV)Concerns the identities of individuals.
High IDV: Characterizes individualist societies, in which the sense of “I” is strong, and the identity of individuals is independent of others.
Low IDV: Characterizes collectivist societies, in which the sense of “we” is strong, and individuals are practically and psychologically dependent on interpersonal and group interactions.
Masculinity (MAS)Reveals social issues.
High MAS: Indicates masculine societies in which social status and personal accomplishment are prioritized over material success.
Low MAS: Indicates feminine societies which emphasize modesty, assistance, care for the weak, and life’s quality. Society as a whole is increasingly consensus oriented.
Uncertainty Avoidance (UAI)Indicates the acceptance of uncertainty.
High UAI: Indicates a preference for structure and predictability governed by both written and unwritten rules.
Low UAI: Highlights the normality of uncertainty in addition to having a more laid-back attitude in which practice trumps principles.
Table 2. The four HCD scores related to the nations that comprised the current work.
NationPDIIDVMASUAI
Austria11557970
China80206630
France68714386
Brazil69384976
Japan54469592
Germany35676665
Spain57514286
Turkey66374585
United Arab Emirates90255080
Table 3. A Statistical Analysis of the input attributes.
Statistical
Analysis
PDIIDVMASUAINumber of PeopleAngular
Variation
AreaDirectionNumber of Frames
Mean62.4040.7857.7071.662.410.461.57181.43118.91
Mode69.0038.0049.0076.002.00N/A1.48N/A37.00
MAX90.0071.0095.0092.006.001.135.37355.85638.00
Q157.0037.0049.0070.002.000.270.80106.5650.00
Median69.0038.0049.0076.002.000.401.34174.2691.00
Q369.0048.5066.0085.003.000.622.44249.86147.00
MIN11.0020.0042.0030.002.000.110.1918.6214.00
Range79.0051.0053.0062.004.001.025.19337.23624.00
Variance387.10196.71233.40336.270.550.061.026993.919679.61
std.19.6714.0315.2818.340.740.251.0183.6398.39
Table 4. The optimal configurations (Mean Squared Error (MSE)) of the CC_ANN hyperparameters based on a grid search with the four included HCDs.
Attributes/ParameterSpeedDistanceCohesionCollectivity
Epochs15050150150
Batch520105
Optimizerrmsproprmsproprmspropadam
Kernel Initializationnormalnormalnormalnormal
Loss (MSE)0.1250.0610.0140.009
Table 5. Best/worst cases of predicting the target attributes (with the United Arab Emirates (UAE)).
Target AttributeBest CaseWorst Case
Included HCDsMSEIncluded HCDsMSE
SpeedMAS and UAI0.127UAI0.227
DistanceIDV and UAI0.061MAS0.065
CohesionMAS and UAI0.014PDI and UAI0.015
CollectivityIDV0.010PDI and IDV0.017
Table 6. Variance in MSEs among the best and worst predictions (with the UAE).
Speed RangeDistance RangeCohesion RangeCollectivity Range
0.1000.0030.0010.007
Table 7. Variance in MSEs among the best and worst predictions regarding a crowd of 3 million individuals (with the UAE).
Target AttributeBest MSEWorst MSEThe Difference (MSE)
Speed382,249.31681,081.79298,832.48
Distance183,862.56193,700.989838.42
Cohesion41,391.3544,690.763299.41
Collectivity29,916.9549,696.9219,779.97
Table 8. Statistically significant predictors (HCDs) concerning speed target attribute (with the UAE).
Included HCDsSignificant HCDsIncluded HCDsSignificant HCDs
IDVIDVPDI and UAIUAI
MASMASIDV and MASIDV, MAS
UAIUAIIDV and UAIUAI
PDI and IDVPDI, IDVMAS and UAIMAS, UAI
PDI and MASPDI, MAS
Table 9. Statistically significant predictors (HCDs) concerning cohesion target attribute (with the UAE).
Included HCDsSignificant HCDs
UAIUAI
PDI and UAIUAI
Table 10. Best/worst cases of predicting the target attributes (without the UAE).
Target AttributeBest CaseWorst Case
Included HCDsMSEIncluded HCDsMSE
SpeedIDV and UAI0.132IDV0.250
DistanceMAS and UAI0.049IDV and UAI0.053
CohesionMAS and UAI0.010PDI and UAI0.011
CollectivityIDV0.010PDI and IDV0.017
Table 11. Best/worst cases of predicting the target attributes (with and without the UAE).
Target AttributeWith/Without
UAE
Best CaseWorst Case
Included HCDsMSEIncluded HCDsMSE
SpeedWith UAEMAS and UAI0.12742UAI0.22703
Without UAEIDV and UAI0.13237IDV0.24961
DistanceWith UAEIDV and UAI0.06129MAS0.06457
Without UAEMAS and UAI0.04864IDV and UAI0.05256
CohesionWith UAEMAS and UAI0.01380PDI and UAI0.01490
Without UAEIDV and MAS0.01400PDI and MAS0.01469
CollectivityWith UAEIDV0.00997PDI and IDV0.01657
Without UAEMAS and UAI0.01032PDI and UAI0.01100
Table 12. Variance of MSEs among the best/worst cases (with and without the UAE).
Target AttributeBest CaseWorst Case
Speed−0.00495−0.02258
Distance0.012650.01201
Cohesion−0.000200.00020
Collectivity−0.000350.00556
Disclaimer/Publisher’s Note: The statements, opinions and data contained in all publications are solely those of the individual author(s) and contributor(s) and not of MDPI and/or the editor(s). MDPI and/or the editor(s) disclaim responsibility for any injury to people or property resulting from any ideas, methods, instructions or products referred to in the content.

