1. Introduction
Street life and pedestrian activities are of major interest for smart-city planning. Having up-to-date data about pedestrian mobility in cities has traditionally been difficult. City planners are open to incorporating automatic perception systems to better understand human and traffic mobility within the city. Pedestrian detection has been historically obtained through video-processing algorithms that process footage captured by video cameras; however, low-light conditions and privacy concerns are known limitations of this technology.
Current state-of-the-art solutions for pedestrian detection and behavior make use of data acquired by LiDAR technology, which does not have the same above-mentioned limitations. The cost of this technology has dropped and is currently regarded as a key sensing element of Intelligent Transport System (ITS) infrastructures. LiDAR sensors transmit multiple laser beams (each in a different vertical angle), sweeping a particular horizontal field of view. The amount and granularity of the sweep is specific to each LiDAR sensor. When one laser beam hits an object and is reflected back to the LiDAR sensor, based on how long it takes the light to return to the sensor, it is possible to measure the distance to a reflected object. By acquiring reflections in different horizontal and vertical angles, it is possible to compute a three-dimensional scan of an observed area. These scans are commonly referred as “point clouds” and, with proper object recognition algorithms and sufficient training, it is possible to identify and classify different types of objects (pedestrians, bicycles, cars, etc.), depending on their distance and pose with respect to the LiDAR sensor.
The major difficulty in dealing with point clouds is the sheer volume of data they contain. For example, an entry-level sensor with 16 laser beams will typically generate between 300,000 and 600,000 points per second (in a 360° sweep) and may generate throughputs close to 40 Mbit/s, depending on its configuration (single/dual return mode). This poses a computational and network transmission challenge that can be minimized when placing a capable computing unit and the LiDAR sensor in close network proximity. This approach limits LiDAR data to traversing a single- or few-layer three-network segments, and follows the multi-access edge-computing paradigm, where large volumes of data are processed at the edge of the network (where the sensors are). Hence, smart-city applications are not required to process these data; they can simply query for a particular data insight already extracted by the edge-computing unit. There are a few features required for a suitable edge-computing unit to process LiDAR data, where high performance per watt, weight and compact form-factor may have different influence in the selection process. They should also be capable of running different applications of deep neural networks (DNNs) trained on high-performance GPUs. At the current time, support for CUDA, the parallel-computing platform and programming model developed by NVIDIA, is also welcome, since object detection and recognition/classification benefits from running in multiple GPU cores in parallel.
The remainder of this paper is organized as follows:
Section 2 describes the state of the art and related works.
Section 3 describes the material and methods for the system architecture.
Section 4 presents the achieved experimental results and, finally,
Section 5 presents the conclusions and future work.
2. State of the Art
Object detection, tracking and recognition are key challenges in computer vision for both the industry and academia. These methods have been widely used with 2D images; however, systems based on 2D images cannot provide accurate 3D location information. On the other hand, 3D systems such as RGB-D (RGB-Depth), RGB-LiDAR and LiDAR can only provide solutions that significantly improve RGB-only approaches. In [
1], the object classification/detection systems theory based on 2D/3D images are presented as a survey to better understand the key differences in both approaches.
Digitization and the emergence of new types of sensors, computing and communications technologies have boosted the development of projects that make cities smarter and in permanent communication with those who inhabit them. The scientific and commercial advances that have emerged in the area of autonomous driving make 3D object detection an increasingly necessary area and with great evolution potential, specifically due to advances in deep-learning architectures, but also to LiDAR sensors. Although this work focuses on object detection in a smart-city context, the main technological advances in this area are in fact due to autonomous driving. Several research works, focused on the detection of objects based on LiDAR technology, have been written in recent years. In [
2], a survey of 3D object-detection methods, based on LiDAR, is presented and the performance achieved by each method is discussed. In [
3], the PointRCNN method was proposed for the detection of 3D objects in the raw point cloud without the need for RGB images. The method works in two steps, first segmenting the point-cloud scene into foreground and background points, and then refining the proposal into the canonical coordinates to obtain the final detection results. The authors used the KITTI dataset [
4] to validate the architecture, considering only the point cloud as input. The same authors extended PointRCNN to a new point cloud-based 3D object-detection framework, later described in [
5]. The performance improvements of each component of the initial proposal were demonstrated, and a new state of the art was achieved in the KITTI 3D object-detection dataset using only the LiDAR point-cloud data.
LiDAR has proved to be an extremely useful sensor in 3D object-detection scenarios; however, due to the variation of the density of the points along the distance caused by the angular displacements between the LiDAR lasers, it has an inherent limitation. Thus, objects located at greater distances return fewer points than objects located closer to LiDAR sensor. The density of acquired points is directly related to the successful detection of an object. Smaller objects, or objects farther away from the sensor have less surface area to cross the LiDAR laser beams, which affects detection efficiency. To mitigate these problems, the authors in [
6] propose the voxel network with the point-density recognition (PDS) method, taking advantage of the location of the voxel point centroid and feature encodings that directly account for the density of points in the detection of multiclass 3D objects. This limitation is also addressed in [
7], where the authors propose a method that fuses point clouds and RGB images to build a 3D object-detection architecture to improve detection accuracy of small objects represented by point clouds. The proposed architecture uses key points to successfully combine point-based, voxel-based and image-based methods. In this way, complementary fusion of the geometric information collected by LiDAR and semantic information collected by the camera is performed.
Deep-learning approaches have also significantly contributed to recent advances in 3D object detection. The authors in [
8] perform a review of recent progress in state-of-the-art deep-learning methods for 3D understanding, including 3D shape classification, 3D object detection and tracking, and 3D scene and object segmentation. In [
9], a hybrid 2D and 3D Hough net is proposed that combines 3D and 2D local Hough features with a classification deep-learning network for 3D object classification in LiDAR point clouds.
It is also important to note that the characteristics of LiDAR point clouds, such as unstructured distribution, disordered arrangement, and large amounts of data, typically result in high computational complexity and make it very difficult to classify 3D objects. In [
10], the authors propose a convolutional neural network (CNN)-based 3D object classification method using the Hough space of LiDAR point clouds to overcome these problems. First, object point clouds are transformed into Hough space using a Hough transform algorithm, and then the Hough space is rasterized into a series of uniformly sized grids. The authors in [
11] introduce a common object-detection pipeline and taxonomy to facilitate a thorough comparison between different techniques and, departing from it, critically examine the representation of data, feature extraction and finally object-detection models. A comparison between the performance results of the different models is included, alongside some future research challenges.
In summary, most of the existing 3D object-detection methods based on point-cloud representation are mainly divided into two categories—LiDAR with image fusion and LiDAR-only methods. For LiDAR-only methods, they are divided into voxel-based methods or point-based methods. Both approaches have their advantages and disadvantages; it depends on the type of application. LiDAR provides a more accurate 3D geometry structure, and the camera captures more scene context and semantic information. The fusion of the two types of data can provide more contextualized information, but everything will depend on the processing capacity available and what is required to be analyzed. The authors in [
12] present a comprehensive survey of deep learning on LiDAR-only and LiDAR-fusion 3D perception tasks. This paper gives a review according to four key tasks in the field of LiDAR-based perception: object classification, object detection, object tracking, and segmentation.
For 3D object detection based on multiple sensors, LiDAR and cameras, multi-view 3D object-detection network (MV3D) [
13], F-PointNet (Frustum PointNet) [
14], and MMF [
15] stand out, among others. Focusing on LiDAR-only, the methods can be grouped in point-based plus voxel-based, such as PV-RCNN (PointVoxel-RCNN) [
16], voxel-based where VoxelNet is included [
17], SECOND [
18], PointPillars [
19], Part-A2 [
5] and Point-based, where PointRCNN is included [
3], and STD [
20], among others. The following section describes the methodology and the methods used in the implementation of a pedestrian-detection system in a real scenario context, through edge computing, inserted in an architecture of a smart city that includes other sensors and other mechanisms for city monitoring.
3. Materials and Methods
This section describes the methodology followed by the implementation of a pedestrian-detection solution based on point clouds acquired in real time from a LiDAR sensor.
3.1. System Architecture
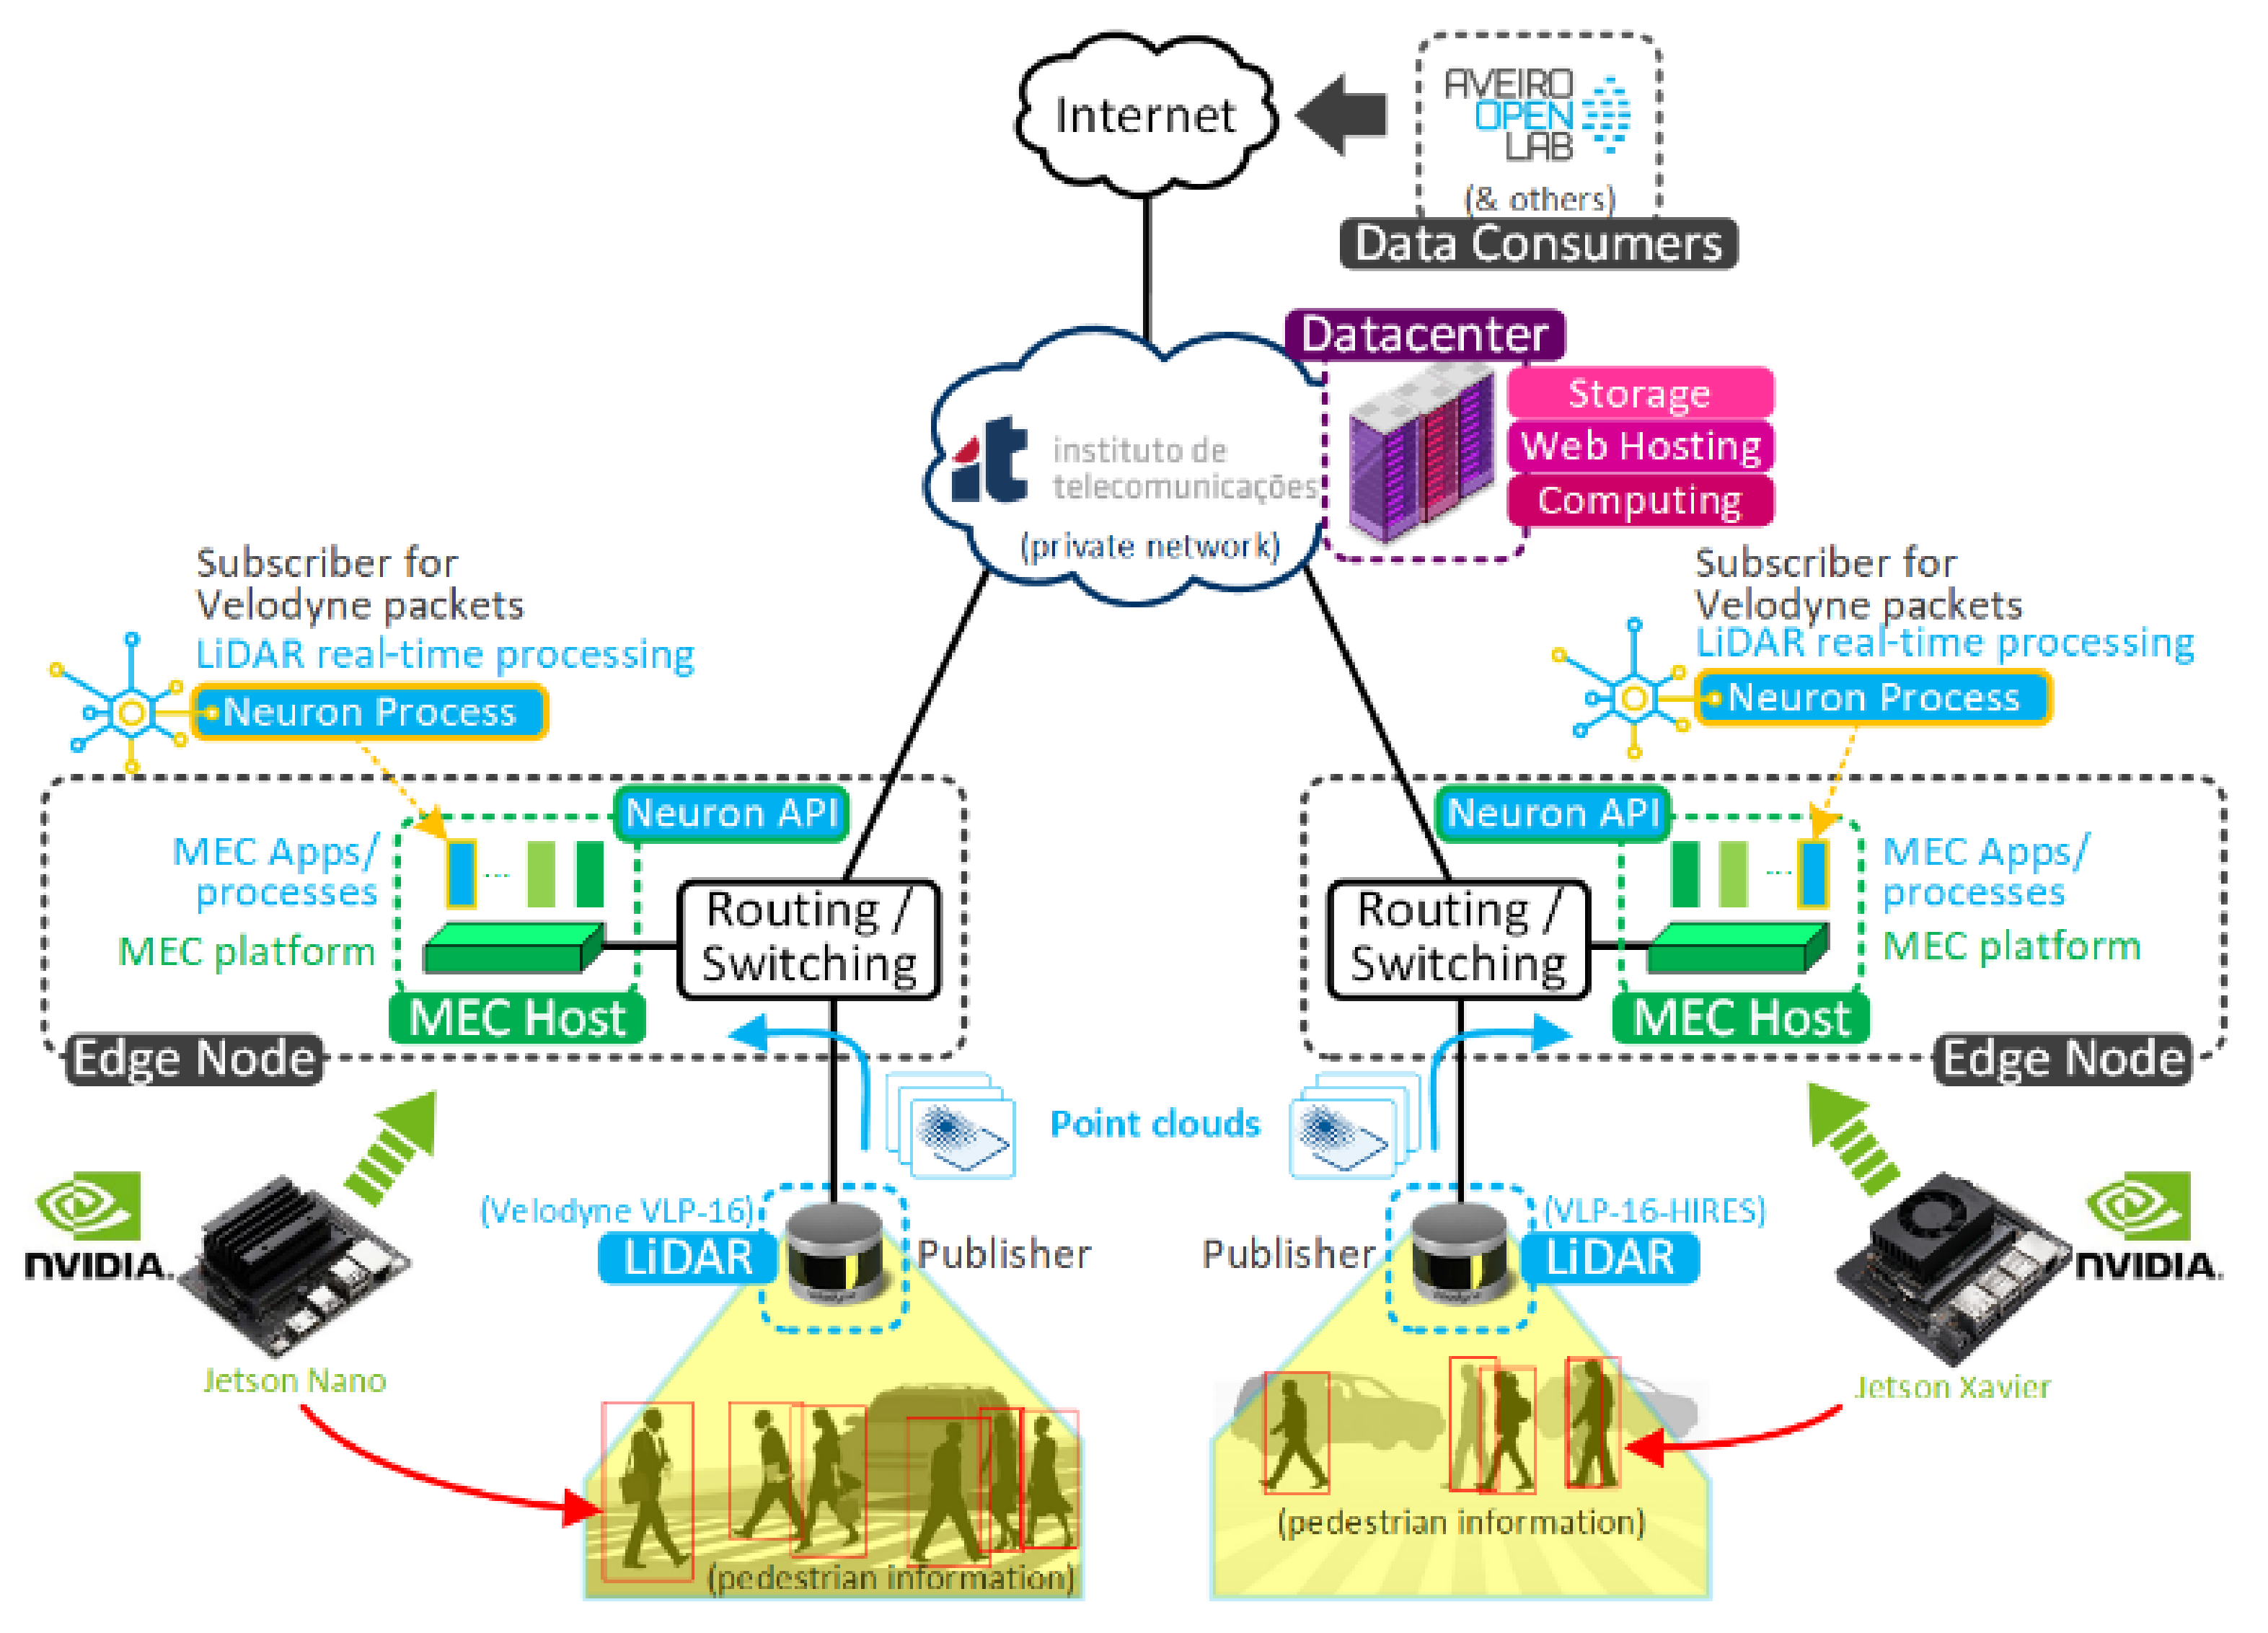
The high-level system architecture of the deployed system is depicted in
Figure 1. Each LiDAR sensor, placed in strategic locations in the city (pre-identified by the municipality as areas of interest, given traffic and pedestrian volume at crosswalks, close to the University of Aveiro), sends point clouds to an edge node, composed of an NVIDIA Jetson Nano or Jetson Xavier. Each edge node runs a mobile edge-computing (MEC) application “Neuron process”, developed over ROS Melodic [
21] distribution on Ubuntu 18.04, which is the edge application responsible for pedestrian detection based on the received point clouds. Each edge node also exposes, via the “Neuron API”, the information of each pedestrian detected via Message Queuing Telemetry Transport (MQTT). The real-time data can, therefore, exist on a central database accessed by the city’s monitoring dashboards, available online and in open access.
Briefly, LiDAR sensors capture point clouds and send them to the edge nodes for real-time processing. The edge nodes use a dedicated process (Neuron) to detect pedestrians and retrieve associated information (location, speed, direction, etc.). These results are made available to third-party applications (data consumers) through a dedicated API (the Neuron API). Additional information on the Neuron API is provided in
Section 3.5. The Aveiro Tech City Living Lab [
22] is the city platform consuming and exposing these results to third-party applications. It is composed of an advanced communications infrastructure and an urban platform for data management and innovative analytics that, together, provide an open and large-scale technology laboratory in the city at the service of researchers, digital industries, start-ups, scaleups, R & D centers and other stakeholders interested in developing, testing or demonstrating concepts, products or services.
3.2. Hardware
Implementation relied on already pre-acquired hardware (LiDAR sensors and edge nodes) by the Aveiro Tech City Living Lab. The reasons for the selected hardware resulted from an equilibrium between hardware capabilities, hardware availability and investment in a pilot project. The LiDAR sensors used were the Velodyne Puck (VLP-16) and Velodyne Puck Hi-Res (VLP-16-HIRES); their main relevant characteristics can be seen in
Table 1:
The edge-computing nodes (MEC Hosts) are the NVIDIA Jetson Nano and Jetson Xavier NX. Their main relevant characteristics can be seen in
Table 2:
The Jetson Xavier NX was a later addition to the setup and was only integrated at the final steps of the pilot.
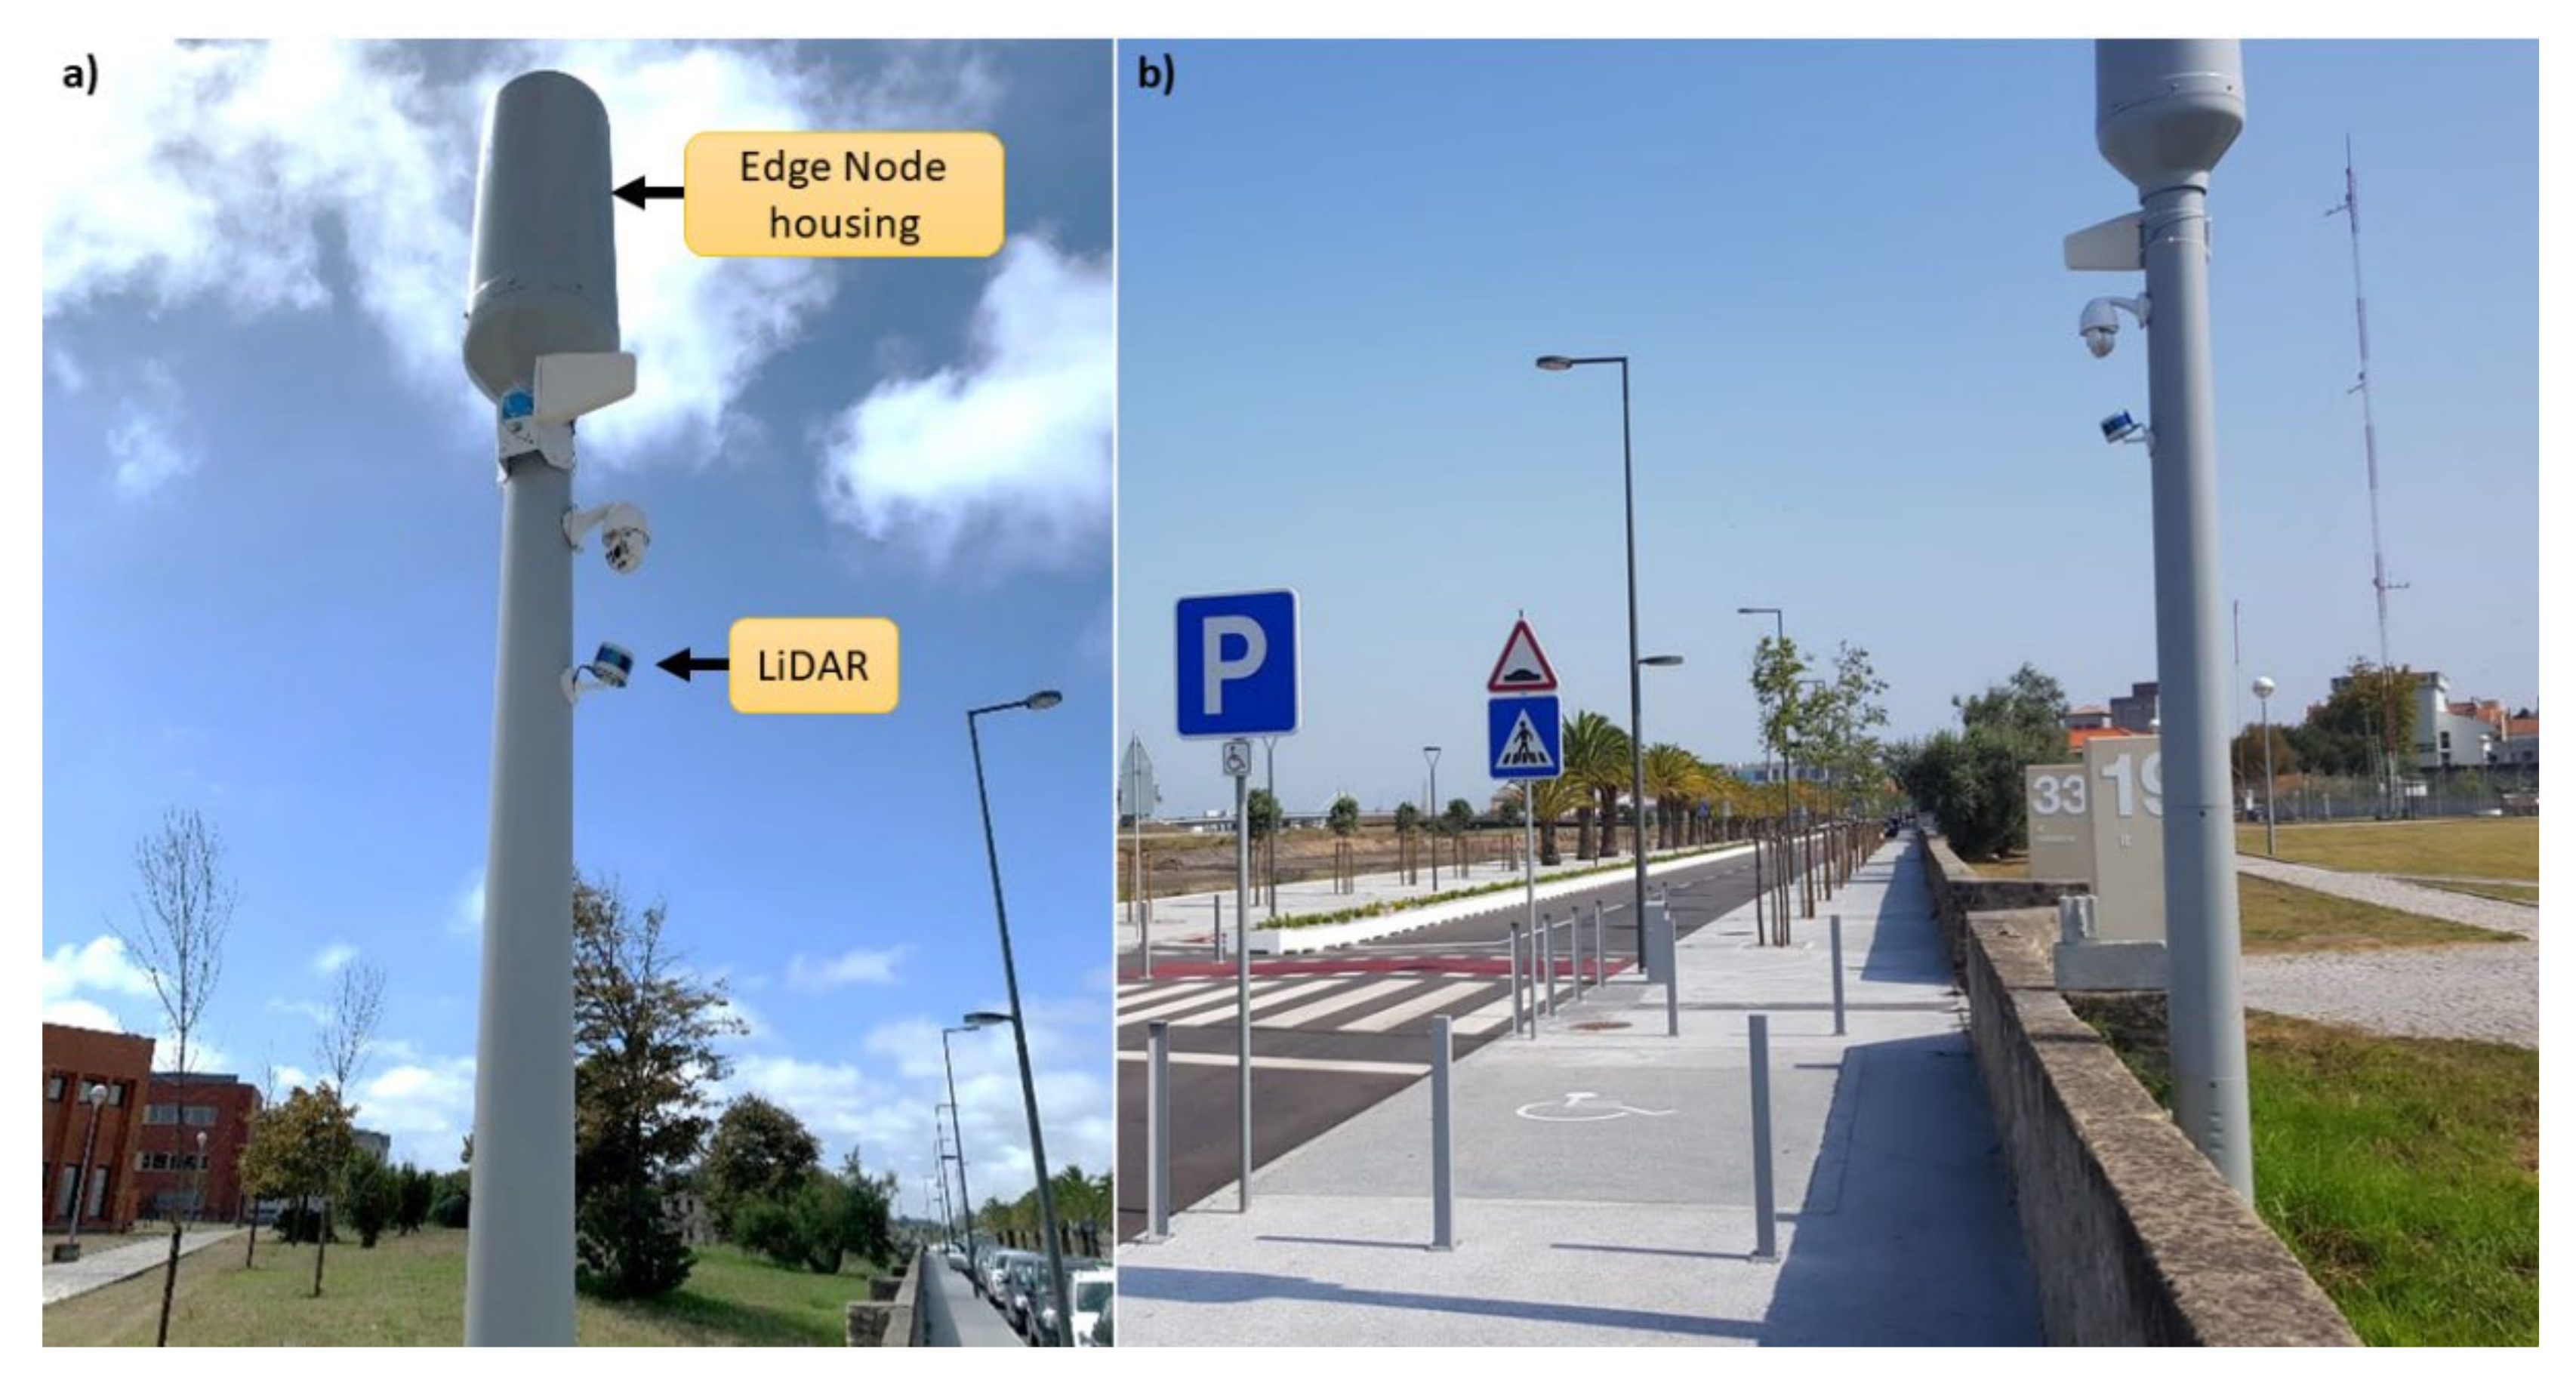
3.3. Pilot Setup
Edge nodes are housed in a protective shell on top of a “smart pole”, while the LiDAR sensors are laterally attached, at an approximate height of 3m and with a slight tilt in the vertical axis. These smart poles are typically installed close to a sidewalk and road, as depicted by
Figure 2.
The LiDAR sensor parametrization can be performed through their own dedicated web interface, where various parameters can be configured, the most relevant are: laser status (on, off); laser return mode (strongest, last or dual), also known as laser detection of a reflection; motor rotation speed (between 300 and 1200 revolutions per minute (RPM), equivalent to 5 and 20 Hz, respectively), for safety reasons, the laser is automatically turned off if the motor is stopped; the sensor’s horizontal field of view (FoV); the host/destination IP address (the receiver of the point clouds), and; the sensor’s IP address (static or dynamic, via DHCP). Other parameters are available—for additional information, including programmatic configuration through curl, the sensor datasheet provides further details.
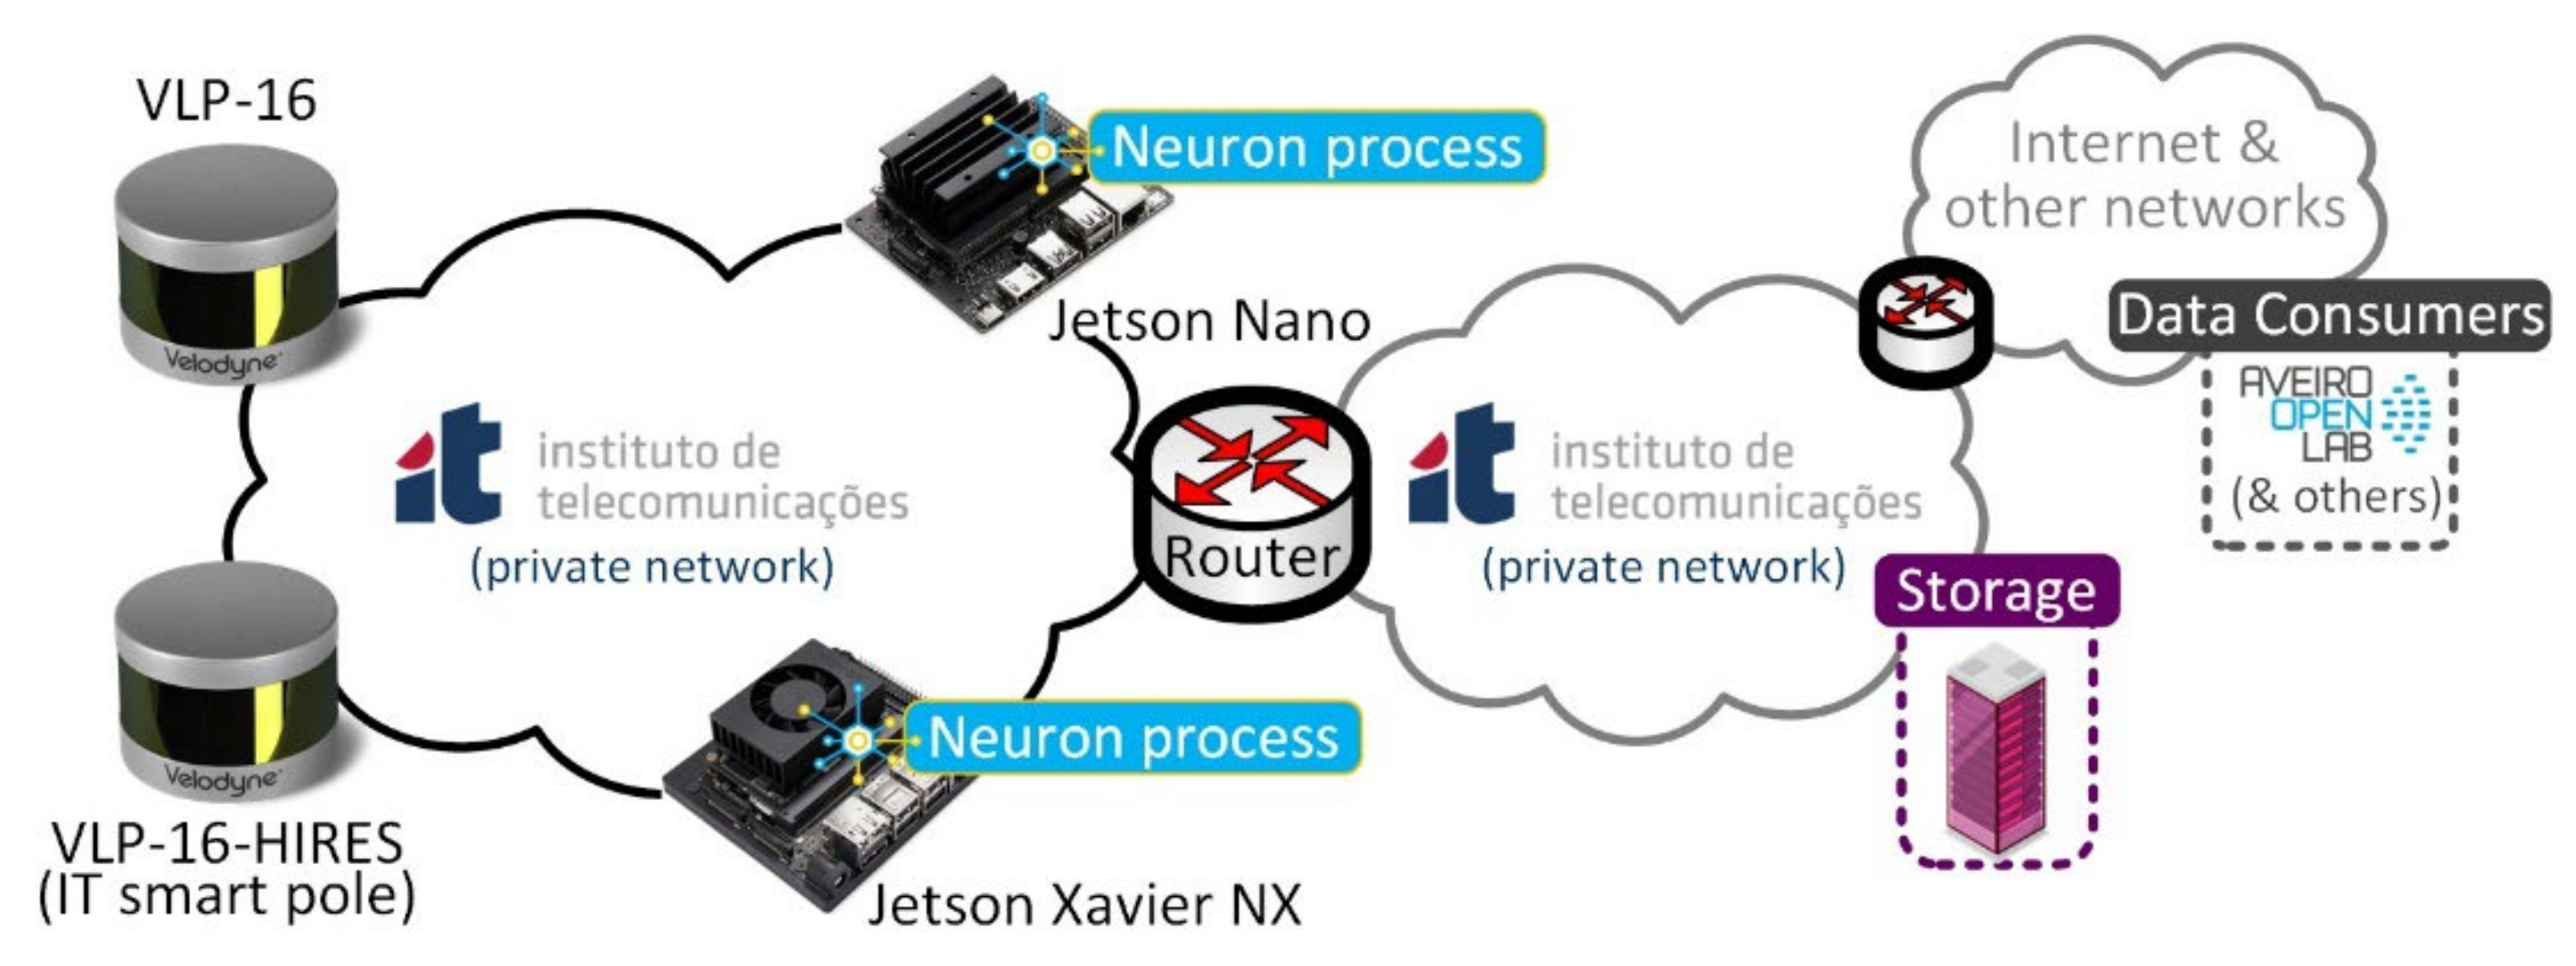
Communication with the edge-computing nodes (MEC hosts) is made through a command-line interface via a protected SSH session. These nodes use Linux Ubuntu 18.04 where the object-detection algorithm (Neuron process) has been deployed and executed. The network topology is represented in
Figure 3:
The LiDAR sensors periodically send, through the IP network, point-cloud data to the edge-computing nodes (at approximately 40 Mbps) for processing. These data are processed in quasi-real time by the Neuron process running at the edge-computing nodes. The data-processing results can be remotely accessed by any data consumer through the Neuron API.
When using multiple LiDAR sensors in a network, each sensor’s destination IP address should be set to a non-broadcast IP address. Even though two sensors could send to the same destination IP address (reporting to the same MEC host), this is still not the recommended approach, as the ethernet medium contention algorithm will limit transmission cycles from the sensors and may lead to a degradation in performance. The recommended setup is to have each sensor reporting to a different destination IP address (one MEC host per sensor or a single MEC host with two network interface cards).
3.4. Pilot Challenges
Both the VLP-16 and VLP-16-HIRES LiDAR sensors use a mechanical moving mechanism, which may degrade its lifetime. To the best of our knowledge, Velodyne does not publicly advertise the life expectancy of these sensors; nonetheless, it is reasonable to assume these were not manufactured for extensive 24/operation. Therefore, during the pilot setup, the usage of the sensors was deliberately limited to a few hours per day.
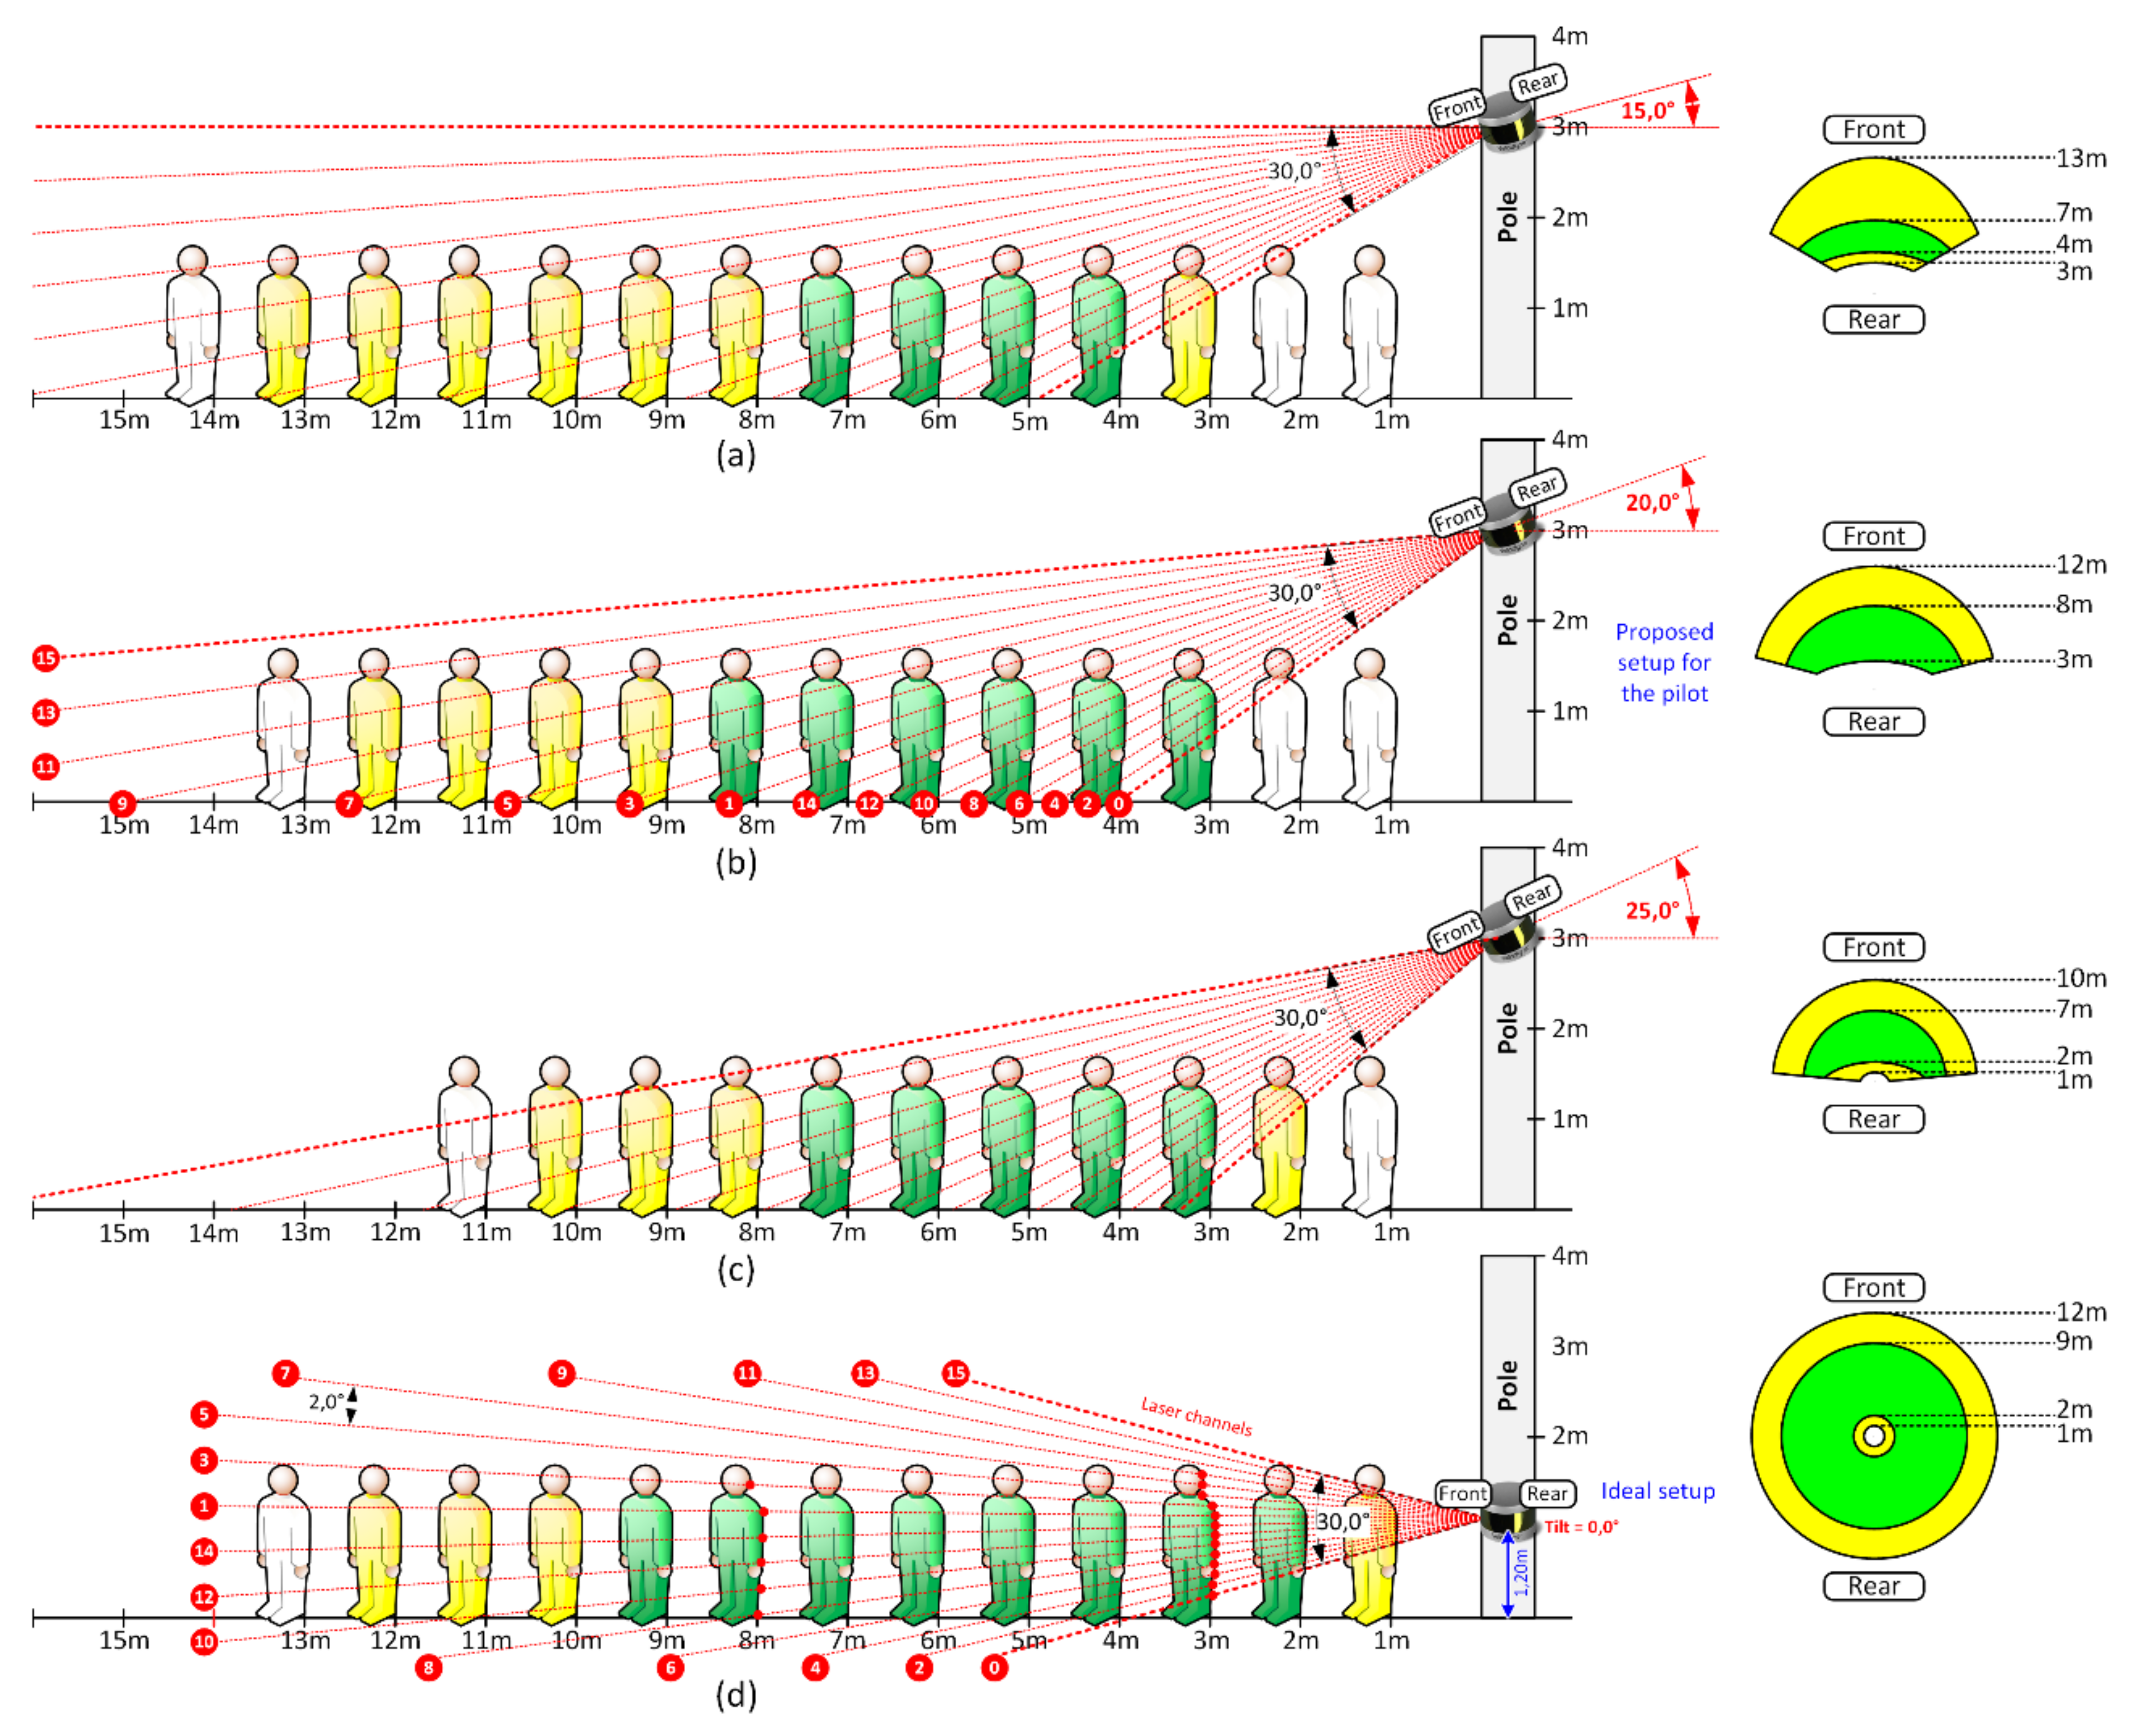
These sensors provide somewhat long-range and wide-angle laser scans. Velodyne advertises a range up to 100 m and, while it is true—they can accurately identify the existence of a reflected surface (object) at those distances—a quite different indicator is how much of that information can effectively be used for object classification, since point clouds become considerably sparser as the distance to the sensor increases. This is inherited by the specific sensor’s horizontal and vertical angle resolutions (see
Table 1). This means that objects closer to the sensor (up to a minimum distance) will produce considerably more laser reflections (3D points in the point cloud) than objects farther away. For stationary instalments (fixed in a single position), this brings an important aspect for sensor placement and data analysis.
For the specific case of this pilot, possible targets for detection were humans and vehicles. Therefore, the sensor should be placed to maximize:
the number of laser beams that hit a target;
the distance at which the target can be detected and correctly classified;
the area of interest for detection and classification.
On the other hand, for security reasons, and given their cost value, LiDAR sensors need to be protected against theft and vandalism. This may lead to non-optimal placement with respect to the above-mentioned detection goals.
Figure 4 highlights how these two conflicting goals interact.
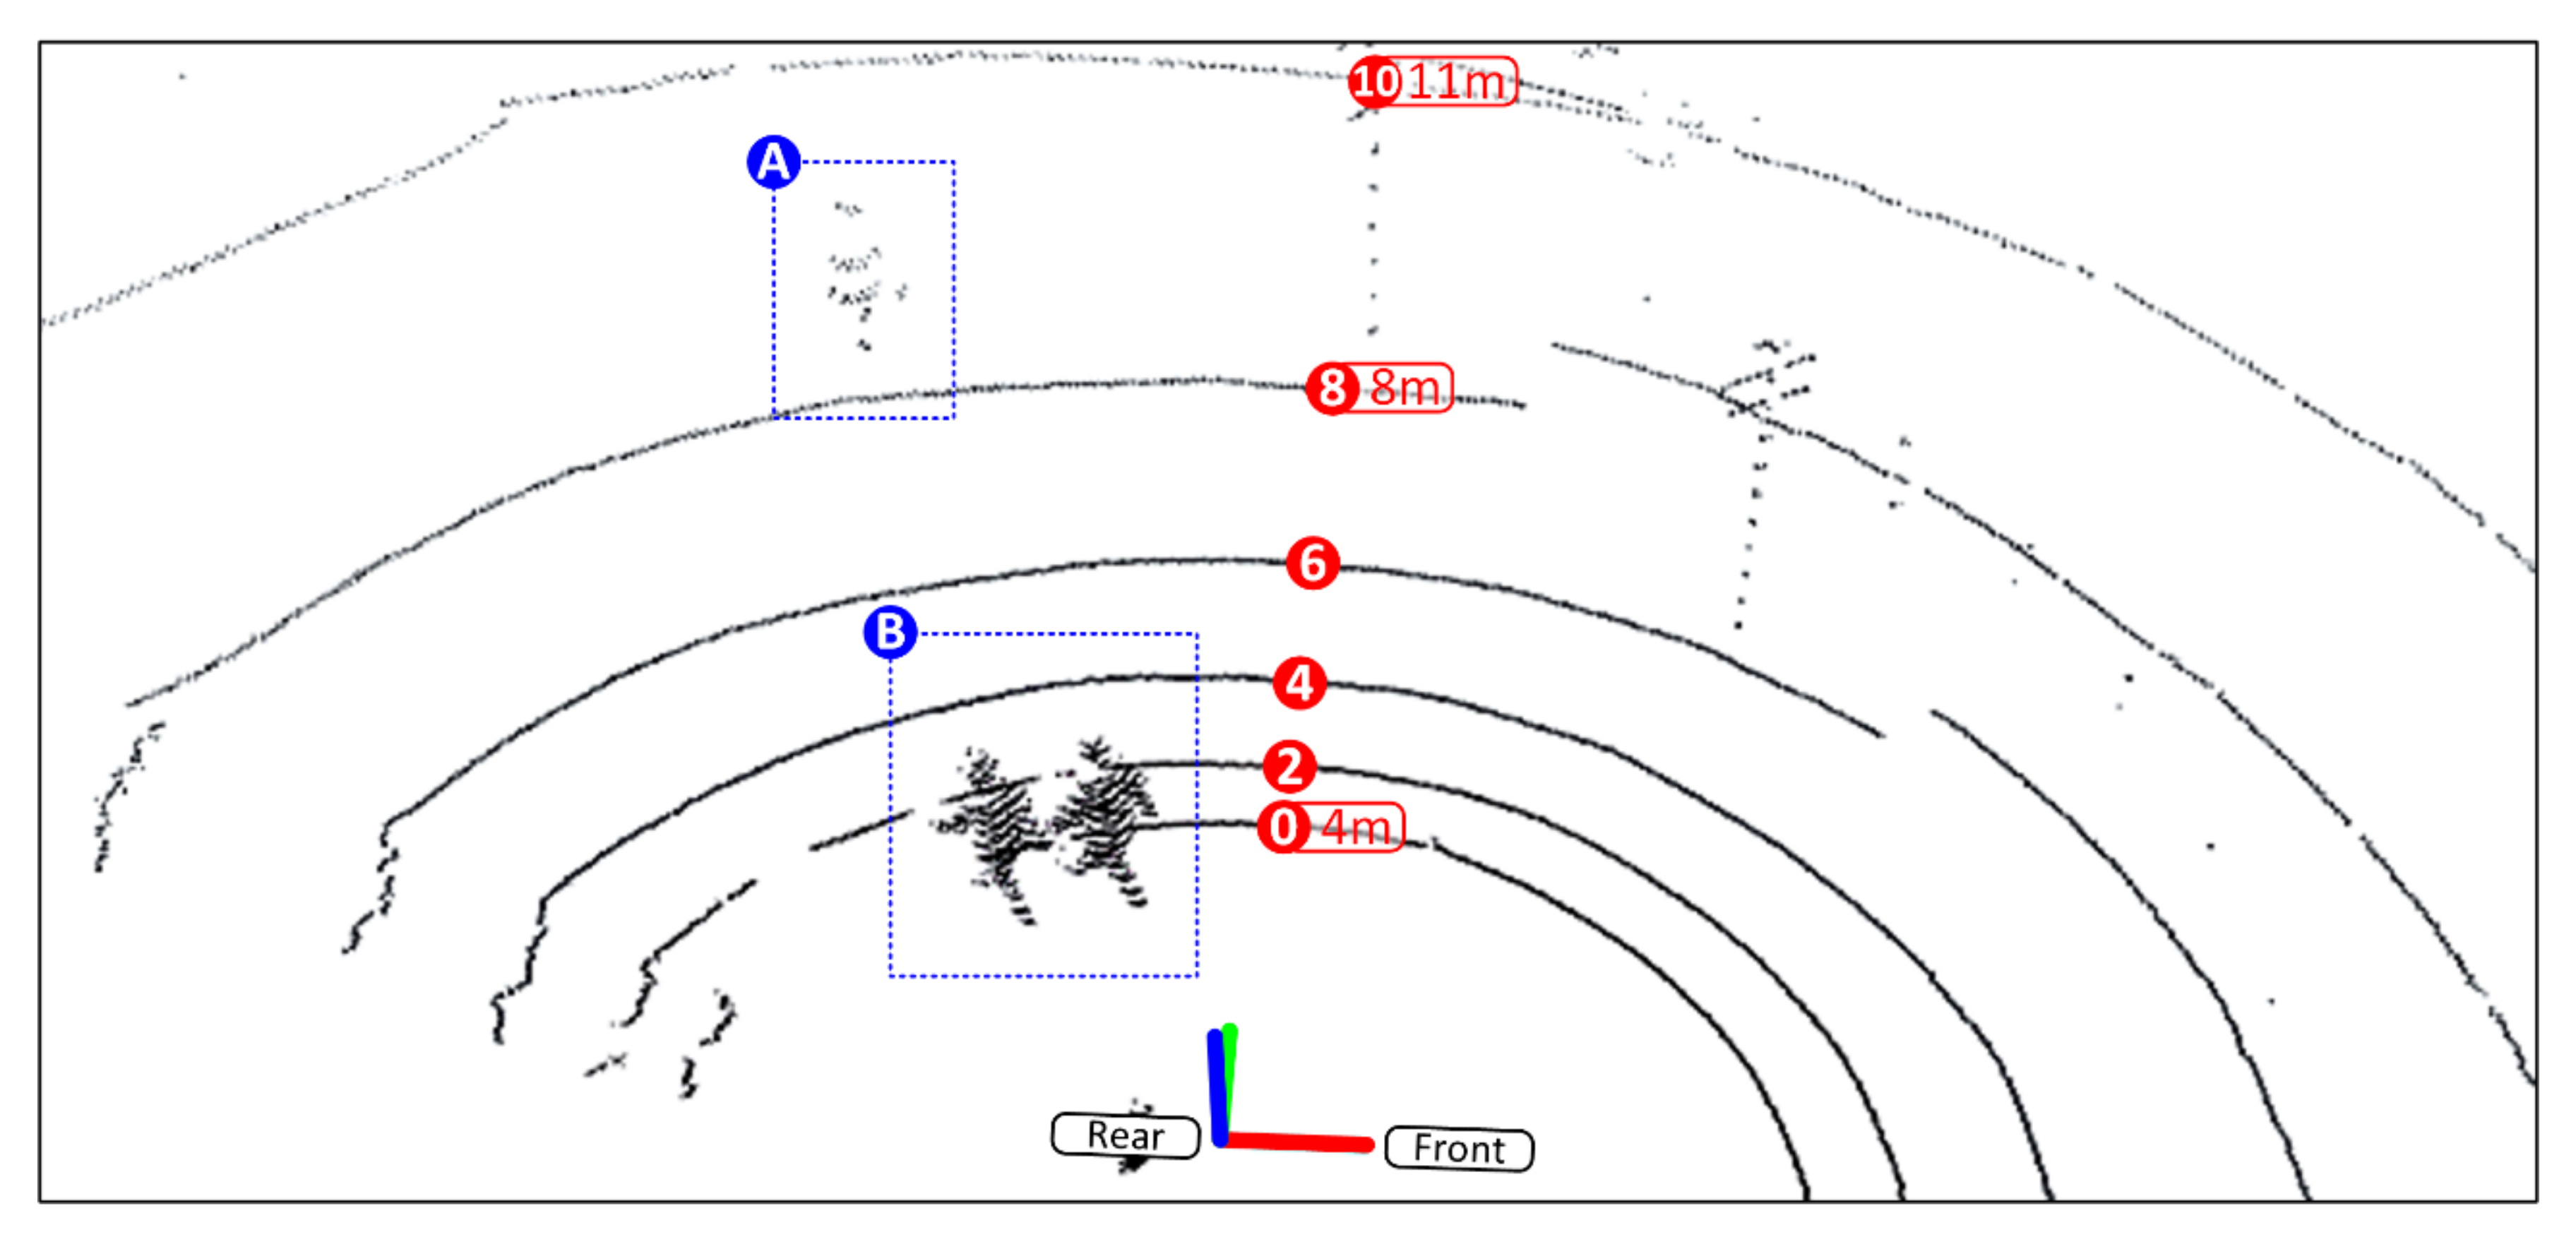
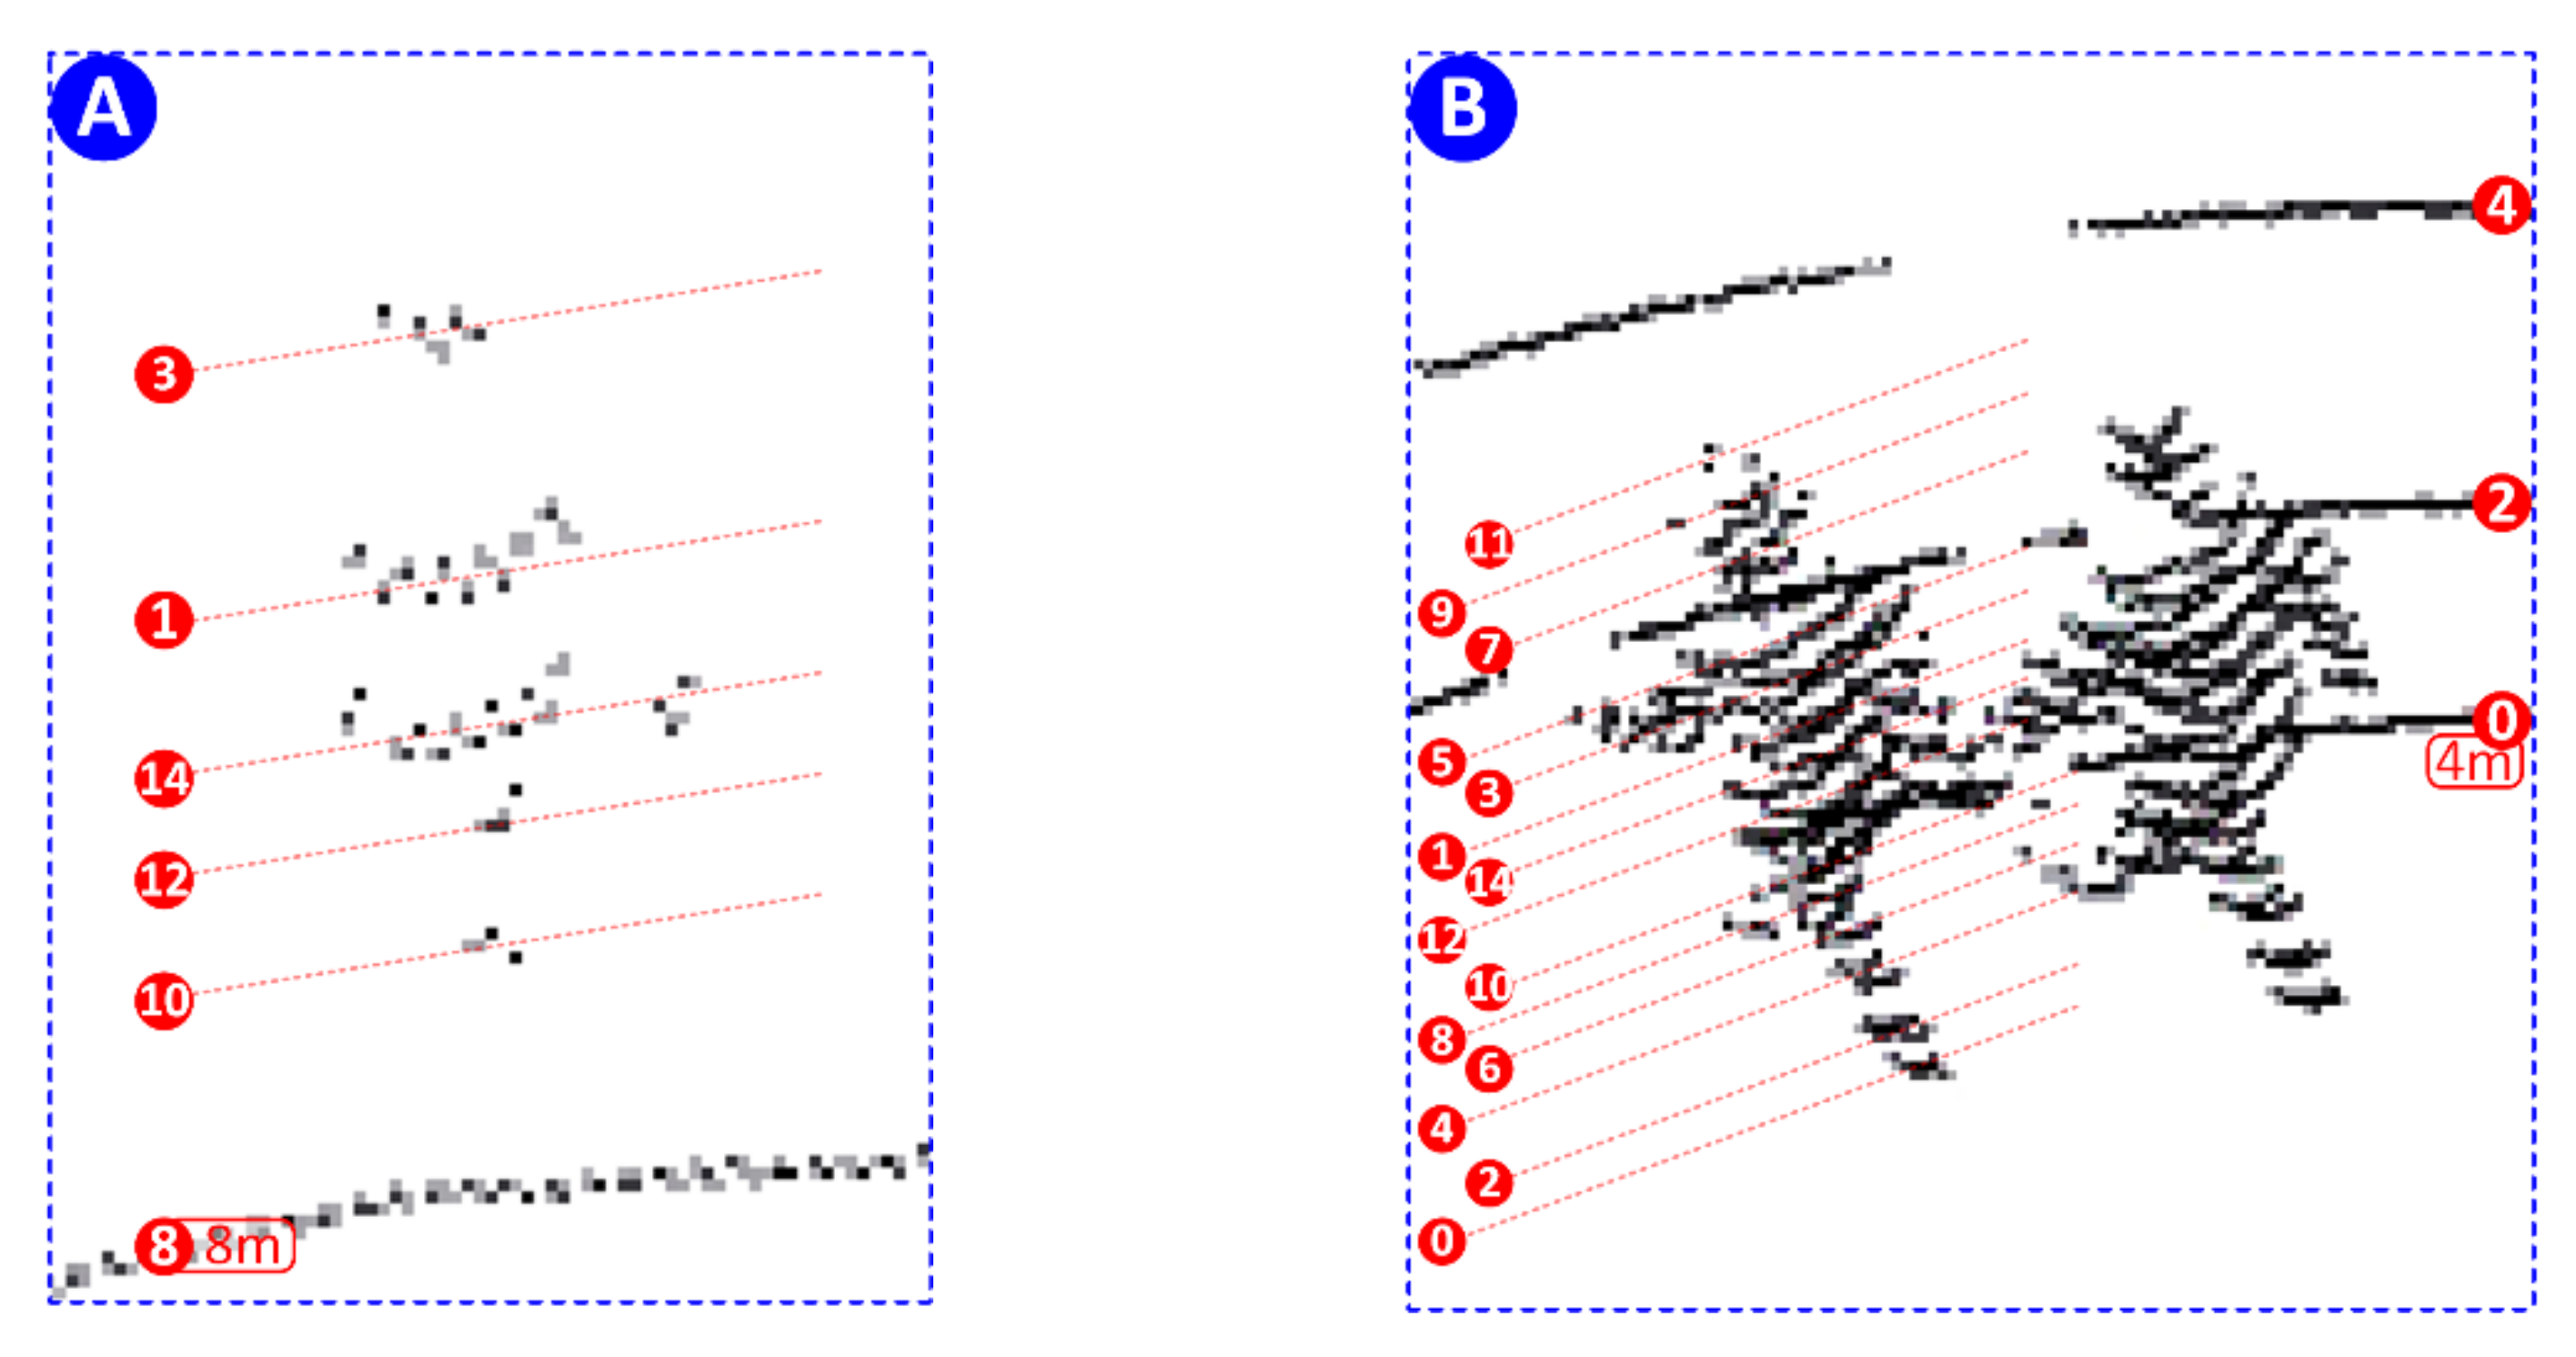
Figure 5 depicts a sample point cloud obtained by the LiDAR sensor when applying the configuration depicted in
Figure 4d. It can be seen that human detection in 3D point clouds is very challenging, as the number of reflections and their intensity will vary depending on the human pose and how close, or far away, the human is from the sensor.
Figure 6 highlights the problem statement—the clusters of points that can be used to recognize a human (pedestrian) will depend on the human pose and how far, or how close, it is with respect to the LiDAR sensor. To ensure high precision of the cluster detector and considering just one of the setups in
Figure 4, this would imply a considerable effort in training, involving a very large dataset of manually annotated data for all possible distances and human poses. Manually labeling 3D LiDAR point clouds is not only inefficient but also very tedious, which leads to human errors due to the sheer number of possible variations of human pose, shape, and size.
For this challenge, and considering (i) the decoupling of video footage and the LiDAR 3D point clouds, and (ii) the given time frame for the pilot (approx. 6 months), the work had to rely on already existing training datasets, performed by online methods. Unfortunately, the publicly available datasets mainly considered point clouds obtained with a LiDAR sensor placed at lower heights (0.8–1.20 m). This means the available training datasets are not optimized for a LiDAR sensor placement at the desired height (3 m) and tilt (
Figure 4a–c).
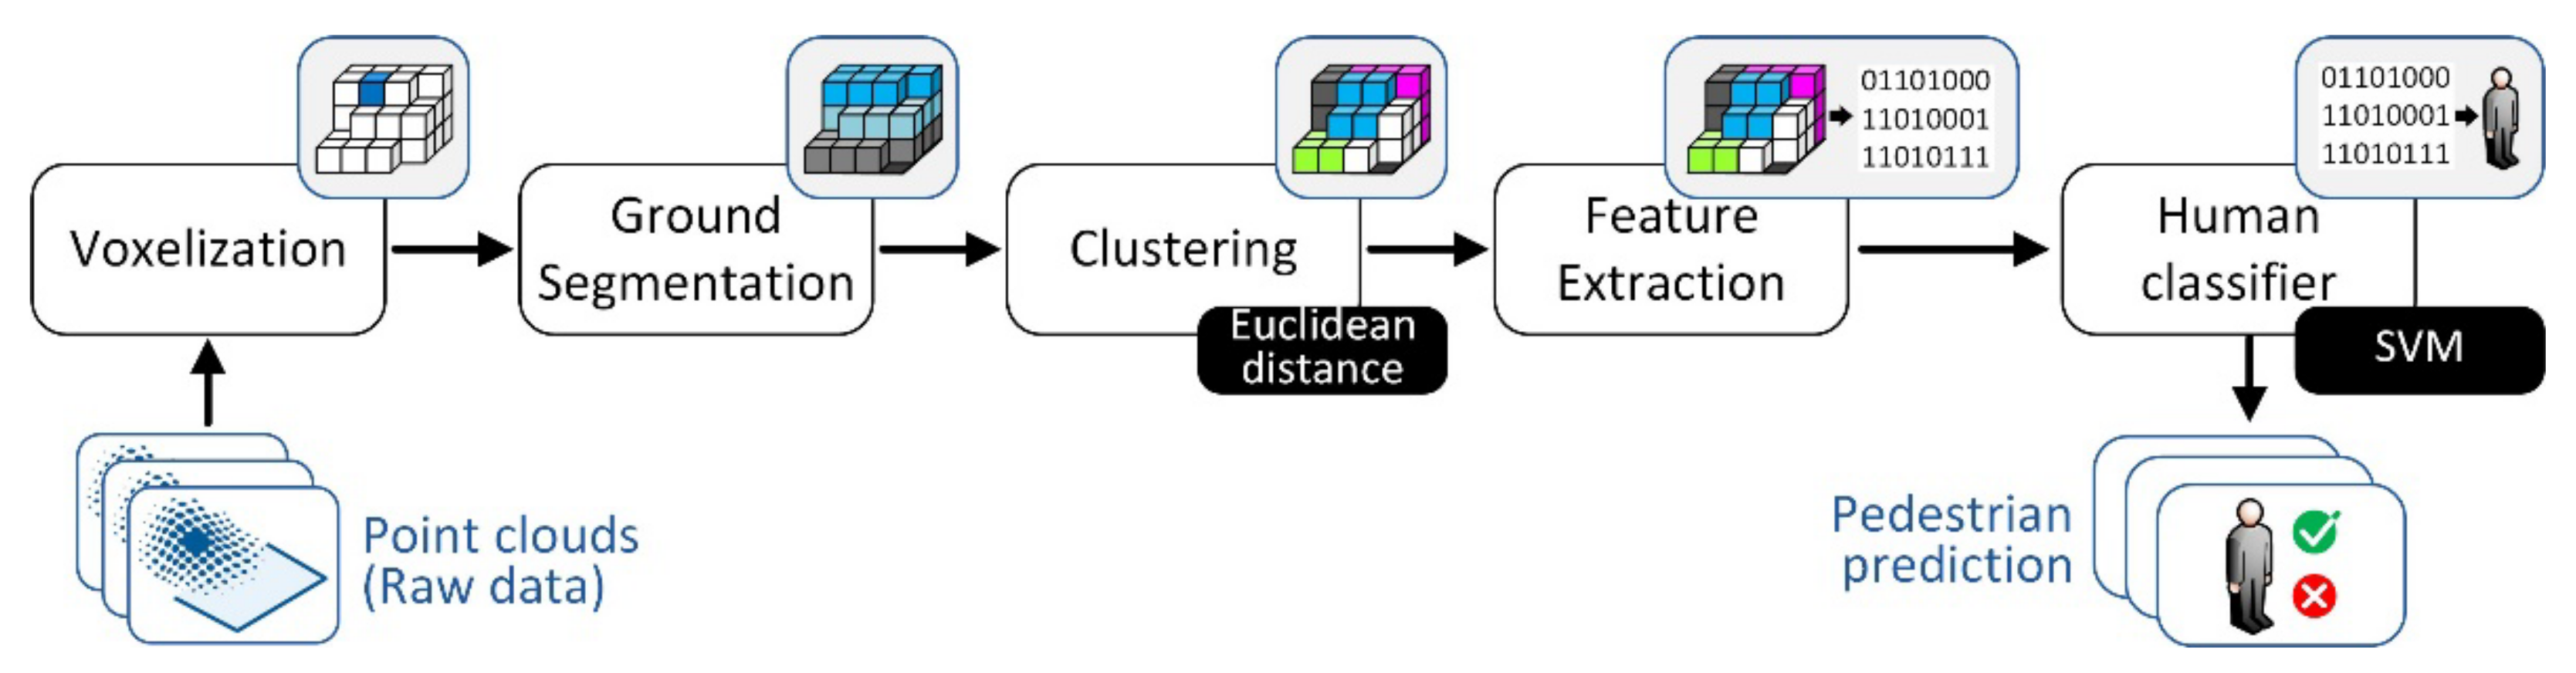
3.5. Neuron Process and API
The Neuron process follows the typical LiDAR-based detection pipeline, divided into five stages: pre-processing, also known as voxelization, ground segmentation, clustering, feature extraction, and human classifier [
24]. This data pipeline is illustrated in
Figure 7.
The Voxelization phase mainly includes downsampling, for processing efficiency and region-of-interest (ROI) definition. The ground segmentation phase is used to remove points from the ground plane and preserve point clouds that have relevant content to analyze. In this work, we are only keeping points , where . can be configured and adjusted for each scenario.
The next step is to perform
Clustering of points according to their spatial relationships. In this work, the Euclidean distance metric (
was used to carry out this clustering process (see Equation (1)), which has proved to provide good results in different contexts.
In the
Feature Extraction phase, the following features are included: feature 1 (
—number of points included in the cluster; feature 2 (
—minimum cluster distance from the sensor; feature 3 (
—3D covariance matrix of the cluster; feature 4 (
—normalized moment of inertia tensor; feature 5 (
—slice feature for the cluster; and feature 6 (
—reflection intensity distribution (mean, standard deviation, and normalized 1D histogram). Additional information on these features can be found in [
25].
The last phase of the pipeline is the
Human Classifier, where we use the Support Vector Machines (SVM) learning method as a binary classifier, trained for human classification (i.e., human and non-human) at each iteration, based on the six features previously referenced. The SVM method uses discriminant functions (see Equation (2)) to define a hyperplane that can linearly separate a dataset.
where
,
is the data point,
is a vector of weights,
is the bias and
is the model prediction. Each prediction can be either 1 or −1 for points that lie on both sides of the hyperplane and 0 for points that lie on the hyperplane itself. Given a dataset that contains several
with their corresponding
, the main objective is to find values for
and
that give the best possible margin.
The Neuron process uses the online-learning framework for human classification in 3D LiDAR scans [
25]. An updated version of this work is presented in [
26]. The original source code is open source, protected by the GNU General Public License v3.0, and can be found here [
27]. The following permissions have been enabled:
Commercial use
Modification
Distribution
Patent use
Private use
The pedestrian classifier was implemented with SVM [
28], as referenced above, since it can produce good results in non-linear datasets such as the point clouds of pedestrians, also demonstrated in [
29] and [
30].
The Neuron process modifies the original source code to reflect the context of the pilot, including the provision of the following features through a new API:
- •
Pedestrian counter.
- •
For each detected pedestrian:
- ○
an objectID, which identifies this pedestrian in the current point cloud—it enables basic tracking functionality with previous point-cloud snapshots;
- ○
LiDAR distance (in meters) measures the pedestrian distance to the sensor;
- ○
travel distance (in meters) measures how much distance this pedestrian has travelled since the last snapshot (uses the objectID parameter for tracking);
- ○
velocity (in meters/second) measures the pedestrian velocity when comparing its position with the previous snapshot (uses the objectID parameter for tracking);
- ○
the pedestrian coordinates, based on its centroid X, Y, Z position;
- ○
the elevation angle (in degrees) measures the pedestrian cluster’s centroid relative to the LiDAR sensor’s horizontal plane—this parameter is defined as ω (lowercase Greek letter omega) in the VLP-16 datasheet;
- ○
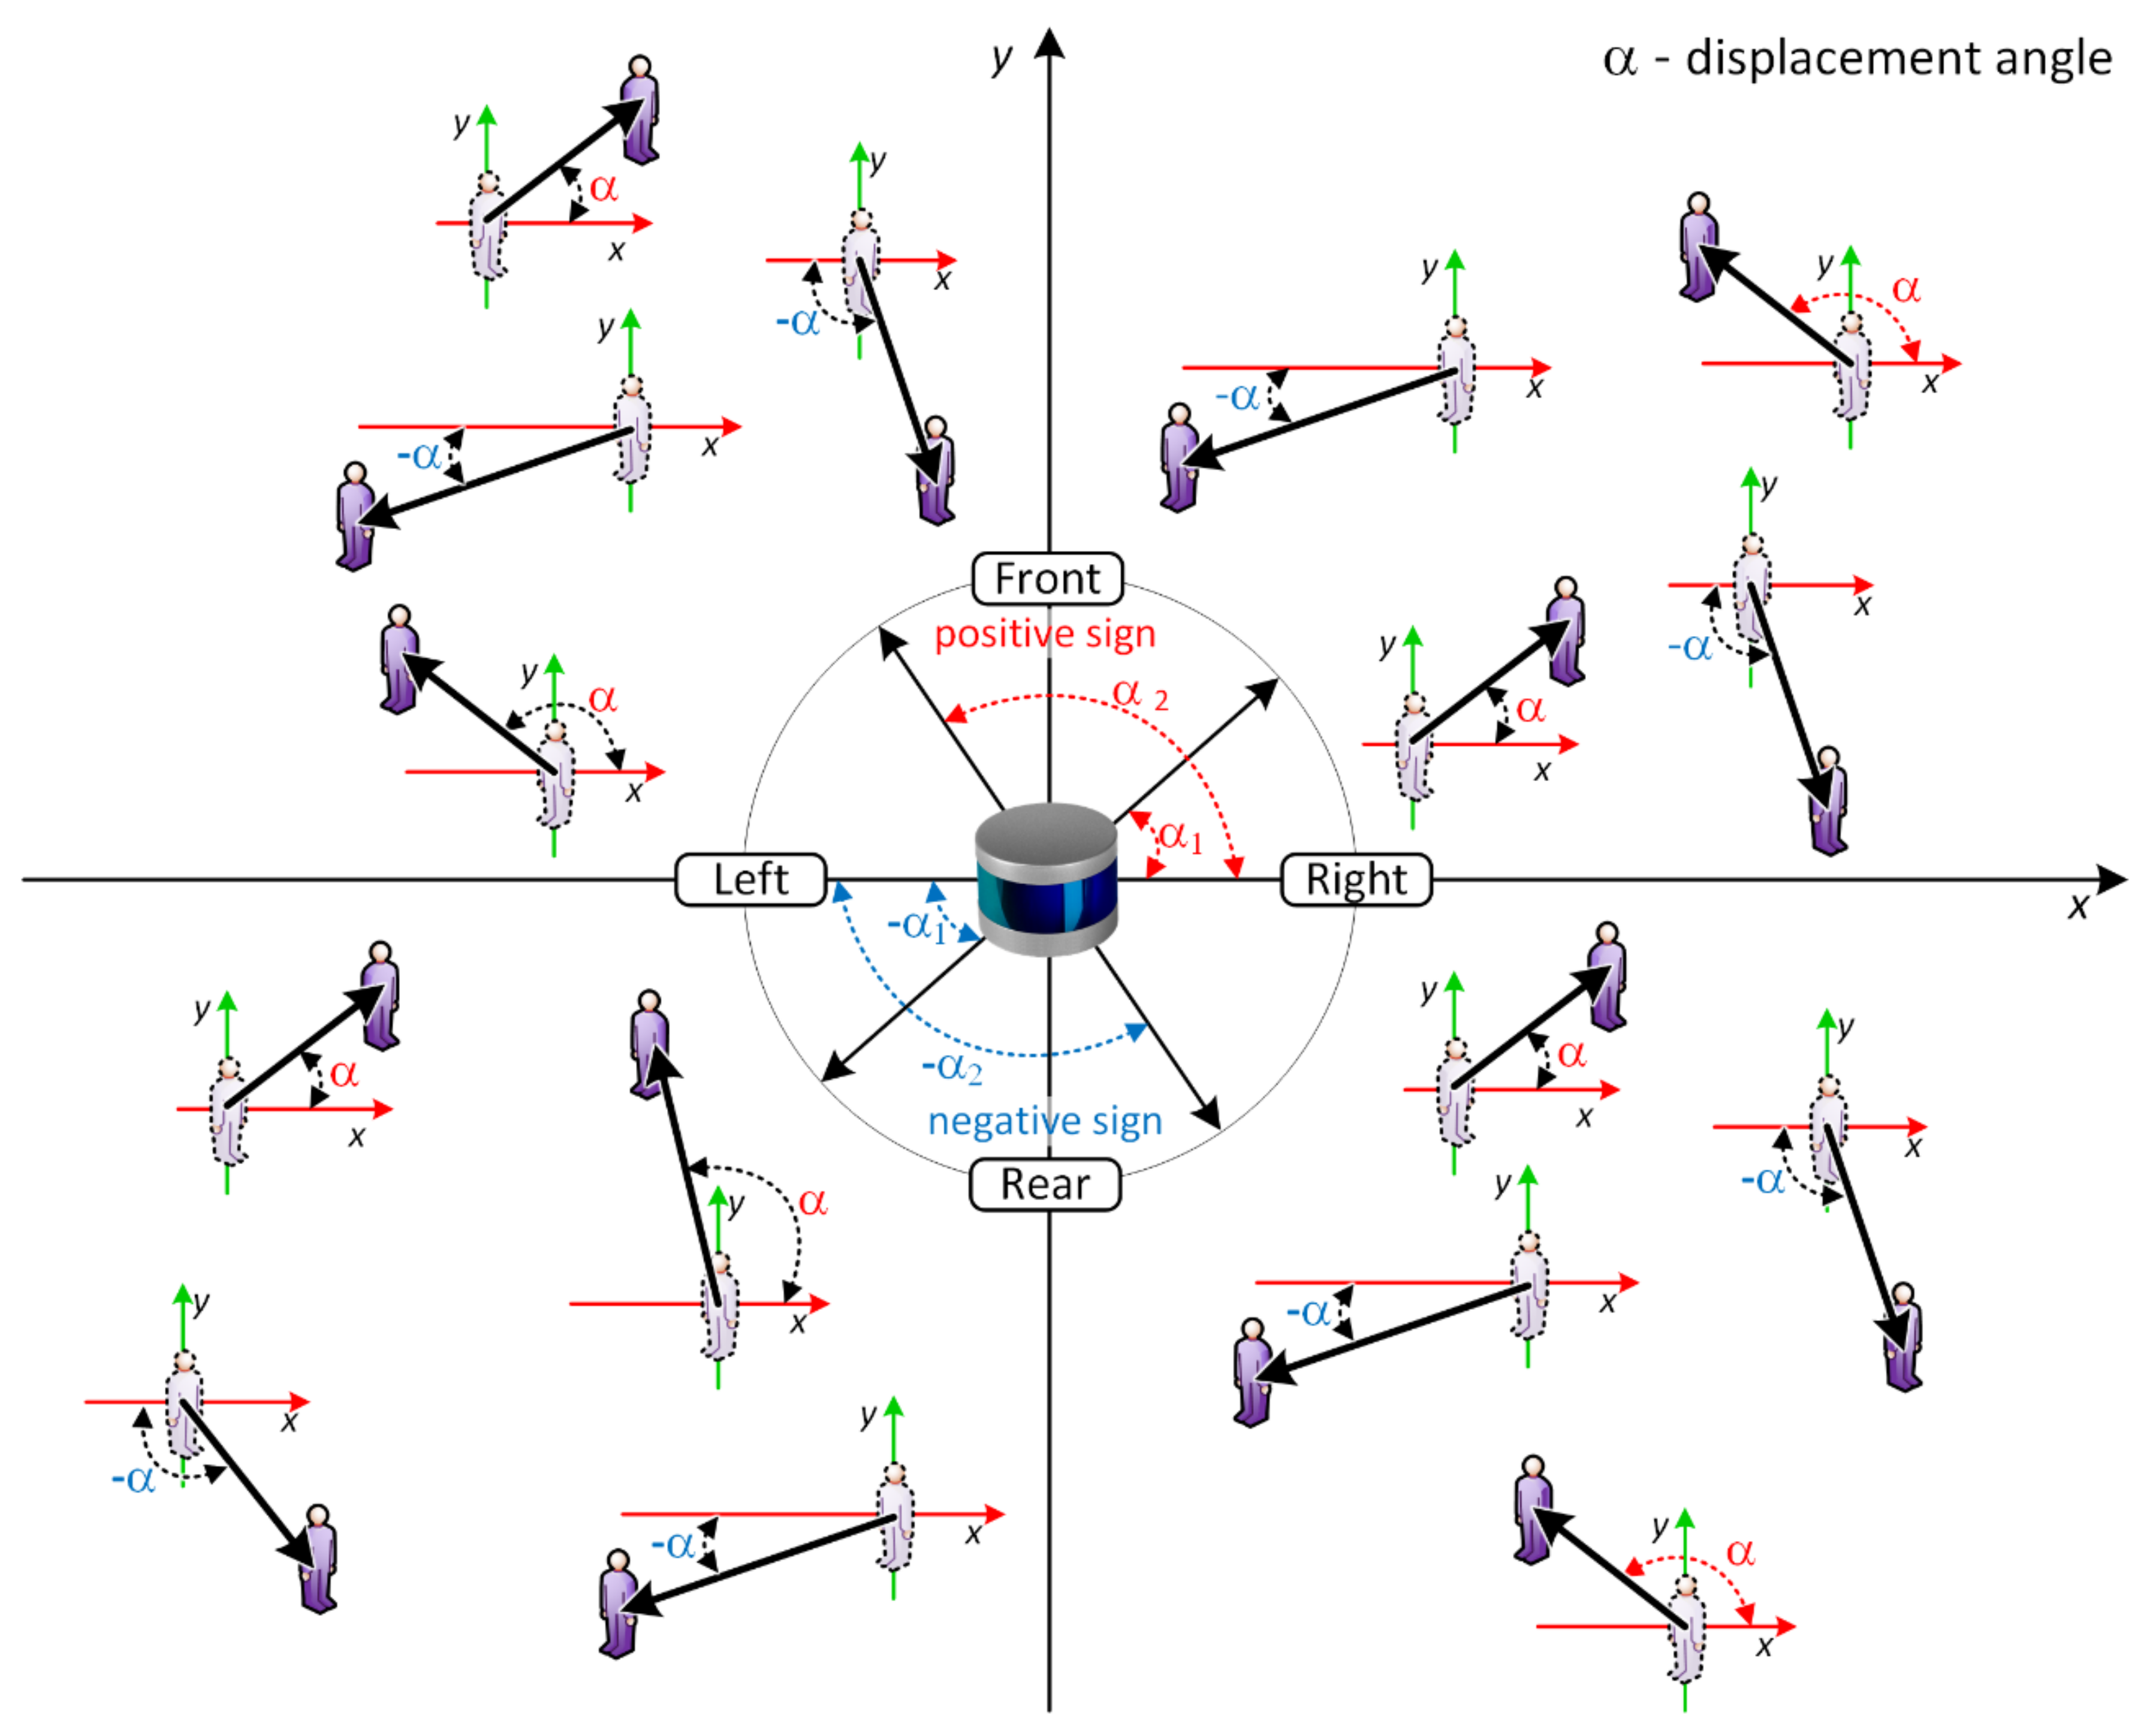
the displacement angle (in degrees) provides the walking path angle with respect to the LiDAR sensor’s X and Y axis;
With the above-mentioned parameters, it is possible to plot each pedestrian and its corresponding movement vector in space. The interpretation of the walking direction, based on the measured displacement angle, is explained in
Figure 8. A positive displacement angle, with respect to the X axis, means the walking path should use a counterclockwise angle and the direction, with respect to the walking path, is from the rear to the front of the sensor. The opposite is true in the case that the measured displacement angle is negative.
4. Experimental Results
This section presents the experimental results achieved in a real deployment in the city of Aveiro, Portugal.
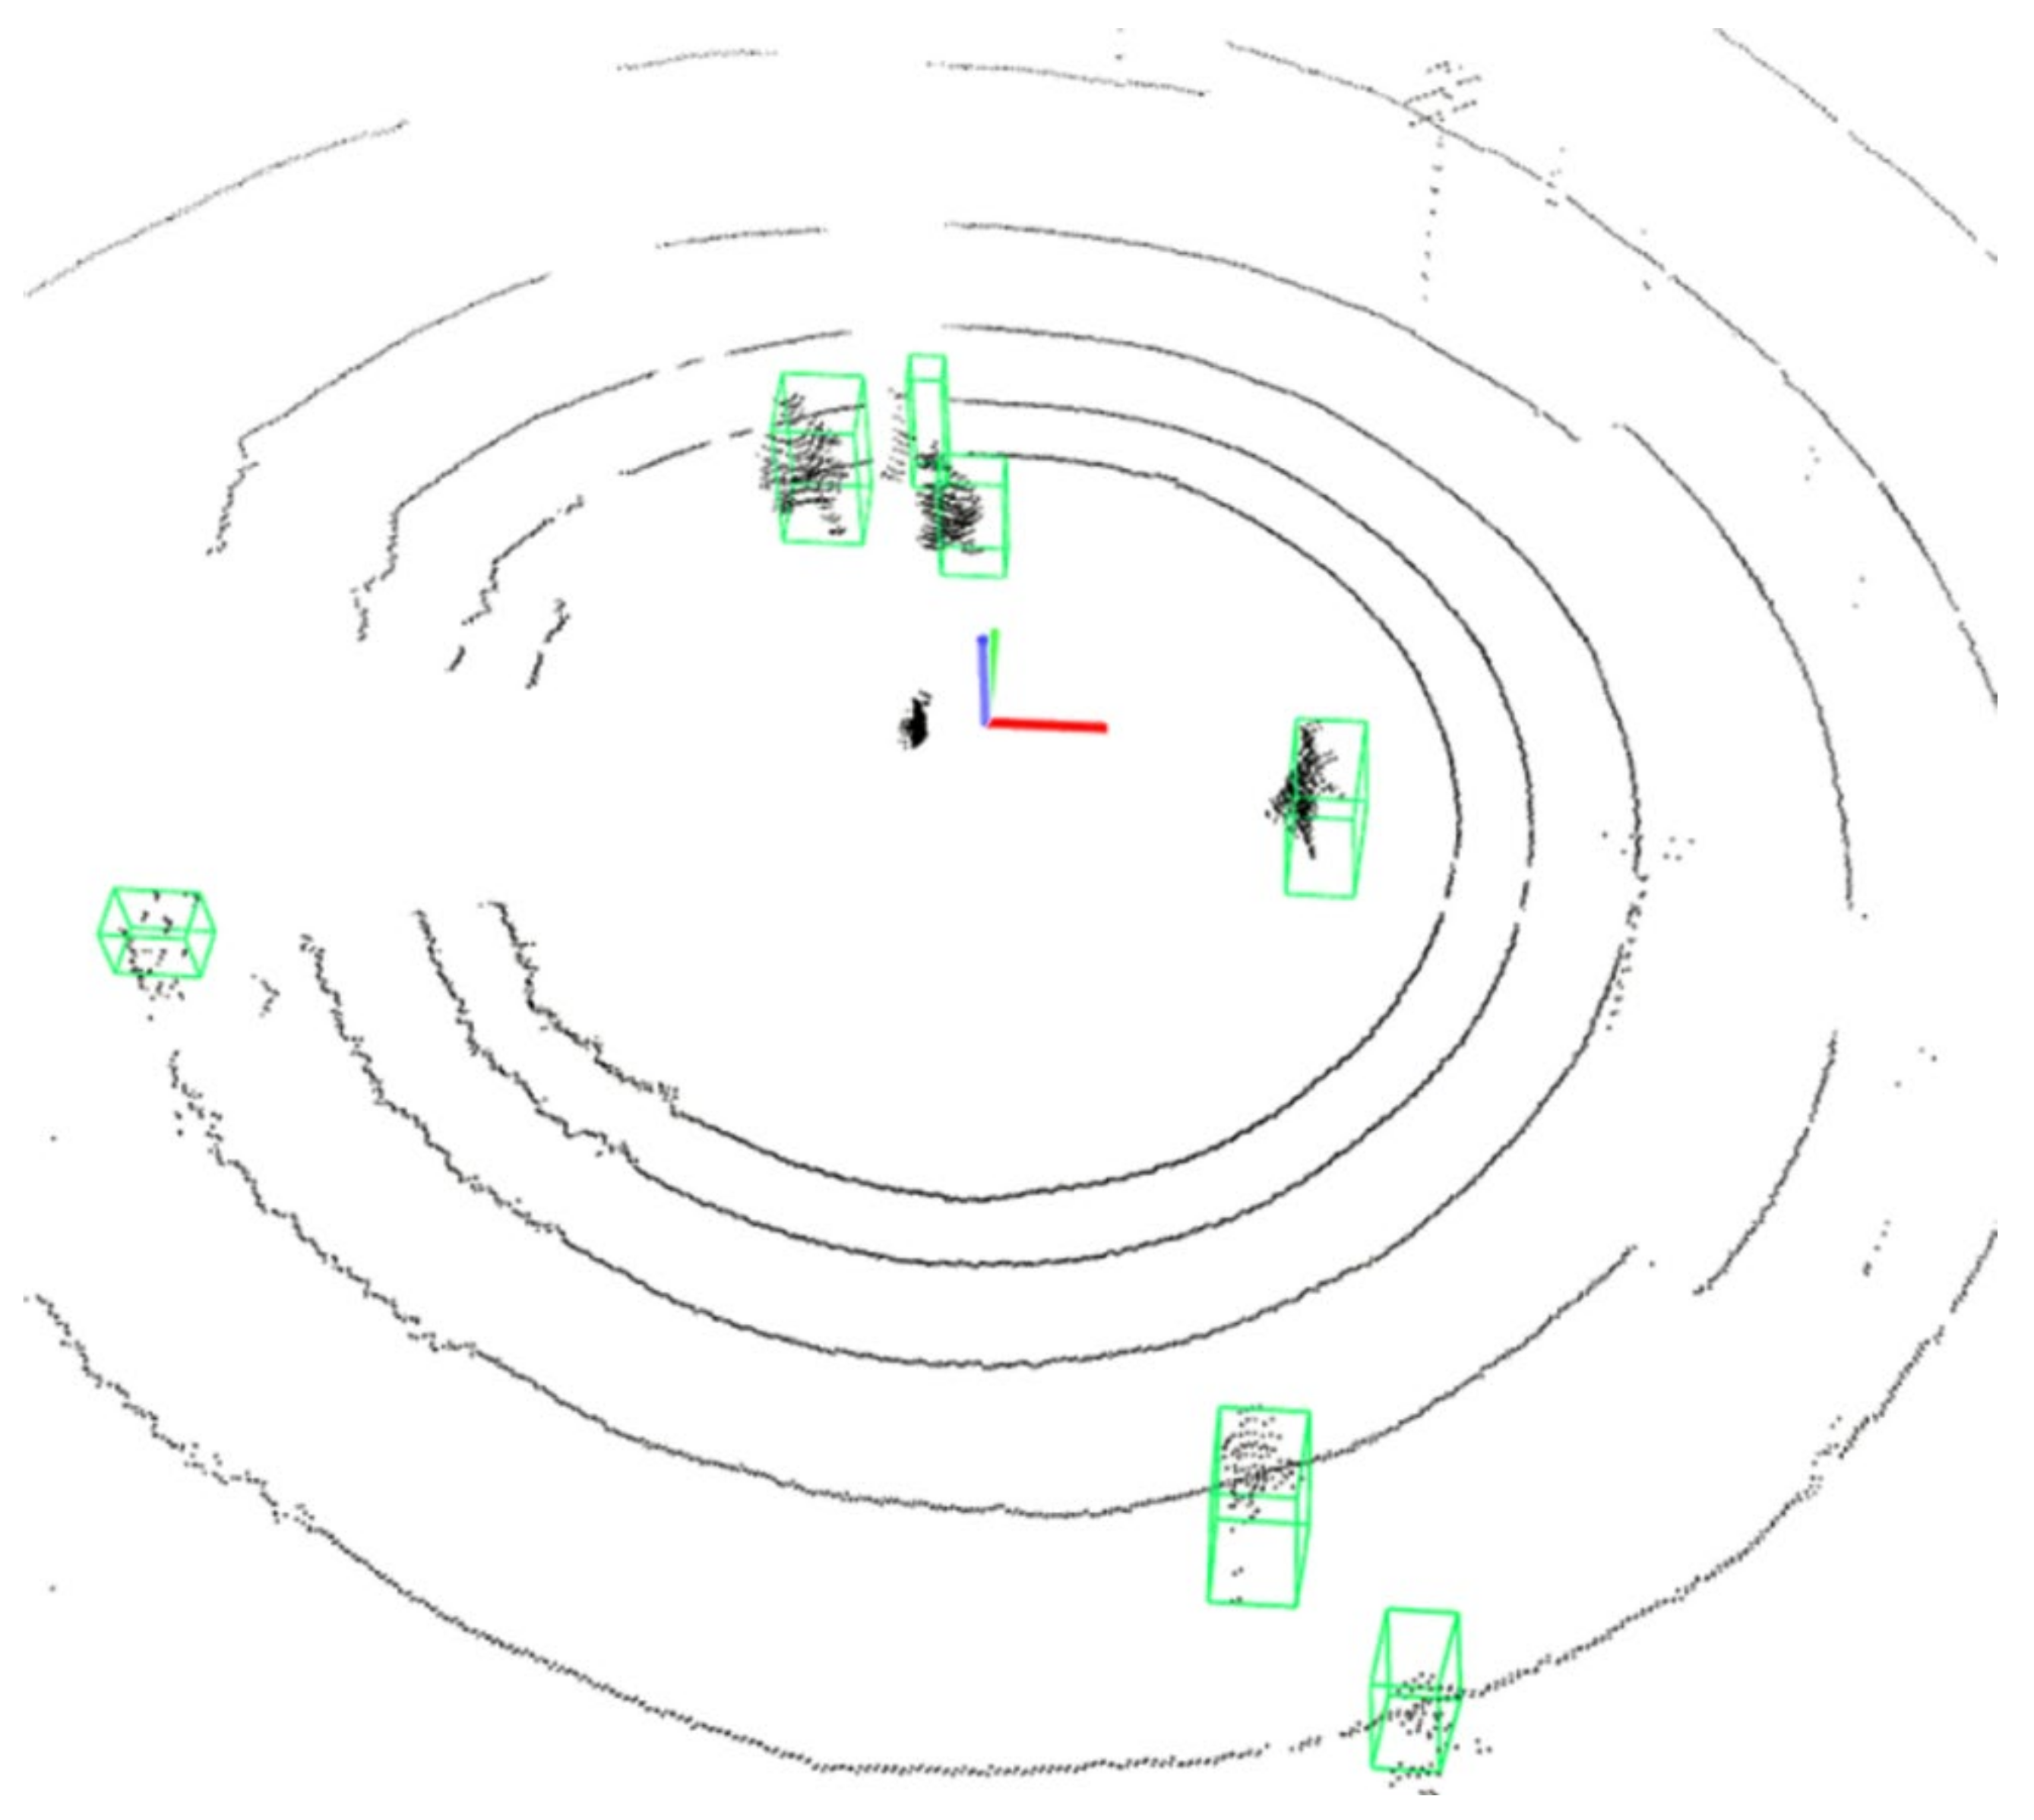
When placing the sensor (LiDAR) horizontally (no tilt) and at a height of approx. 1.20 m, the detection and classification of pedestrians are within the expectations derived from the analysis provided in
Section 3, specifically in what is depicted in
Figure 4d. Pedestrians and their associated information (position, velocity, direction, etc.) were successfully extracted from the received point clouds in quasi-real time.
Figure 9 depicts a visual interpretation of the detected objects (all pedestrians), confirming the multi-tracking capability of the implemented solution. It is also possible to confirm that pedestrians were detected beyond the fifth ring, corresponding to laser channel 8 (using
Figure 4 for context) and therefore up to 9 m distance from the LiDAR sensor. When placing the sensor at a height of 3 m with a 20° tilt (approx.), the detection and successful classification of pedestrians are also within the expectations derived from the analysis provided in
Section 3, specifically in what is depicted in
Figure 4b.
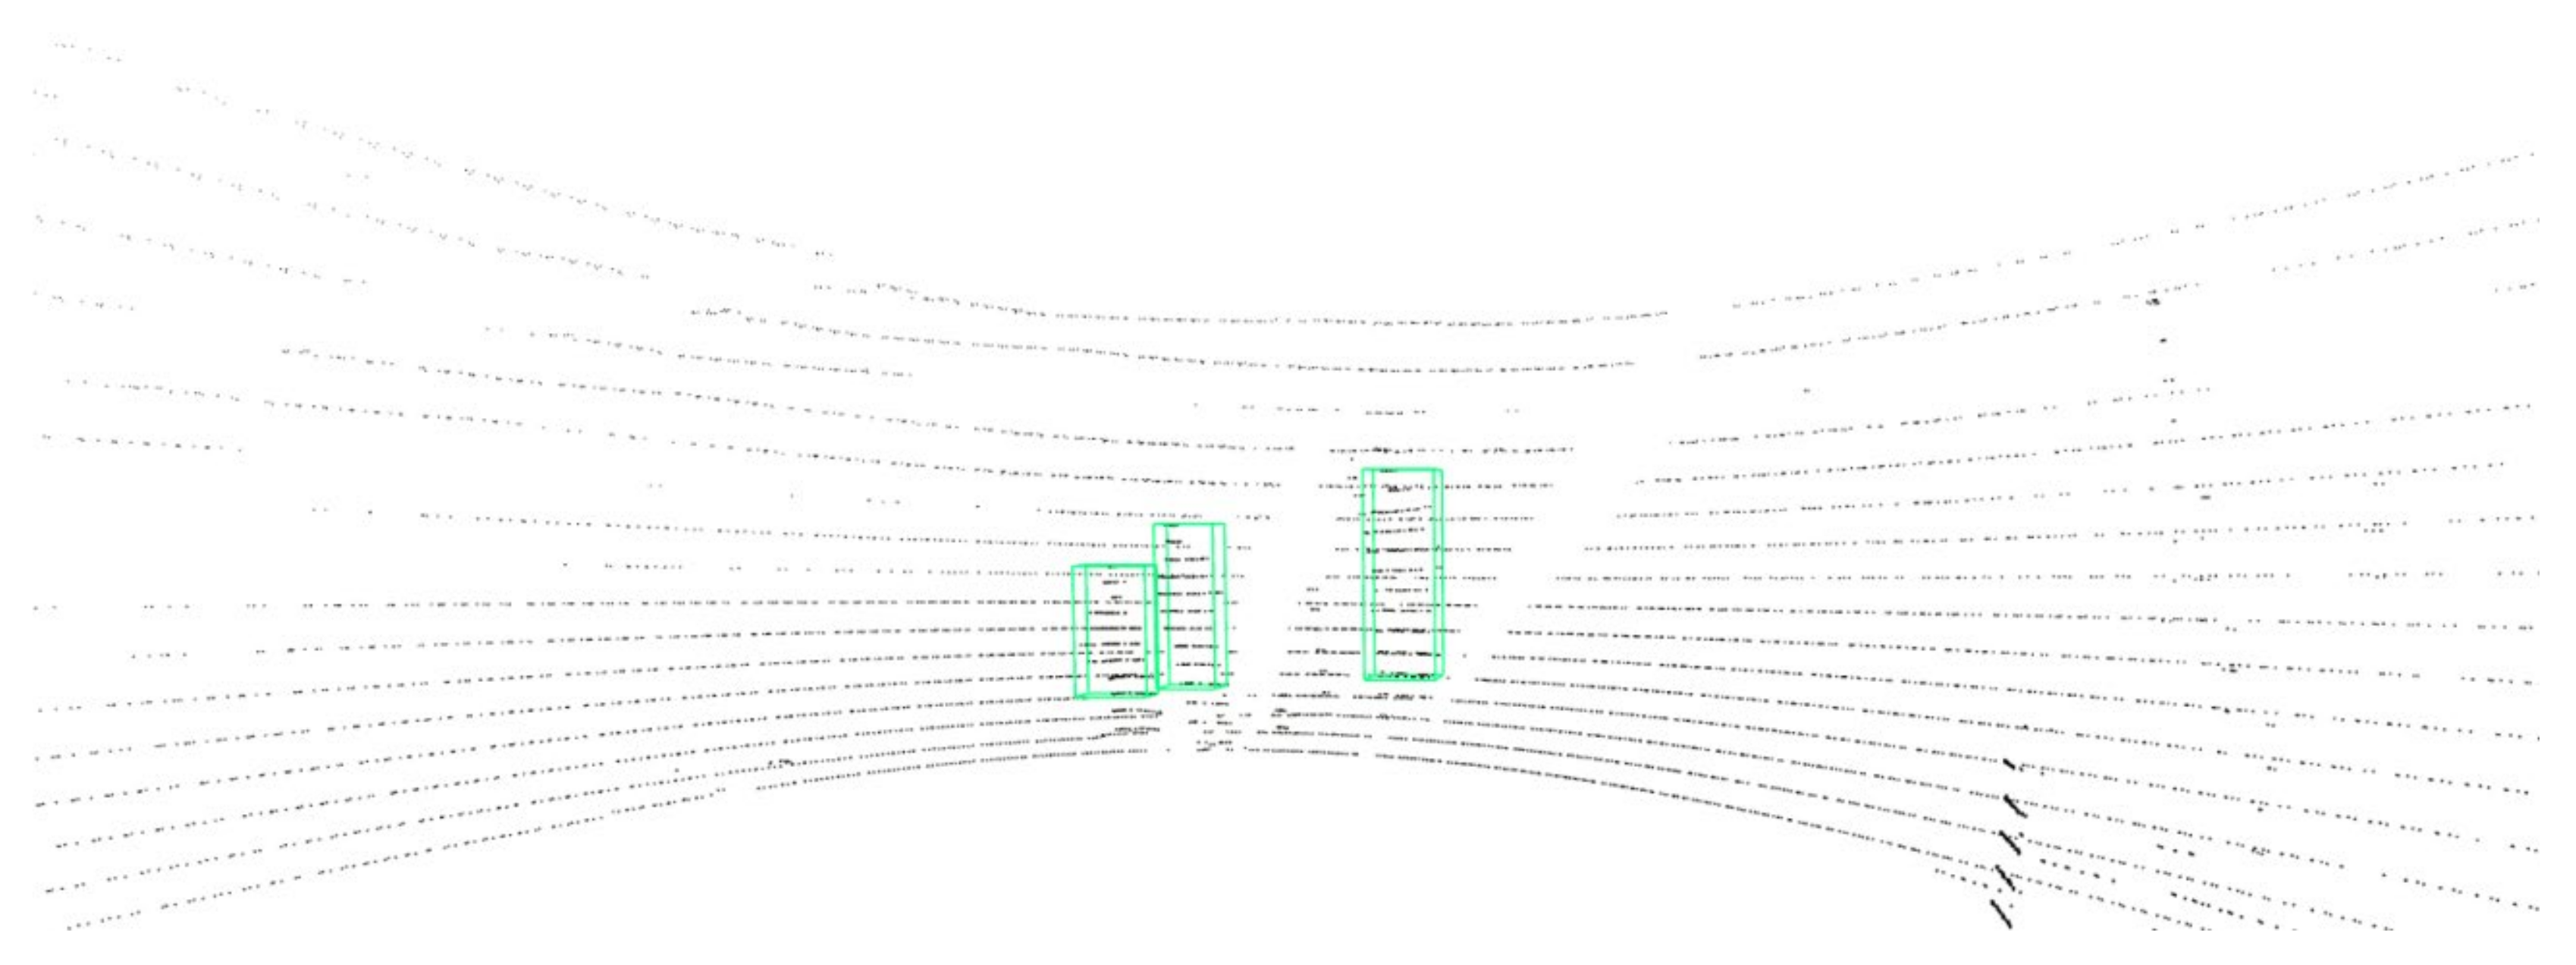
Figure 10 depicts a point cloud obtained with this setup. The laser reflection pattern clearly identifies the existence of horizontal tilt and a limitation in the field of view. Furthermore, the laser reflections are notably becoming sparser as we move away from the central position. Therefore, pedestrians will not be correctly identified by the implemented algorithm as they move left or right (away) from the sensor’s central position, as seen in
Figure 11.
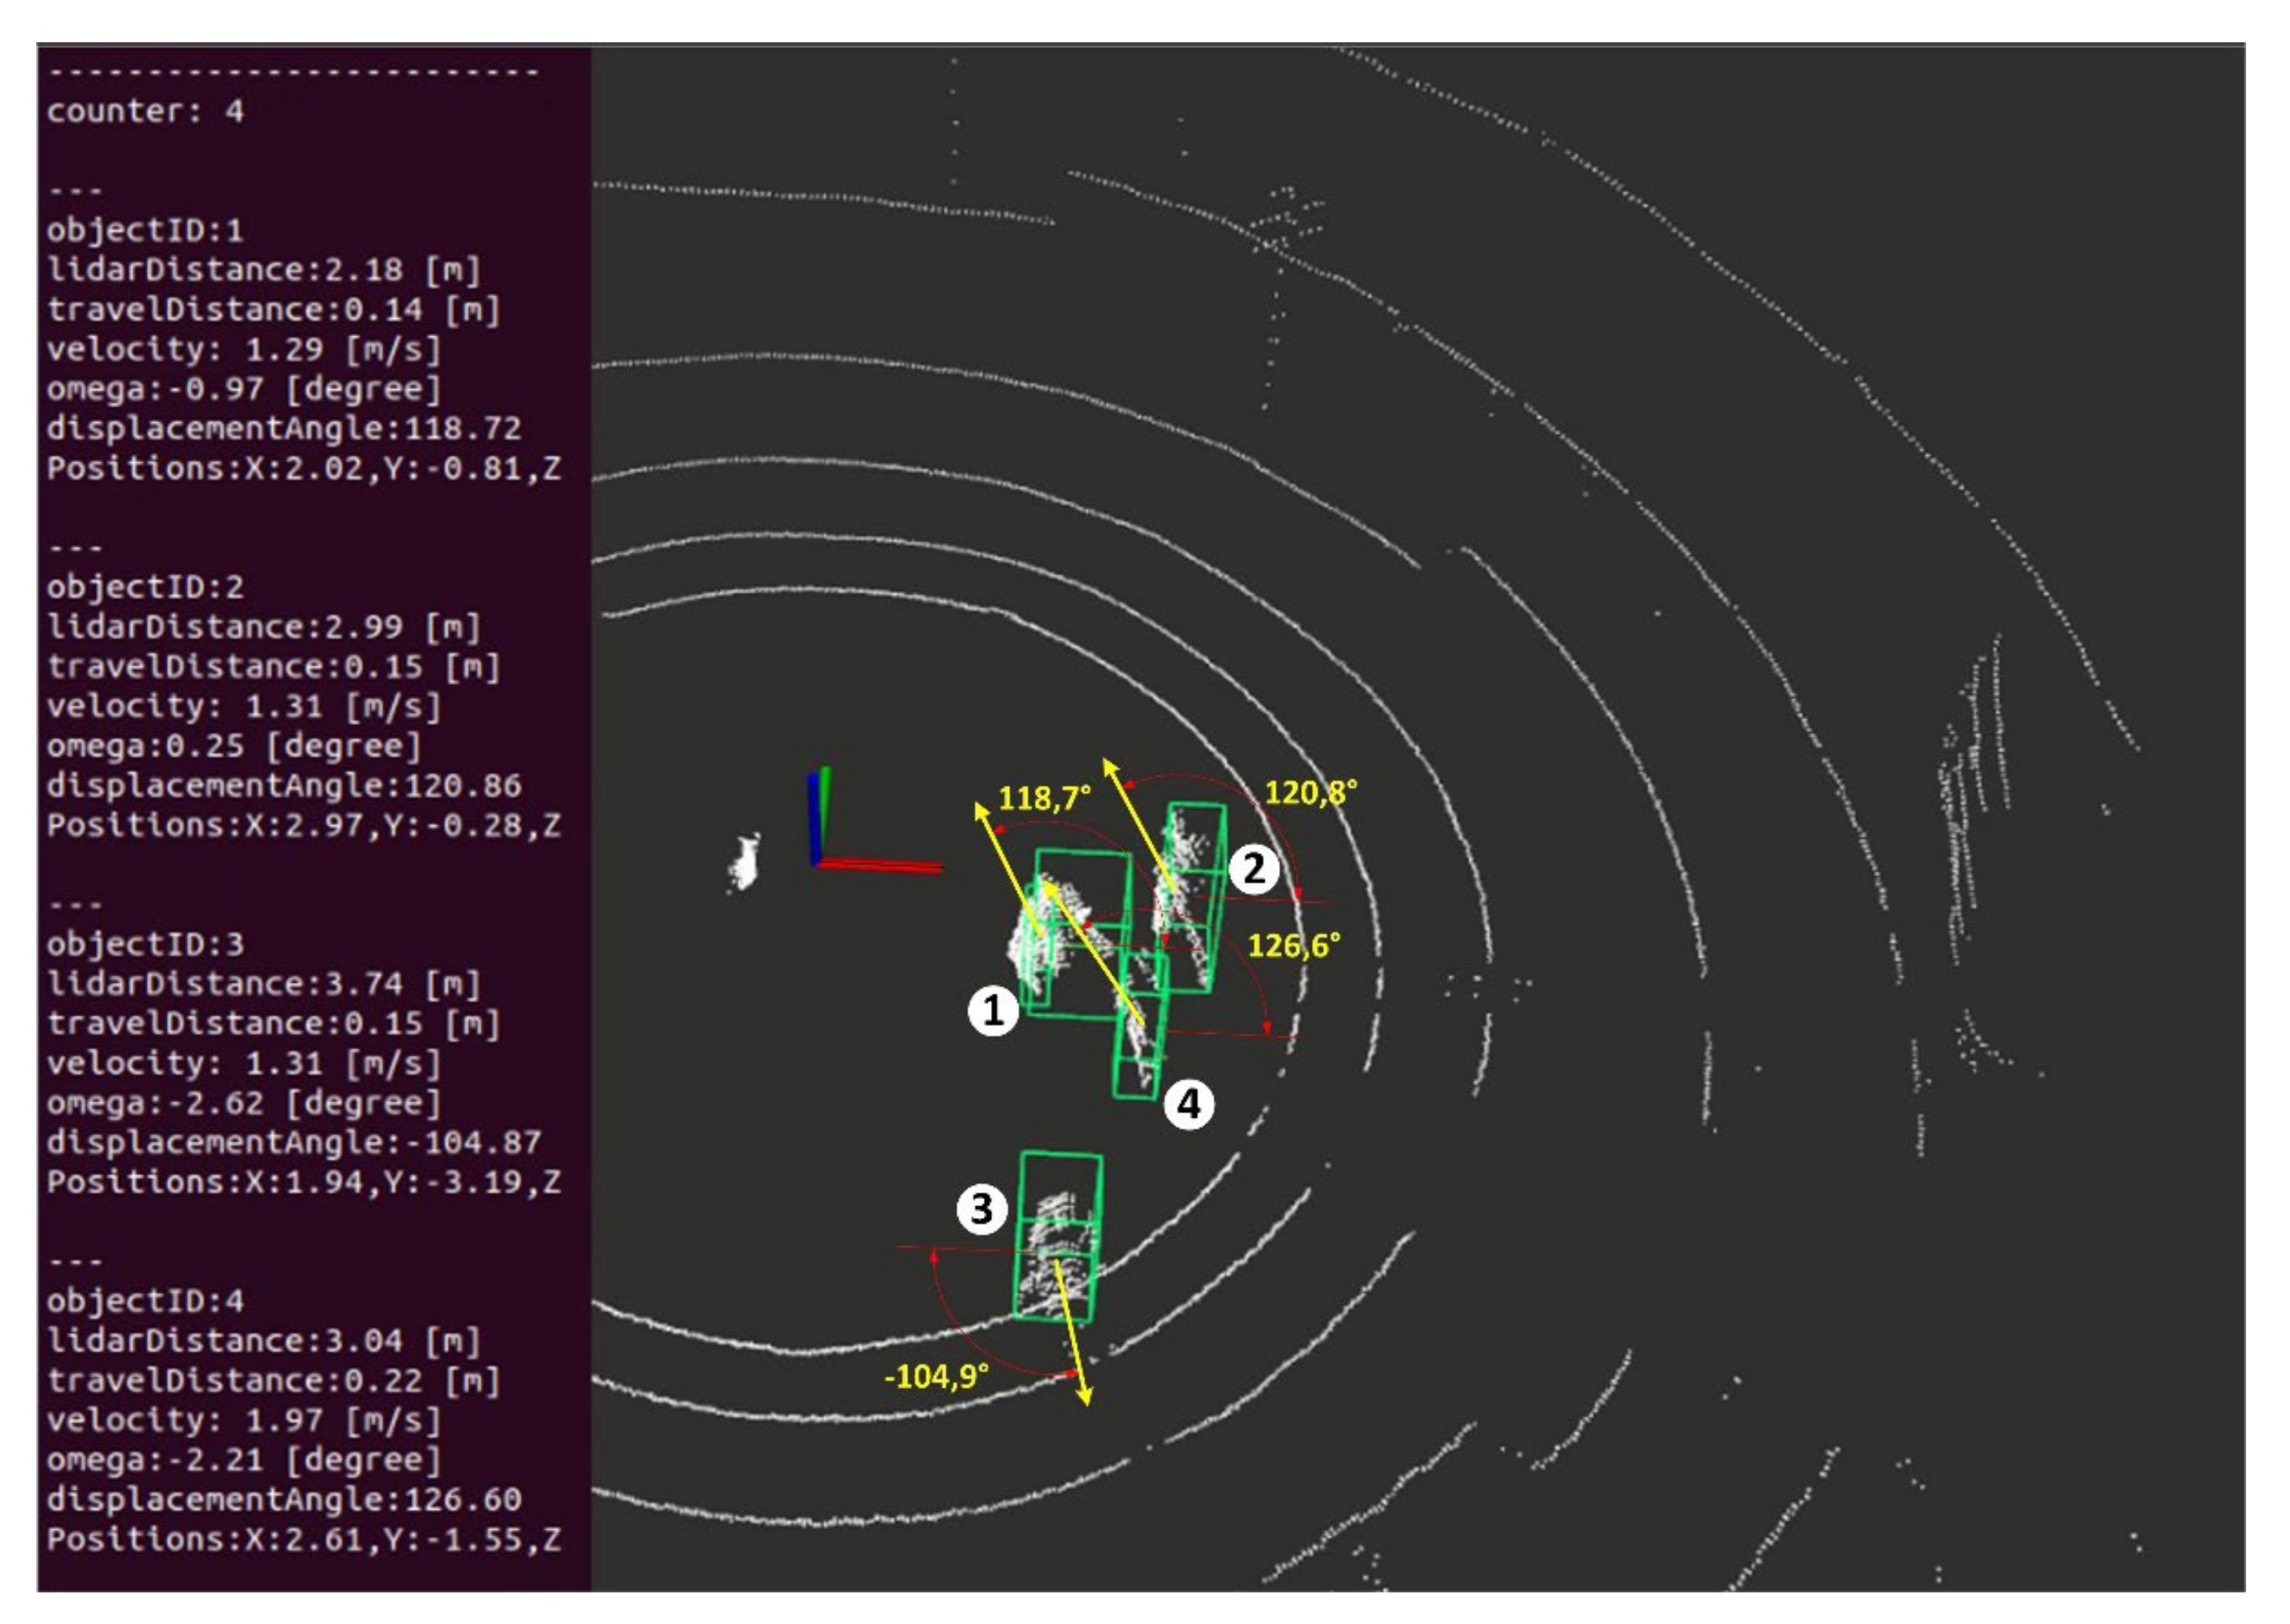
Figure 12 depicts the deployed scenario, where, in this case, we can see a successful detection of four pedestrians, very close to each other, and the information extracted from each of these objects, such as its ID, distance to the LiDAR, distance travelled since the first detection, speed, direction of movement and other information.
Table 3 presents the movement information related to each pedestrian detected.
5. Conclusions
This paper discusses the challenges inherent with pedestrian detection in a smart-city context, using data provided by LiDAR sensors only. It also describes a solution for automatic pedestrian detection and feature extraction using available open source code. Systems such as this are an important asset for municipality management structures to monitor and better understand the flow of pedestrians in their city, mainly for safety monitoring but also to understand city livelihood. The presented solution was developed over an SVM classifier, pretrained for human detection and adapted for outdoor context.
Based on the results, we conclude that installing LiDAR sensors on poles, despite the characteristics referring to having a range of up to 100 m, presents great challenges for the automatic detection of objects at those distances. For an efficient detection in an outdoor scenario in an urban environment, as presented in this work, it is possible to detect pedestrians up to 15 m away, and performance depends on sensor height and inclination, the vibration produced by the motor of the LiDAR, and wind conditions (due to pole movement). Despite these constraints, it was possible to implement a solution capable of detecting pedestrians and produce credible results that can be published by the city monitoring platform. The solution is currently up and running.
The next steps are the inclusion of a real-time visualization tool that plots the most common paths taken by pedestrians and include the detection and classification of cars, bicycles and boats (the city of Aveiro has an inner river where boats/moliceiros travel), and the inclusion of a set of tests to determine the maximum velocity detected by the algorithm (e.g., detecting fast runners).


