


Long-Term Effects of Perceived Friendship with Intelligent Voice Assistants on Usage Behavior, User Experience, and Social Perceptions
 , , , ,
Abstract
:1. Introduction
1.1. Related Work
1.1.1. Voice Assistants as Social Actors in User Relationships
1.1.2. Social Roles of IVAs in Relationships with Users
1.2. Summary and Present Study
Structure of Present Study
- Section 1—Cluster Formation and Time Effects:
- Section 2—Usage Behavior:
- Section 3—User Experience:
- Section 4—Social Perception:
- Section 5—Personality Traits:
2. Method
2.1. Participants
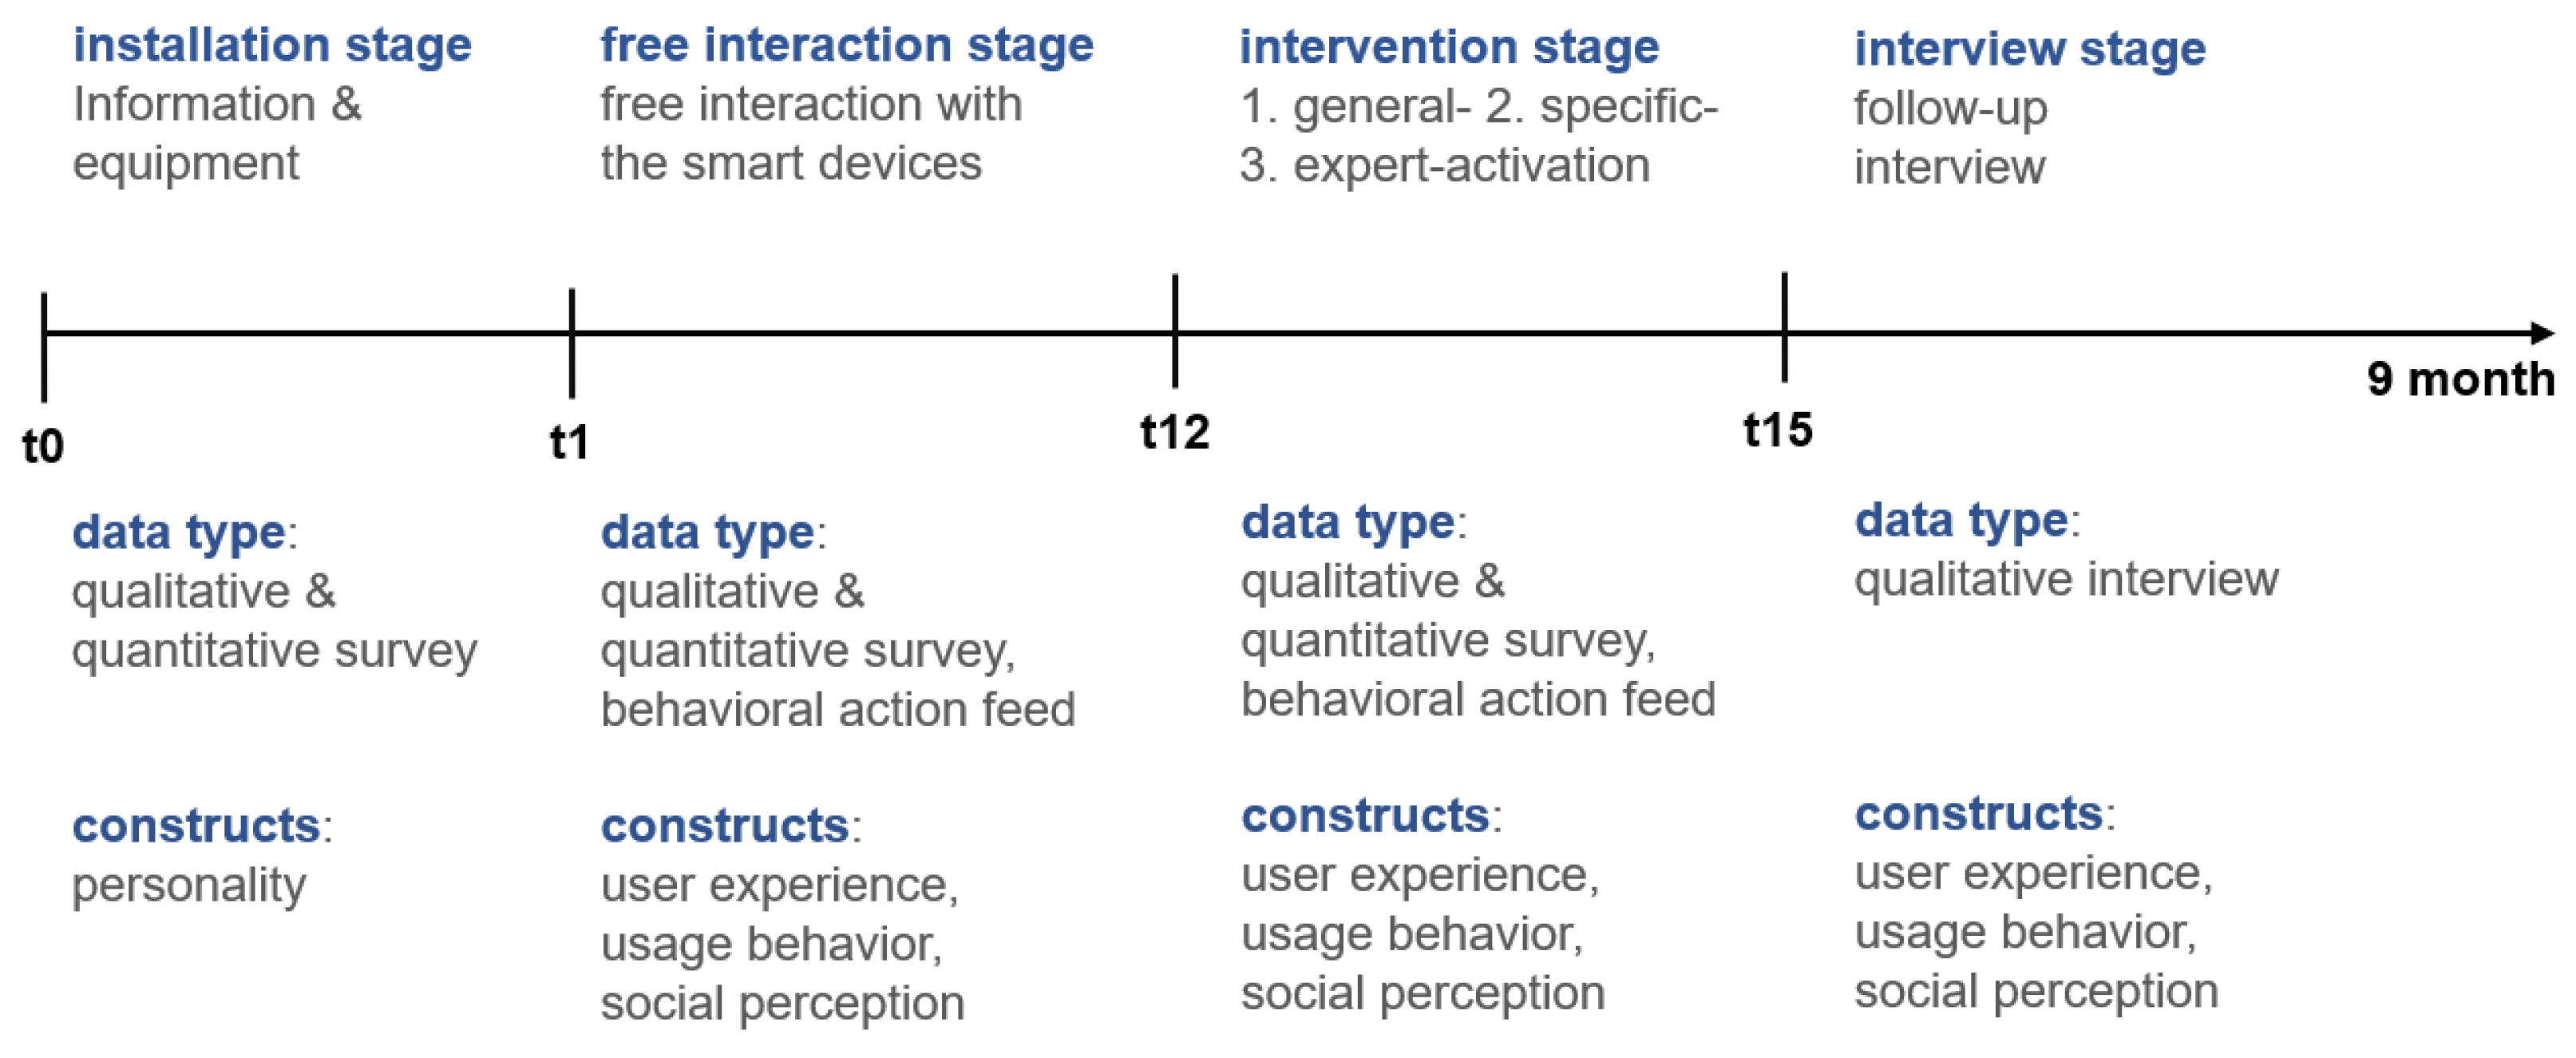
2.2. Procedure
2.3. Data Analysis
3. Measures, Results, and Discussions by Section
3.1. Section 1—Cluster Formation and Time Effects
3.1.1. Measures
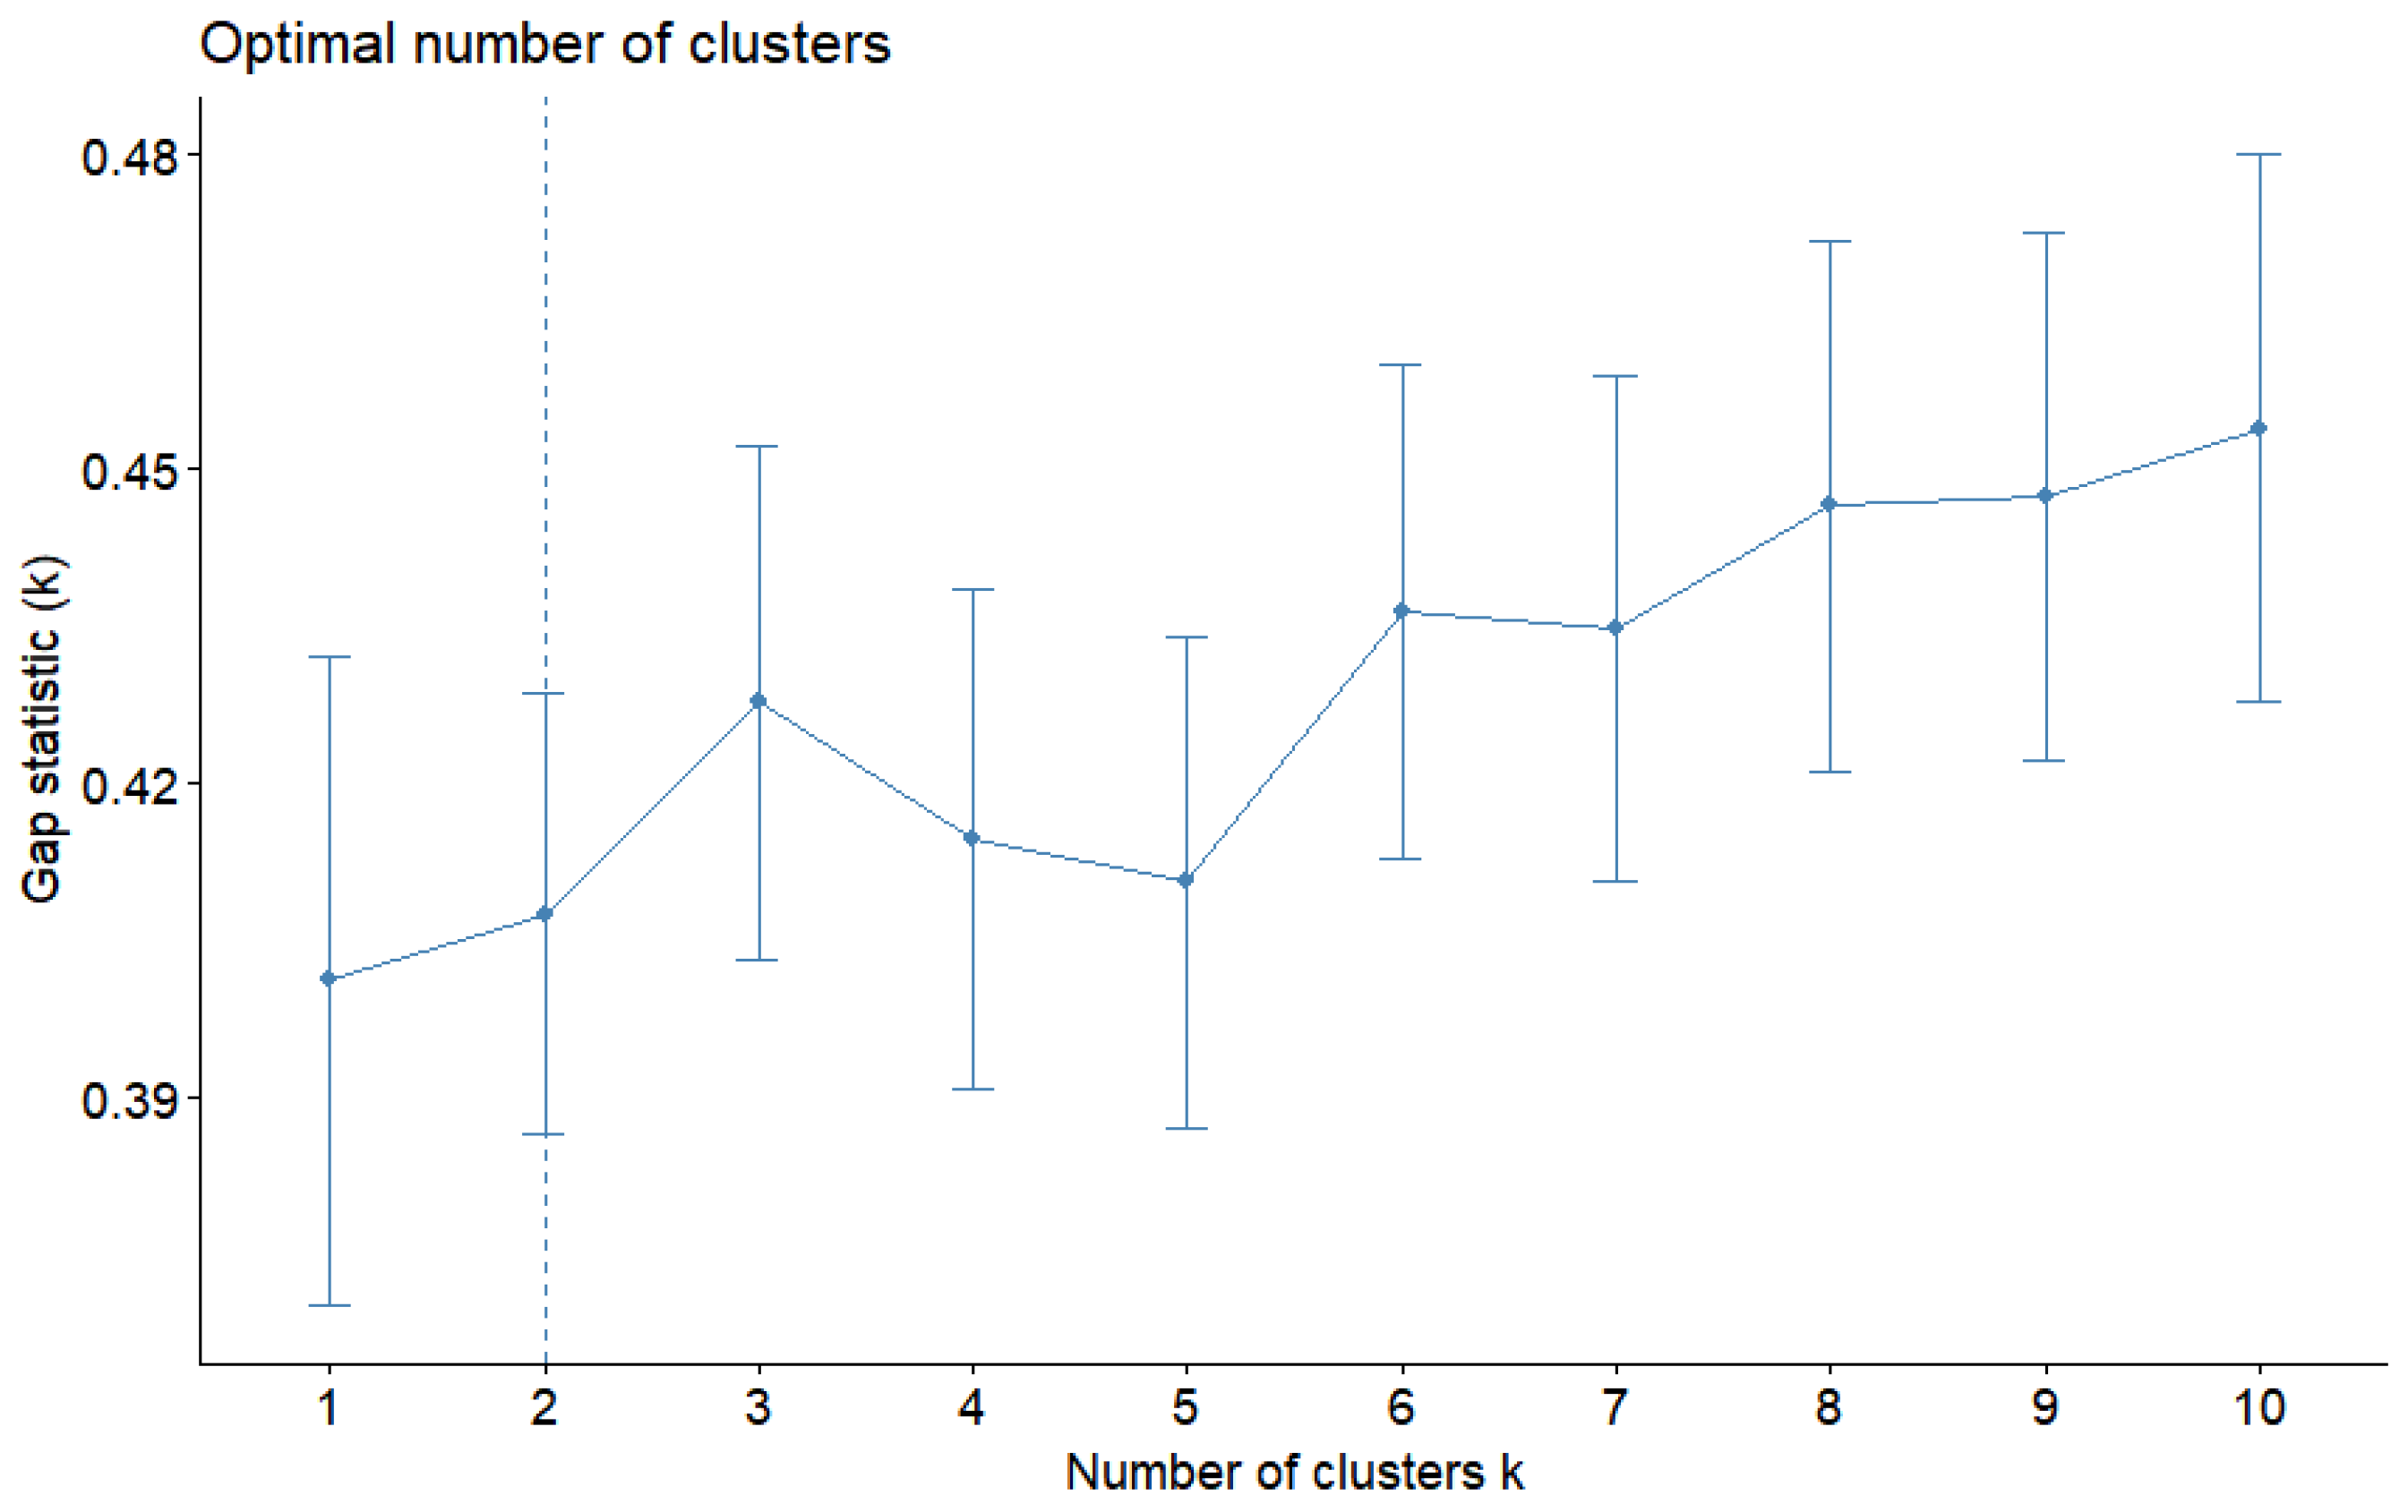
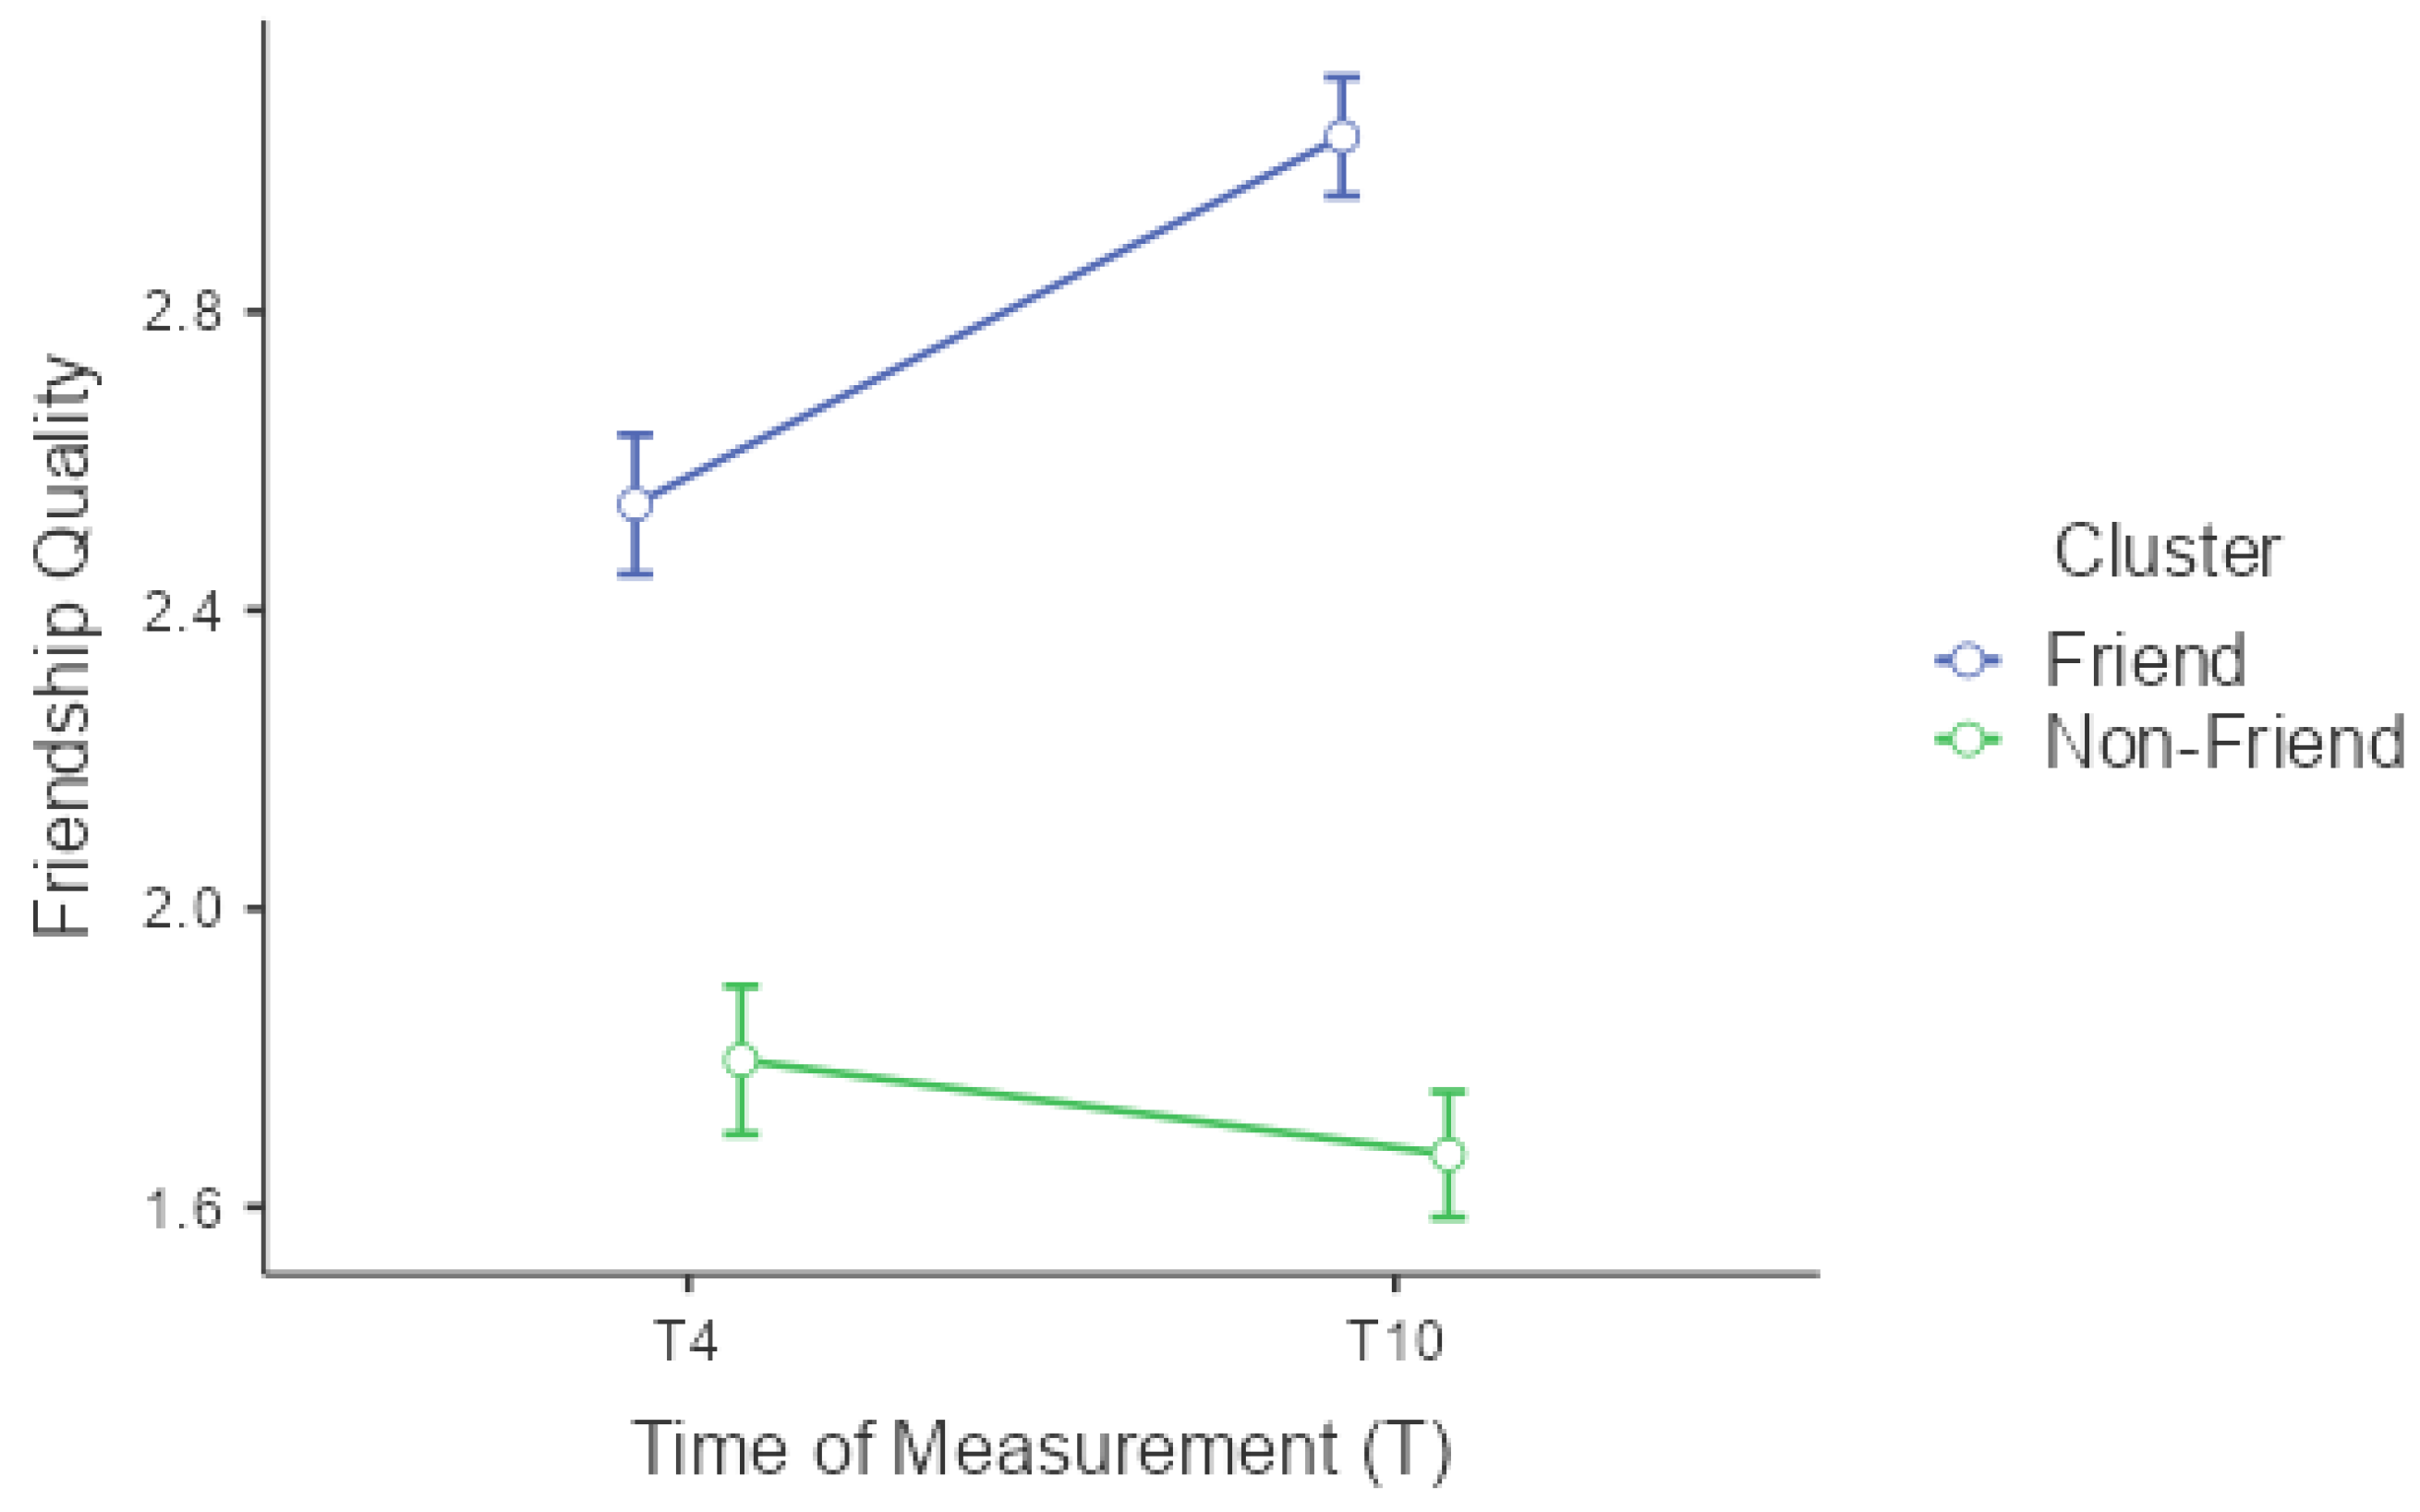
3.1.2. Results
3.1.3. Brief Discussion of Section 1
3.2. Section 2—Usage Behavior
3.2.1. Measures
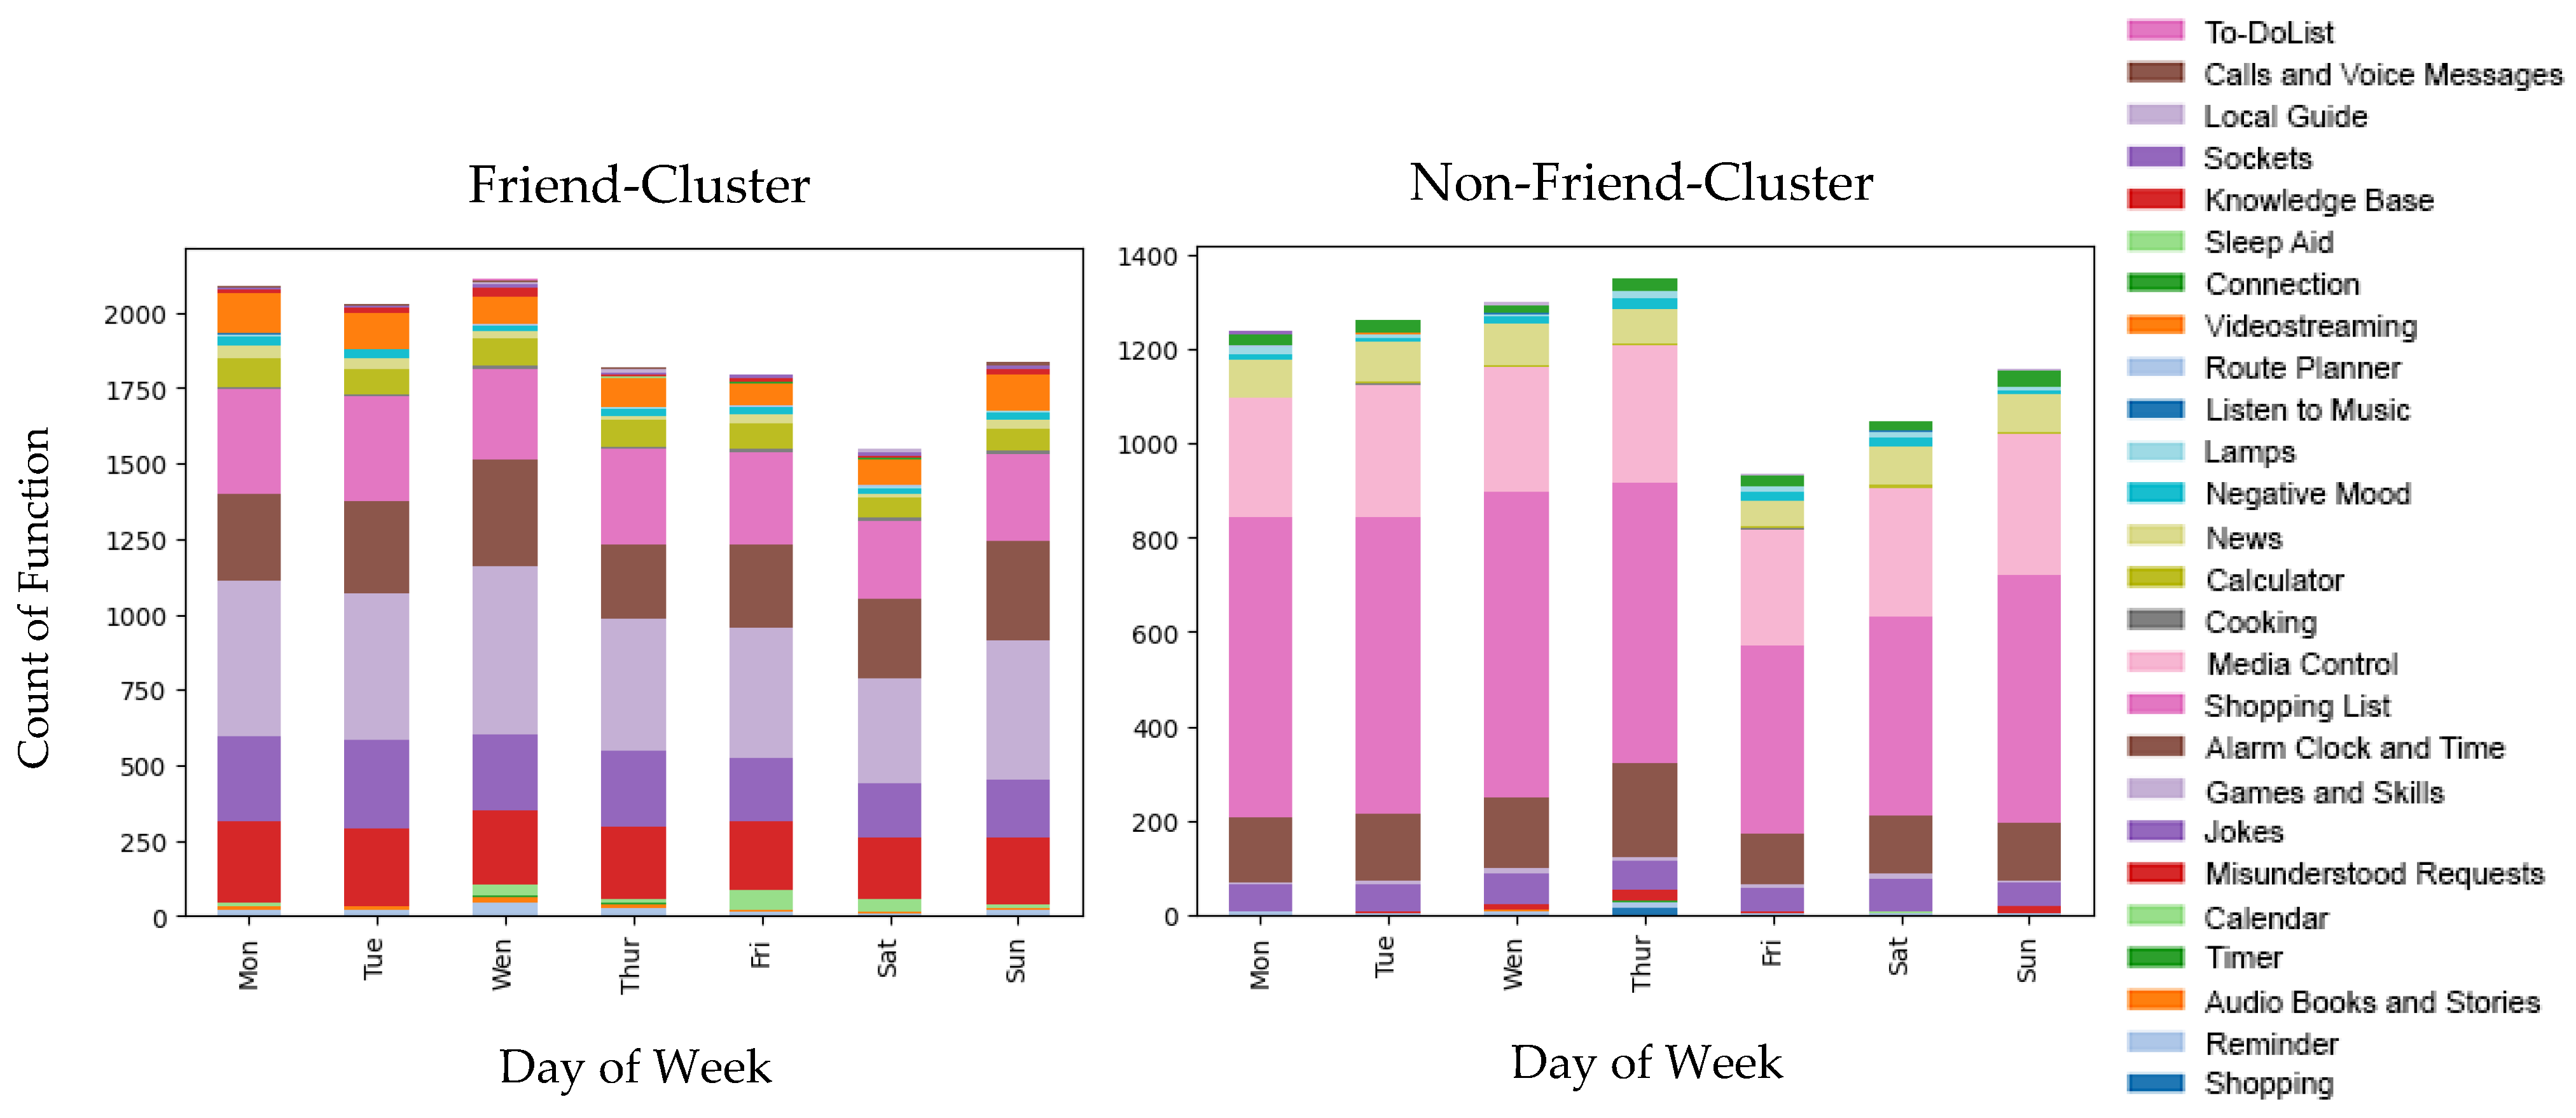
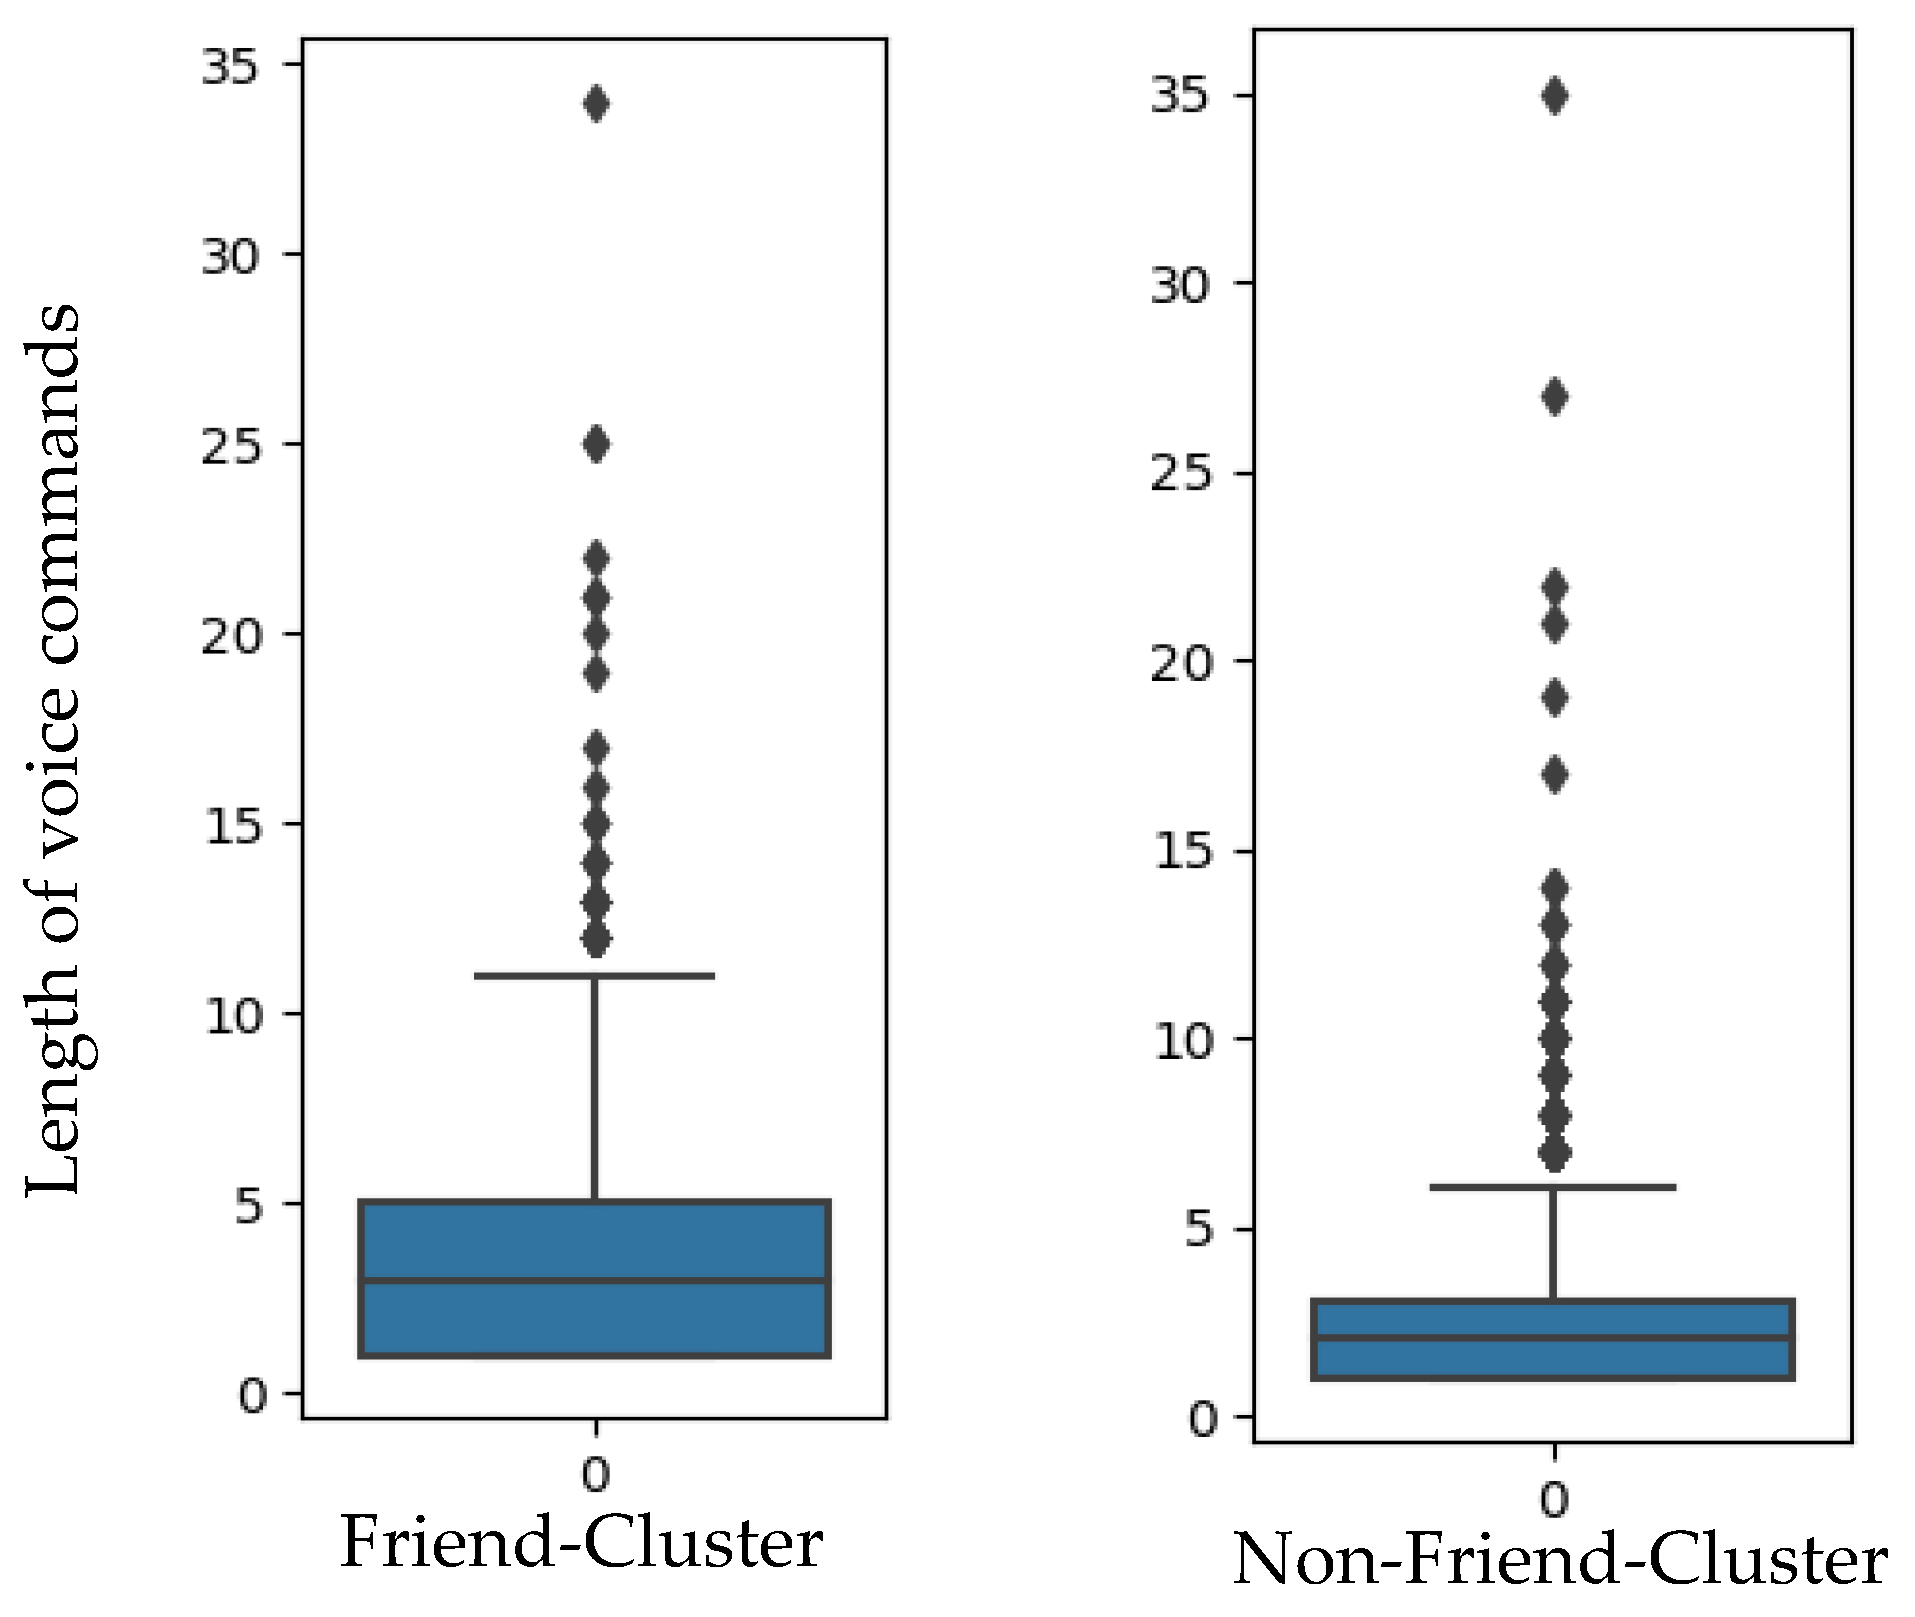
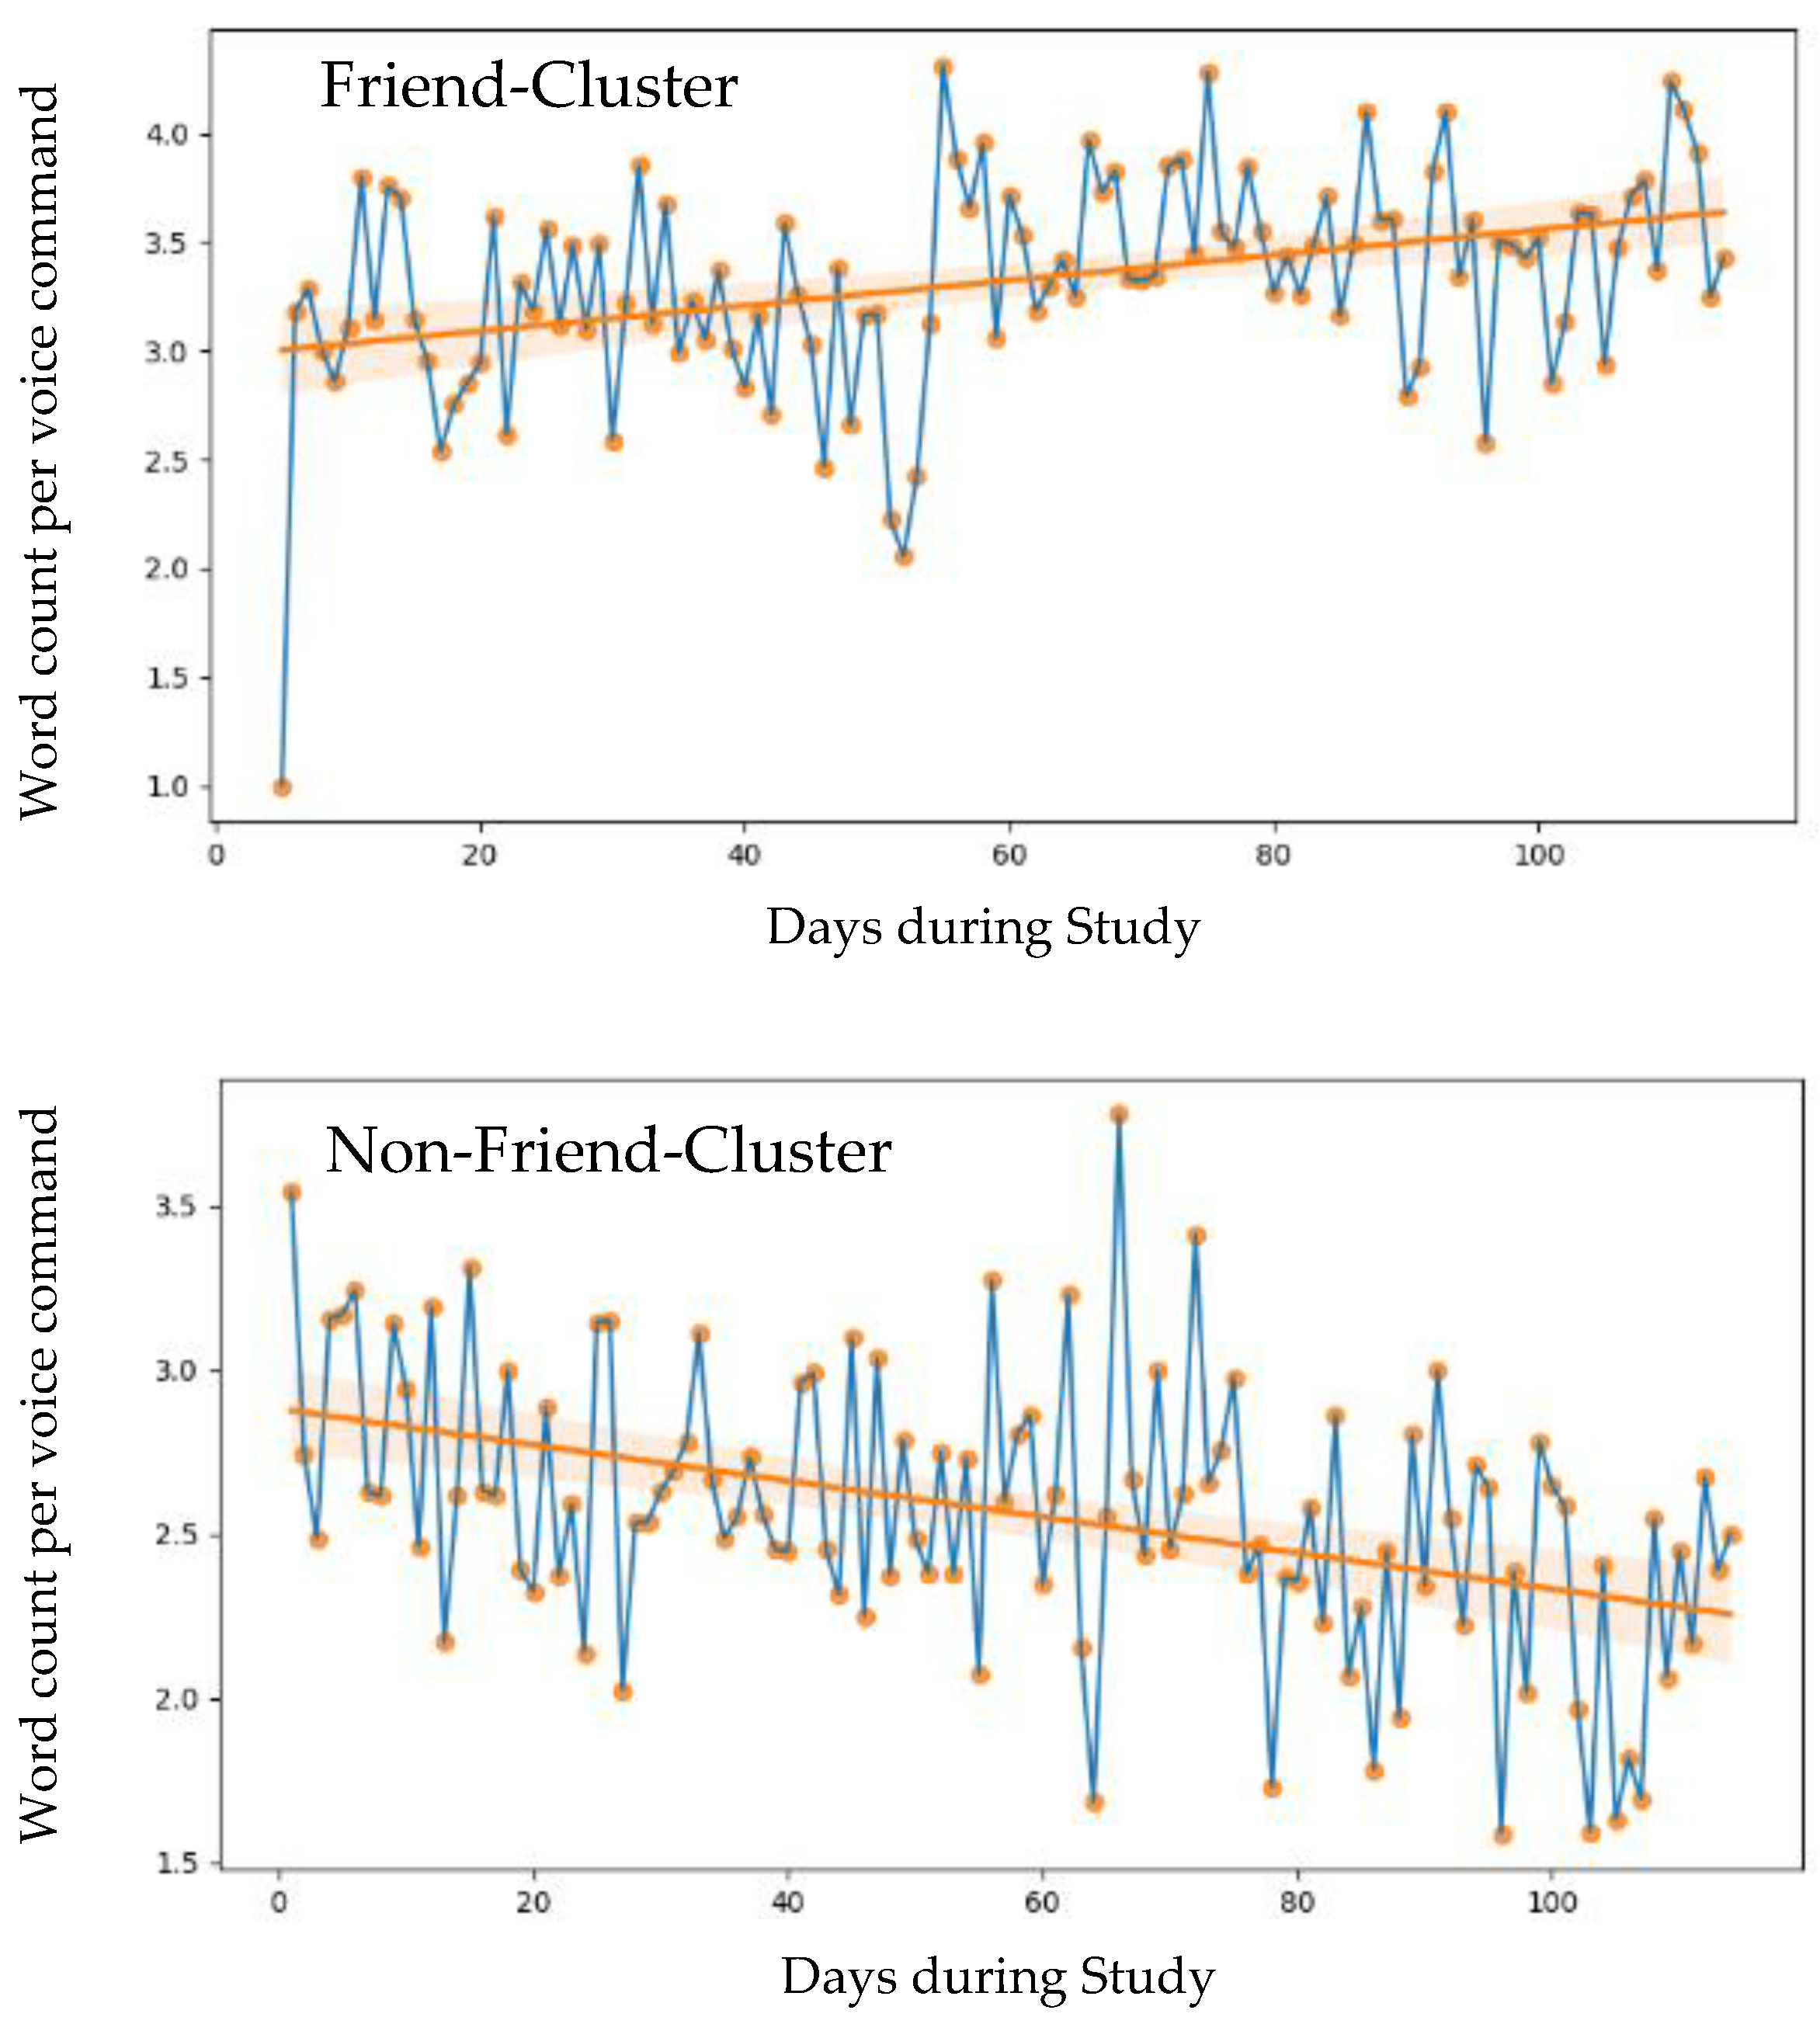
3.2.2. Results
3.2.3. Interaction Modeling
3.2.4. Brief Discussion of Section 2
3.3. Section 3—User Experience
3.3.1. Measures
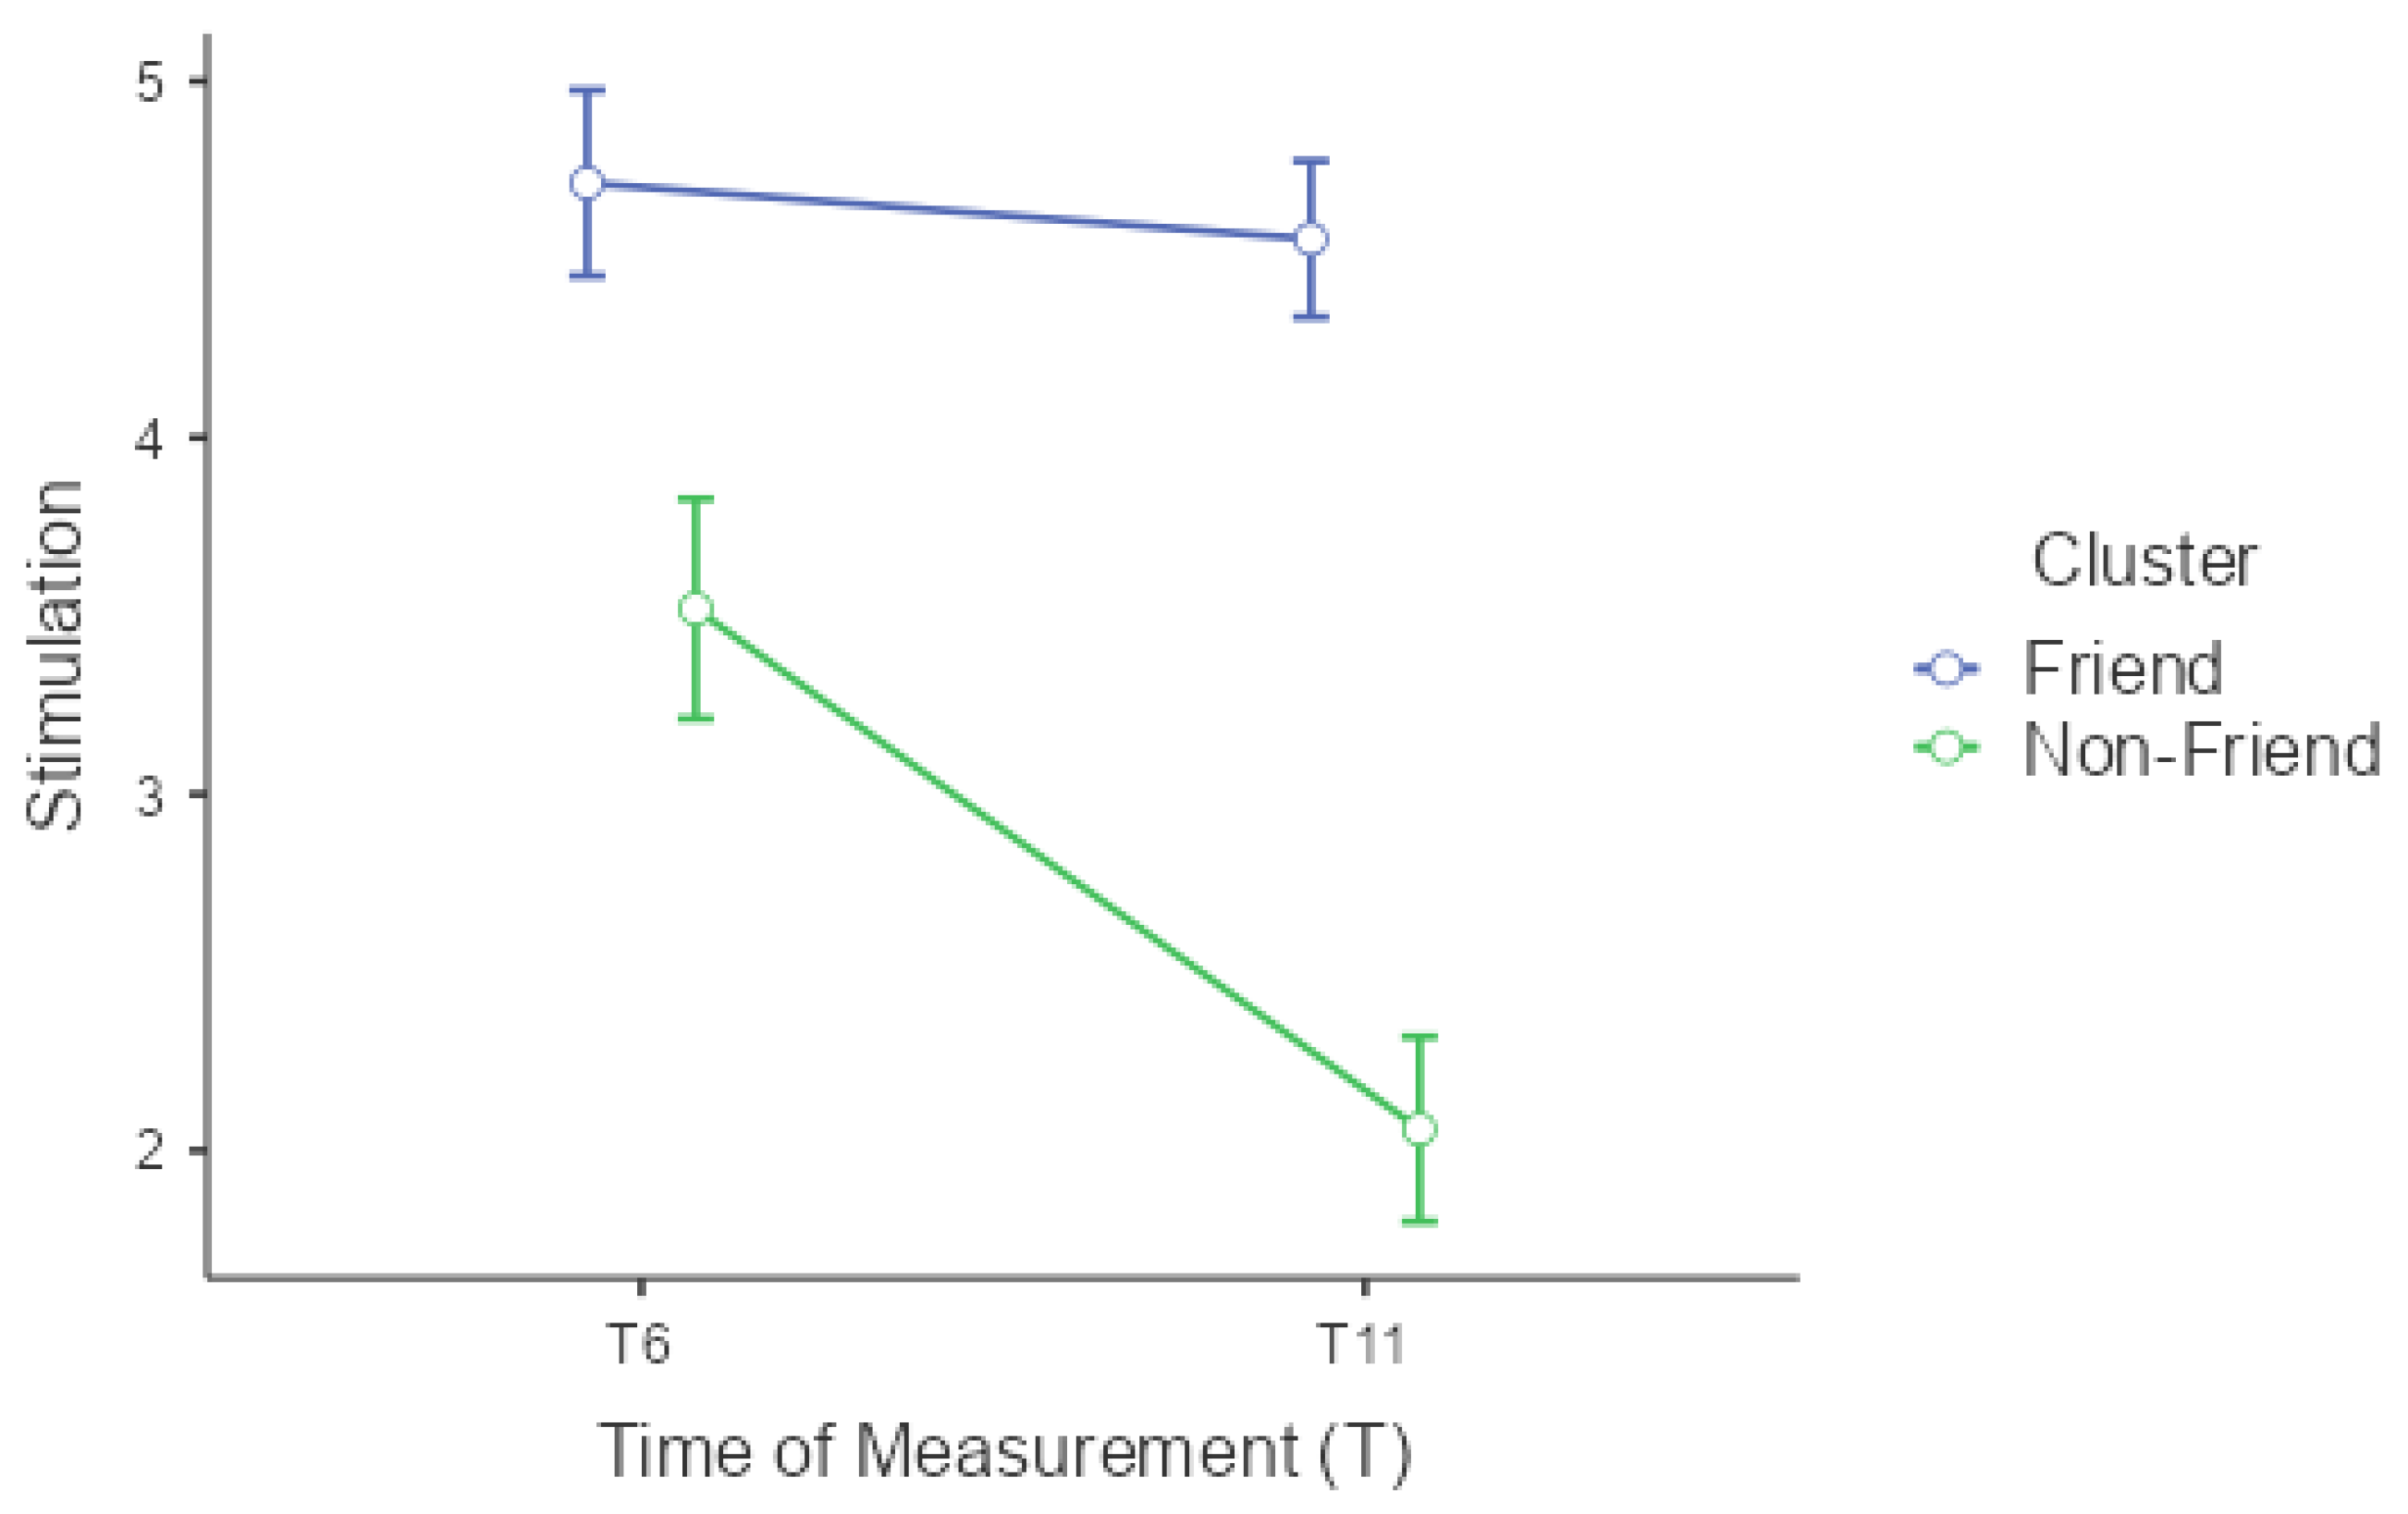
3.3.2. Results

3.3.3. Brief Discussion of Section 3
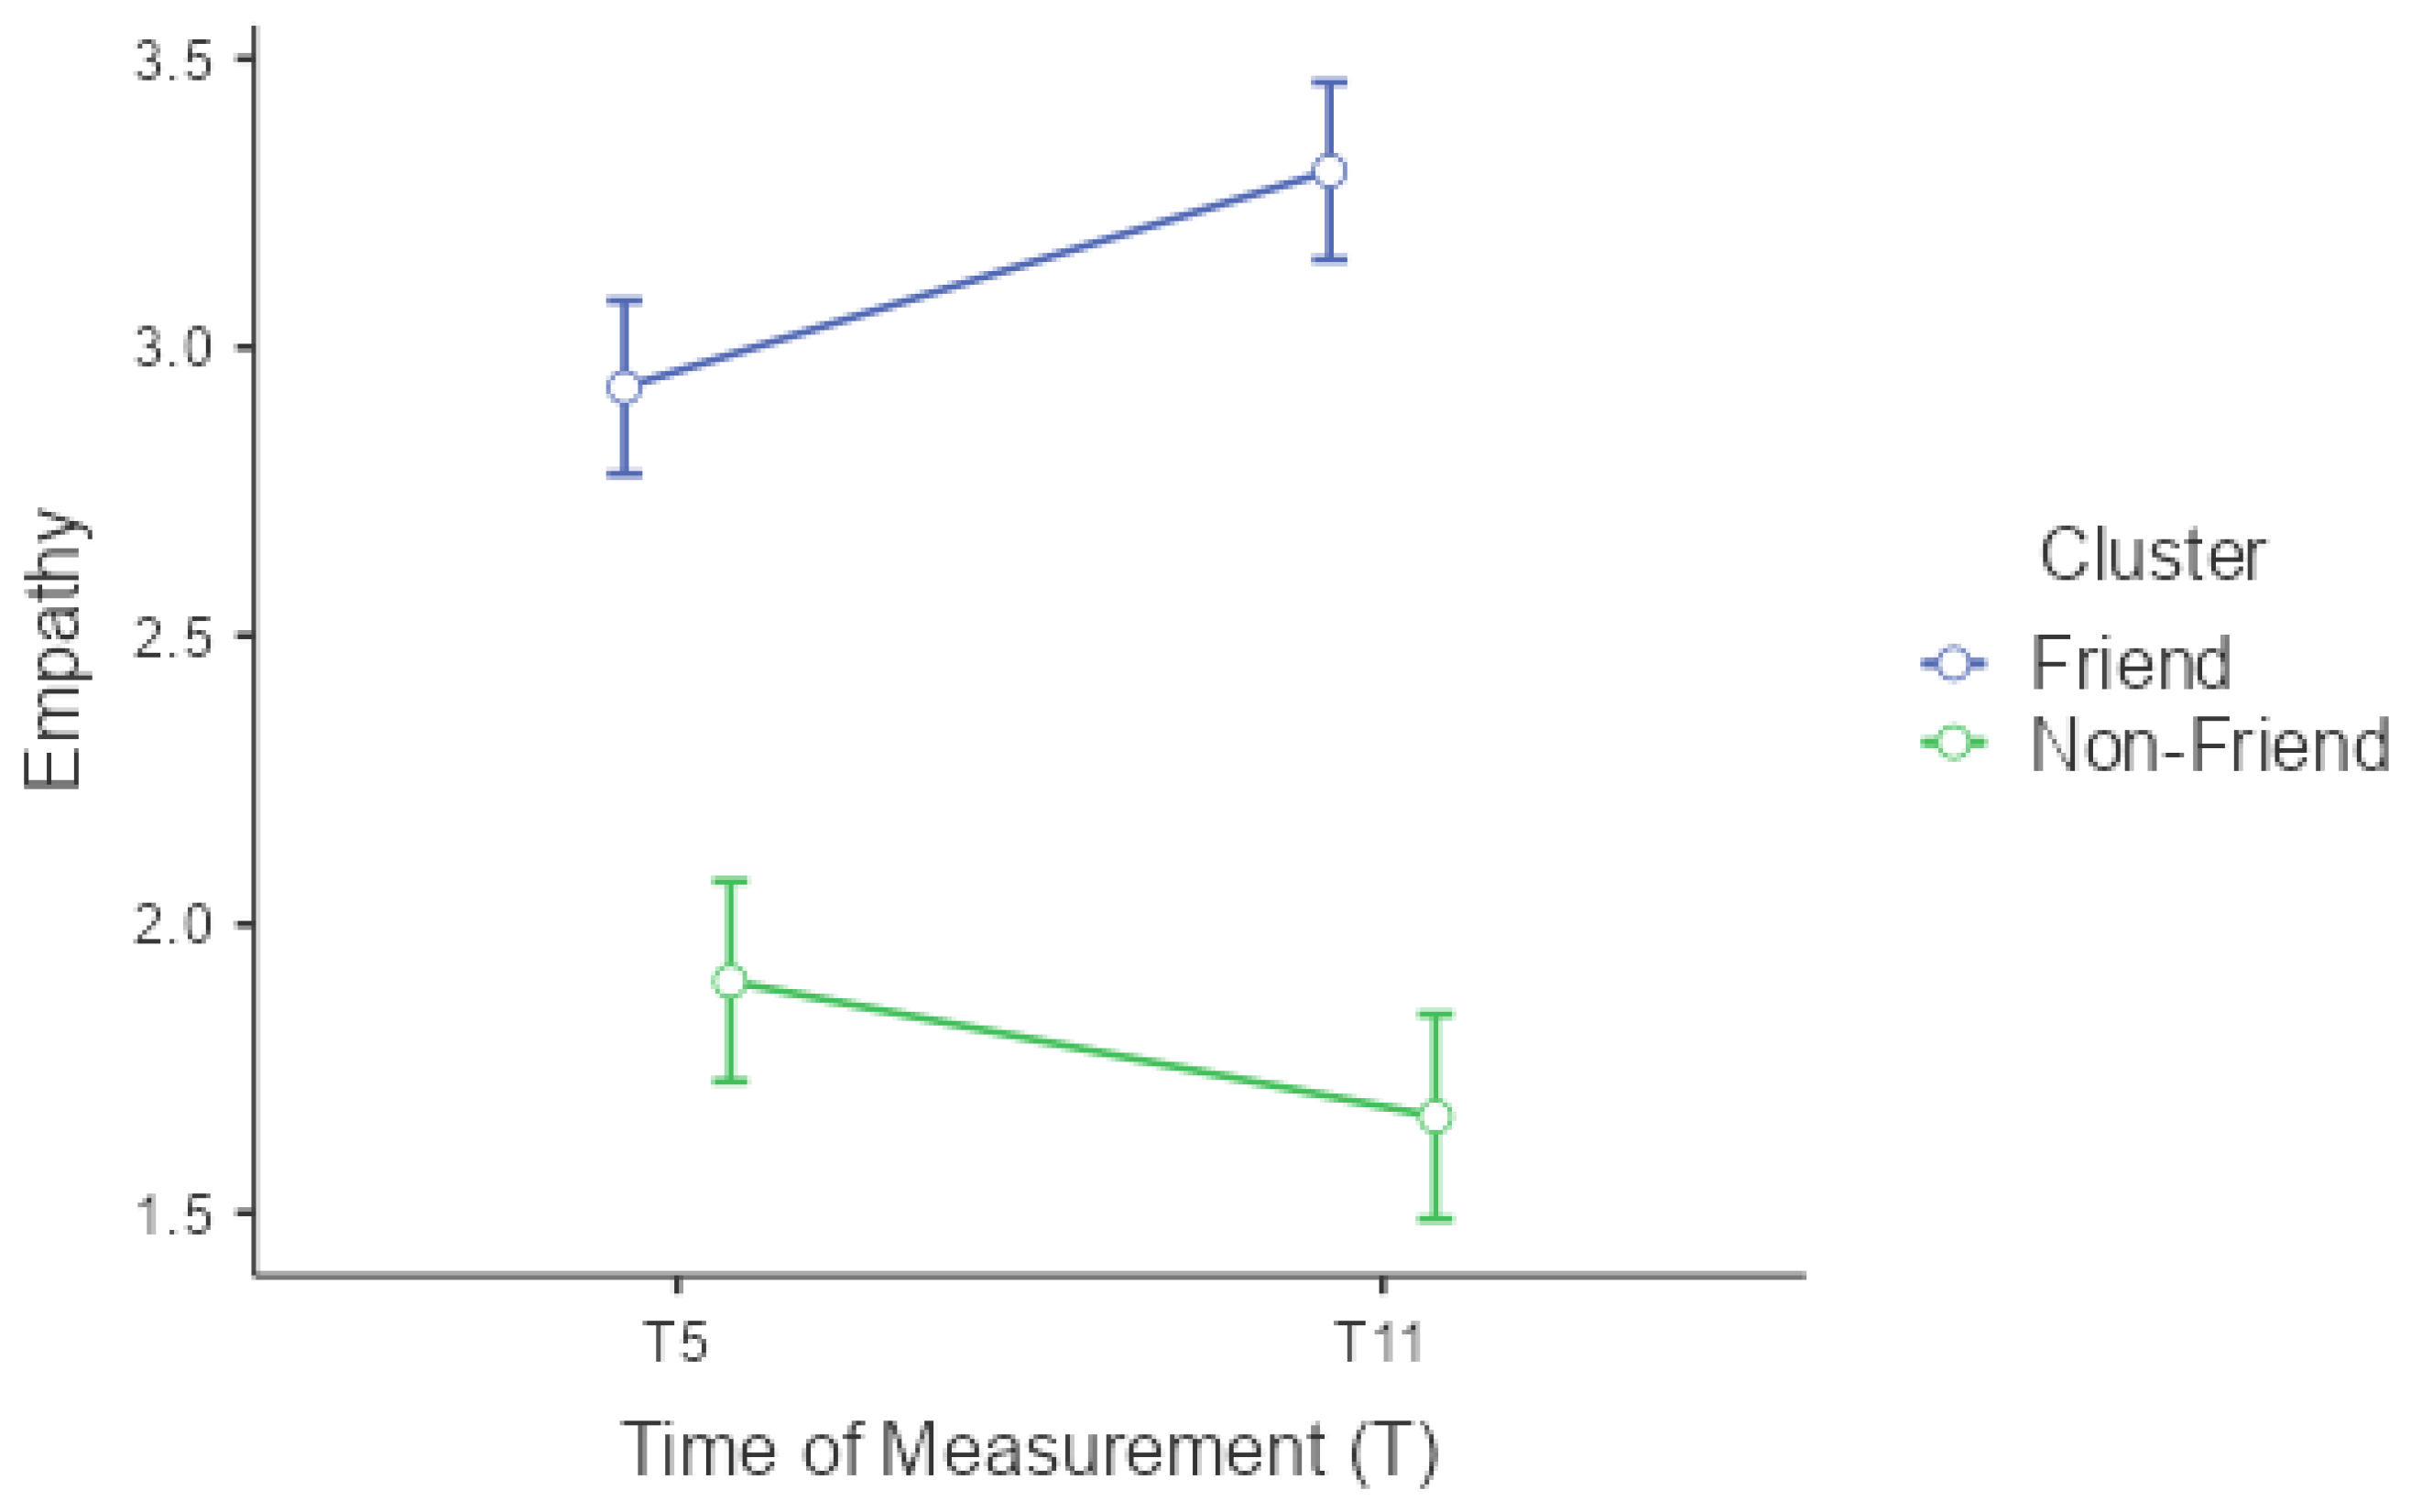
3.4. Section 4—Social Perception
3.4.1. Measures
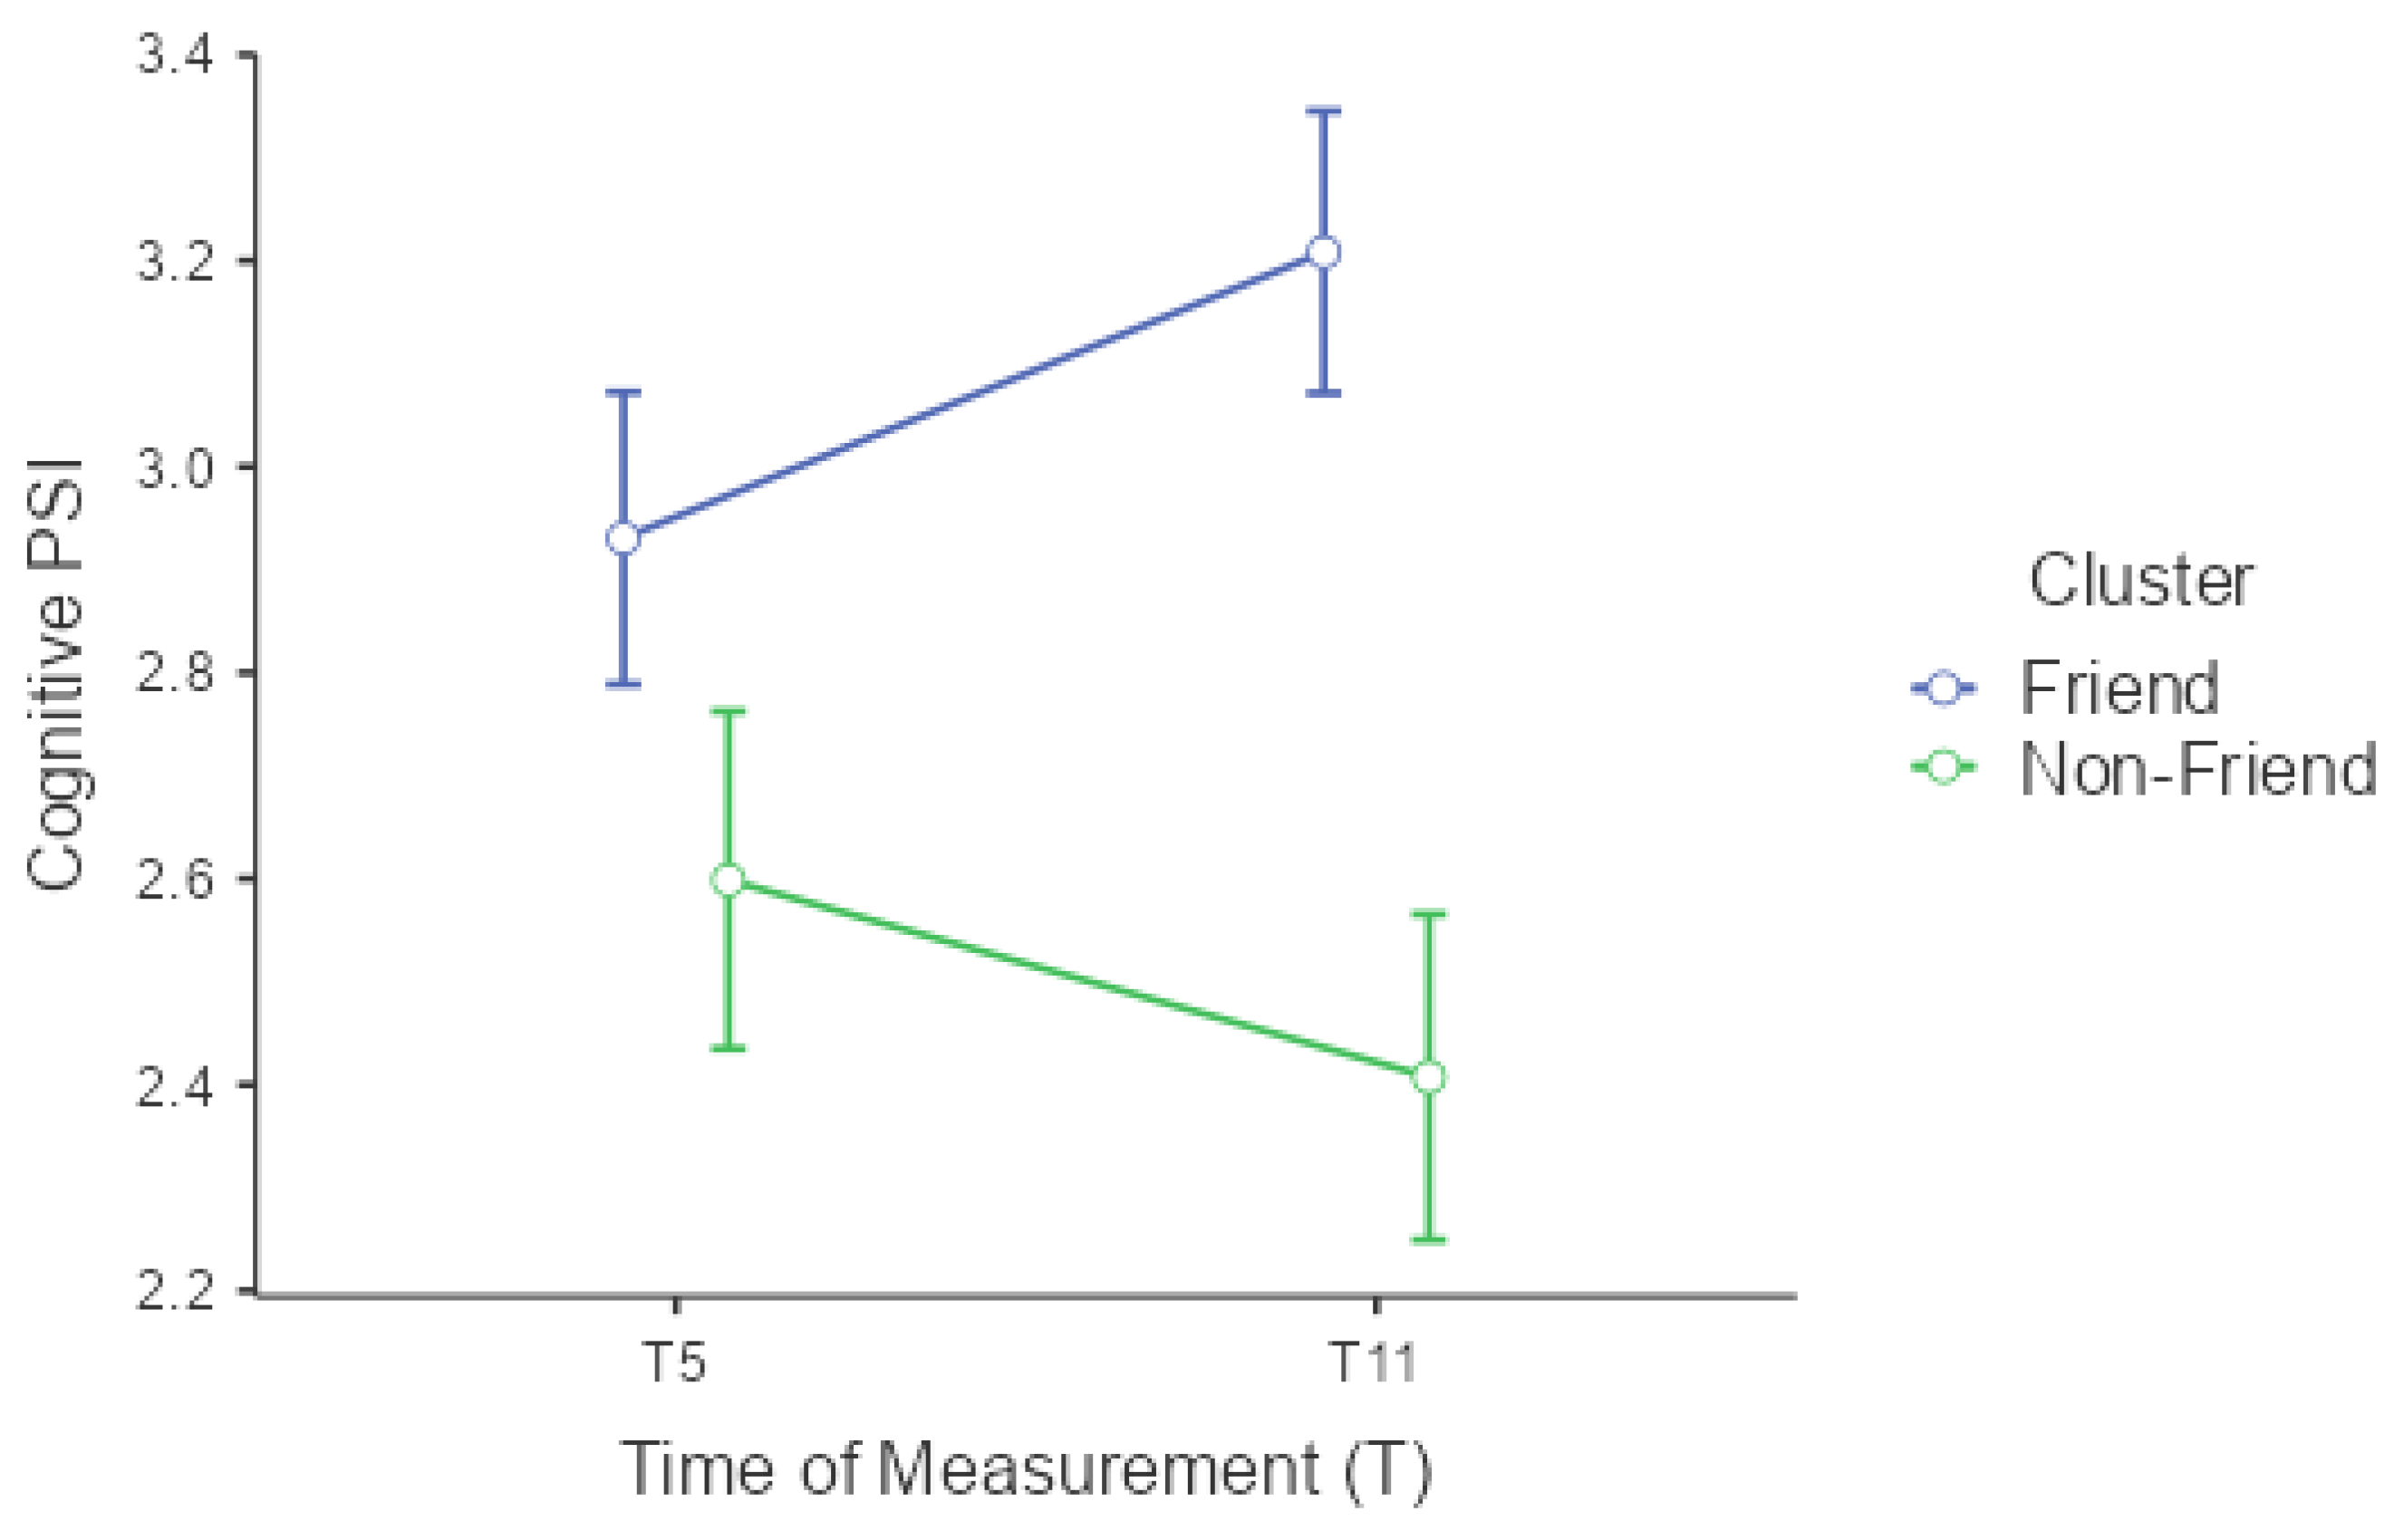
3.4.2. Results
3.4.3. Brief Discussion of Section 4
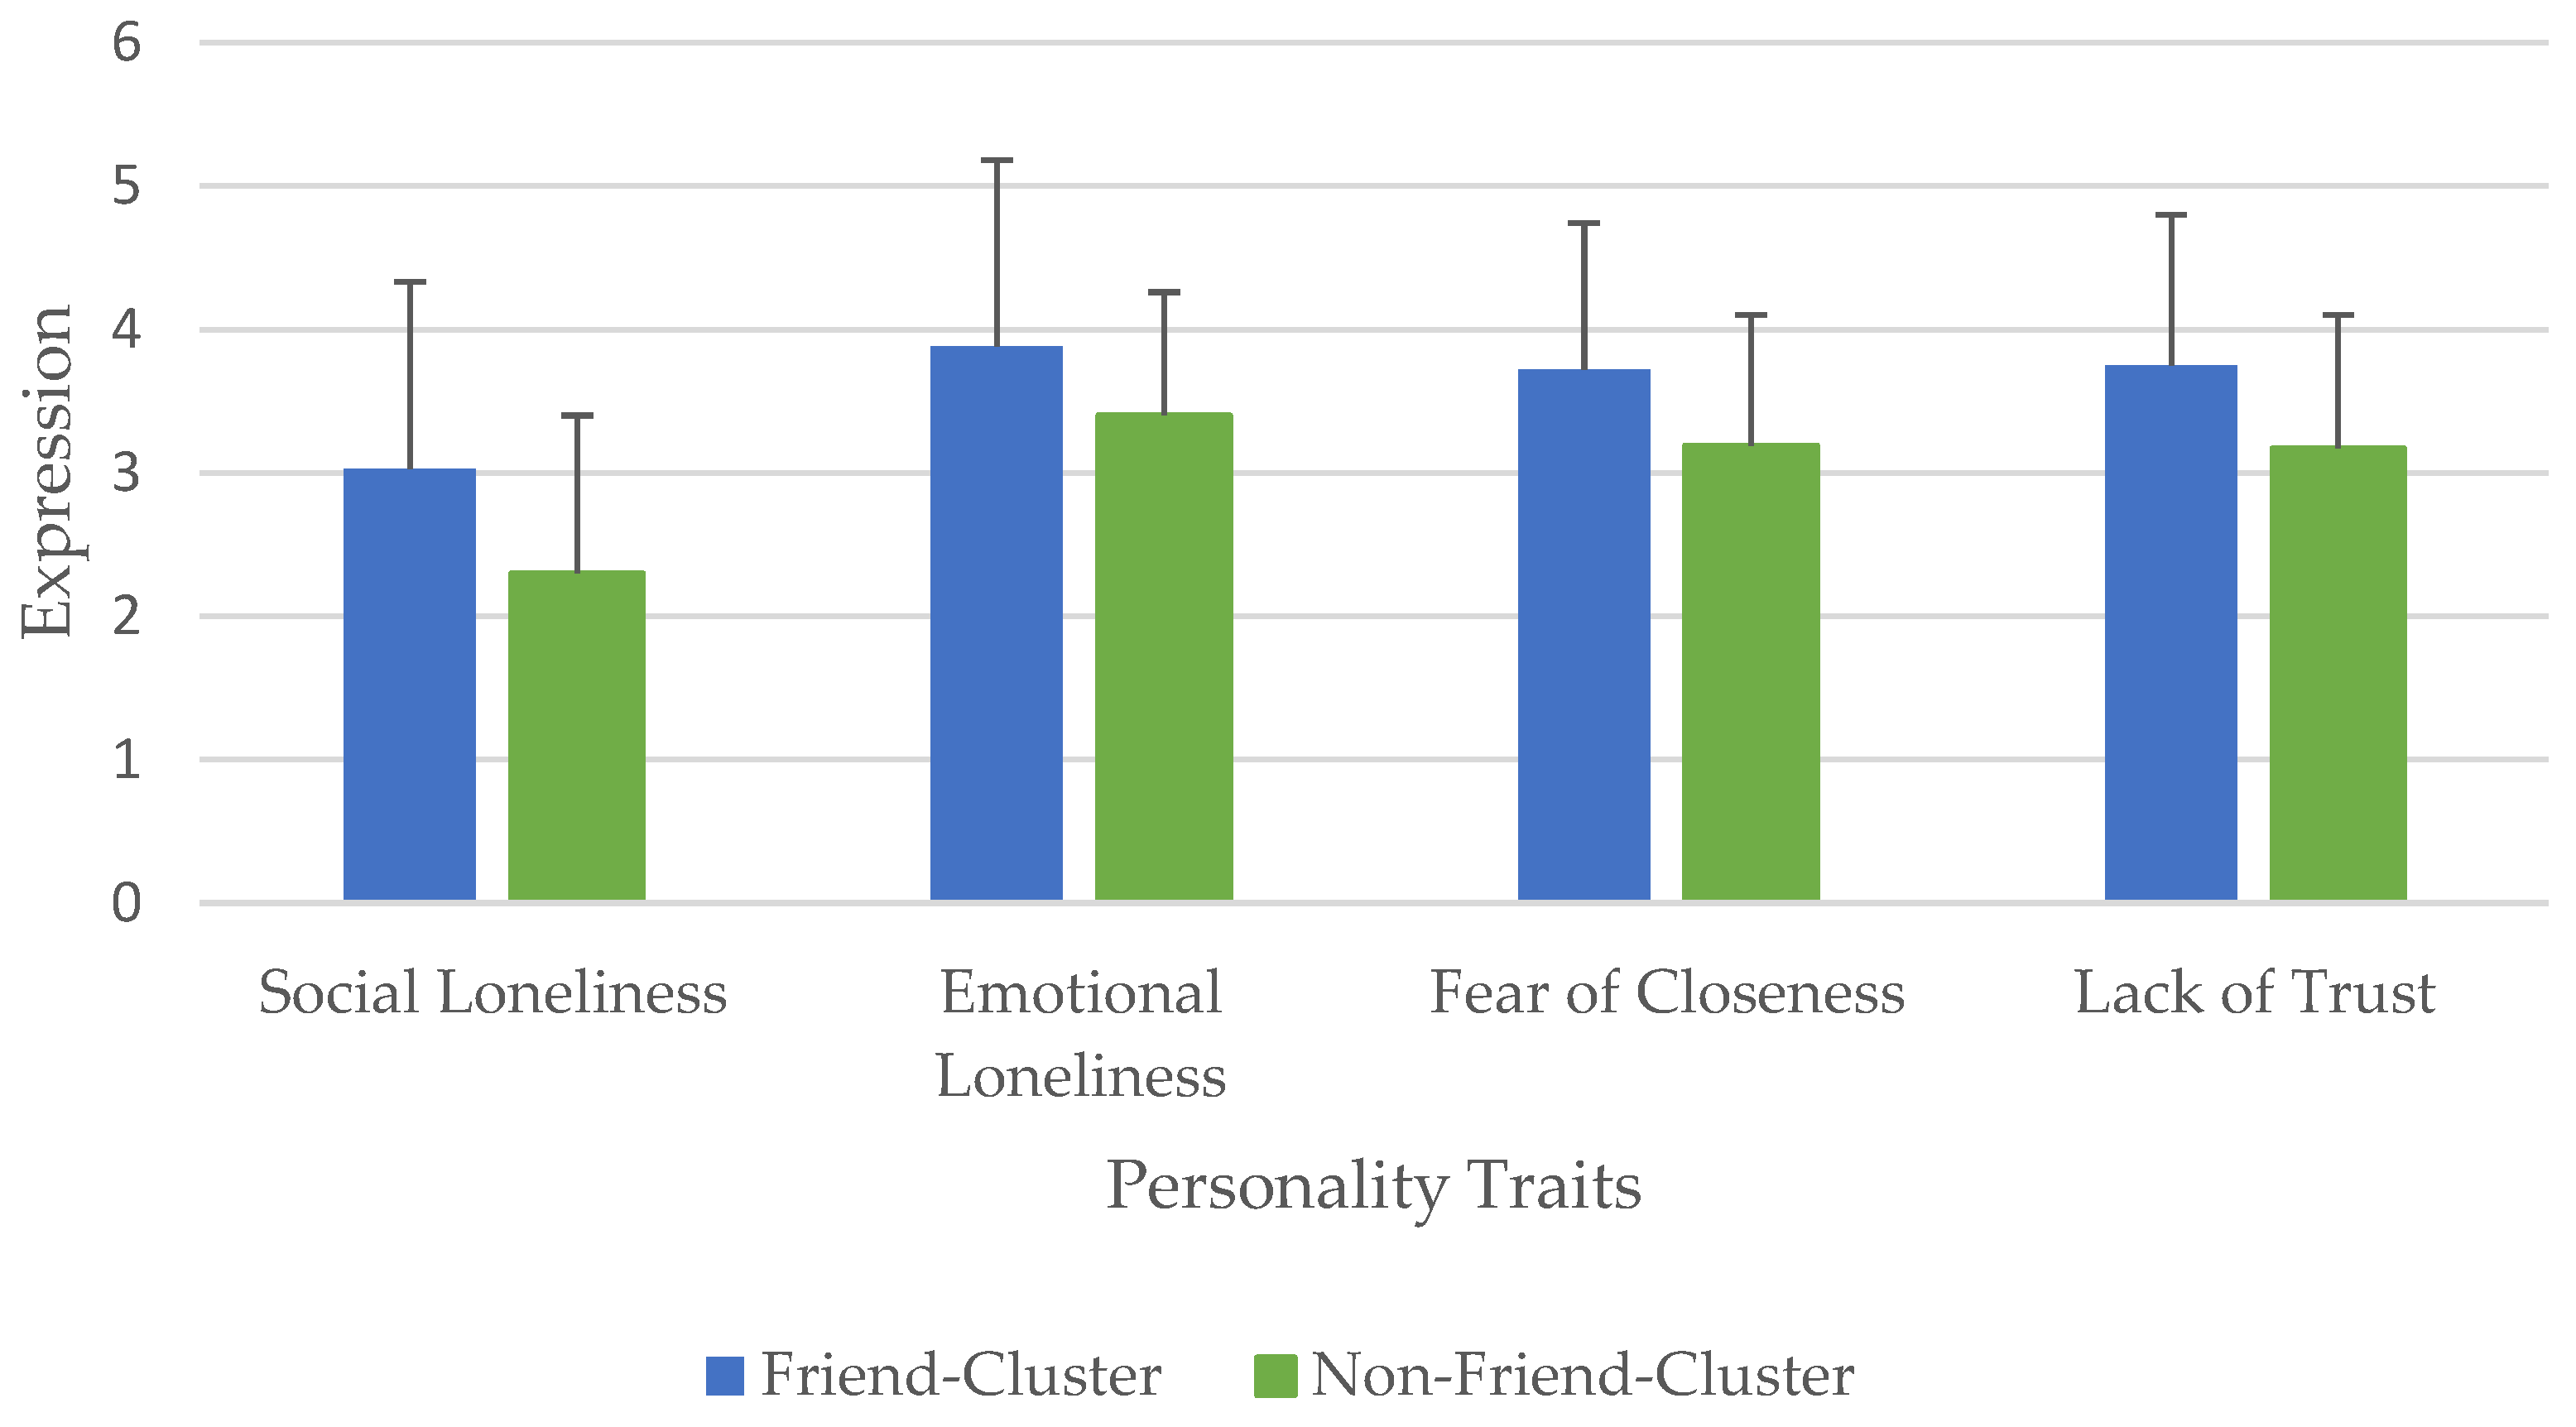
3.5. Section 5—Personality Traits
3.5.1. Measures
3.5.2. Results
3.5.3. Brief Discussion of Section 5
4. General Discussion
4.1. Limitations
4.2. Future Directions
4.3. Conclusions
- Research Highlights
- Users differ in their attribution of friendship qualities to voice assistants and can be grouped as such.
- Users who attribute higher friendship qualities to IVAs are more likely to use them for support functions (e.g., local guide, time queries, calendar) and integrate them into their daily lives.
- Users who attribute higher friendship qualities to IVAs have more of their pragmatic, hedonic, eudaimonic, and social needs met, whereas those who attribute lower friendship qualities perceive interactions with IVAs as less stimulating over time.
- Users who attribute higher friendship qualities to IVAs perceive them to be more socially present, like them more, and assign them a higher status. They also feel more empathy and attachment toward the voice assistant, with perceived empathy and cognitive parasocial interactions increasing over time.
- Users who attribute higher friendship qualities to IVAs scored significantly higher in loneliness and insecure attachment patterns, which may promote their friendship perceptions of IVAs.
Supplementary Materials
Author Contributions
Funding
Institutional Review Board Statement
Informed Consent Statement
Data Availability Statement
Conflicts of Interest
References
- Clark, L.; Doyle, P.; Garaialde, D.; Gilmartin, E.; Schlögl, S.; Edlund, J.; Aylett, M.; Cabral, J.; Munteanu, C.; Edwards, J. The state of speech in HCI: Trends, themes and challenges. Interact. Comput. 2019, 31, 349–371. [Google Scholar] [CrossRef] [Green Version]
- Dunn, J. Virtual assistants like Siri and Alexa look poised to explode. Available online: https://www.businessinsider.com/virtual-assistants-siri-alexa-growth-chart-2016-8 (accessed on 23 February 2023).
- Chattaraman, V.; Kwon, W.-S.; Gilbert, J.E.; Ross, K. Should AI-Based, conversational digital assistants employ social-or task-oriented interaction style? A task-competency and reciprocity perspective for older adults. Comput. Hum. Behav. 2019, 90, 315–330. [Google Scholar] [CrossRef]
- Ki, C.-W.C.; Cho, E.; Lee, J.-E. Can an intelligent personal assistant (IPA) be your friend? Para-friendship development mechanism between IPAs and their users. Comput. Hum. Behav. 2020, 111, 106412. [Google Scholar] [CrossRef]
- Liu, N.; Pu, Q. Can Smart Voice Assistant Induce Social Facilitation Effect? A Preliminary Study. In Proceedings of the International Conference on Human-Computer Interaction, Copenhagen, Denmark, 19–24 July 2020; pp. 616–624. [Google Scholar]
- Carolus, A.; Wienrich, C.; Törke, A.; Friedel, T.; Schwietering, C.; Sperzel, M. ‘Alexa, I feel for you!’ Observers’ empathetic reactions towards a conversational agent. Front. Comput. Sci. 2021, 46, 682982. [Google Scholar] [CrossRef]
- Wienrich, C.; Reitelbach, C.; Carolus, A. The Trustworthiness of Voice Assistants in the Context of Healthcare Investigating the Effect of Perceived Expertise on the Trustworthiness of Voice Assistants, Providers, Data Receivers, and Automatic Speech Recognition. Front. Comput. Sci. 2021, 53, 685250. [Google Scholar] [CrossRef]
- Wu, S.; He, S.; Peng, Y.; Li, W.; Zhou, M.; Guan, D. An empirical study on expectation of relationship between human and smart devices—With smart speaker as an example. In Proceedings of the Fourth International Conference on Data Science in Cyberspace (DSC), Hangzhou, China, 23–25 June 2019; pp. 555–560. [Google Scholar]
- Turk, V. Home invasion. New Sci. 2016, 232, 16–17. [Google Scholar] [CrossRef]
- Purington, A.; Taft, J.G.; Sannon, S.; Bazarova, N.N.; Taylor, S.H. “Alexa is my new BFF” Social Roles, User Satisfaction, and Personification of the Amazon Echo. In Proceedings of the 2017 CHI Conference Extended Abstracts on Human Factors in Computing Systems, Denver, CO, USA, 6–11 May 2017; pp. 2853–2859. [Google Scholar]
- Voit, A.; Niess, J.; Eckerth, C.; Ernst, M.; Weingärtner, H.; Woźniak, P.W. ‘It’s not a romantic relationship’: Stories of Adoption and Abandonment of Smart Speakers at Home. In Proceedings of the 19th International Conference on Mobile and Ubiquitous Multimedia, Essen, Germany, 22–25 November 2020; pp. 71–82. [Google Scholar]
- Bentley, F.; Luvogt, C.; Silverman, M.; Wirasinghe, R.; White, B.; Lottridge, D. Understanding the long-term use of smart speaker assistants. Proc. ACM Interact. Mob. Wearable Ubiquitous Technol. 2018, 2, 1–24. [Google Scholar] [CrossRef]
- Mavrina, L.; Szczuka, J.; Strathmann, C.; Bohnenkamp, L.M.; Krämer, N.; Kopp, S. “Alexa, You’re Really Stupid”: A Longitudinal Field Study on Communication Breakdowns Between Family Members and a Voice Assistant. Front. Comput. Sci. 2022, 4, 791704. [Google Scholar] [CrossRef]
- Carolus, A.; Wienrich, C. Adopting Just Another Digital Assistant or Establishing Social Interactions with a New Friend? Conceptual Research Model of a Long-Term Analysis of First-Time Users’ Adoption and Social Interactions with Smart Speakers. In Proceedings of the Mensch und Computer Conference, Darmstadt, Germany, 4–7 September 2022; pp. 498–502. [Google Scholar]
- Nass, C.; Steuer, J.; Tauber, E.R. Computers are social actors. In Proceedings of the SIGCHI Conference on Human Factors in Computing Systems, Boston, MA, USA, 24–28 April 1994; pp. 72–78. [Google Scholar]
- Kim, Y.; Sundar, S.S. Anthropomorphism of computers: Is it mindful or mindless? Comput. Hum. Behav. 2012, 28, 241–250. [Google Scholar] [CrossRef]
- Frennert, S.; Eftring, H.; Östlund, B. What older people expect of robots: A mixed methods approach. In Proceedings of the International Conference on Social Robotics, Bristol, UK, 27–29 October 2013; pp. 19–29. [Google Scholar]
- Epley, N.; Waytz, A.; Cacioppo, J.T. On Seeing Human: A Three-Factor Theory of Anthropomorphism. Psychol. Rev. 2007, 114, 864–886. [Google Scholar] [CrossRef] [Green Version]
- Russell, S.; Norvig, P. Artificial Intelligence: A Modern Approach; Pearson Education: Munich, Germany, 2020; Volume 3. [Google Scholar]
- Reeves, B.; Nass, C. The media equation: How people treat computers, television, and new media like real people; Cambridge University Press: Cambridge, UK, 1996; Volume 10, p. 236605. [Google Scholar]
- Carolus, A.; Muench, R.; Schmidt, C.; Schneider, F. Impertinent mobiles-Effects of politeness and impoliteness in human-smartphone interaction. Comput. Hum. Behav. 2019, 93, 290–300. [Google Scholar] [CrossRef]
- Karr-Wisniewski, P.; Prietula, M. CASA, WASA, and the dimensions of us. Comput. Hum. Behav. 2010, 26, 1761–1771. [Google Scholar] [CrossRef]
- Gambino, A.; Fox, J.; Ratan, R.A. Building a stronger CASA: Extending the computers are social actors paradigm. Hum.-Mach. Commun. 2020, 1, 71–85. [Google Scholar] [CrossRef] [Green Version]
- Go, E.; Sundar, S.S. Humanizing chatbots: The effects of visual, identity and conversational cues on humanness perceptions. Comput. Hum. Behav. 2019, 97, 304–316. [Google Scholar] [CrossRef]
- Nass, C.I.; Brave, S. Wired for Speech: How Voice Activates and Advances the Human-Computer Relationship; MIT Press Cambridge: Cambridge, MA, USA, 2005. [Google Scholar]
- Sciuto, A.; Saini, A.; Forlizzi, J.; Hong, J.I. “Hey Alexa, What’s Up?” A Mixed-Methods Studies of In-Home Conversational Agent Usage. In Proceedings of the 2018 Designing Interactive Systems Conference, Hong Kong, China, 9–13 June 2018; pp. 857–868. [Google Scholar]
- Couper, M.P.; Tourangeau, R.; Steiger, D.M. Social presence in web surveys. In Proceedings of the SIGCHI Conference on Human Factors in Computing Systems, Seattle, WA, USA, 31 March–5 April 2001; pp. 412–417. [Google Scholar]
- Tourangeau, R.; Couper, M.P.; Steiger, D.M. Humanizing self-administered surveys: Experiments on social presence in web and IVR surveys. Comput. Hum. Behav. 2003, 19, 1–24. [Google Scholar] [CrossRef]
- Dreitzel, H.P. Die Gesellschaftlichen Leiden Und Das Leiden an der Gesellschaft. Vorstudien zu Einer Pathologie des Rollenverhaltens; F. Enke Verlag: Stuttgart, Germany, 1968; pp. 10–17. [Google Scholar]
- Warpefelt, H.; Verhagen, H. A model of non-player character believability. J. Gaming Virtual Worlds 2017, 9, 39–53. [Google Scholar] [CrossRef] [PubMed]
- Wang, X.; Wang, B.; Han, G.; Zhang, H.; Xie, X. Is It Just a Tool Or Is It a Friend?: Exploring Chinese Users’ Interaction and Relationship with Smart Speakers. In Perceiving the Future through New Communication Technologies: Robots, AI and Everyday Life; Springer: Berlin/Heidelberg, Germany, 2021; pp. 129–146. [Google Scholar]
- Wagner, L. Good character is what we look for in a friend: Character strengths are positively related to peer acceptance and friendship quality in early adolescents. J. Early Adolesc. 2019, 39, 864–903. [Google Scholar] [CrossRef]
- Schweitzer, F.; Belk, R.; Jordan, W.; Ortner, M. Servant, friend or master? The relationships users build with voice-controlled smart devices. J. Mark. Manag. 2019, 35, 693–715. [Google Scholar] [CrossRef]
- Rhee, C.E.; Choi, J. Effects of personalization and social role in voice shopping: An experimental study on product recommendation by a conversational voice agent. Comput. Hum. Behav. 2020, 109, 106359. [Google Scholar] [CrossRef]
- Han, S.; Yang, H. Understanding adoption of intelligent personal assistants: A parasocial relationship perspective. Ind. Manag. Data Syst. 2018, 118, 618–636. [Google Scholar] [CrossRef]
- Youn, S.; Jin, S.V. “In A.I. we trust?” The effects of parasocial interaction and technopian versus luddite ideological views on chatbot-based customer relationship management in the emerging “feeling economy”. Comput. Hum. Behav. 2021, 119, 106721. [Google Scholar] [CrossRef]
- Rubin, A.M.; Perse, E.M.; Powell, R.A. Loneliness, parasocial interaction, and local television news viewing. Hum. Commun. Res. 1985, 12, 155–180. [Google Scholar] [CrossRef]
- Horton, D.; Richard Wohl, R. Mass communication and para-social interaction: Observations on intimacy at a distance. Psychiatry 1956, 19, 215–229. [Google Scholar] [CrossRef] [PubMed]
- Meyrowitz, J. No Sense of Place: The Impact of Electronic Media on Social Behavior; Oxford University Press: New York, NY, USA, 1986. [Google Scholar]
- Nordlund, J.-E. Media interaction. Commun. Res. 1978, 5, 150–175. [Google Scholar] [CrossRef]
- Conway, J.C.; Rubin, A.M. Psychological predictors of television viewing motivation. Commun. Res. 1991, 18, 443–463. [Google Scholar] [CrossRef]
- Kim, J.; Rubin, A.M. The variable influence of audience activity on media effects. Commun. Res. 1997, 24, 107–135. [Google Scholar] [CrossRef]
- Hsieh, S.H.; Lee, C.T. Hey Alexa: Examining the effect of perceived socialness in usage intentions of AI assistant-enabled smart speaker. J. Res. Interact. Mark. 2021, 15, 267–294. [Google Scholar] [CrossRef]
- Goudey, A.; Bonnin, G. Must smart objects look human? Study of the impact of anthropomorphism on the acceptance of companion robots. Rech. Et Appl. En Mark. (Engl. Ed.) 2016, 31, 2–20. [Google Scholar] [CrossRef]
- Chowanda, A.; Flintham, M.; Blanchfield, P.; Valstar, M. Playing with social and emotional game companions. In Proceedings of the Intelligent Virtual Agents: 16th International Conference, Los Angeles, CA, USA, 20–23 September 2016; pp. 85–95. [Google Scholar]
- Lavado-Nalvaiz, N.; Lucia-Palacios, L.; Pérez-López, R. The role of the humanisation of smart home speakers in the personalisation–privacy paradox. Electron. Commer. Res. Appl. 2022, 53, 101146. [Google Scholar] [CrossRef]
- Blut, M.; Wang, C.; Wünderlich, N.V.; Brock, C. Understanding anthropomorphism in service provision: A meta-analysis of physical robots, chatbots, and other AI. J. Acad. Mark. Sci. 2021, 49, 632–658. [Google Scholar] [CrossRef]
- Cao, C.; Zhao, L.; Hu, Y. Anthropomorphism of Intelligent Personal Assistants (IPAs): Antecedents and Consequences. In Proceedings of the Pacific Asia Conference on Information Systems (PACIS), Xi’an, China, 8–12 July 2019. [Google Scholar]
- Gao, Y.; Pan, Z.; Wang, H.; Chen, G. Alexa, my love: Analyzing reviews of amazon echo. In Proceedings of the 2018 IEEE SmartWorld, Ubiquitous Intelligence & Computing, Advanced & Trusted Computing, Scalable Computing & Communications, Cloud & Big Data Computing, Internet of People and Smart City Innovation, Guangzhou, China, 8–12 October 2018; pp. 372–380. [Google Scholar]
- Whelan, J.; Hingston, S.T.; Thomson, M. Does growing up rich and insecure make objects seem more human? Childhood material and social environments interact to predict anthropomorphism. Personal. Individ. Differ. 2019, 137, 86–96. [Google Scholar] [CrossRef]
- Jones, V.K.; Hanus, M.; Yan, C.; Shade, M.Y.; Blaskewicz Boron, J.; Maschieri Bicudo, R. Reducing Loneliness Among Aging Adults: The Roles of Personal Voice Assistants and Anthropomorphic Interactions. Front. Public Health 2021, 9. [Google Scholar] [CrossRef] [PubMed]
- Scherr, S.A.; Meier, A.; Cihan, S. Alexa, tell me more–about new best friends, the advantage of hands-free operation and life-long learning. In Mensch und Computer 2020-Workshopband; Gesellschaft für Informatik e.V.: Bonn, Germany, 2020. [Google Scholar]
- Mishra, A.; Shukla, A.; Sharma, S.K. Psychological determinants of users’ adoption and word-of-mouth recommendations of smart voice assistants. Int. J. Inf. Manag. 2022, 67, 102413. [Google Scholar] [CrossRef]
- Poushneh, A. Humanizing voice assistant: The impact of voice assistant personality on consumers’ attitudes and behaviors. J. Retail. Consum. Serv. 2021, 58, 102283. [Google Scholar] [CrossRef]
- Nass, C.; Moon, Y. Machines and mindlessness: Social responses to computers. J. Soc. Issues 2000, 56, 81–103. [Google Scholar] [CrossRef]
- Ischen, C.; Araujo, T.; Voorveld, H.; van Noort, G.; Smit, E. Privacy concerns in chatbot interactions. In Proceedings of the International Workshop on Chatbot Research and Design, Amsterdam, The Netherlands, 19–20 November 2019; pp. 34–48. [Google Scholar]
- Rasch, D.; Kubinger, K.D.; Moder, K. The two-sample t test: Pre-testing its assumptions does not pay off. Stat. Pap. 2011, 52, 219–231. [Google Scholar] [CrossRef]
- Sharabany, R. Intimate friendship scale: Conceptual underpinnings, psychometric properties and construct validity. J. Soc. Pers. Relatsh. 1994, 11, 449–469. [Google Scholar] [CrossRef]
- Ketchen, D.J.; Shook, C.L. The application of cluster analysis in strategic management research: An analysis and critique. Strateg. Manag. J. 1996, 17, 441–458. [Google Scholar] [CrossRef]
- Jian, A.K. Data clustering: 50 years beyond k-means, pattern recognition letters. Corrected Proof 2010, 31, 651–666. [Google Scholar]
- Tibshirani, R.; Walther, G.; Hastie, T. Estimating the number of clusters in a data set via the gap statistic. J. R. Stat. Soc. Ser. B (Stat. Methodol.) 2001, 63, 411–423. [Google Scholar] [CrossRef]
- Martinez, W.L.; Martinez, A.R.; Solka, J. Exploratory Data Analysis with MATLAB; Chapman and Hall/CRC: New York, NY, USA, 2017. [Google Scholar]
- Burns, R.; Burns, R.P. Business Research Methods and Statistics Using SPSS; Sage Publications: London, UK, 2008. [Google Scholar]
- Jenkins-Guarnieri, M.A.; Wright, S.L.; Johnson, B. Development and validation of a social media use integration scale. Psychol. Pop. Media Cult. 2013, 2, 38–50. [Google Scholar] [CrossRef]
- Przybylski, A.K.; Ryan, R.M.; Rigby, C.S. The motivating role of violence in video games. Personal. Soc. Psychol. Bull. 2009, 35, 243–259. [Google Scholar] [CrossRef] [Green Version]
- Mayring, P. Qualitative Inhaltsanalyse–Abgrenzungen, Spielarten, Weiterentwicklungen. Forum Qual. Soz./Forum: Qual. Soc. Res. 2019, 20, 1–14. [Google Scholar]
- Garg, R.; Sengupta, S. He is just like me: A study of the long-term use of smart speakers by parents and children. ACM Interact. Mob. Wearable Ubiquitous Technol. 2020, 4, 1–24. [Google Scholar] [CrossRef] [Green Version]
- Amazon. Alexa Kennenlernen. Available online: https://www.amazon.de/b?ie=UTF8&node=12775495031 (accessed on 22 March 2023).
- Pradhan, A.; Findlater, L.; Lazar, A. “Phantom Friend” or “Just a Box with Information” Personification and Ontological Categorization of Smart Speaker-based Voice Assistants by Older Adults. Proc. ACM Hum.-Comput. Interact. 2019, 3, 1–21. [Google Scholar] [CrossRef] [Green Version]
- Hassenzahl, M.; Monk, A. The inference of perceived usability from beauty. Hum.–Comput. Interact. 2010, 25, 235–260. [Google Scholar] [CrossRef]
- Huta, V. Eudaimonic and hedonic orientations: Theoretical considerations and research findings. In Handbook of Eudaimonic Well-Being; Springer: Berlin/Heidelberg, Germany, 2016; pp. 215–231. [Google Scholar]
- Hassenzahl, M.; Wiklund-Engblom, A.; Bengs, A.; Hägglund, S.; Diefenbach, S. Experience-oriented and product-oriented evaluation: Psychological need fulfillment, positive affect, and product perception. Int. J. Hum.-Comput. Interact. 2015, 31, 530–544. [Google Scholar] [CrossRef]
- Huta, V.; Ryan, R.M. Pursuing pleasure or virtue: The differential and overlapping well-being benefits of hedonic and eudaimonic motives. J. Happiness Stud. 2010, 11, 735–762. [Google Scholar] [CrossRef]
- Seaborn, K.; Pennefather, P.; Fels, D.I. Eudaimonia and hedonia in the design and evaluation of a cooperative game for psychosocial well-being. Hum.–Comput. Interact. 2020, 35, 289–337. [Google Scholar] [CrossRef]
- Cho, M.; Lee, S.-s.; Lee, K.-P. Once a kind friend is now a thing: Understanding how conversational agents at home are forgotten. In Proceedings of the Designing Interactive Systems Conference, San Diego, CA, USA, 23–28 June 2019; pp. 1557–1569. [Google Scholar]
- Pradhan, A.; Lazar, A.; Findlater, L. Use of intelligent voice assistants by older adults with low technology use. ACM Trans. Comput.-Hum. Interact. (TOCHI) 2020, 27, 1–27. [Google Scholar] [CrossRef]
- Trajkova, M.; Martin-Hammond, A. “Alexa is a Toy”: Exploring older adults’ reasons for using, limiting, and abandoning echo. In Proceedings of the 2020 CHI Conference on Human Factors in Computing Systems, Honolulu, HI, USA, 25–30 April 2020; pp. 1–13. [Google Scholar]
- Leite, I.; Pereira, A.; Mascarenhas, S.; Martinho, C.; Prada, R.; Paiva, A. The influence of empathy in human–robot relations. Int. J. Hum.-Comput. Stud. 2013, 71, 250–260. [Google Scholar] [CrossRef]
- Loureiro, S.M.C.; Japutra, A.; Molinillo, S.; Bilro, R.G. Stand by me: Analyzing the tourist–intelligent voice assistant relationship quality. Int. J. Contemp. Hosp. Manag. 2021, 33, 3840–3859. [Google Scholar] [CrossRef]
- Schramm, H.; Hartmann, T. The PSI-Process Scales. A new measure to assess the intensity and breadth of parasocial processes. Communications 2008, 33, 385–401. [Google Scholar] [CrossRef]
- IJsselsteijn, W.A.; De Kort, Y.A.; Poels, K. The game experience questionnaire. Tech. Univ. Eindh. 2013, 46, 1–9. [Google Scholar]
- Bailenson, J.N.; Aharoni, E.; Beall, A.C.; Guadagno, R.E.; Dimov, A.; Blascovich, J. Comparing behavioral and self-report measures of embodied agents’ social presence in immersive virtual environments. In Proceedings of the 7th Annual International Workshop on PRESENCE, Valencia, Spain, 13–15 October 2004; pp. 216–223. [Google Scholar]
- Aron, A.; Aron, E.N.; Smollan, D. Inclusion of other in the self scale and the structure of interpersonal closeness. J. Personal. Soc. Psychol. 1992, 63, 596–612. [Google Scholar] [CrossRef]
- Ho, C.-C.; MacDorman, K.F. Revisiting the uncanny valley theory: Developing and validating an alternative to the Godspeed indices. Comput. Hum. Behav. 2010, 26, 1508–1518. [Google Scholar] [CrossRef]
- Hernandez-Ortega, B.; Ferreira, I. How smart experiences build service loyalty: The importance of consumer love for smart voice assistants. Psychol. Mark. 2021, 38, 1122–1139. [Google Scholar] [CrossRef]
- Ramadan, Z.; F Farah, M.; El Essrawi, L. From Amazon. com to Amazon. love: How Alexa is redefining companionship and interdependence for people with special needs. Psychol. Mark. 2021, 38, 596–609. [Google Scholar] [CrossRef]
- Mori, M. The uncanny valley: The original essay by Masahiro Mori. Available online: https://web.ics.purdue.edu/~drkelly/MoriTheUncannyValley1970.pdf (accessed on 23 February 2023).
- Letheren, K.; Kuhn, K.-A.L.; Lings, I.; Pope, N.K.L. Individual difference factors related to anthropomorphic tendency. Eur. J. Mark. 2016, 50, 973–1002. [Google Scholar] [CrossRef]
- McCrae, R.R.; Costa Jr, P.T. A contemplated revision of the NEO Five-Factor Inventory. Personal. Individ. Differ. 2004, 36, 587–596. [Google Scholar] [CrossRef]
- Borkenau, P.; Ostendorf, F. NEO-Fünf-Faktoren-Inventar (NEO-FFI) Nach Costa und McCrae: Handanweisung; Hogrefe: Göttinger, Germany, 1993. [Google Scholar]
- Gierveld, J.D.J.; Tilburg, T.V. A 6-item scale for overall, emotional, and social loneliness: Confirmatory tests on survey data. Res. Aging 2006, 28, 582–598. [Google Scholar] [CrossRef] [Green Version]
- Griffin, D.W.; Bartholomew, K. Relationship scales questionnaire. J. Personal. Soc. Psychol. 1994. [Google Scholar] [CrossRef]
- Steffanowski, A.; Oppl, M.; Meyerberg, J.; Schmidt, J.; Wittmann, W.W.; Nübling, R. Psychometrische Überprüfung einer deutschsprachigen version des relationship scales questionnaire (RSQ). In Störungsspezifische Therapieansätze – Konzepte und Ergebnisse; Bassler, M., Ed.; Psychosozial Verlag: Gießen, Germany, 2001; pp. 320–342. [Google Scholar]
- Kaplan, A.D.; Sanders, T.; Hancock, P.A. The relationship between extroversion and the tendency to anthropomorphize robots: A Bayesian analysis. Front. Robot. AI 2019, 5, 135. [Google Scholar] [CrossRef] [Green Version]
- Kashdan, T.B.; McKnight, P.E. The darker side of social anxiety: When aggressive impulsivity prevails over shy inhibition. Curr. Dir. Psychol. Sci. 2010, 19, 47–50. [Google Scholar] [CrossRef]
- Nestler, S.; Back, M.D.; Egloff, B. Psychometrische Eigenschaften zweier Skalen zur Erfassung interindividueller Unterschiede in der Präferenz zum Alleinsein. Diagnostica 2011, 57, 57–67. [Google Scholar] [CrossRef]
- Stokes, J.P. The relation of social network and individual difference variables to loneliness. J. Personal. Soc. Psychol. 1985, 48, 981–990. [Google Scholar] [CrossRef]
- Abdellaoui, A.; Chen, H.Y.; Willemsen, G.; Ehli, E.A.; Davies, G.E.; Verweij, K.J.; Nivard, M.G.; de Geus, E.J.; Boomsma, D.I.; Cacioppo, J.T. Associations between loneliness and personality are mostly driven by a genetic association with neuroticism. J. Personal. 2019, 87, 386–397. [Google Scholar] [CrossRef]
- Cacioppo, J.T.; Hawkley, L.C. Perceived social isolation and cognition. Trends Cogn. Sci. 2009, 13, 447–454. [Google Scholar] [CrossRef] [Green Version]
- Cacioppo, J.T.; Hughes, M.E.; Waite, L.J.; Hawkley, L.C.; Thisted, R.A. Loneliness as a specific risk factor for depressive symptoms: Cross-sectional and longitudinal analyses. Psychol. Aging 2006, 21, 140–151. [Google Scholar] [CrossRef]
- Epley, N.; Waytz, A.; Akalis, S.; Cacioppo, J.T. When we need a human: Motivational determinants of anthropomorphism. Soc. Cogn. 2008, 26, 143–155. [Google Scholar] [CrossRef] [Green Version]
- Kim, A.; Cho, M.; Ahn, J.; Sung, Y. Effects of gender and relationship type on the response to artificial intelligence. Cyberpsychology Behav. Soc. Netw. 2019, 22, 249–253. [Google Scholar] [CrossRef]
- Roy, R.; Naidoo, V. Enhancing chatbot effectiveness: The role of anthropomorphic conversational styles and time orientation. J. Bus. Res. 2021, 126, 23–34. [Google Scholar] [CrossRef]
- Luger, E.; Sellen, A. “Like Having a Really Bad PA” The Gulf between User Expectation and Experience of Conversational Agents. In Proceedings of the 2016 CHI Conference on Human Factors in Computing Systems, San Jose, CA, USA, 7–12 May 7 2016; pp. 5286–5297. [Google Scholar]
- OpenAI. GPT-4 Technical Report. arXiv 2023, arXiv:2303.08774. [Google Scholar]
- Shafeeg, A.; Shazhaev, I.; Mihaylov, D.; Tularov, A.; Shazhaev, I. Voice Assistant Integrated with Chat GPT. Indones. J. Comput. Sci. 2023, 12, 1. [Google Scholar] [CrossRef]
- Rzepka, C.; Berger, B.; Hess, T. Why another customer channel? Consumers’ perceived benefits and costs of voice commerce. In Proceedings of the 53rd Hawaii International Conference on System Sciences, Honolulu, HI, USA, 7–10 January 2020. [Google Scholar]
- Choi, T.R.; Drumwright, M.E. “OK, Google, why do I use you?” Motivations, post-consumption evaluations, and perceptions of voice AI assistants. Telemat. Inform. 2021, 62, 101628. [Google Scholar] [CrossRef]
- Narynov, S.; Zhumanov, Z.; Gumar, A.; Khassanova, M.; Omarov, B. Chatbots and Conversational Agents in Mental Health: A Literature Review. In Proceedings of the 2021 21st International Conference on Control, Automation and Systems (ICCAS), Jeju, Republic of Korea, 12–15 October 2021; pp. 353–358. [Google Scholar]
- Striegl, J.; Gotthardt, M.; Loitsch, C.; Weber, G. Investigating the Usability of Voice Assistant-Based CBT for Age-Related Depression; Springer International Publishing: Cham, Switzerland, 2022; pp. 432–441. [Google Scholar]
- Bordin, E.S. The generalizability of the psychoanalytic concept of the working alliance. Psychother. Theory Res. Pract. 1979, 16, 252–260. [Google Scholar] [CrossRef] [Green Version]
- Beutler, L.E.; Harwood, T.M. Prescriptive Psychotherapy: A Practical Guide to Systematic Treatment Selection; Oxford University Press: New York, NY, USA, 2000. [Google Scholar]
- Horvath, A.O. Research on the alliance. In The Working Alliance: Theory, Research, and Practice; Horvath, A.O., Greenberg, L.S., Eds.; John Wiley & Sons: New York, NY, USA, 1994. [Google Scholar]
- Baker, J.; Hudson, J. Friendship quality predicts treatment outcome in children with anxiety disorders. Behav. Res. Ther. 2013, 51, 31–36. [Google Scholar] [CrossRef] [PubMed]


| 2020 | |||||||
| T0 | T1 | T2 | T3 | T4 | T5 | T6 | T7 |
| 30 Oct. | 6 Nov. | 11 Nov. | 19 Nov. | 26 Nov. | 3 Dec. | 17 Dec. | 30 Dec. |
| 2021 | |||||||
| T8 | T9 | T10 | T11 | T12 | T13 | T14 | T15 |
| 22 Jan. | 5 Feb. | 11 Feb. | 18 Feb. | 25 Feb. | 11 Mar. | 25 Mar. | 25 Jun. |
| N | Mean | SD | |
|---|---|---|---|
| Intimate Friendship (total) | 73 | 2.26 | 0.82 |
| Frankness and Spontaneity | 73 | 2.30 | 0.93 |
| Sensitivity and Knowing | 73 | 1.76 | 1.03 |
| Attachment | 73 | 2.67 | 1.03 |
| Exclusiveness | 73 | 1.69 | 0.86 |
| Giving and Sharing | 73 | 2.25 | 1.02 |
| Trust and Loyalty | 73 | 2.88 | 1.18 |
| Cluster | n | Mean | SD | T-Value 1 | df | |
|---|---|---|---|---|---|---|
| Frankness and Spontaneity | Friend | 40 | 2.84 | 0.80 | 7.26 *** | 70.67 |
| Non-Friend | 33 | 1.64 | 0.61 | |||
| Sensitivity and Knowing | Friend | 40 | 2.34 | 1.05 | 7.21 *** | 48.98 |
| Non-Friend | 33 | 1.06 | 0.35 | |||
| Attachment | Friend | 40 | 3.31 | 0.89 | 8.51 *** | 64.46 |
| Non-Friend | 33 | 1.89 | 0.52 | |||
| Exclusiveness | Friend | 40 | 2.08 | 0.94 | 5.01 *** | 59.05 |
| Non-Friend | 33 | 1.23 | 0.46 | |||
| Giving and Sharing | Friend | 40 | 2.94 | 0.73 | 9.62 *** | 70.80 |
| Non-Friend | 33 | 1.41 | 0.63 | |||
| Trust and Loyalty | Friend | 40 | 3.62 | 0.82 | 7.94 *** | 65.72 |
| Non-Friend | 33 | 2.00 | 0.90 |
| Category | Cluster | N | Mean | SD | T-Value 1 | df | Effect Size Cohen’s d |
|---|---|---|---|---|---|---|---|
| Knowledge Acquisition | Friend | 27 | 36.26 | 53.00 | 1.77 † | 30.57 | 0.49 |
| Non-Friend | 21 | 17.38 | 14.03 | ||||
| Support | Friend | 27 | 86.78 | 151.73 | 2.17 * | 30.68 | 0.60 |
| Non-Friend | 21 | 20.52 | 40.63 | ||||
| Medial Entertainment | Friend | 27 | 260.86 | 391.62 | −0.26 | 28.28 | −0.08 |
| Non-Friend | 21 | 308.14 | 755.72 | ||||
| Mood Management | Friend | 27 | 10.89 | 19.29 | 1.86 † | 30.05 | 0.51 |
| Non-Friend | 21 | 3.71 | 4.80 | ||||
| Smart Home | Friend | 27 | 32.41 | 52.32 | 0.11 | 35.91 | 0.03 |
| Non-Friend | 21 | 30.33 | 70.07 | ||||
| Social Interaction | Friend | 27 | 52.07 | 78.02 | 2.32 * | 27.87 | 0.64 |
| Non-Friend | 21 | 16.57 | 13.10 |
| Friend Cluster (n = 27) | Non-Friend Cluster (n = 21) | Effect Size | ||||||||
|---|---|---|---|---|---|---|---|---|---|---|
| Function/Subcategory | Mean | SD | % | Mean | SD | % | T-Value | df | p 1 | Cohen’s d |
| News | 8.07 | 17.32 | 1.68 | 1.81 | 2.38 | 0.45 | 1.857 | 27.3 | 0.074 † | 0.51 |
| Knowledge Base | 16.63 | 29.00 | 3.46 | 8.91 | 9.09 | 2.24 | 1.304 | 32.3 | 0.201 | 0.36 |
| Local Guide | 0.78 | 1.22 | 0.16 | 0.19 | 0.40 | 0.05 | 2.344 | 32.9 | 0.025 * | 0.65 |
| Calculator | 1.56 | 4.83 | 0.32 | 0.29 | 0.78 | 0.07 | 1.343 | 27.7 | 0.19 | 0.37 |
| Weather | 9.22 | 10.58 | 1.92 | 6.19 | 7.56 | 1.56 | 1.157 | 45.7 | 0.253 | 0.33 |
| Alarm clock and time | 53.63 | 100.13 | 11.16 | 4.43 | 7.26 | 1.11 | 2.545 | 26.4 | 0.017 * | 0.69 |
| Timer | 22.37 | 61.51 | 4.65 | 8.48 | 17.46 | 2.13 | 1.117 | 31.2 | 0.272 | 0.31 |
| Reminder | 2.15 | 5.68 | 0.45 | 0.29 | 1.10 | 0.07 | 1.663 | 28.5 | 0.107 | 0.46 |
| To-Do List | 0.26 | 1.16 | 0.05 | 0.00 | 0.00 | 0 | 1.158 | 26 | 0.257 | 0.32 |
| Calendar | 0.56 | 1.09 | 0.12 | 0.10 | 0.30 | 0.02 | 2.101 | 31 | 0.044 * | 0.58 |
| Route planner | 0.48 | 1.16 | 0.1 | 0.48 | 1.08 | 0.12 | 0.016 | 44.4 | 0.987 | 0.01 |
| Cooking | 2.00 | 3.82 | 0.42 | 0.62 | 1.60 | 0.16 | 1.696 | 36.6 | 0.098 † | 0.47 |
| Shopping list | 5.33 | 21.49 | 1.11 | 6.14 | 24.51 | 1.54 | −0.12 | 40 | 0.905 | −0.04 |
| Video streaming | 0.67 | 0.78 | 0.14 | 0.76 | 1.14 | 0.19 | −0.33 | 34 | 0.745 | −0.10 |
| Listen to music | 107.52 | 152.87 | 22.37 | 108.76 | 194.67 | 27.3 | −0.02 | 37.2 | 0.981 | −0.01 |
| Audiobooks and stories | 1.07 | 2.06 | 0.22 | 0.29 | 0.72 | 0.07 | 1.853 | 33.7 | 0.073 † | 0.51 |
| Games and skills | 13.30 | 49.44 | 2.77 | 4.91 | 10.48 | 1.23 | 0.858 | 29 | 0.398 | 0.24 |
| Media control | 138.26 | 255.34 | 28.76 | 193.43 | 567.57 | 48.6 | −0.41 | 26.3 | 0.682 | −0.13 |
| Jokes | 3.26 | 5.36 | 0.68 | 1.14 | 1.62 | 0.29 | 1.94 | 31.9 | 0.061 † | 0.53 |
| Motivation | 0.59 | 1.53 | 0.12 | 0.14 | 0.48 | 0.04 | 1.443 | 32.3 | 0.159 | 0.40 |
| Relaxation | 1.52 | 3.84 | 0.32 | 1.10 | 3.08 | 0.28 | 0.424 | 45.9 | 0.674 | 0.12 |
| Sleep aid | 1.59 | 4.39 | 0.33 | 0.19 | 0.68 | 0.05 | 1.635 | 27.6 | 0.113 | 0.45 |
| Self-esteem | 0.59 | 1.37 | 0.12 | 0.10 | 0.30 | 0.02 | 1.835 | 29.2 | 0.077 † | 0.50 |
| Negative mood | 0.70 | 2.02 | 0.15 | 0.24 | 0.70 | 0.06 | 1.117 | 33.6 | 0.272 | 0.31 |
| Fun Gadget | 2.22 | 4.46 | 0.46 | 0.67 | 0.86 | 0.17 | 1.772 | 28.4 | 0.087 † | 0.48 |
| Social presence | 0.41 | 1.39 | 0.08 | 0.14 | 0.36 | 0.04 | 0.947 | 30.3 | 0.351 | 0.26 |
| Lamps | 69.04 | 181.96 | 14.36 | 56.19 | 87.85 | 14.1 | 0.322 | 39.3 | 0.749 | 0.09 |
| Sockets | 29.37 | 52.31 | 6.11 | 28.86 | 68.96 | 7.25 | 0.028 | 36.3 | 0.978 | 0.01 |
| Other Smart Home | 0.04 | 0.19 | 0.01 | 0.05 | 0.22 | 0.01 | −0.18 | 40.2 | 0.862 | −0.05 |
| Connection | 2.74 | 10.48 | 0.57 | 1.43 | 2.23 | 0.36 | 0.633 | 29 | 0.532 | 0.17 |
| Offense | 1.19 | 2.02 | 0.25 | 1.19 | 1.86 | 0.3 | −0.01 | 44.6 | 0.993 | −0.00 |
| Appreciation | 0.44 | 1.05 | 0.09 | 0.33 | 0.66 | 0.08 | 0.448 | 44.2 | 0.656 | 0.13 |
| Congratulation | 0.63 | 2.90 | 0.13 | 0.00 | 0.00 | 0 | 1.129 | 26 | 0.269 | 0.31 |
| Apology | 0.11 | 0.32 | 0.02 | 0.00 | 0.00 | 0 | 1.803 | 26 | 0.083 † | 0.49 |
| Interest in social cues | 4.96 | 7.04 | 1.03 | 1.52 | 3.66 | 0.38 | 2.188 | 40.8 | 0.034 * | 0.61 |
| Greetings/Goodbyes | 9.19 | 17.07 | 1.91 | 0.48 | 0.87 | 0.12 | 2.647 | 26.2 | 0.014 * | 0.72 |
| Politeness | 16.07 | 55.22 | 3.34 | 3.52 | 5.94 | 0.89 | 1.172 | 26.8 | 0.251 | 0.32 |
| Intimate expression | 3.41 | 4.48 | 0.71 | 1.95 | 2.29 | 0.49 | 1.459 | 40.5 | 0.152 | 0.41 |
| Direct speech | 16.07 | 20.07 | 3.34 | 7.57 | 7.12 | 1.9 | 2.043 | 34 | 0.049 * | 0.57 |
| Calls/voice messages | 0.85 | 2.27 | 0.18 | 0.29 | 0.64 | 0.07 | 1.236 | 31.2 | 0.226 | 0.34 |
| Shopping | 0.48 | 1.37 | 0.1 | 1.00 | 3.27 | 0.25 | −0.68 | 25.5 | 0.502 | −0.21 |
| Routine | 0.00 | 0.00 | 0 | 0.00 | 0.00 | 0 | ||||
| Whisper mode | 0.19 | 0.62 | 0.04 | 0.10 | 0.30 | 0.02 | 0.658 | 39.3 | 0.514 | 0.18 |
| Misunderstood request | 35.07 | 52.04 | 7.3 | 24.29 | 28.39 | 6.1 | 0.916 | 41.8 | 0.365 | 0.26 |
| Commands Total | 480.74 | 606.46 | 100 | 398.05 | 850.55 | 100 | 0.377 | 34.8 | 0.708 | 0.11 |
| Cluster | n | M | SD | T-Value 1 | df | Effect Size Cohen’s d | |
|---|---|---|---|---|---|---|---|
| Pragmatic | Friend | 37 | 5.07 | 1.24 | 2.03 * | 39.56 | 0.54 |
| Non-Friend | 26 | 4.20 | 1.91 | ||||
| Hedonic | Friend | 37 | 5.17 | 1.14 | 2.76 ** | 40.71 | 0.73 |
| Non-Friend | 26 | 4.12 | 1.69 | ||||
| Eudaimonic | Friend | 37 | 3.56 | 1.33 | 4.99 *** | 59.09 | 1.26 |
| Non-Friend | 26 | 2.02 | 1.11 | ||||
| Social | Friend | 37 | 3.18 | 1.62 | 3.91 *** | 60.25 | 0.98 |
| Non-Friend | 26 | 1.76 | 1.27 |
| Cluster | n | M | SD | T-Value 1 | df | Effect Size Cohen’s d | |
|---|---|---|---|---|---|---|---|
| Competence | Friend | 37 | 3.62 | 1.08 | 5.45 *** | 51.60 | 1.40 |
| Non-Friend | 26 | 2.06 | 1.15 | ||||
| Popularity | Friend | 37 | 2.92 | 1.12 | 5.51 *** | 59.52 | 1.39 |
| Non-Friend | 26 | 1.50 | 0.92 | ||||
| Relatedness | Friend | 37 | 2.62 | 1.38 | 4.33 *** | 60.09 | 1.06 |
| Non-Friend | 26 | 1.40 | 0.85 | ||||
| Security | Friend | 37 | 4.85 | 1.12 | 3.03 ** | 39.77 | 0.80 |
| Non-Friend | 26 | 3.69 | 1.71 | ||||
| Autonomy | Friend | 37 | 4.11 | 1.35 | 5.22 *** | 52.84 | 1.34 |
| Non-Friend | 26 | 2.27 | 1.39 | ||||
| Stimulation | Friend | 37 | 4.55 | 1.32 | 6.65 *** | 51.58 | 1.71 |
| Non-Friend | 26 | 2.21 | 1.42 | ||||
| Self-Actualization | Friend | 37 | 2.49 | 1.23 | 3.96 *** | 60.86 | 0.99 |
| Non-Friend | 26 | 1.42 | 0.90 |
| Cluster | n | M | SD | T-Value 1 | df | Effect Size Cohen’s d | |
|---|---|---|---|---|---|---|---|
| Sense | Friend | 38 | 4.21 | 0.97 | 4.19 *** | 62.54 | 1.01 |
| Non-Friend | 32 | 3.16 | 1.10 | ||||
| Value | Friend | 38 | 4.09 | 1.03 | 3.92 *** | 64.30 | 0.94 |
| Non-Friend | 32 | 3.08 | 1.10 | ||||
| Implication | Friend | 38 | 3.15 | 0.95 | 3.62 *** | 63.91 | 0.87 |
| Non-Friend | 32 | 2.28 | 1.03 | ||||
| Awe | Friend | 38 | 2.83 | 0.84 | 4.57 *** | 67.39 | 1.09 |
| Non-Friend | 32 | 1.94 | 0.78 | ||||
| Inspiration | Friend | 38 | 3.08 | 0.84 | 5.30 *** | 67.13 | 1.27 |
| Non-Friend | 32 | 2.05 | 0.79 | ||||
| Transcendence | Friend | 38 | 2.49 | 1.11 | 2.87 ** | 67.44 | 0.69 |
| Non-Friend | 32 | 1.76 | 1.02 | ||||
| Carefreeness | Friend | 38 | 3.50 | 1.15 | 1.75 † | 67.67 | 0.42 |
| Non-Friend | 32 | 3.04 | 1.04 |
| Cluster | n | M | SD | T-Value 1 | df | Effect Size (Cohen’s d) | |
|---|---|---|---|---|---|---|---|
| Cognitive PSI | Friend | 36 | 3.21 | 0.68 | 3.58 *** | 46.35 | 0.92 |
| Non-Friend | 28 | 2.44 | 0.97 | ||||
| Affective PSI | Friend | 36 | 2.72 | 0.90 | 4.09 *** | 61.97 | 1.01 |
| Non-Friend | 28 | 1.91 | 0.68 | ||||
| Behavioral PSI | Friend | 36 | 4.07 | 0.89 | 4.35 *** | 48.81 | 1.11 |
| Non-Friend | 28 | 2.91 | 1.18 | ||||
| Social Presence | Friend | 36 | 2.86 | 0.93 | 4.77 *** | 55.32 | 1.16 |
| Non-Friend | 28 | 2.00 | 0.49 | ||||
| Likeability | Friend | 36 | 2.10 | 1.04 | 3.03 ** | 61.88 | 0.75 |
| Non-Friend | 28 | 1.41 | 0.77 | ||||
| Status | Friend | 36 | 3.46 | 0.60 | 5.04 *** | 56.33 | 1.27 |
| Non-Friend | 28 | 2.67 | 0.64 | ||||
| Empathy | Friend | 36 | 3.31 | 1.00 | 7.17 *** | 61.92 | 1.78 |
| Non-Friend | 28 | 1.69 | 0.80 | ||||
| Attachment | Friend | 40 | 1.58 | 0.93 | 3.11 ** | 48.03 | 0.70 |
| Non-Friend | 33 | 1.09 | 0.29 | ||||
| Humaneness | Friend | 38 | 2.61 | 0.77 | 4.29 *** | 66.36 | 1.02 |
| Non-Friend | 32 | 1.94 | 0.55 | ||||
| Eeriness | Friend | 38 | 3.55 | 0.69 | 4.01 *** | 67.15 | 0.96 |
| Non-Friend | 32 | 2.91 | 0.65 |
Disclaimer/Publisher’s Note: The statements, opinions and data contained in all publications are solely those of the individual author(s) and contributor(s) and not of MDPI and/or the editor(s). MDPI and/or the editor(s) disclaim responsibility for any injury to people or property resulting from any ideas, methods, instructions or products referred to in the content. |
© 2023 by the authors. Licensee MDPI, Basel, Switzerland. This article is an open access article distributed under the terms and conditions of the Creative Commons Attribution (CC BY) license (https://creativecommons.org/licenses/by/4.0/).
Share and Cite
Wienrich, C.; Carolus, A.; Markus, A.; Augustin, Y.; Pfister, J.; Hotho, A. Long-Term Effects of Perceived Friendship with Intelligent Voice Assistants on Usage Behavior, User Experience, and Social Perceptions. Computers 2023, 12, 77. https://doi.org/10.3390/computers12040077
Wienrich C, Carolus A, Markus A, Augustin Y, Pfister J, Hotho A. Long-Term Effects of Perceived Friendship with Intelligent Voice Assistants on Usage Behavior, User Experience, and Social Perceptions. Computers. 2023; 12(4):77. https://doi.org/10.3390/computers12040077
Chicago/Turabian StyleWienrich, Carolin, Astrid Carolus, André Markus, Yannik Augustin, Jan Pfister, and Andreas Hotho. 2023. "Long-Term Effects of Perceived Friendship with Intelligent Voice Assistants on Usage Behavior, User Experience, and Social Perceptions" Computers 12, no. 4: 77. https://doi.org/10.3390/computers12040077