Article

SmartWatcher©: A Solution to Automatically Assess the Smartness of Buildings

by
Yu Ye
,
Alfonso P. Ramallo-González
*,
Valentina Tomat
,
Juan Sanchez Valverde
and
Antonio Skarmeta-Gómez
Department of Information and Communication Engineering, Computer Science Faculty, Universidad de Murcia, 30100 Murcia, Spain
*
Author to whom correspondence should be addressed.
Computers 2023, 12(4), 76; https://doi.org/10.3390/computers12040076
Submission received: 6 March 2023 / Revised: 4 April 2023 / Accepted: 9 April 2023 / Published: 12 April 2023

Abstract

:
Buildings have now adopted a new dimension: the dimension of smartness. The rapid arrival of connected devices, together with the smart features that they provide, has allowed for the transition of existing buildings towards smart buildings. The assessment of the smartness of the large number of existing buildings could exhaust resources, but some organisations are requesting this regardless (such as the smart readiness indicator of the European Union). To tackle this issue, this work describes a tool that was created to find connected devices to automatically evaluate smartness. The tool, which was given the name SmartWatcher, uses a design-for-purpose natural language processing algorithm that converts verbal information into numerical information. The method was tested on real buildings in four different geographical locations. SmartWatcher is shown to be powerful, as it was capable of obtaining numerical values from verbal descriptions of devices. Additionally, a preliminary comparison of values obtained using the automatic engine and clipboard assessments showed that although the results were still far from being perfect, some visual correlation could be seen. This anticipates that, with the addition of appropriate techniques that refine this algorithm, or with the addition of new ones (with other more advanced natural language processing methods), the accuracy of this tool could be greatly increased.

1. Introduction

The European Union has committed to reducing greenhouse gas emissions by 80% compared to 1990 levels, by 2050 [1]. Considering that buildings are responsible for approximately 40% of the total energy consumption and account for 36% of the total CO2 emissions [2], one could define them as the largest energy consumer in Europe. Due to this, the European Commission recognised that the energy efficiency of buildings can contribute significantly to their emission reduction objective [3].
Smart technologies in buildings can help with the assessment of this issue, being an effective means of creating healthier and more comfortable buildings with lower energy use and carbon impact [4]. They also facilitate the integration of renewable energy sources into future energy systems. For these reasons, one of the focal points of the last energy performance of buildings directive (EPBD) [5] is to better exploit this potential of smart technologies in the building sector. As part of this approach, the EPBD foresees the establishment of the so-called smart readiness indicator (SRI). The SRI was created by the EC as a tool to measure the smart readiness of buildings [6]. The indicator was designed to serve as a tool to assess whether a building can adapt its operation to the needs of the occupants and to the necessities to accomplish a secure electricity grid, as well as to improve the overall energy performance of buildings. Thanks to the implementation of the SRI, technological innovation in the building sector can be given visibility, since it represents an incentive for the integration of new smart technologies in buildings [7]. Some of the consequences expected are a decrease in carbon emissions, the improvement of convenience and comfort for the building occupants and more efficient energy management [8].
To assist the EU member states in defining the SRI, the European Commission’s Directorate-General for Energy commissioned a technical study. The objective of the study was the proposal of a methodological framework for the SRI and the smart services on which the indicator is based. A conclusion from the study was that the developed methodology followed the principles outlined in the 2018 EPBD, and was also practically applicable. Although the member states are not bound to using this methodology, it provides a template that is considered flexible enough to be adaptable to local framework conditions [9].
The proposed SRI calculation methodology is based on a scoring system that ranks buildings’ smart readiness. The scoring is based on seven impact criteria: energy savings on site, maintenance and fault prediction, comfort, convenience, health and well-being, information to occupants and flexibility for the grid and storage [6]. Each impact criterion is expressed as a percentage of the maximum score that the assessed building can achieve. Each impact criterion is the weighted average of the scores of nine domains: heating, cooling, domestic hot water, ventilation, lighting, dynamic building envelope, electricity, electric vehicle charging and monitoring and control. For each domain, several functionality levels are defined, where higher functionality levels correspond to a smarter implementation of the service [10].
As well as the SRI, there are other initiatives for the intelligent building assessment. The Continental Automated Buildings Association (CABA) has developed a new version of the building intelligence quotient [11] with the China Academy for Building Research (CABR) in 2019, which is a tool that has more than 300 questions to rate the level of building intelligence in different issues. In 2015, The Honeywell smart building score [12] was implemented and applied globally for the evaluation of smart buildings. It measures fifteen smart assets in a building and rates them across three criteria: greenness, safety and productivity. Thus, the intelligent building assessment can be expected to proliferate in the coming years with different tools and standards.
The scientific community has started to show interest in the new SRI, analysing the method and its applicability to specific geographic conditions [13,14]. From the literature, it is evident that the assessment requires the expertise of qualified personnel to check and record the status of the devices available in the building. Moreover, a professional should perform the scoring of different smart services, weigh them for each domain and geographical context and obtain the final SRI score through a series of formulae. As one can deduce, this process can imply a high human cost. Moreover, in some publications [15,16], a problem was raised about the lacking objectivity of the method, explaining that each assessor obtains a final score according to their personal comprehension. Additionally, one of the major problems in performing the SRI assessment is the large number of existing buildings, both commercial and residential. To this end, it is essential to use modern technologies to assess these buildings in an efficient way.
Therefore, in order to try to solve this problem, this work shows the implementation of an engine that is able to provide a series of preliminary scores, automatising the SRI assessment based on the resources available on quasismart buildings. To the best of the authors’ knowledge, this is the first study in the literature that proposes the automation of the new SRI assessment. The aim of this work is to demonstrate that it is possible to propose an automatic approach to obtain the SRI, without any human intervention. To achieve this aim, an information and communications technology (ICT) framework is developed with the necessary components to execute the task of assessing the SRI in an automatic manner. In addition, eight case studies are used corresponding to buildings of different ages and types to evaluate the framework [17,18]. The buildings, located in different countries, undertook interventions aiming to improve their smartness. The interventions involved the installation and/or the upgrade of equipment, sensors and actuators, creating a network-integrated IoT platform.
Thus far, the SRI result was calculated manually using requirements documented in an Excel format. This traditional way of evaluating the SRI is called a “clipboard assessment”, as it requires a professional to physically inspect a building and take notes.
Meanwhile, natural language processing (NLP) is a branch of artificial intelligence that focuses on enabling computers to understand, interpret and generate human language. When it comes to buildings, NLP can help improve the efficiency and effectiveness of technical documentation in the building industry, making it easier for professionals to access and use the information they need to build and maintain safe and functional buildings. As a result, this work creates an engine called “SmartWatcher”, which uses NLP techniques based on TF-IDF algorithms to convert the SRI requirement documents into processable data for automatic SRI scoring.
In addition, the SRI score of the eight buildings is evaluated automatically through SmartWatcher, and the final results are compared with the scores obtained by clipboard assessors. The purpose of this comparison is to demonstrate the feasibility of the tool that we developed for use in real cases, which could serve as an indicator of the real SRI value. It also highlights the great benefits that can be achieved through using this tool compared to traditional methods. In the time it takes a professional to physically assess a building (very accurately), SmartWatcher can assess thousands of buildings (in a less precise way), therefore, the scale of performance is completely different.
The remainder of this paper is organised as follows: Section 2 presents the state of the art of this work. The methodology is described in Section 3. Section 4 presents the results and discussion. Lastly, the conclusions and future work are discussed in Section 5.

2. State of the Art

2.1. Natural Language Processing

Currently, text is one of the most widely used means of communication. Along with the evolution of the internet, it has become an important and widely used data source for extracting information or knowledge [19]. However, these data are very complex and difficult to exploit with existing algorithms. Since text data are unstructured, they require specific approaches and models to extract the values stored in them.
Natural language processing (NLP) is a discipline that focuses primarily on the understanding, handling and generation of natural language using machines [20]. NLP can be considered the interface between computer science and linguistics, since it is based on the ability of the machine to interact directly with humans.
Two aspects can be distinguished as essential for any NLP problem:
  • The linguistic part, which consists of preprocessing and transforming the input information into an exploitable dataset.
  • The machine learning or data science part, which is based on the application of machine learning or deep learning models to that dataset with the aim of obtaining linguistic and domain expertise.
In the linguistic aspect used for this work, the main objective was to transform raw text data into processable data, which consisted of the following steps:
  • Data cleaning. This is the process that refers to the practice of detecting and addressing mistakes, disparities and inaccuracies in data prior to an analysis. It is a vital component of data analysis, since the dependability and precision of the analysis are contingent on the quality of the data. The process of data cleaning includes a variety of responsibilities, such as eliminating duplicates, managing absent data, fixing errors, addressing outliers (i.e., values that are significantly different from the other values in a dataset) and resolving conflicts. One of the most common steps in data cleaning is to remove irrelevant information., e.g., stopwords, URLs, emojis, etc.
  • Data normalisation [21] can be performed through:
    • Tokenisation, which is the segmentation of text into several parts called tokens, which are words, numbers, symbols and punctuation marks.
    • Stemming, which usually refers to the process of attempting to obtain the root of a word, i.e., its morphological root, by stripping it of the affixes that carry the word’s grammatical or lexical information, since the same word can be found in different forms depending on the person, gender, number, etc.
    • Lemmatization, which is similar to stemming, uses the vocabulary and morphological analysis of the word and tries to eliminate inflectional endings, thus, returning words to their canonical form.
    • Other operations in order to complete the data cleaning process, such as lower casing or removal of numbers, punctuation, symbols, etc.
  • Transformation of textual data into digital data. There are several ways of conducting this; the TF-IDF (term frequency-inverse document frequency) algorithm is one of the most widely used methods and the one that was used in this work. This method consists of counting the number of occurrences of tokens in the corpus for each text, which is then divided by the total number of occurrences of the same tokens in the whole corpus [22].

2.2. NLP Applied to Buildings

NLP research began in the 1950s, and focuses on tasks such as machine translation, information retrieval, text summarization, question answering, information extraction and topic modelling. Early research focused on syntax due to its necessity and the idea of syntax-driven processing. Recent research has also included topics such as personal assistants and opinion mining (or sentiment analysis) [23]. Combined with other big data techniques (e.g., data mining and classification/clustering models), NLP can also be used in a wide range of applications for knowledge acquisition and retrieval in the construction industry [24].
Hassan et al. [25] proposed an automated framework using NLP and machine learning techniques to identify contractual requirements. The framework used four different machine learning algorithms (naive bayes, support vector machines, logistic regression and feedforward neural network) to classify contractual text into requirement and nonrequirement text. They used seven contract documents to train and test the models, extracting 1787 statements that were manually labelled as requirements or nonrequirements. The support vector machine model was found to outperform the other models in terms of accuracy, precision, recall and F1 score. The study also found that using unigrams yielded better results than higher n-gram features. Moreover, an experimental study with human participants showed that the developed model was efficient and effective in reducing reading time and improving contract scope comprehension.
Zhang et al. [26] presented an automated information extraction (IE) approach for construction regulatory documents using a semantic, rule-based NLP technique. The approach employed a set of pattern-matching-based IE rules and conflict resolution rules using a variety of syntactic (syntax/grammar related) and semantic (meaning/context related) text features. The study also introduced phrase structure grammar (PSG)-based phrasal tags and the separation and sequencing of semantic information elements to reduce the number of patterns required. An ontology was also used to support the recognition of semantic text features. The proposed IE extraction algorithms were tested on the 2009 International Building Code, achieving high precision (0.969) and recall (0.944) rates.
Regarding smart homes, Baby et al. [27] used NLP to develop a web application allowing for electronic devices to be controlled over the internet. The implemented application contained a Chatbot algorithm into which a user can enter text information that is then processed using NLP techniques to identify keywords and actions on the electronic appliances. Additionally, any device connected to the local area network of the house can control the devices and other appliances in the house. A security feature was also included that restricted access to the application to authorized users only. In this way, they successfully implemented a simple and secure, but easy to modify and scalable, home automation system.

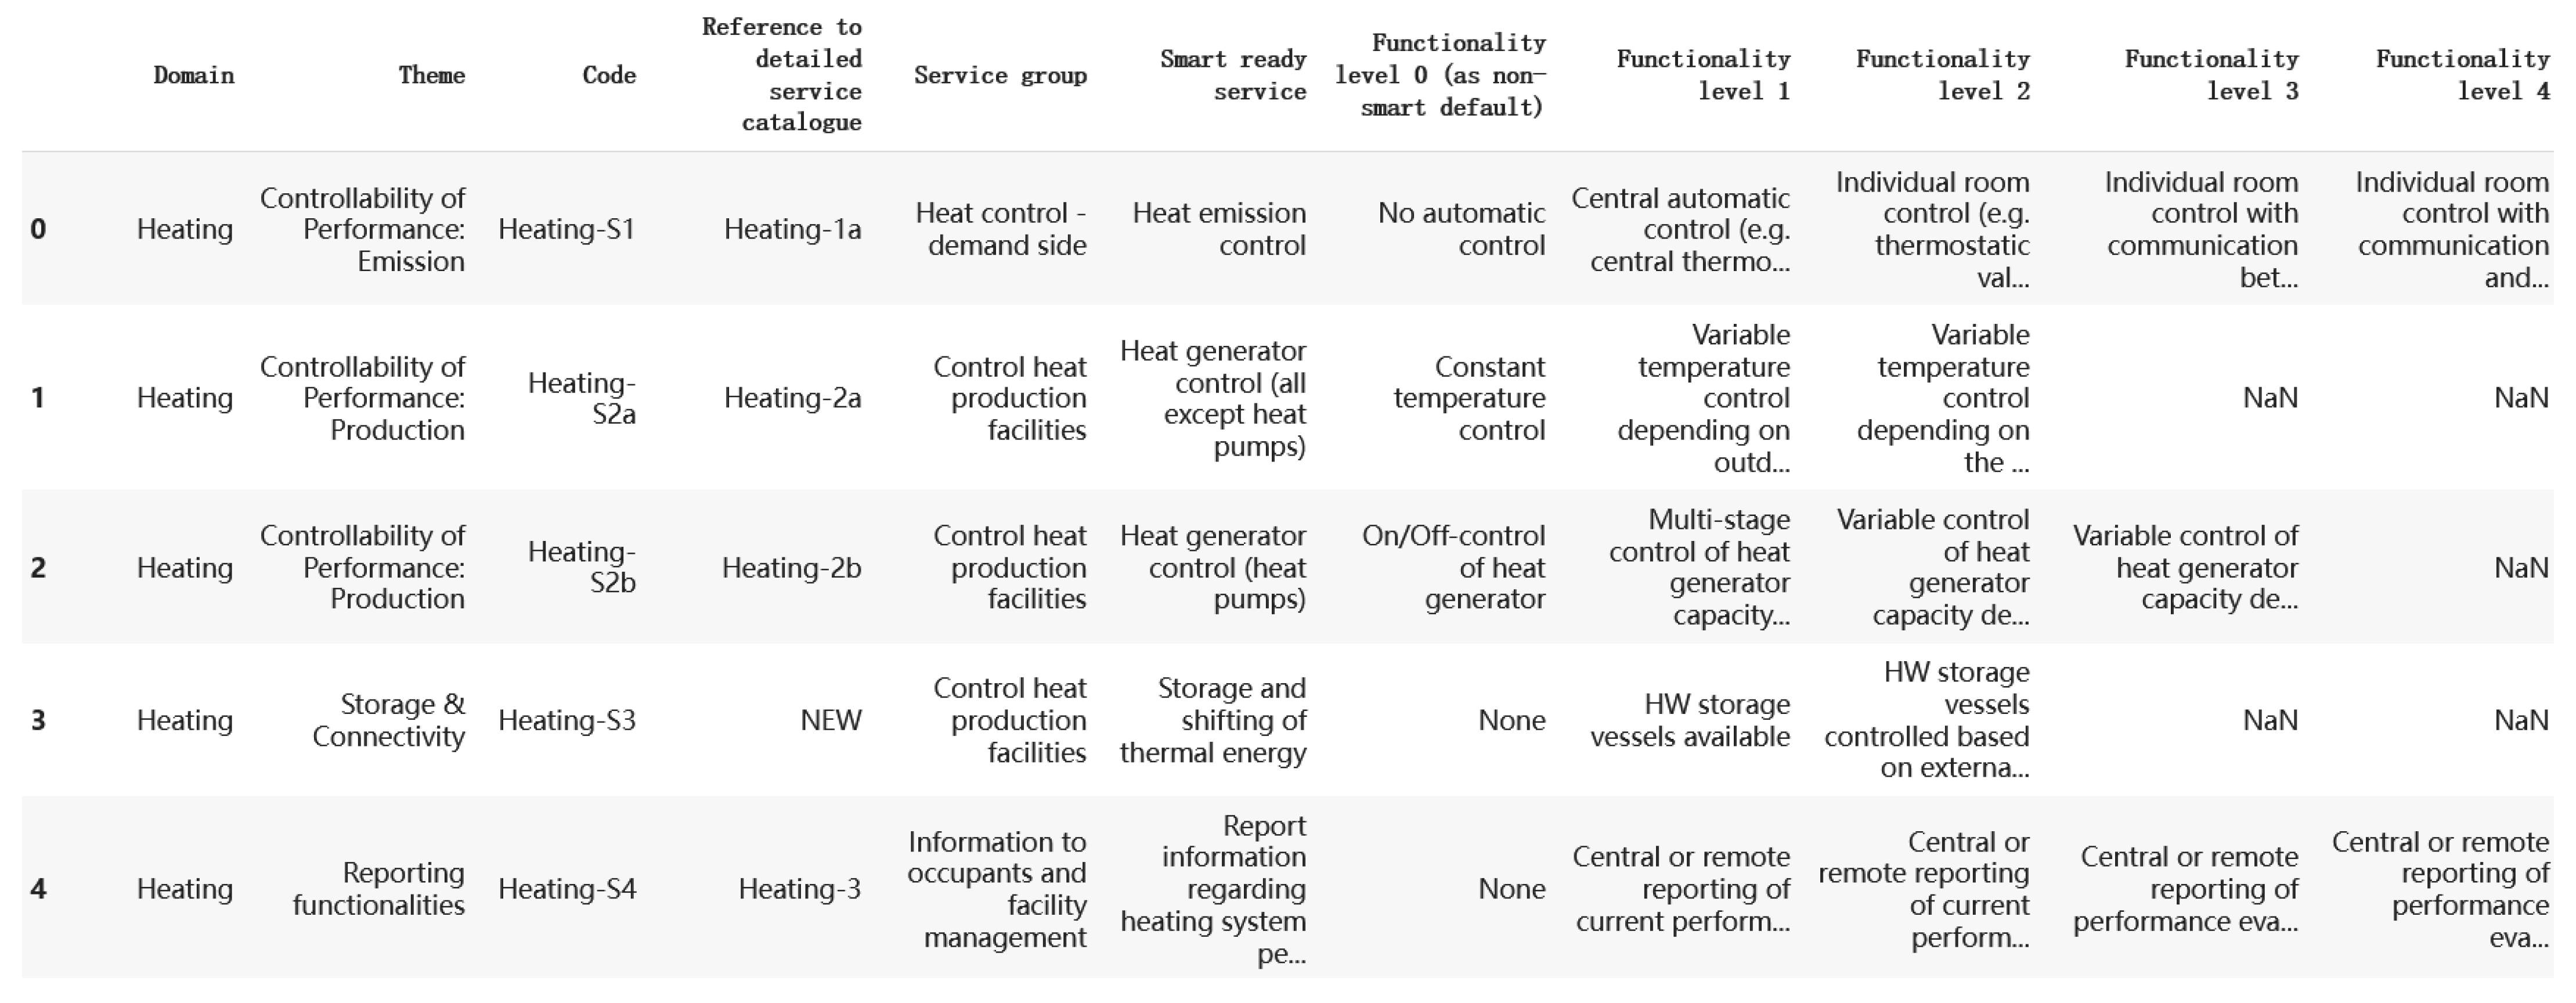
2.3. Smart Readiness Indicator of Buildings

The potential of the new indicator captured the attention of the scientific community within the last five years.
Vigna et al. [8] analysed the connection between the new indicator and the energy flexibility of a building, since improving the energy flexibility is one of the three key functionalities of the SRI. Their scope was to detect groups of buildings interconnected to the same energy infrastructure through clustering techniques. Regarding energy flexibility, another important contribution was given by Märzinger and Österreicher [9], who proposed a method to quantify the interaction with the grid through the assessment of the load-shifting potential and energy storage capacity. Through their model, they presented a simplified classification into buildings that did not interact with the grid, buildings that could shift the demand in a one-way mode (take energy from the grid) and buildings that could shift their demands in a two-way mode (either taking or giving back energy to the grid). The same authors expanded the methodology developed in a successive piece of work [28] in order to include the district assessment. They successfully applied the method to a theoretical case, concluding that it allowed for an objective and easier assessment of the load shifting potential in districts.
Horák and Kabele [29] assessed the calculation for four different buildings in the Czech Republic. They highlighted some shortcomings in the calculation, such as the difficulty to reach the maximum SRI score (100%), since it would neither be user-friendly nor easily affordable in terms of investment. Dorizas et al. [30] analysed the effects that the SRI would have on indoor environmental quality (IEQ). They underlined that the main positive aspect of the new introduction was the thrust towards the spread of smarter buildings. They supported the implementation of the SRI score as a means to provide a better indoor living space for occupants.
Regarding applicability related to climate conditions, Ramezani et al. [14] tested the SRI method on the Mediterranean climate through two case studies located in Portugal. They concluded that the SRI assessment managed to correctly describe the characteristics of the buildings, despite some issues being found in predicting their energy consumption. On the other hand, Janhunen et al. [13] analysed the applicability of the method to cold climates by proposing three case studies located in the Helsinki metropolitan region in Finland. From a technological point of view, it appeared that modifications in the SRI list of services are needed to be fully applicable to cold climate countries. For instance, the presence of district heating, considered in the scientific literature as one of the main enablers for energy transition, was found to have less impact on the SRI score compared to other heating systems. They also detected a limitation in using the triage process (a process to filter the list of smart services applicable to a building), since results from different buildings are hardly comparable. On the latter point, Vigna et al. [15] applied the SRI method to a nearly zero-energy building in Italy, agreeing on the impossibility of comparing buildings with different catalogue lists, i.e., with a different number of applicable smart services. Moreover, they had two different panels of experts to evaluate the SRI score of the same building, obtaining different results that raised concerns about the influence of subjective decisions on the assessment. The element of subjectivity in the SRI method was also detected by Fokaides et al. [16], who related the evaluation of the building to the understanding of the designer in charge of the assessment.
Markoska et al. [31] wrote the first publication about the need for an automatic estimation of the SRI, without human intervention. In a previous work [32], they developed a framework called performance testing (PTing) to test smart buildings using a metadata model. The main issue they found was that the functionality levels’ description pertained in some cases to hardware enhancements, and to others to software installations, making it insufficient for software metadata. As a consequence, they chose to add a service abstraction layer as an additional metadata scheme. The main limitation of their work was that the method proposed could only be applied to buildings with an SRI score greater than 23%.
From the state of the art, they could deduce some main issues. On the one hand, considering that the SRI would become mandatory in several European countries, there is the need for a large number of specifically trained experts, resulting in consequent expenses in terms of time and cost for training. On the other hand, the current methodology for the SRI assessment involves a physical inspection of the building and all its installations, an evaluation of all the services and the transcription of the data gathered on the spreadsheet provided by the SRI support team. For complex buildings, the amount of time required for the mentioned step can increase greatly, leading also to a higher cost for those who have to pay the technician. It could also be underlined that the manual transcription of the data to the spreadsheet can easily lead to human errors, undermining the reliability of the final result. Finally, one of the most important issues that one can deduce from the state of the art is the lack of objectivity of the current method. Since the allocation of the score to each service is arbitrary and depends entirely on the technician’s assessment, the final SRI score is subjective, as highlighted by [15,16].
All these reasons considered, the implementation of SmartWatcher could lead to several benefits in the field of SRI by increasing the objectivity and the reliability of the assessment and by entailing great improvements in terms of time and cost reduction.

3. Methodology

This paper described the development of SmartWatcher as a fully autonomous engine that aims to be an autonomous counterpart of the European SRI calculation tool. The SRI scoring system, the last version having been released by the European Commission, is an Excel file listing (e.g., heating) the corresponding smart services for each domain (e.g., heat emission control). To each smart service, the assessor assigns a functionality level from 0 to 4, where level 0 corresponds to a nonsmart functionality and level 4 corresponds to a more intelligent preparation. Note that some smart services have less than four functionality levels.

3.1. Problem Definition

Despite the expected benefits from the introduction of the new indicator, some main issues were raised. These concerns were highlighted by both the scientific community and the experimental working groups that participated in the SRI test phase [33].
The main point was the importance of finding a way to make the SRI score objective. As said in the previous paragraph, an assessor has to assign the functionality level to each smart service. As a consequence, the final score inevitably depends on the professional who is in charge of the assessment. According to the third plenary SRI platform meeting [34], the element of subjectivity in the evaluation is related also to the need to improve the clearness of the services’ definition. It was found that different professionals understand and interpret the definition of smart services in a nonunivocal way, leading to a subjective assignment of scores.
Moreover, it is important to define who the assessor should be. The role of the assessor is not trivial, since their tasks include both the assignment of a score as well as the provision of guidance to improve it cost-effectively. With the SRI being a novelty in the field, the matter of training the assessors was one of the key points of the SRI test phase. Experiments to train several assessors through workshops and webinars were conducted, directed at professionals in the building field and/or assessors of other similar scores, such as the energy performance certificate. In the probable case of making the SRI assignment mandatory, a considerable number of assessors would be needed, implying high costs for both the countries in charge of the training and the users who would need the services of trained professionals to obtain the SRI score for their buildings.
Summing up, the problem could be expressed through the following issues:
  • Human intervention leads to a subjective SRI score assignment;
  • The cost to train a sufficient amount of professionals must be considerable;
  • The cost faced by users to obtain the SRI certificate for their building would be higher.
Automatising the SRI assessment would lead to both an increase in the objectivity of the assignment process and a reduction in costs for all stakeholders.

3.2. Case Study Definition

The case studies analysed in this work included eight pilot buildings that formed part of the PHOENIX project [17]. The buildings were located in different locations (Ireland, Greece, Sweden and Spain), and were characterised by different building features, as well as the installation of different smart devices and services. The SRI score for each pilot building was assessed throughout the project with the calculation tool provided by the European Commission (scored on a clipboard assessment manner by professionals using SRI forms). The final scores corresponding to each pilot building are reported in Table 1.
Moreover, the main characteristics of the building in terms of typology and location were also reported, since, based on these features, the tool applied specific weighting factors to take into account the inherent differences. From Table 1, it could also be deduced that the buildings belonged to five different partners of the project, corresponding to five different assessors that worked synergically to obtain comparable results.

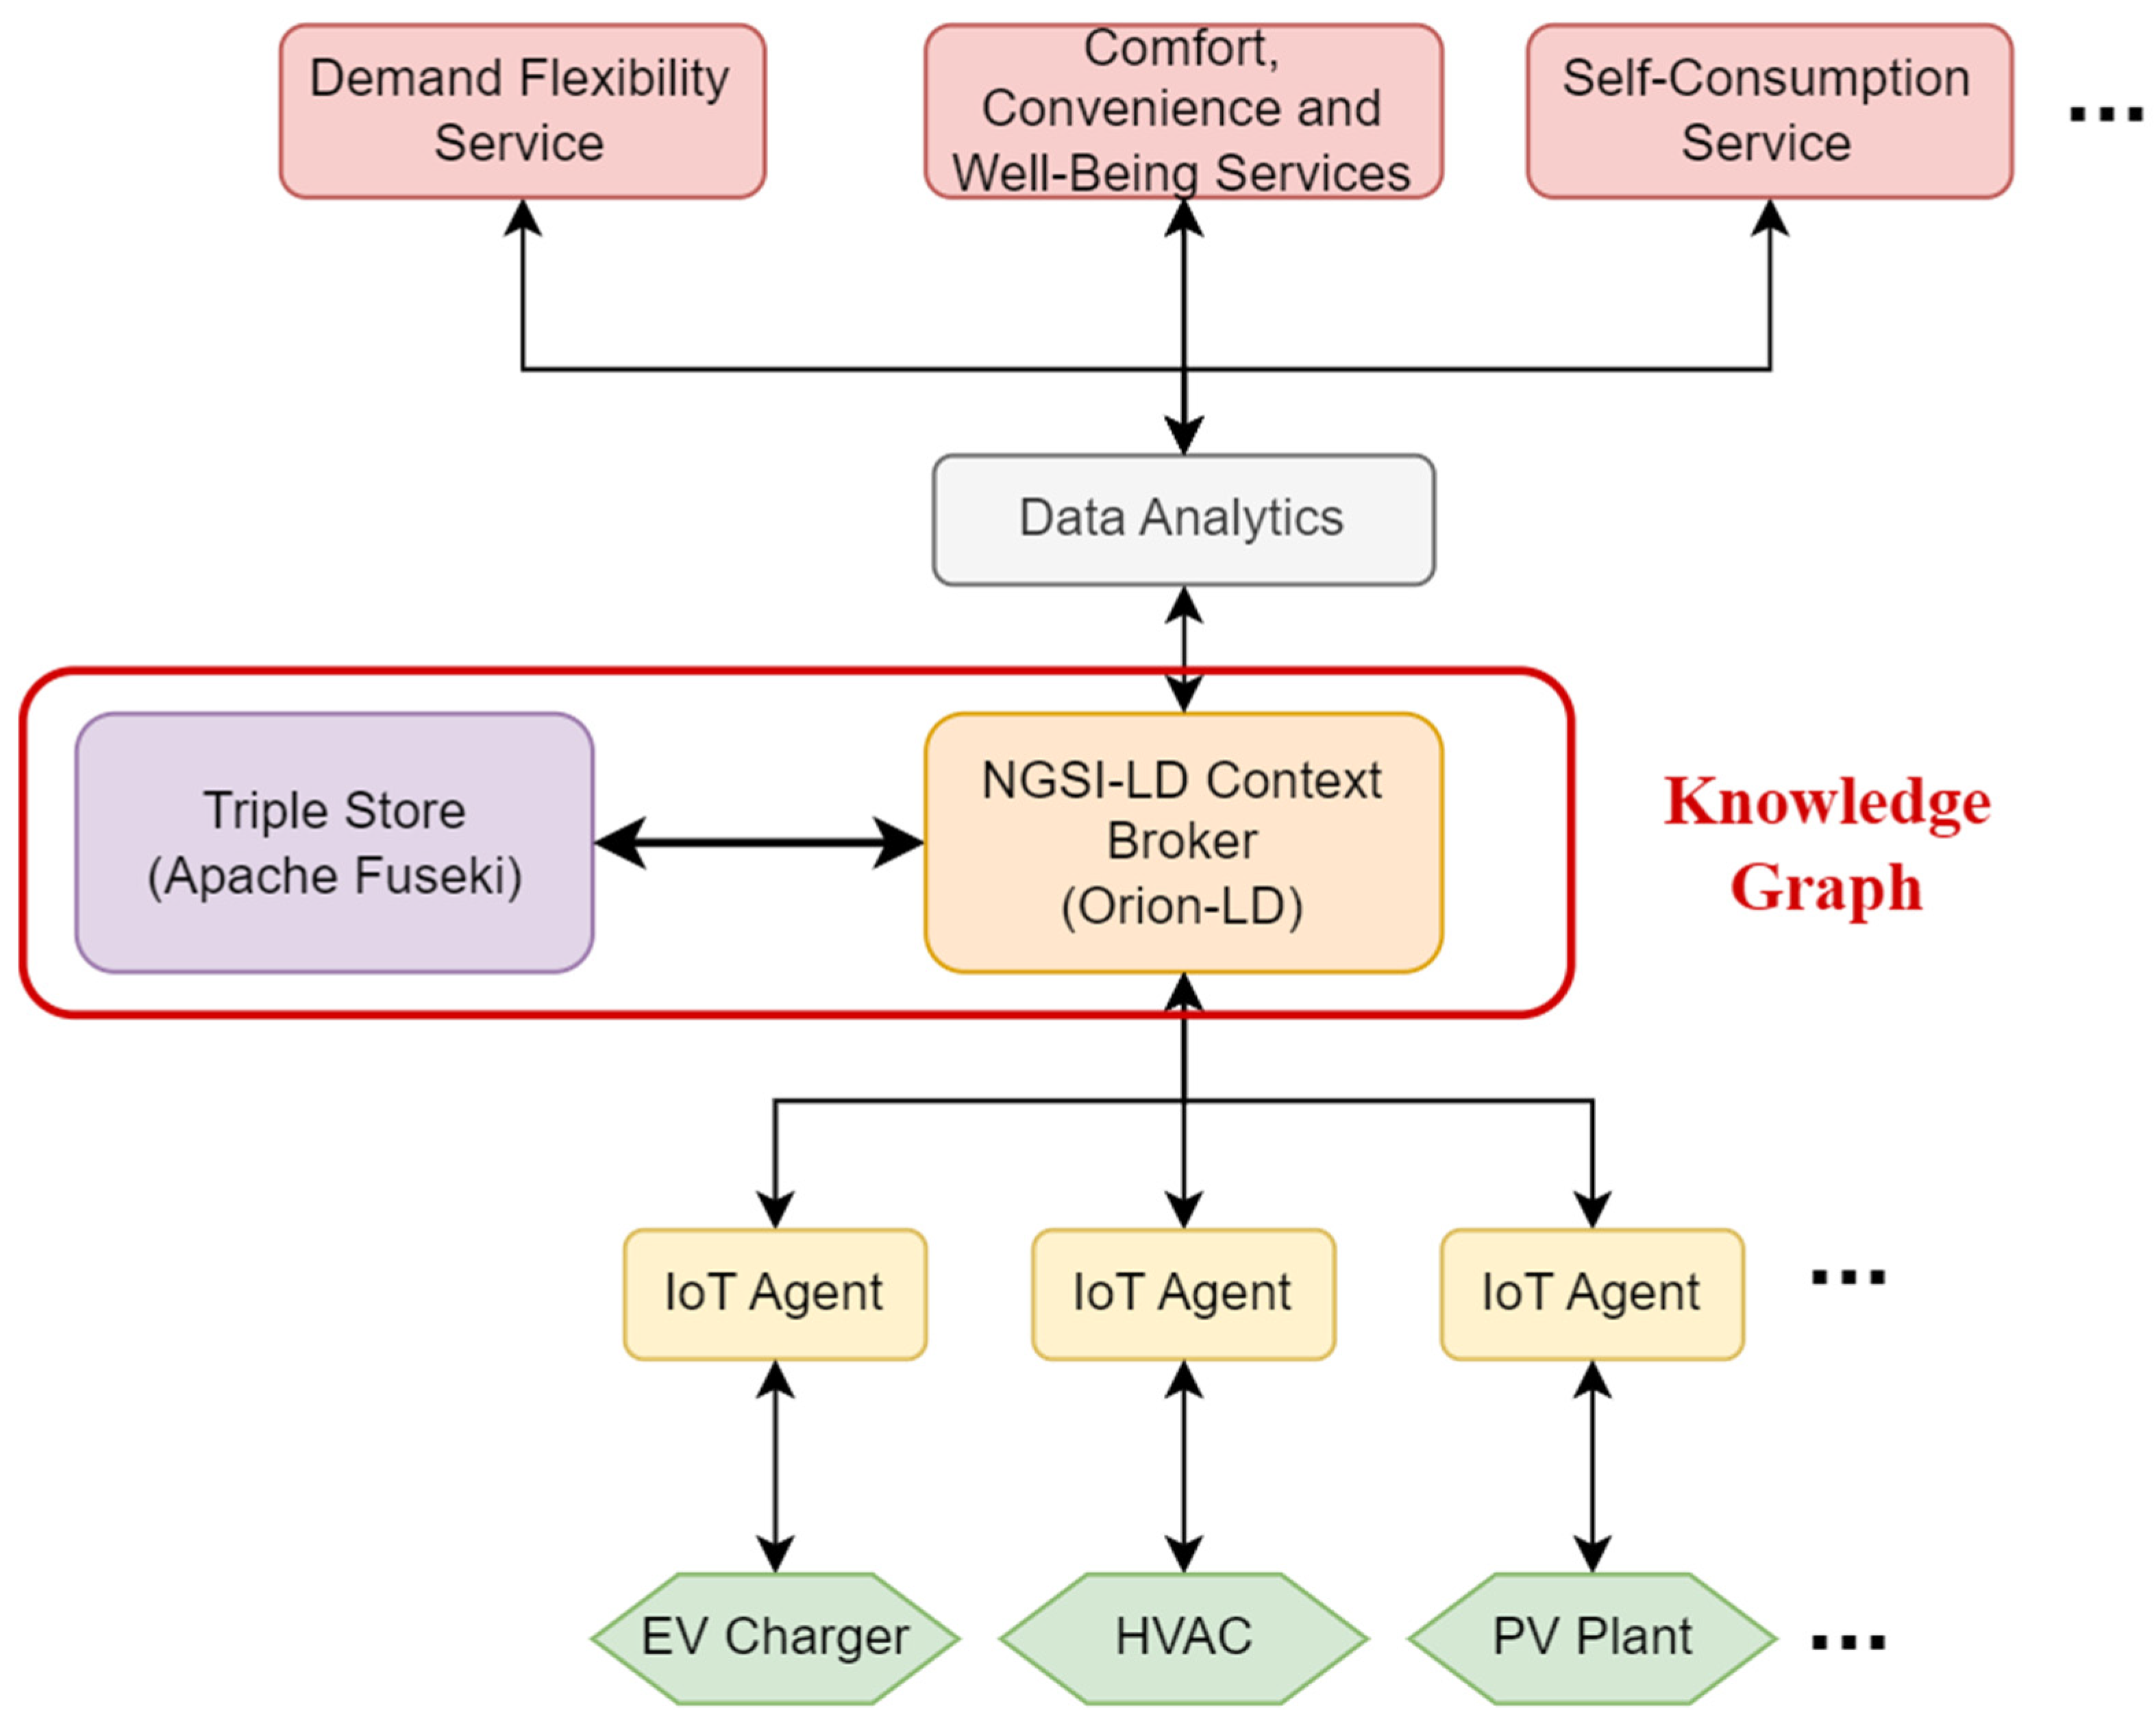
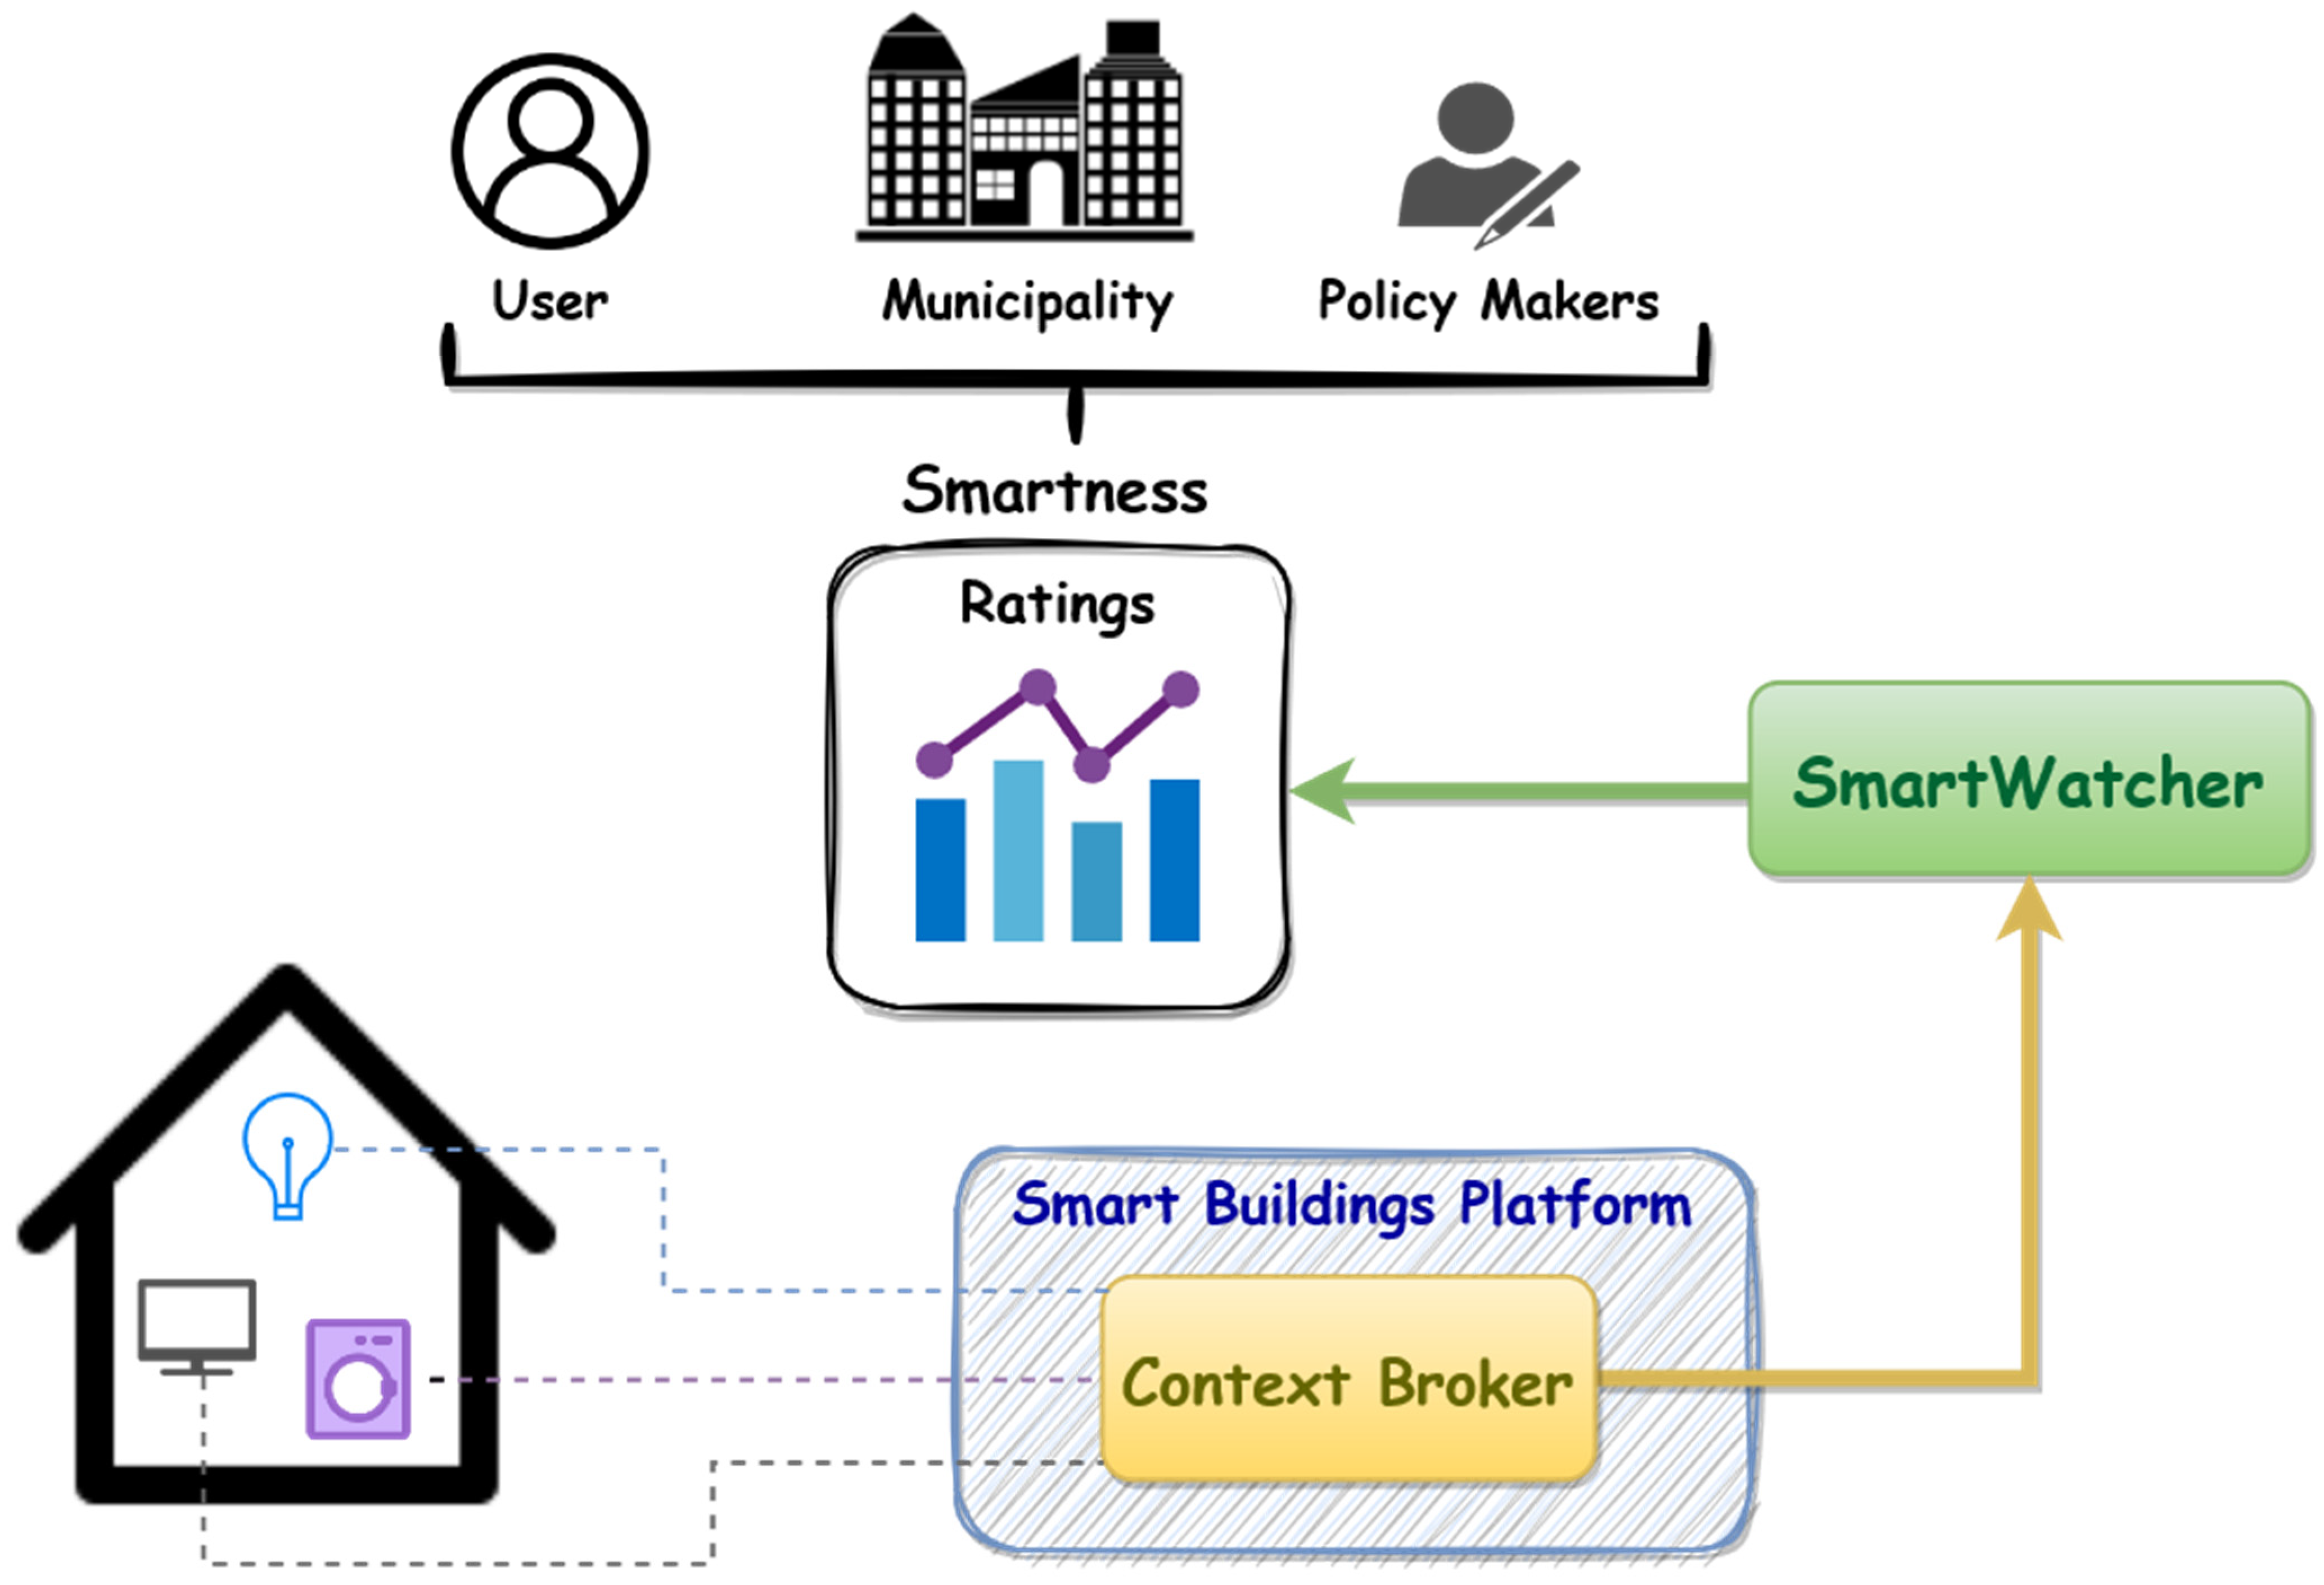
3.3. Smart Building ICT Platforms

Smart buildings need to deal with a great deal of volume of data. It is for this reason that aspects as data modelling in semantics is crucial. The organisation of these data is normally performed in the form of data platforms, commonly based on IoT. The use of semantics significantly enhances interoperability between intelligent platforms, allowing for information to be shared between different systems and to be correctly interpreted by all parties. Initiatives such as FIWARE [35], promoted by the European Union, provide a reference framework for the development of intelligent platforms and different components that form an ecosystem, leading to a standardisation and common model that is already used in numerous intelligent solutions, such as the one proposed in a smart building platform.
FIWARE promotes the use of semantically linked data to achieve a vocabulary that can be understood by any machine or human being, thus, facilitating interoperability and the homogenisation of information between different systems by achieving a common semantic context. To this end, it proposes a context information model called NGSI-LD [36], which, in addition to allowing for the management of context information, is used to facilitate the exchange of information based on linked data. This model has been standardised by the ETSI (European Telecommunications Standardization Institute), and has become a reference model for context information management in intelligent buildings.
Due to commitment towards the use of a common data model and semantically linked data in smart buildings, this automated SRI assessment method takes advantage of these features to achieve a reusable, flexible and interoperable solution that can be integrated into any smart building platform.
This method was tested in a smart building platform, which proposes a multilayered architecture to develop, integrate and deploy a secure interoperable smart platform to provide energy efficiency in smart buildings and interactions with nontechnical end-users and stakeholders.
A smart building platform normally integrates information and devices from different sources, formats or manufacturers into a common data format based on semantic data models. The platform context information is managed by the NGSI-LD model, implemented in the Orion-LD component. In addition, smart building platforms could integrate the Fuseki triple store component with semantically enriched context information to facilitate complex semantic queries. The triple store, in combination with the NGSI-LD context broker, constitutes the knowledge graph solution. Therefore, context information, such as buildings, zones, devices and service-generated data, is available in the knowledge graph.
Figure 1 shows the above components and their connections in an example of a smart building platform architecture.
Therefore, an overview of the use of the platform can be seen in Figure 2. The context broker (within a smart building platform) stores information about the smart devices, which would then be used by SmartWatcher to produce results/ratings. Eventually, these results can be made available to different stakeholders, such as municipalities or policy makers for use.

3.4. Automatic Building Smartness’ Assessment Framework

This subsection aimed to define the methodology used for the automatic SRI assessment by applying the NPL.
In the Python environment, the SRI file was converted into a dataframe through the Pandas library [37]. The dataframe contained the textual description of all the functionality levels (Figure 3), which was the base to which the NLP was applied.
To transform the dataframe in an array, all the functionality levels of the same domain were united and concatenated in the same sentence, so that an array of nine strings, i.e., one for each domain, was obtained. This step was needed to apply the transformation of textual data into digital data through the TF-IDF algorithm, as mentioned in the Introduction Section.
An important step before applying the NLP algorithm was the preprocessing of the text. For this, the removal of stopwords was carried out using the corpus of the NLTK library [38]. Moreover, the punctuation marks were removed, since they were considered irrelevant information, as well as the terms that appeared in more than six domains, which were very common words such as “control” or “information” and did not provide much information about a particular domain. These operations would then be applied together with the TF-IDF algorithm using the Scikit-Learn library [39]. The implementation of the algorithm in Scikit-Learn was performed using TfidfVectorizer [40]. The method returned a matrix indicating the TF-IDF value, i.e., the weight of each term, which was an indicator of the presence of the terms in each domain.
As explained in the Introduction, the data from the network of sensors and equipment of all the pilot buildings were stored in a database called the Fuseki triple store. SmartWatcher would query the triple store to find the devices that had some description containing the terms that appeared in the different domains. Triple store queries were performed through the SPARQL language, and SmartWatcher would then use the Python version of this language with the SPARQLWrapper library [41]. Specifically, given a building and a term, SmartWatcher searches for all the devices of the building whose description includes the term. The output is the number of devices found. In this way, by knowing the importance of a term (the TF-IDF value) and the number of devices related to that term, it is possible to give a partial score by multiplying the two values. By adding up the partial scores, the rate for each domain could be obtained. To these scores, weighting factors obtained from the SRI assessment tool were applied, according to the case. The weighting factors used in this work are reported in Table 2.
Once the scores for each building were calculated using SmartWatcher, the result of the SRI was compared with the scores obtained in a smart building platform. To better understand the performance of SmartWatcher, an analysis of the outcomes could be performed by domains, highlighting the characteristics of each case using the coefficient of determination or R-squared, assessed through Pearson’s method. The final step consisted of the application of a correction factor. Since the SRI assessment in the smart building platform project was expressed through a percentage, while SmartWatcher summed up points, a correction factor was needed to adjust for the difference in the scoring system. For the correction factor, a linear regression was used, using the mean slope, which predicted the SRI score as a percentage using the values calculated through SmartWatcher.

4. Results and Discussion

4.1. Applying SmartWatcher to the Case Study

As mentioned above, one of the main reasons for the implementation of SmartWatcher was to have an efficient method for the assessment of existing buildings; therefore, execution time was a key issue to be considered.
Table 3 shows the execution time of SmartWatcher for the case studies, broken down according to the domains. The tool was capable of evaluating any domain in less than 20 s, and more than half of the domains were evaluable in less than 10 s. It was seen that the variability of the execution time between buildings was much smaller than the variability between domains. This implied that the most determining factor for the execution time was the domain itself, and one could expect that the tool would have very little variation of computational time from one building to another.
In fact, the main factor that had an impact on the execution time was the number of terms to be queried in the context broker, as shown in Table 4. It is clear that heating was the domain with the most terms and, therefore, took the longest time to evaluate, while lighting was the domain with the fewest terms and, therefore, the domain with the shortest execution time. Furthermore, one could observe that the more terms a domain had, the more time variability it had to perform the evaluation, even though the standard variation was generally very small.
The preliminary values obtained after the evaluation (before applying the weighting factors) are shown in the box plot in Figure 4. In this first comparison, it could be seen that the range of values from the clipboard was generally wider and more dispersed, while most of the SmartWatcher values were grouped between zero and ten.
The result of SmartWatcher for the eight buildings, after the application of the weighting factors of Table 2, are reported in Table 5.
It should be noted that one of the main objectives of this work was to create a tool capable of obtaining numerical values that reflected the level of intelligence of a building through the textual requirements of a given smart evaluation methodology and the verbal information contained in the repository of devices, i.e., transforming the descriptive values into quantifiable values. A success case could, therefore, be considered when a nonzero value was obtained through applying SmartWatcher to a building domain.
Table 6 shows the different SmartWatcher cases in relation to the clipboard evaluation, in addition to the success cases: hit refers to the number of domains where both had a value greater than zero; a miss case is when SmartWatcher gave a value of zero, but not in clipboard; and both zero was when both gave a value of zero.
As the total number of domains was 72 (eight pilots with 9 domains), the success rate was 53/72, 73.61%, and the hit rate was (39 + 9)/72, 66.67%.
As can be seen, due to the fact that this was a very new method and approaches for the first time, the results were moderate and could still be improved.

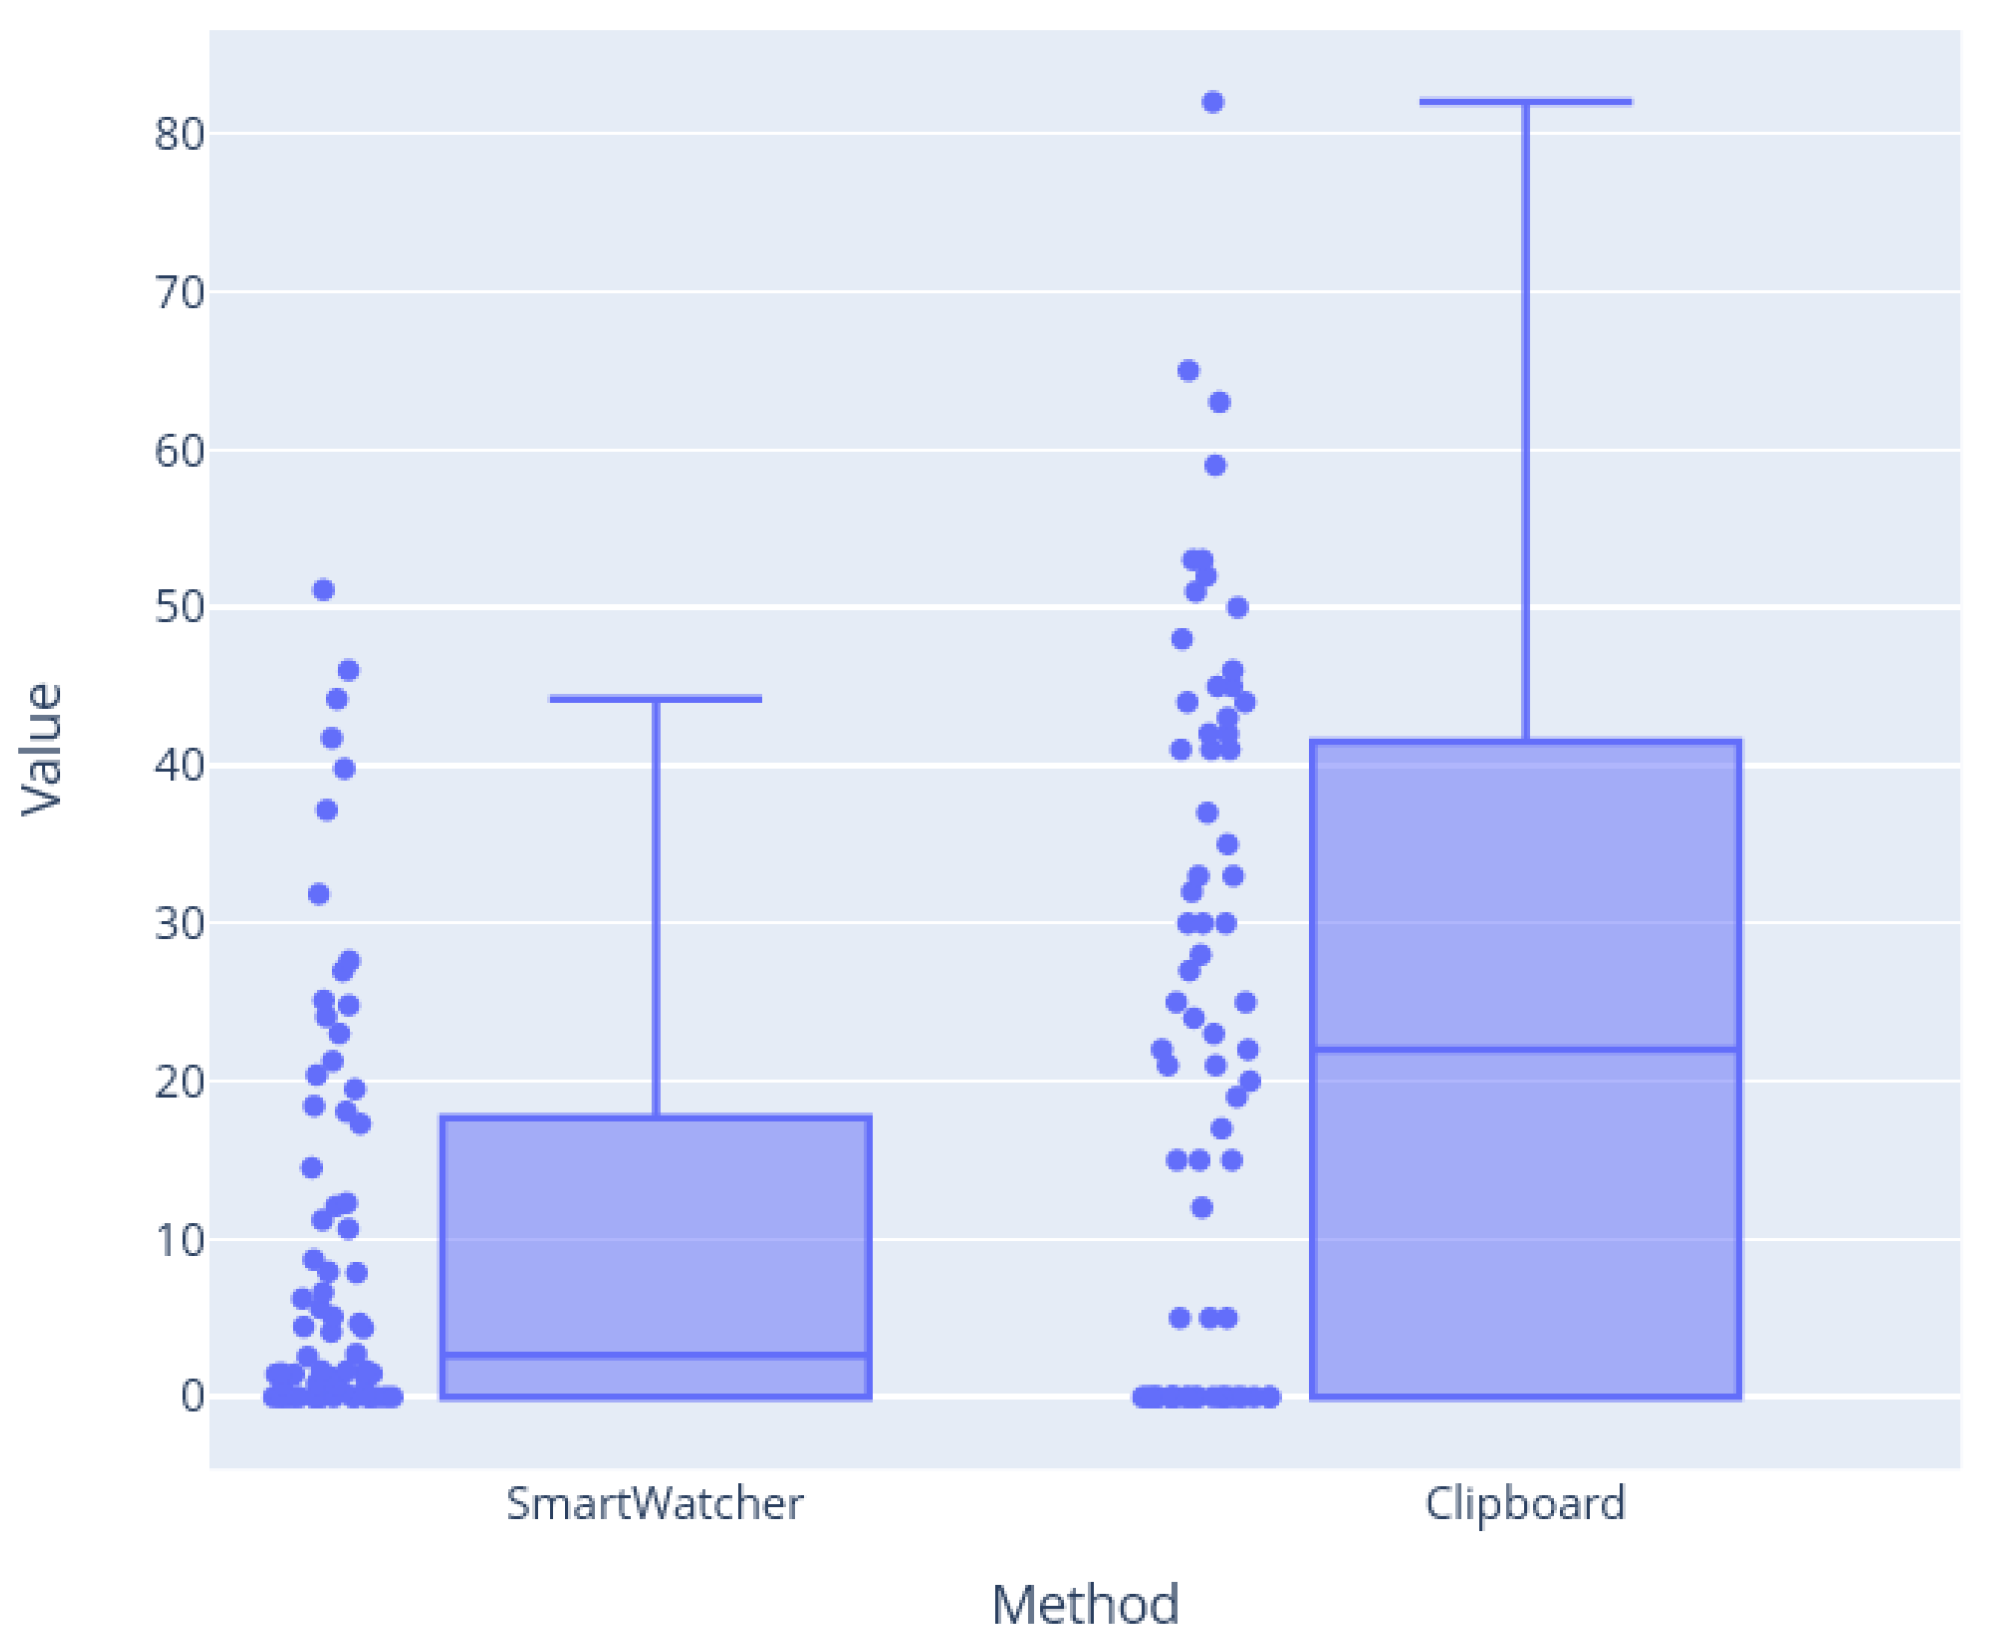
4.2. Analysis of Results and Improvements

In order to see the poor correlation between SmartWatcher’s scores and the real scores, a scatterplot (Figure 5) is shown. The scatterplot, obtained through the Ploty [42] and Plotnine [43] libraries, presents the rates calculated using SmartWatcher on the horizontal axis and the points of the real SRI on the vertical axis. The domains were represented by different colours, while the buildings were differentiated through shapes. If the points in the graph were grouped diagonally, this meant that there was a correlation between both scores, i.e., SmartWatcher’s results were very close to the real SRI’s.
In the case of Figure 5, if the points were widely dispersed, this meant that the estimation of the SmartWatcher score with respect to the actual SRI did not show a high correlation. The correlation was then analysed for each domain, in order to understand these first results. It was seen that some domains, namely, the dynamic envelope, controlled ventilation, cooling and lighting, presented many outliers and noise compared to the others; hence, the points were more dispersed. It could be deduced from this first result that some words in the vocabulary were common among several domains (for example, the word “sensor”), leading to an incorrect rate attribution in certain domains. As a consequence, these domains were eliminated from the assessment, and the performance of SmartWatcher was evaluated on the remaining domains. The adjusted R-squared and scatterplot obtained after this change are reported in Table 7 and Figure 6.
In this case, the mean slope was 8.014. This value was used as the correction factor needed for the comparison of the two different scoring systems. The final rates obtained with SmartWatcher and their comparison to the SRI scores are shown in Figure 7.
Considering the results of Figure 7 and Table 7, one can see that the results for some buildings, namely, Pilot A.2 and Pilot A.3, presented a bigger difference to the real SRI compared to the others. The authors believe that these differences were related to a discrepancy between the real status of the buildings and the data stored in the triple store. In fact, the assessment of the SRI score within the smart building platform was based on real devices installed in the buildings, while the assessment with SmartWatcher was based only on the devices that were registered in the triple store. If the devices of a pilot were not updated in the triple store, SmartWatcher could not include them in the assessment. Hence, the two buildings were removed from the calculation, and the performance of SmartWatcher was calculated for the remaining six pilot buildings.
The final output is depicted in Figure 8, and the main reason why similarities or dissimilarities existed was because, as we discussed before, the corpus terms for querying have not yet been refined for each domain. Some domains require more domain-specific technical terms (in order to find related devices) and others need to reduce some general terms (to eliminate repeated or unrelated devices).

5. Conclusions

In this work, SmartWatcher was developed as an engine capable of automatising the assessment of the SRI score using natural language processing. It was tested on eight pilot buildings of a European smart building platform.
The results showed that the method could be improved, although the first step performed toward the automation of the SRI calculation was more than encouraging, with a 73.61% success rate and 66.57% hit rate. It is also worth noting that this assessment method took less than two minutes to complete and could be carried out remotely.
The main issues found were related to the vocabulary extracted from the Excel file released by the European Commission for the assessment of the score. In particular, many terms were repeated in several smart services belonging to different domains, which caused the incorrect attribution of services in some cases. Hence, an important factor would be to refine the corpus of terms to be queried, in addition to modifying the words according to the domain that was found. For this aim, stemming techniques could be used to extract the root part of the terms, thus, eliminating repeated queries for terms that came from the same root. Another insight for future works could be the application of machine learning techniques that can optimise the results and lead to the obtainment of a better score approximation, e.g., Word2Vec models could be used to find terms that are similar (synonyms) to important terms in the corpus, thus, extending the search range of devices in different domains.
Despite more work being needed to obtain an optimised approximation to the real SRI score, the authors believe that this contribution is a valuable step forward in this new chapter of European legislation. The automation of the new SRI score proposed in this work would have uncountable benefits to the introduction of the new indicator, in particular with respect to the actual lack of qualified assessors and the inevitable subjectivity of the technique, which are reported in the literature as the main issues of the new method.

Author Contributions

Conceptualisation, all authors; methodology, Y.Y. and A.P.R.-G.; investigation, Y.Y., V.T. and J.S.V.; writing and design of paper, Y.Y. and A.P.R.-G.; supervision, A.S.-G. All authors have read and agreed to the published version of the manuscript.

Funding

This project was funded by the Horizon 2020 Project PHOENIX (grant number 893079) and by the Project MASTERPIECE (grant number: 101096836).

Institutional Review Board Statement

Not applicable.

Informed Consent Statement

Not applicable.

Data Availability Statement

Data available on request.

Conflicts of Interest

The authors declare no conflict of interest.

References

  1. European Commission. COM(2011) 112 Final. A Roadmap for Moving to a Competitive Low Carbon Economy in 2050; European Commission: Brussels, Belgium, 2011. [Google Scholar]
  2. Nejat, P.; Jomehzadeh, F.; Taheri, M.M.; Gohari, M.; Majid, M.Z.A. A global review of energy consumption, CO2 emissions and policy in the residential sector (with an interview of the top ten CO2 emitting countries). Renew. Sustain. Energy Rev. 2015, 43, 843–862. [Google Scholar] [CrossRef]
  3. Directive 2012/27/EU of the European Parliament and of the Council of 25 October 2012 on Energy Efficiency; L315/1-56; Official Journal of the European Union: Brussels, Belgium, 2012.
  4. Pan, J.; Jain, R.; Paul, S.; Vu, T.; Saifullah, A.; Sha, M. An Internet of Things Framework for Smart Energy in Buildings: Designs, Prototype, and Experiments. IEEE Internet Things J. 2015, 2, 527–537. [Google Scholar] [CrossRef] [Green Version]
  5. Directive (EU) 2018/844 of the European Parliament and of the Council of 30 May 2018 Amending Directive2010/31/EU on the Energy Performance of Buildings Directive 2012/27/EU on Energy Efficiency; L156/75; Official Journal of the European Union: Brussels, Belgium, 2018.
  6. European Commission; Directorate-General for Energy; Verbeke, S.; Aerts, D.; Reynders, G. Final Report on the Technical Support to the Development of a Smart Readiness Indicator for Buildings: Final Report; Publications Office: Brussels, Belgium, 2020. [Google Scholar]
  7. VITO. Support for Setting Up a Smart Readiness Indicator for Buildings and Related Impact Assessment (Tender Number ENER/C3/2016-554). 2020. Available online: https://smartreadinessindicator.eu/ (accessed on 14 September 2022).
  8. Vigna, I.; Pernetti, R.; Pasut, W.; Lollini, R. New domain for promoting energy efficiency: Energy Flexible Building Cluster. Sustain. Cities Soc. 2018, 38, 526–533. [Google Scholar] [CrossRef]
  9. Märzinger, T.; Österreicher, D. Supporting the smart readiness indicator—A methodology to integrate a quantitative assessment of the load shifting potential of smart buildings. Energies 2019, 12, 1955. [Google Scholar] [CrossRef] [Green Version]
  10. European Commission. C(2020) 6930 Final, Annexes 1 to 9. Supplementing Directive (EU) 2010/31/EU of the European Parliament and of the Council by Establishing an Optional Common European Union Scheme for Rating the Smart Readiness of Buildings; European Commission: Brussels, Belgium, 2020. [Google Scholar]
  11. BIQ. Building Intelligence Quotient. Available online: https://building-iq.com/ (accessed on 22 February 2023).
  12. HSBS. Honeywell Smart Building Score. Available online: https://buildingcontractorpro.secure.force.com/hsbs/MEhsbs_aboutus (accessed on 24 February 2023).
  13. Janhunen, E.; Pulkka, L.; Säynäjoki, A.; Junnila, S. Applicability of the Smart Readiness Indicator for Cold Climate Countries. Buildings 2019, 9, 102. [Google Scholar] [CrossRef] [Green Version]
  14. Ramezani, B.; Silva, M.G.D.; Simões, N. Application of smart readiness indicator for Mediterranean buildings in retrofitting actions. Energy Build. 2021, 249, 111173. [Google Scholar] [CrossRef]
  15. Vigna, I.; Pernetti, R.; Pernigotto, G.; Gasparella, A. Analysis of the building smart readiness indicator calculation: A comparative case-study with two panels of experts. Energies 2020, 13, 2796. [Google Scholar] [CrossRef]
  16. Fokaides, P.A.; Panteli, C.; Panayidou, A. How are the smart readiness indicators expected to affect the energy performance of buildings: First evidence and perspectives. Sustainability 2020, 12, 9496. [Google Scholar] [CrossRef]
  17. PHOENIX. Available online: https://eu-phoenix.eu/ (accessed on 16 September 2022).
  18. Moseley, P. EU Support for Innovation and Market Uptake in Smart Buildings under the Horizon 2020 Framework Programme. Buildings 2017, 7, 105. [Google Scholar] [CrossRef] [Green Version]
  19. Ly, A.; Uthayasooriyar, B.; Wang, T. A survey on natural language processing (nlp) and applications in insurance. arXiv 2020, arXiv:2010.00462. [Google Scholar]
  20. Chowdhary, K. Natural language processing. In Fundamentals of Artificial Intelligence; Springer: Berlin/Heidelberg, Germany, 2020; pp. 603–649. [Google Scholar]
  21. Arellano, A.; Carney, E.; Austin, M.A. Natural language processing of textual requirements. In Proceedings of the Tenth International Conference on Systems (ICONS 2015), Barcelona, Spain, 19–24 April 2015; pp. 93–97. [Google Scholar]
  22. Ramos, J. Using tf-idf to determine word relevance in document queries. In Proceedings of the First Instructional Conference on Machine Learning, Washington, DC, USA, 21–24 August 2003; Volume 242, pp. 29–48. [Google Scholar]
  23. Cambria, E.; White, B. Jumping NLP curves: A review of natural language processing research. IEEE Comput. Intell. Mag. 2014, 9, 48–57. [Google Scholar] [CrossRef]
  24. Bilal, M.; Oyedele, L.O.; Qadir, J.; Munir, K.; Ajayi, S.O.; Akinade, O.O.; Owolabi, H.A.; Alaka, H.A.; Pasha, M. Big Data in the construction industry: A review of present status, opportunities, and future trends. Adv. Eng. Inform. 2016, 30, 500–521. [Google Scholar] [CrossRef]
  25. Hassan, F.U.; Le, T. Automated requirements identification from construction contract documents using natural language processing. J. Leg. Aff. Disput. Resolut. Eng. Constr. 2020, 12, 04520009. [Google Scholar] [CrossRef]
  26. Zhang, J.; El-Gohary, N.M. Semantic NLP-based information extraction from construction regulatory documents for automated compliance checking. J. Comput. Civ. Eng. 2016, 30, 04015014. [Google Scholar] [CrossRef] [Green Version]
  27. Baby, C.J.; Khan, F.A.; Swathi, J.N. Home automation using IoT and a chatbot using natural language processing. In Proceedings of the 2017 Innovations in Power and Advanced Computing Technologies (i-PACT), Vellore, India, 21–22 April 2017; pp. 1–6. [Google Scholar]
  28. Märzinger, T.; Österreicher, D. Extending the Application of the Smart Readiness Indicator—A Methodology for the Quantitative Assessment of the Load Shifting Potential of Smart Districts. Energies 2020, 13, 3507. [Google Scholar] [CrossRef]
  29. Horák, O.; Kabele, K. Testing of pilot buildings by the SRI method. Vytap. Vetr. Instal. 2019, 28, 331–334. [Google Scholar]
  30. Dorizas, P.V.; de Grooe, M.; Volt, J. Indoor environmental quality as a mean to catalyse the acceptance and implementation of the major new EPBD provisions. In Eceee Summer Study Proceedings; European Commission: Brussels, Belgium, 2019; pp. 1237–1242. [Google Scholar]
  31. Markoska, E.; Jakica, N.; Lazarova-Molnar, S.; Kragh, M.K. Assessment of Building Intelligence Requirements for Real Time Performance Testing in Smart Buildings. In Proceedings of the 2019 4th International Conference on Smart and Sustainable Technologies (SpliTech), Split, Croatia, 18–21 June 2019; pp. 1–6. [Google Scholar]
  32. Markoska, E.; Johansen, A.; Lazarova-Molnar, S. A Framework for Fully Automated Performance Testing for Smart Buildings. In Proceedings of the International Congress on Information and Communication Technology, Xiamen, China, 27–28 January 2018. [Google Scholar]
  33. Newsletter Smart Readiness Indicator. Available online: https://ec.europa.eu/newsroom/ener/newsletter-archives/37893 (accessed on 28 February 2023).
  34. Third Plenary Meeting Smart Readiness Indicator. Available online: https://energy.ec.europa.eu/events/smart-readiness-indicator-third-plenary-meeting-2023-03-22_en (accessed on 24 March 2023).
  35. FIWARE. Available online: https://www.fiware.org/ (accessed on 2 March 2023).
  36. NGSI-LD. Available online: https://www.etsi.org/deliver/etsi_gs/CIM/001_099/009/01.04.01_60/gs_cim009v010401p.pdf (accessed on 2 March 2023).
  37. McKinney, W. Data structures for statistical computing in python. In Proceedings of the 9th Python in Science Conference, SciPy 2010, Austin, TX, USA, 28 June–3 July 2010; Volume 445, pp. 51–56. [Google Scholar]
  38. Bird, S.; Klein, E.; Loper, E. Natural Language Processing with Python: Analyzing Text with the Natural Language Toolkit; O’Reilly Media, Inc.: Sebastopol, CA, USA, 2009. [Google Scholar]
  39. Pedregosa, F.; Varoquaux, G.; Gramfort, A.; Michel, V.; Thirion, B.; Grisel, O.; Blondel, M.; Prettenhofer, P.; Weiss, R.; Dubourg, V.; et al. Scikit-learn: Machine learning in Python. J. Mach. Learn. Res. 2011, 12, 2825–2830. [Google Scholar]
  40. Scikit-Learn Algorithm Feature Extraction. Available online: https://scikit-learn.org/stable/modules/generated/sklearn.feature_extraction.text.TfidfVectorizer.html (accessed on 16 September 2022).
  41. SPARQL Wrapper. Available online: https://sparqlwrapper.readthedocs.io/en/latest/ (accessed on 16 September 2022).
  42. Plotly Library. Available online: https://plotly.com/python/ (accessed on 7 October 2022).
  43. Plotline Library. Available online: https://plotnine.readthedocs.io/en/stable/index.html (accessed on 7 October 2022).
Figure 1. A smart building platform and knowledge graph.
Computers 12 00076 g001
Figure 2. Overview of the platform background.
Computers 12 00076 g002
Figure 3. Dataframe containing the textual description of the smart services and the functionality levels of the SRI calculation tool.
Computers 12 00076 g003
Figure 4. Boxplot of domain values obtained using SmartWatcher and real SRI values with clipboard.
Computers 12 00076 g004
Figure 5. Scatterplot of the SRI scores and of the SRI rates obtained with SmartWatcher for each domain and pilot buildings. The domains were differentiated by colours and the buildings by shapes.
Computers 12 00076 g005
Figure 6. Scatterplot of the SRI scores and of the SRI rates obtained with SmartWatcher for each domain and pilot buildings after the adjustment of the domains. The domains were differentiated by colours and the buildings by shapes.
Computers 12 00076 g006
Figure 7. Final comparison between the real SRI scores of the eight pilot buildings and ones obtained through SmartWatcher.
Computers 12 00076 g007
Figure 8. Adjusted final comparison between the real SRI scores of the six pilot buildings and ones obtained through SmartWatcher.
Computers 12 00076 g008
Table 1. Main characteristics and SRI scores of the pilot buildings.
Case StudyPilot APilot BPilot CPilot DPilot E
Computers 12 00076 i001Computers 12 00076 i002Computers 12 00076 i003Computers 12 00076 i004Computers 12 00076 i005
LocationDublin, Ireland
West Europe
Thessaloniki, Greece
South Europe
Skellefteå, Sweden
North Europe
Region of Murcia, Spain
South Europe
Murcia, Spain
South Europe
Building namePilot A.1Pilot A.2Pilot A.3Pilot B.1Pilot C.1Pilot D.1Pilot D.2Pilot E.1
Building typologyNonresidentialResidentialResidentialResidentialResidentialNonresidentialResidentialNonresidential
SRI score
(clipboard)
29%37%12%34%15%32%15%40%
Table 2. Weighting factors used in this paper to address the differences among pilot buildings broken down by domain.
DomainPilot
E.1
Pilot
A.2
Pilot
A.3
Pilot
A.1
Pilot
B.1
Pilot
D.2
Pilot
D.1
Pilot
C.1
Heating0.2400.2450.2453720.2240.2300.2300.2400.230
Domestic hot water0.0900.0670.0672580.0740.0800.0800.090.077
Cooling0.1400.0970.0966540.1480.1100.1100.1400.082
Controlled ventilation0.1100.1330.1334540.1260.1100.1100.1100.137
Lighting0.0500.0390.0392360.0520.0400.0400.0500.042
Dynamic building envelope0.0400.0840.0839440.0410.1000.1000.0400.097
Electricity0.1000.0960.0963270.0960.1000.1000.1000.097
Electric vehicle0.0400.0380.0377550.0380.0400.0400.0400.038
Monitoring and control0.2000.2000.2000.2000.2000.2000.2000.200
Table 3. Execution time (in second) of SmartWatcher per pilot and divided by domain.
EX. Time (Second)Pilot
E.1
Pilot
A.2
Pilot
A.3
Pilot
A.1
Pilot
B.1
Pilot
D.2
Pilot
D.1
Pilot
C.1
Mean EX. Time
Heating16.1715.3815.3915.5716.1015.5616.2015.5915.75
Domestic hot water11.4110.7110.7211.0511.2810.8011.3610.8011.02
Cooling15.7815.1814.9015.1615.8115.1315.9315.0115.36
Controlled ventilation8.317.937.977.998.277.928.437.978.10
Lighting2.742.632.632.652.722.662.812.632.69
Dynamic building envelope6.766.446.436.536.766.396.716.506.57
Electricity11.1410.5710.5110.7010.9310.6411.1510.6110.78
Electric vehicle8.057.667.677.808.047.968.227.827.90
Monitoring and control9.469.019.009.249.379.039.619.179.24
Total time (minute)1.4971.4251.4201.4451.4881.4351.5071.4351.456
Table 4. Number of terms in SmartWatcher’s corpus and the standard deviation of execution divided by domain.
DomainHeatingDHWCoolingCVLightingDBEElectricityEVMC
Number of terms704968361229483541
Standard deviation0.350.300.410.200.070.160.260.200.23
Table 5. Dataframe of SmartWatcher’s results once the weighting factors for each case were applied, divided by domain.
DomainPilot
E.1
Pilot
A.2
Pilot
A.3
Pilot
A.1
Pilot
B.1
Pilot
D.2
Pilot
D.1
Pilot
C.1
Heating5.95280.00000.00002.75618.54920.21112.08589.1779
Domestic hot water1.91460.01870.01870.78471.63120.20341.55771.4959
Cooling2.03290.00000.00000.00000.48060.00000.00000.6505
Controlled ventilation1.23280.00000.00000.18750.68490.13070.49020.6961
Lighting0.03760.00000.00000.00000.06010.00000.00000.0000
Dynamic building envelope2.04470.06340.06341.04494.41990.66291.84074.0509
Electricity0.46580.00000.00000.00000.56270.16581.20830.0324
Electric vehicle charging1.10470.05450.05460.04850.31470.00001.07900.1029
Monitoring and control4.81490.33210.33213.68706.37020.82444.60303.6155
Table 6. Success, hit, miss and zero rate for SmartWatcher.
SuccessHitMissBoth Zero
5339109
Table 7. R-squared obtained through the comparison of the SRI scores and the results from SmartWatcher after the adjustment of the domains.
BuildingSlopeR2
Pilot E.11.7620370.428398
Pilot A.229.3431100.838263
Pilot A.322.4817040.359750
Pilot A.13.0916850.568483
Pilot B.11.1992170.545561
Pilot D.24.8008070.172023
Pilot D.10.6179410.238251
Pilot C.10.8157960.823083
Disclaimer/Publisher’s Note: The statements, opinions and data contained in all publications are solely those of the individual author(s) and contributor(s) and not of MDPI and/or the editor(s). MDPI and/or the editor(s) disclaim responsibility for any injury to people or property resulting from any ideas, methods, instructions or products referred to in the content.

