1. Introduction
E-learning is a teaching modality that uses information and communication technologies (ICT) to facilitate learning through the Internet [
1,
2]. In e-learning, students can access educational materials online, interact with content at their own pace, and communicate with teachers and other students through online tools such as discussion forums, chat rooms, and video conferencing [
3]. E-learning can take many different forms, from online courses complete with videos and assessments, to short, self-administered learning modules. It can also be used in combination with other teaching methods, such as face-to-face classes or tutorials [
4]. E-learning has proven to be an effective tool for distance learning and online training, allowing students to access educational resources from anywhere and at any time, making them more accessible and convenient.
Even though e-learning has many advantages, it also presents some challenges and problems. For example, within e-learning, some sessions are carried out asynchronously, which means that students may feel isolated by not having the social interaction they have in a traditional classroom [
5]. This can affect the motivation and commitment of students. In addition, this requires a structured plan that generates motivation and discipline in the student to remain committed to the learning process. Some students may have difficulty staying motivated and focused on online content. Additionally, there are technical problems such as Internet connection, software, or hardware problems that can affect access to educational resources and, therefore, the learning process. In some cases, students may find it difficult to receive immediate feedback from their teachers and peers, which can hinder the learning process and the improvement of their skills [
6].
Works like [
7] mention that there are different methods and tools to measure student concentration in e-learning. For example, quizzes are common tools used to measure student concentration and engagement in e-learning [
8]. These may include questions that measure student attention, level of engagement, and interest in the content. In addition, some systems use gaze tracking software to monitor student eye movement as they interact with online course content [
9]. These systems provide information on student attention and concentration at different times of the course. Other systems using biometric sensors can measure a student’s physiological activity, such as heart rate, brain activity, and sweating, to determine the student’s level of concentration and engagement. There are also methods included in learning management platforms (LMS) that integrate online interaction analysis tools, which present online interaction data, such as the frequency and type of interactions in discussion forums or online chats, can provide information about the level of participation and commitment of the students in the course.
In this work, a blink counting system is proposed to determine the level of concentration, relating the resulting statistics with similar works that determine the average blink rate of a person from 8 to 21 blinks per minute [
10]. However, when a person is deeply focused on a specific visual task, the blink rate is significantly reduced to an average of 4.5 blinks per minute [
11,
12]. The blink rate increases to more than 32.5 blinks per minute when the individual’s concentration level is low. In addition, this system integrates the development of an algorithm for the classification of emotions through the identification of gestures that the student generates during an academic activity. The study [
13] explores how the emotional state of students varies during the learning process and how emotional feedback can improve learning experiences. In addition, there are emotional factors such as happiness, boredom, surprise, and neutrality that denote a positive, constructive learning experience, while emotions such as sadness, fear, anger, and disgust represent a negative experience [
14,
15].
The design of systems that use artificial intelligence (AI) to identify the level of concentration of e-learning students has garnered great interest and motivation on the part of researchers in the educational sector. First, one of the main goals of online education is to make sure that students are fully engaged and focused during the learning process. Inattention or distraction can negatively affect student performance and ultimately affect their ability to learn and retain information. Therefore, the use of AI systems to measure student attention can help ensure that students are fully engaged in the learning process. Second, the development of systems that use AI to measure the concentration level of students through blink counts and emotion identifications helps to improve the quality of online education [
16]. The information collected by these systems helps educators identify when students are distracted or having difficulty concentrating. Armed with this information, tutors can tailor their teaching approach and provide additional resources to help students stay focused and engaged during the learning process.
Third, the use of AI systems to measure student attention also helps improve the efficiency of online learning. By providing alerts when students are distracted or inactive, AI systems help students refocus and become more productive in their study time. This allows students to complete their work more efficiently and improve their ability to retain information. Finally, the motivation to develop systems that use AI to measure student attention is related to competitiveness in the online education market. With the growing popularity of this educational model, institutions are constantly looking for ways to improve the quality and efficiency of the learning process to remain competitive in the market.
2. Materials and Methods
The method consists of two components to define the concentration level of students in e-learning. In the first stage, a blink-counting algorithm is developed and used to measure the frequency and duration of eye blinks [
17]. Systems with this capability use sensors to detect flicker and then record the information in a database. Blink frequency measurement is useful for measuring a person’s attention and concentration in different situations, including e-learning. Studies have shown that blink frequency can decrease when a person is highly focused on a task [
11,
18]. Blink counting systems use different detection techniques, such as cameras, electro-oculography sensors, and motion sensors. These systems are portable and non-invasive, making them easy to use in a variety of situations. The results obtained with a blink counting system should be evaluated in conjunction with other measures, such as questionnaires, analysis of online interactions, identification of emotions, etc., to obtain a more complete understanding of the level of concentration and attention of the students [
12].
In the second component, an algorithm is designed to identify student emotions in an e-learning environment. An algorithm for emotion classification uses different techniques, such as the detection of facial expressions, the measurement of electrical activity in the brain, and the detection of physiological changes such as heart rate and respiration [
19]. These systems use algorithms and machine learning models to identify and classify a person’s emotions into different categories, such as happiness, sadness, fear, anger, and surprise. In the context of e-learning, emotion rating systems can be useful for measuring students’ emotional responses to different course elements, such as learning materials and interactions with other students and teachers [
20]. This information is used to personalize online content and interactions and enhance the learning experience for students.
In this work, the use of the images of the students and the objective of this study were revealed. Therefore, informed consent was obtained from the people participating in this study. The design of the student concentration level identification system with the use of AI involves several technical details; among these details considered, signal processing and the data collected by sensors or cameras are processed by signal processing techniques to extract relevant characteristics that can indicate the level of concentration of the student. Machine learning: machine learning techniques are used to train models that can classify the concentration level of the student based on the extracted features. The integration of software and hardware is for the system to work effectively. Performance evaluation and improvement: the system must be continuously evaluated to measure its accuracy, and improvements must be made when necessary. Privacy and security: appropriate measures must be taken to ensure that data are secure, and that student privacy is respected. The implementation in real-time: the system must be able to process the data and classify the concentration level of the student in real time so that it can be used in an educational environment.
2.1. Review of Related Works
This paper proposes the use of AI algorithms to identify the level of concentration in university students; the use of AI techniques has the potential to be useful to improve education and academic performance. However, in works such as [
11,
12], it is mentioned that it is important to consider that any AI application must be carefully designed and developed to guarantee that it is accurate, fair, safe, and ethical. Furthermore, according to [
21], there must be transparency as to how student data are collected and used so that users can trust the tool and feel comfortable using it.
Online education or e-learning has gained popularity in recent years due to its accessibility, flexibility, and convenience for students. However, one of the most important concerns for educators is how to ensure students are fully focused and engaged during online learning. One solution that has been explored is the use of AI systems to monitor and measure the concentration level of students. Currently, several research papers have addressed the issue of the use of AI systems to identify the level of concentration of students in e-learning. An example of this is the study carried out by [
22], where they developed an AI model to measure students’ attention using their device’s webcam. The model was based on tracking the student’s gaze and head movement to determine their level of concentration. The study yielded positive results, showing that the model was able to accurately identify the level of attention of the students.
Another interesting study was conducted by [
23], where a machine learning-based AI system was used to analyze mouse cursor behavior and student keystrokes. The system was able to detect when students were distracted or inactive and provide alerts to help keep their attention during learning. In addition, the work of [
24] focused on the use of physiological sensors to measure the attention level of students. Electroencephalography (EEG) sensors were used to measure the students’ brain activity, and skin conductance sensors measured their emotional responses. The study demonstrated that physiological data can be used to assess students’ attention and emotions during online learning.
Among the problems identified in e-learning, several studies emphasize the identification of the concentration level of students in this modality of study. In the results and conclusions of these works, it is determined that the levels of concentration are affected by various factors such as the design of the course, the technology used, and the level of student participation, among others. However, other related work suggests that students’ concentration in e-learning can be affected by factors such as the amount of social interaction, the level of difficulty of the content, the amount of material to be covered, and the quality of feedback. For example, a study published in the journal
Computers & Education [
25] found that the amount of social interaction, such as online communication with classmates and teachers, can improve students’ concentration and performance in e-learning. Another study published in the
Journal of Educational Psychology [
26] suggests that the complexity and level of difficulty of content can affect students’ concentration. Additionally, other studies have found that information overload can affect student concentration in e-learning. Therefore, it is recommended that online courses be designed with an adequate amount of information, organized into manageable modules, and allow frequent feedback to maintain students’ attention and motivation.
Works like [
27] mention that there are different methods and tools to measure student concentration in e-learning. For example, quizzes are common tools used to measure student concentration and engagement in e-learning. These may include questions that measure student attention, level of engagement, and interest in the content. In addition, some systems use gaze tracking software to monitor student eye movement as they interact with online course content [
28]. These systems provide information on student attention and concentration at different times of the course. Other systems using biometric sensors can measure a student’s physiological activity, such as heart rate, brain activity, and sweating, to determine the student’s level of concentration and engagement. There are also methods included in LMS that integrate online interaction analysis tools, which present online interaction data, such as the frequency and type of interactions in discussion forums or online chats, and can provide information about the level of participation and commitment of the students in the course.
While these studies show promising results, it is important to note that the use of AI systems to measure students’ attention levels has also raised ethical concerns. Some argue that the constant monitoring of students can violate their privacy and create an environment of mistrust. Therefore, AI systems must be implemented with transparency, and the rights of students must be respected.
2.2. Identification of the Environment and the Population
This work is carried out with the participation of students from a university in Ecuador. The sample size is given by all the students enrolled in the 2020 promotion at the Faculty of Administrative Sciences. In this cohort, there are a total of 229 students. The volume of students is not high; therefore, the entire cohort is considered. By including the entire population, a more precise result is sought, and this research is applied to matters that are directly related to the use of ICT. Therefore, the data included are those obtained in the subject of office automation II. In this matter, the use of computing devices is a priority for the development of different activities. In the structure of the subject, synchronous and autonomous activities have been defined, in which the student must comply with the use of the algorithms that measure the student’s concentration.
The synchronous activities are guided by the tutor; for the development, it is essential to use personal computer equipment such as computers, cameras, tablets, etc. The activities are varied, from reading articles to developing practical exercises. Autonomous activities, such as synchronous ones, depending on the use of a computer, include readings, research, the development of mental maps, exercises, etc. The course where the system is implemented is made up of three sessions per week, 60 min each, one of which is synchronous.
2.3. Method
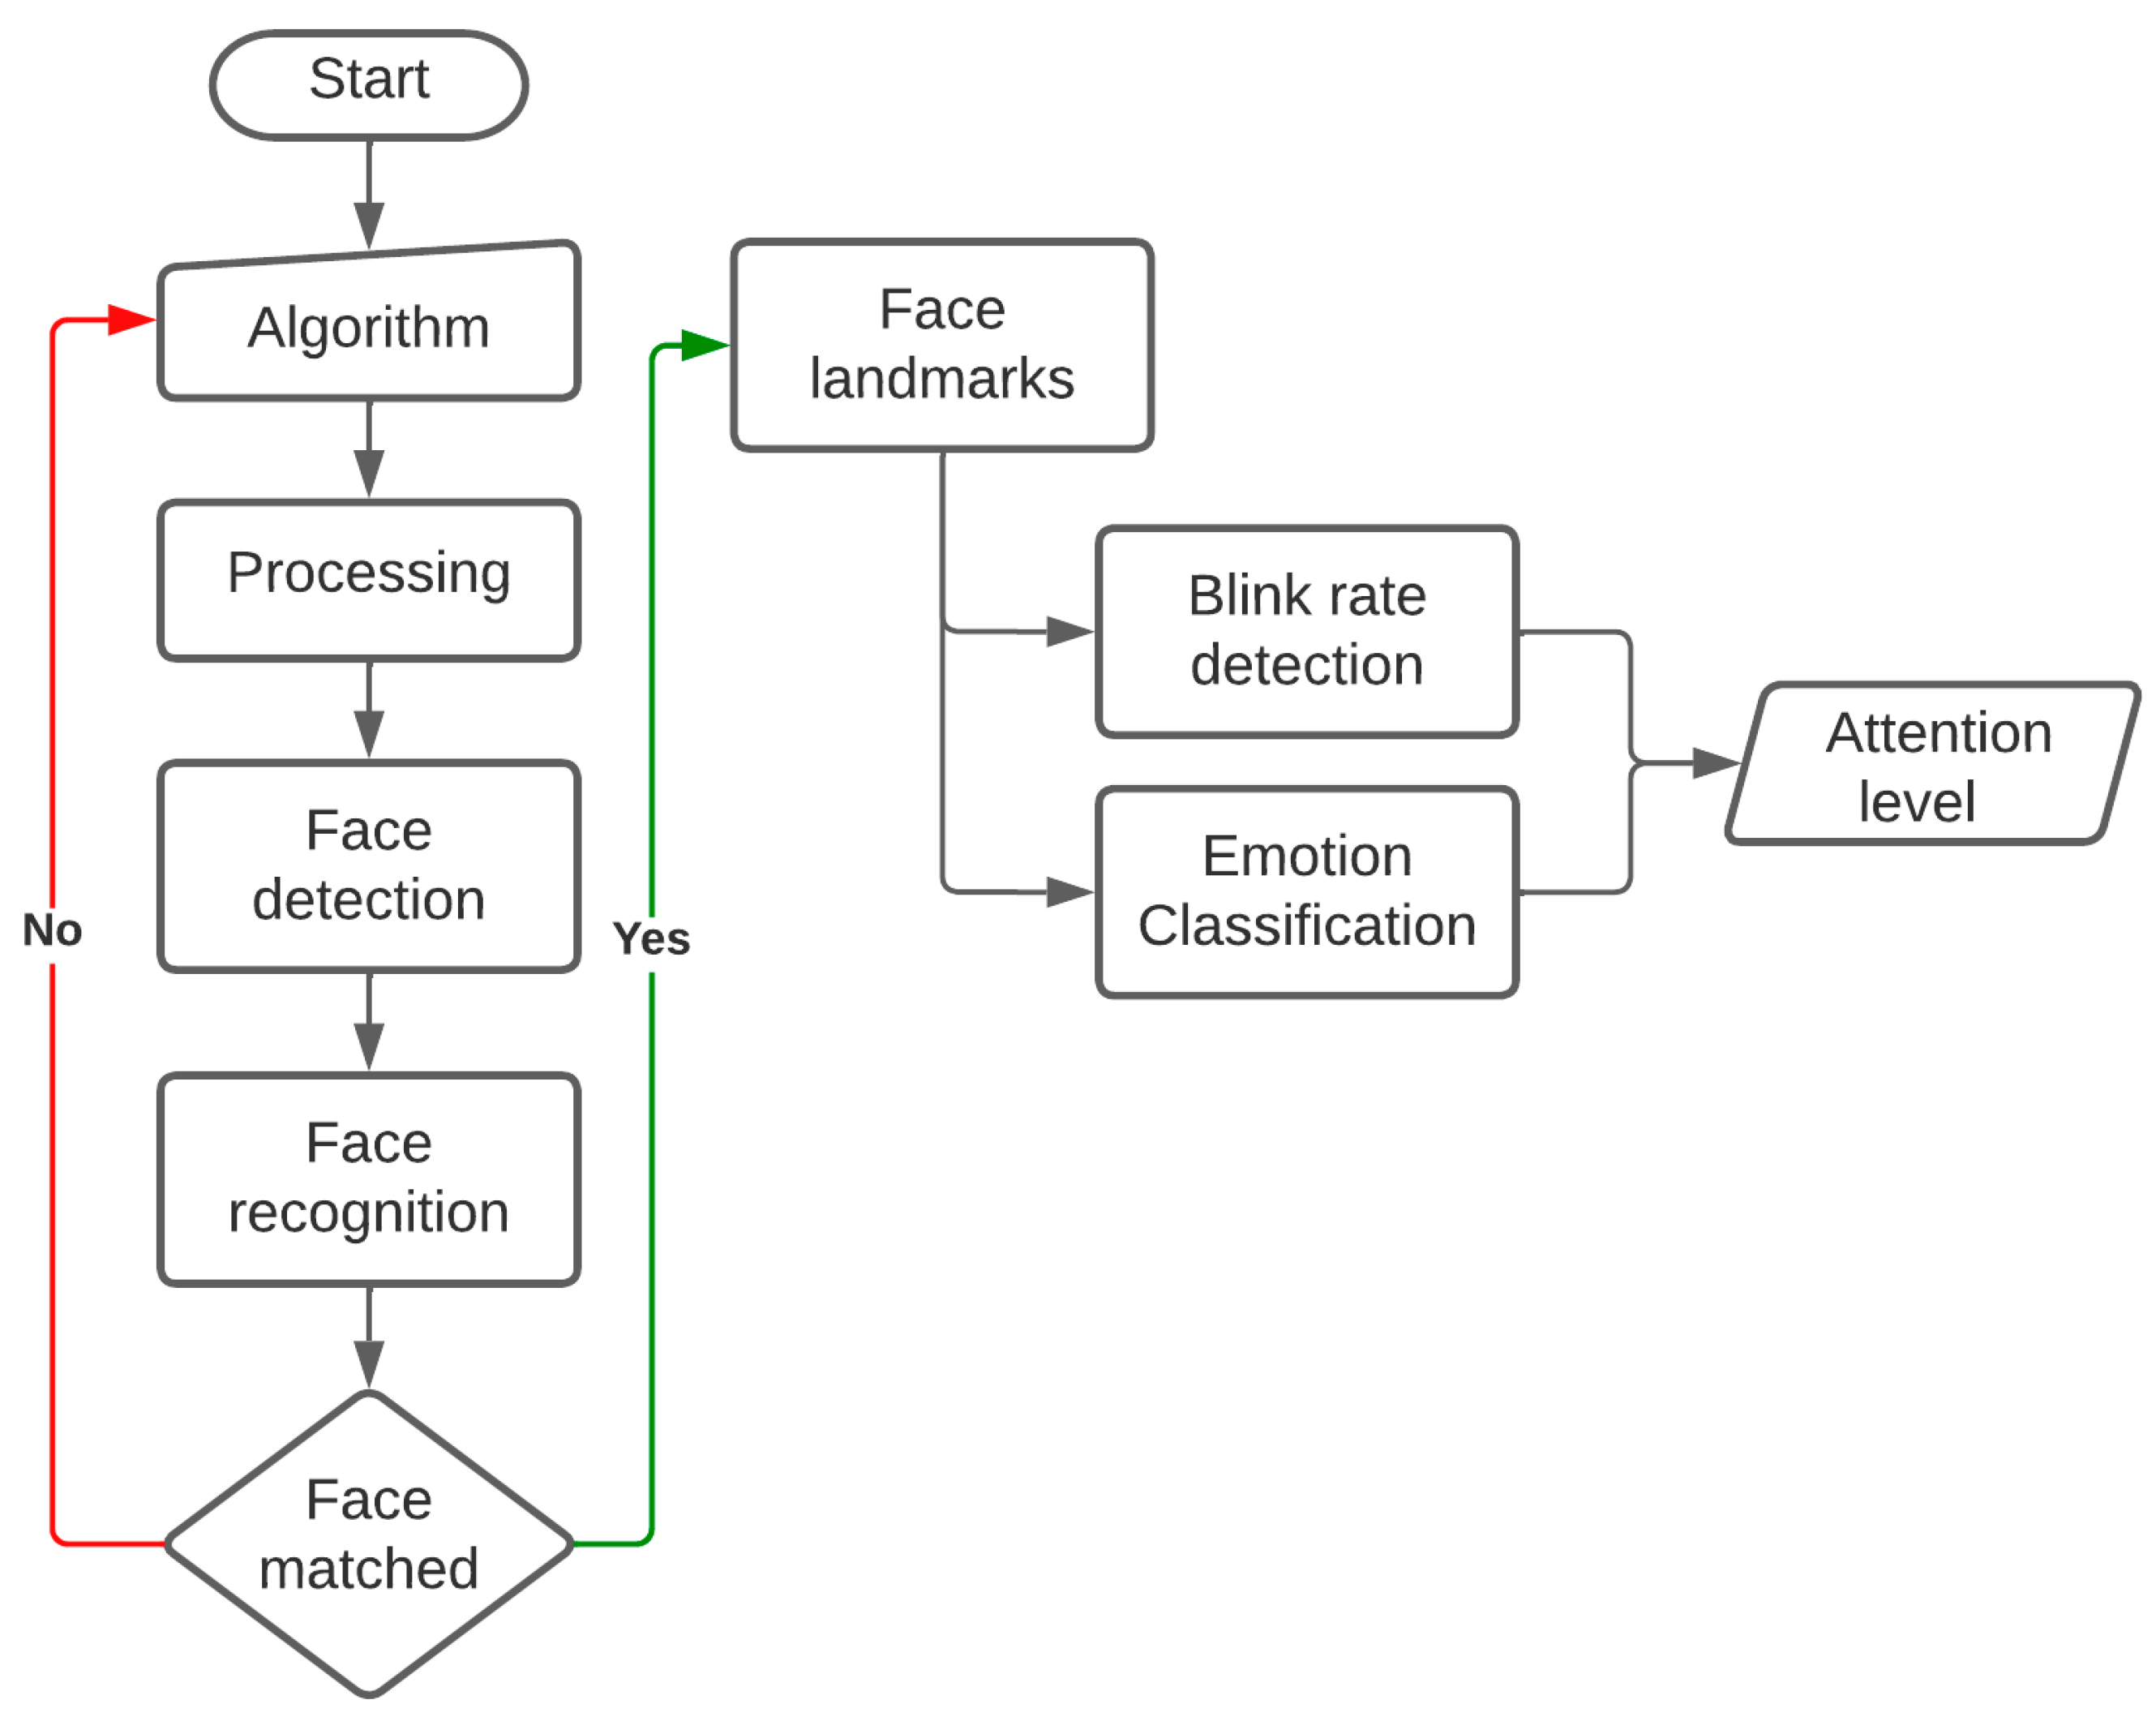
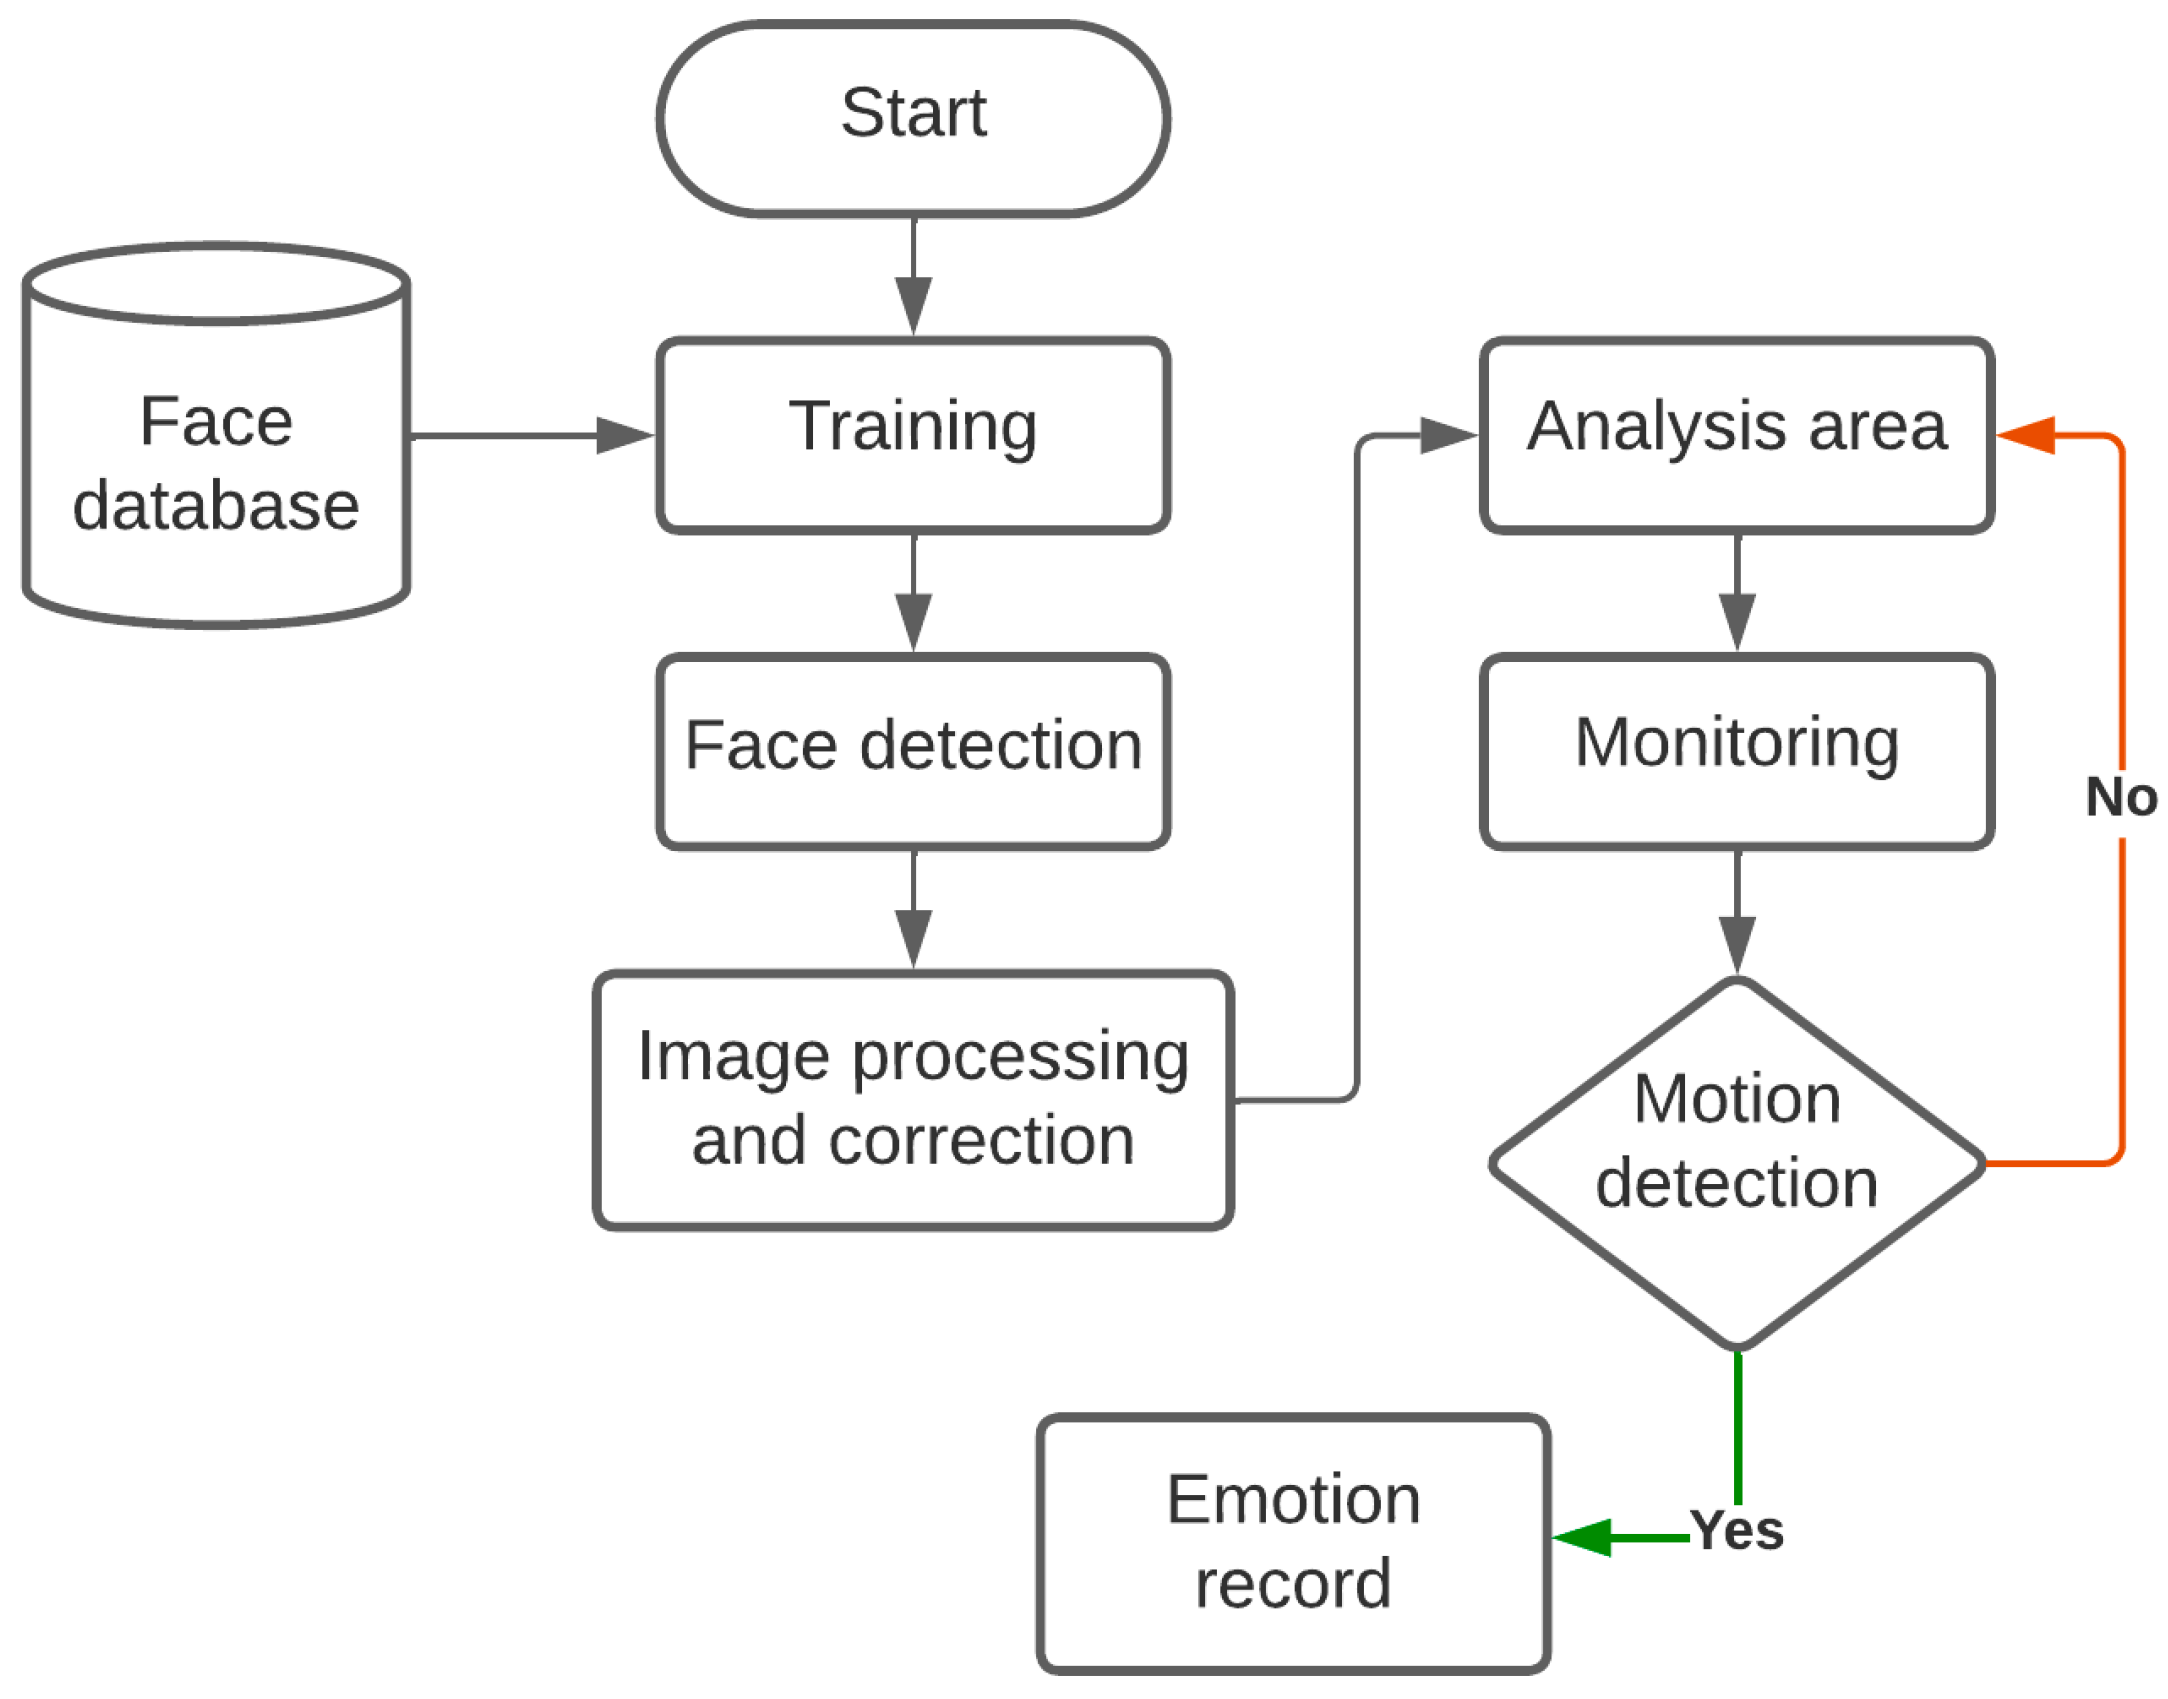
This study makes use of two parameters to calculate the attention level of the e-learning student. The ability to concentrate is calculated using blink rate and facial expression, and this process is continuously updated over 5 s. Instead of a sequential run, all the models needed to calculate the concentration level are run in parallel once the online class starts. This is obtained by using multi-threading in all functions, which plays an important role in reducing the time consumption of each model as well as the whole system [
29]. Every 5 s, the model will generate the attention span score and provide real-time feedback to students in the form of live graphs that are plotted for each parameter, as well as the calculated attention span score [
30,
31]. The general architecture of the proposed system is shown in
Figure 1; it is composed of several stages that focus on image processing, classification, and categorization.
2.4. Design and Development of the Blink Count Algorithm
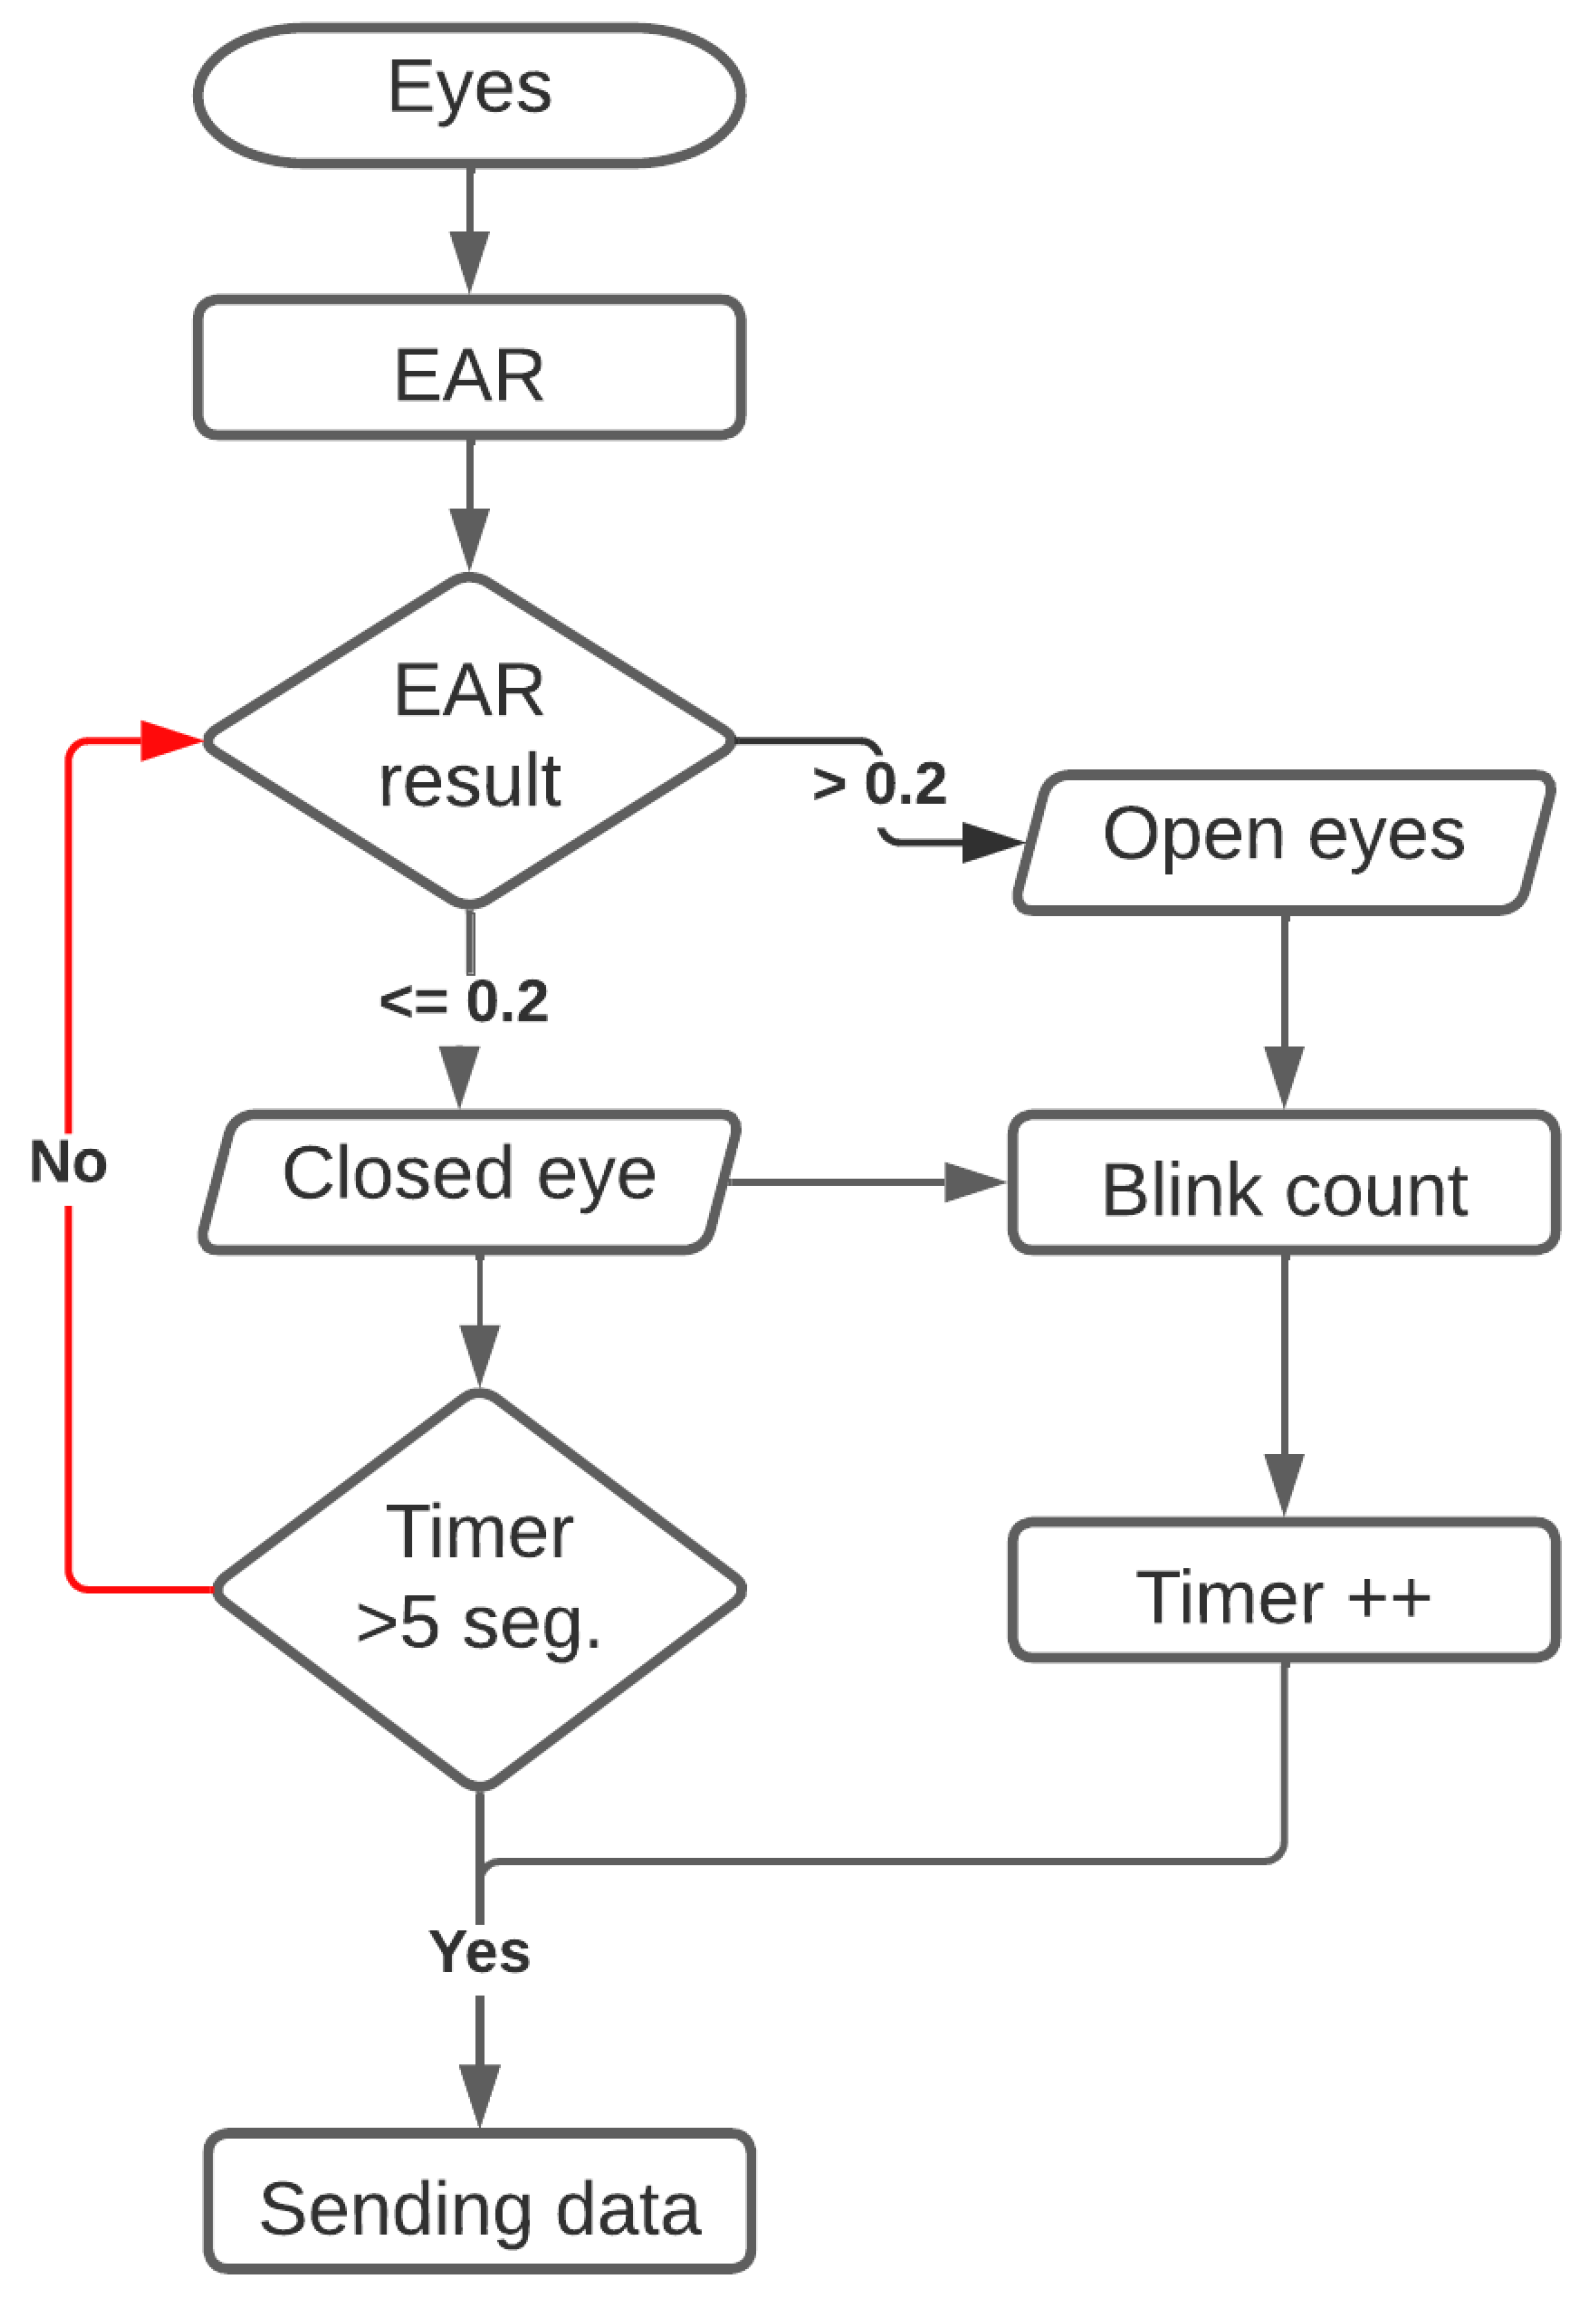
The blinking of the human eye is the object of study by psychologists, psychiatrists, ophthalmologists, neurophysiologists, etc., due to the numerous applications attributed to it. Blinking can be used as a criterion for the diagnosis of certain medical conditions of a patient or to determine the level of concentration of a person before an activity is carried out with the use of computing devices. There are a lot of variations when it comes to blinking, and several studies mention that, depending on the task that is performed and the conditions that are performed, the influence on blinking will be different. Thus, when a person performs tasks with a high degree of concentration, the number of blinks is reduced. A fundamental part of the design of an image processing algorithm is that it can detect if there is a specific object in an area [
32]. In
Figure 2, the phases for the count of blinks are presented. In these, the proposed algorithm with the objective of counting blinks is represented; its initial process must establish if there is a face within an image. Once a face has been identified, the algorithm must identify and detect the desired area, in this case, the person’s eyes, for a subsequent count of blinks during a defined period.
There are several computer vision techniques and libraries that automatically detect flickers in a video sequence or streaming. These techniques are based on an estimate of movement in the region of the eye; the face and eyes are detected by a Viola–Jones-type detector [
33]. When applied, movement in the eye area is estimated from the optical flow by sparse tracking or by applying the intensity difference from frame to frame and adaptive thresholding. This process allows for identifying if the eyes are covered by the eyelids or not.
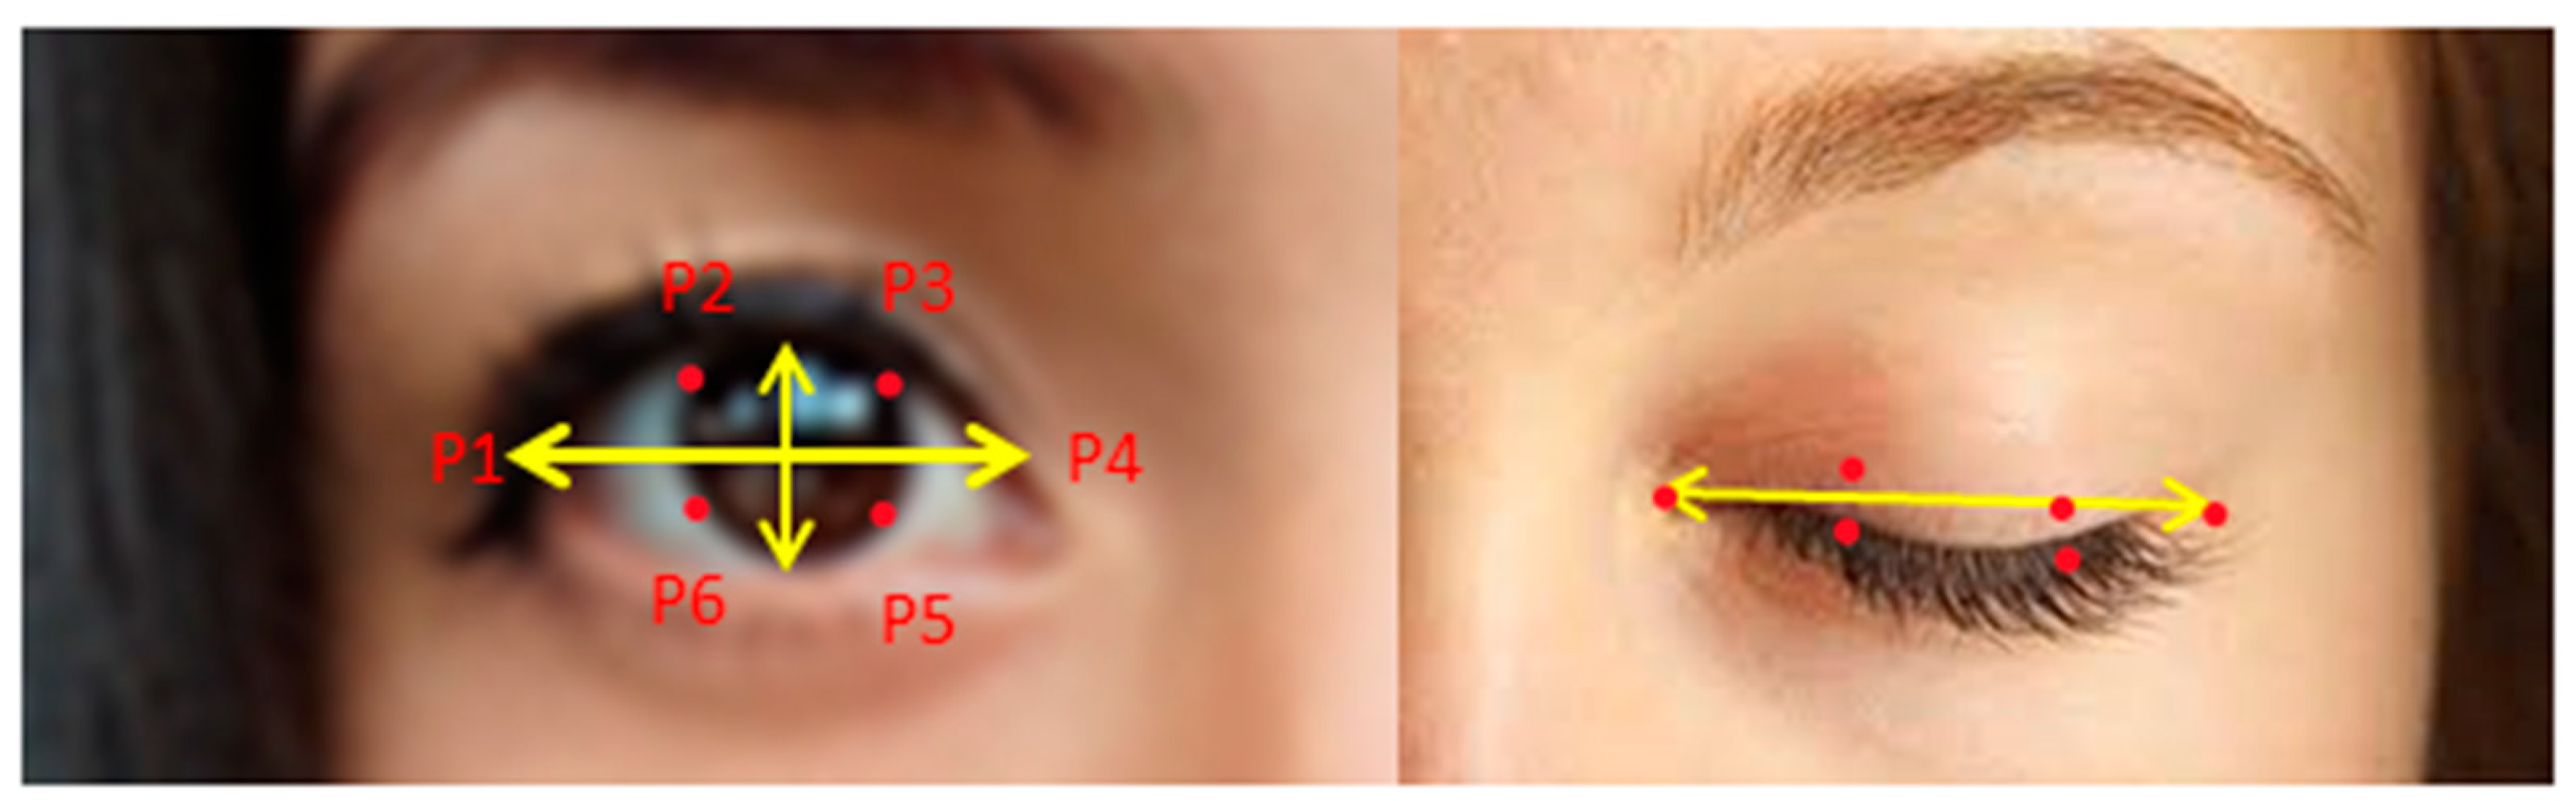
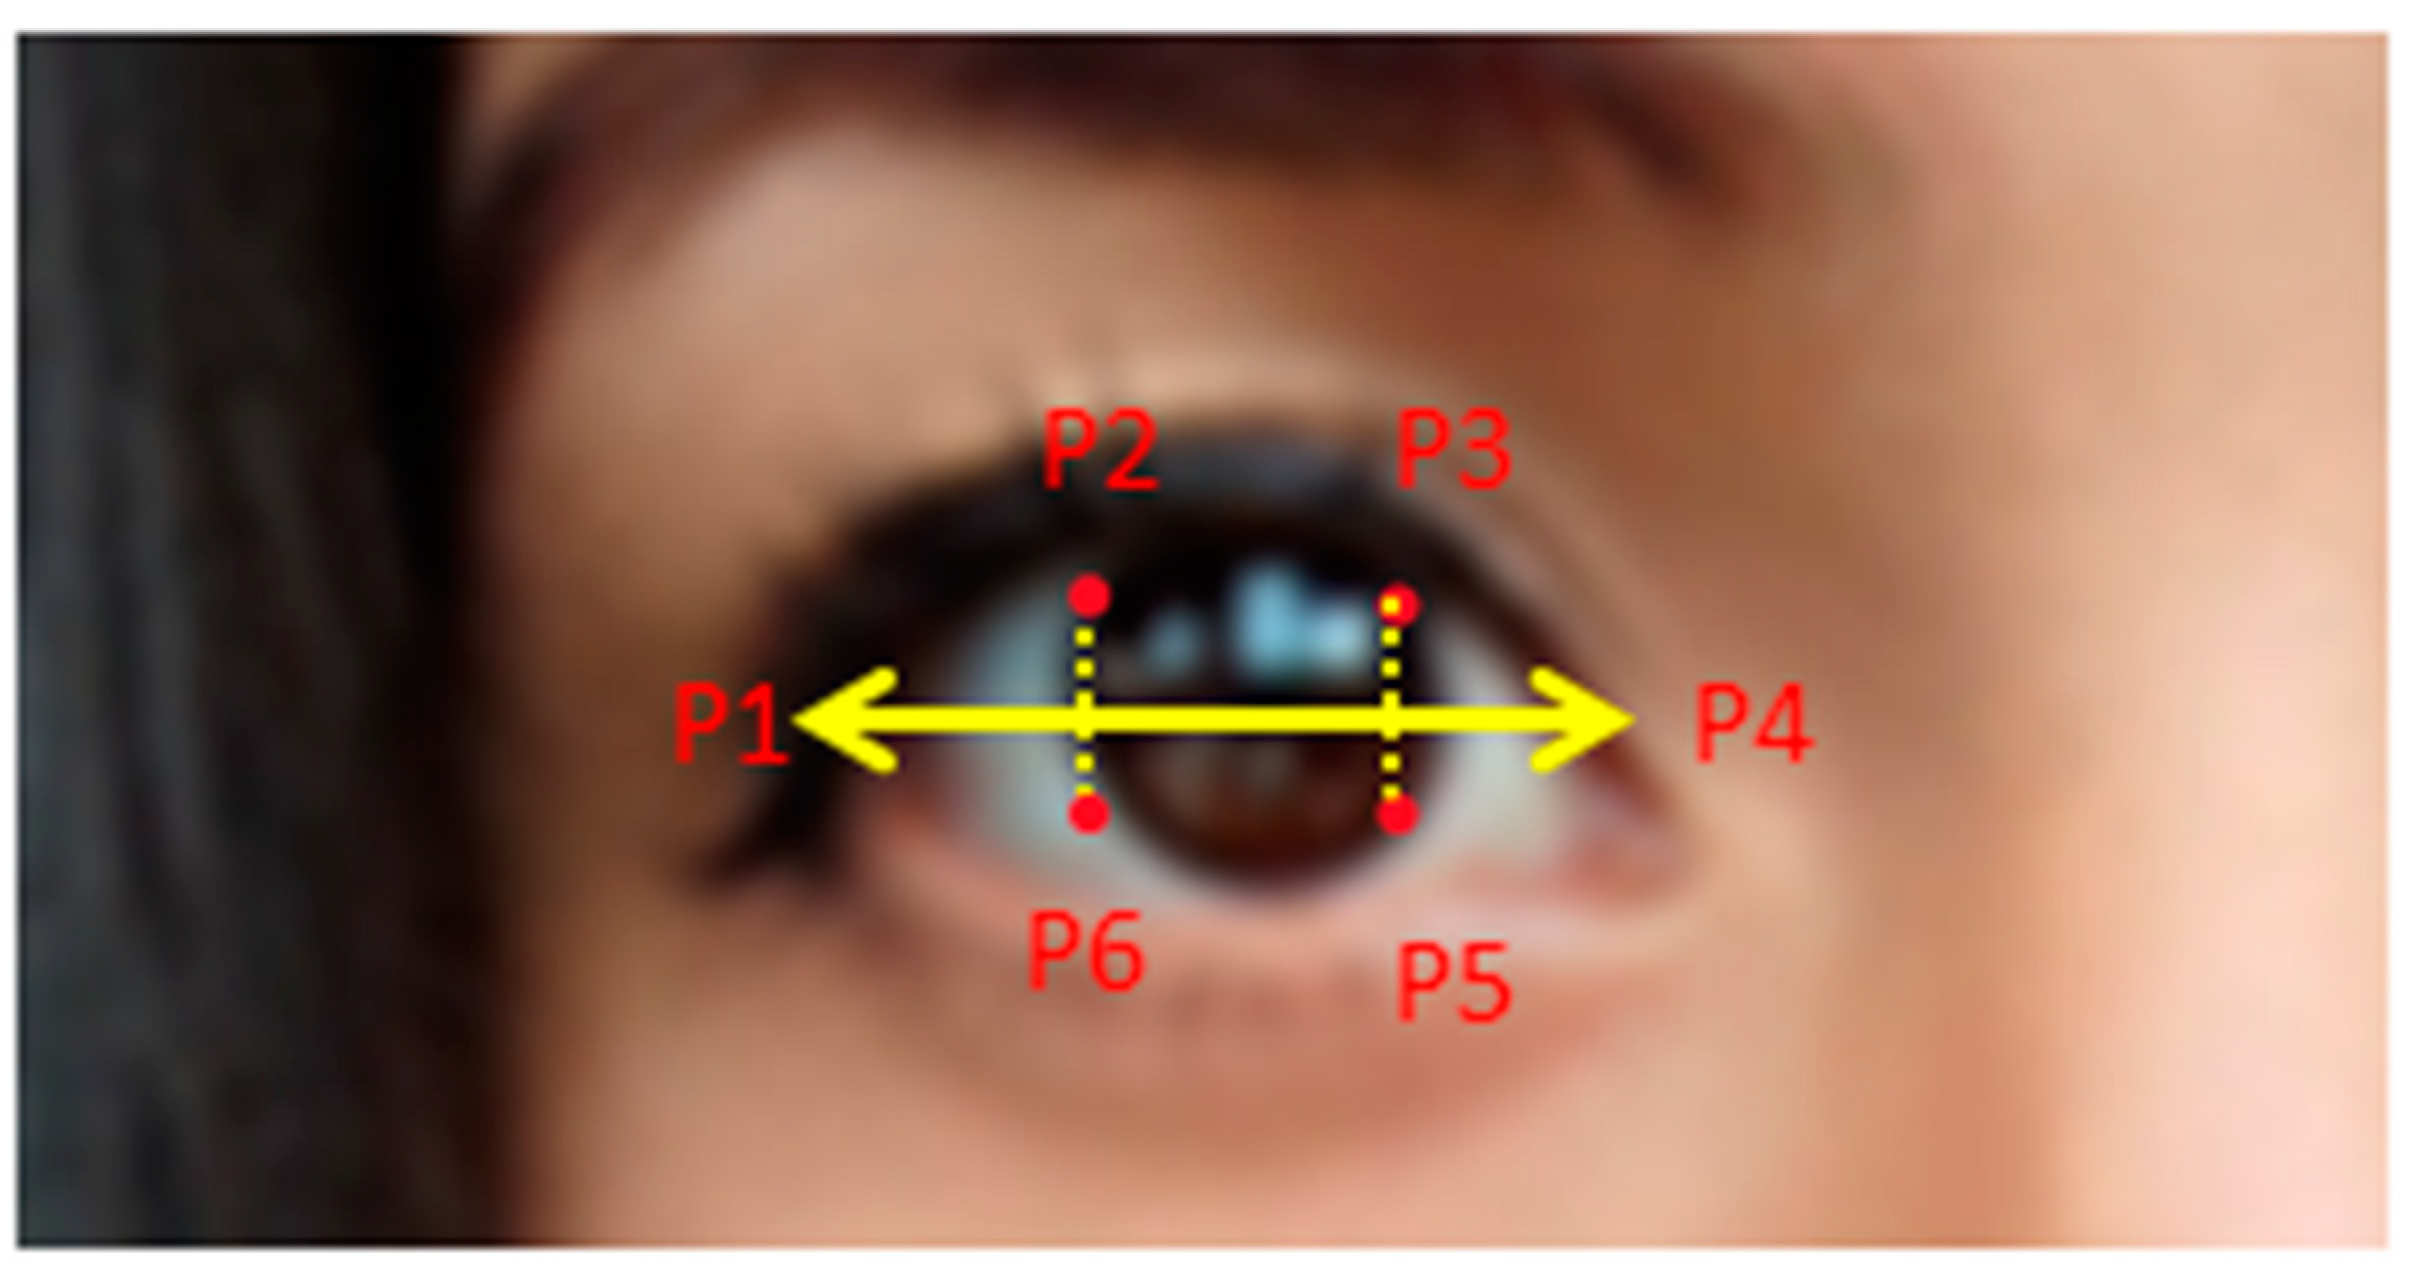
For blink detection, the regions containing the pairs of eyes are cut out, and each eye is divided into two halves. With this, the eye aspect ratio (EAR) is calculated using Euclidean distances, which are observed in
Figure 3 for each frame according to Equation (1), and identify if the eyes are open or closed [
34]. A countdown timer has also been incorporated into the algorithm design. This is activated once a blink is detected and keeps track of the number of seconds the eyes are closed. The purpose of this event is to conclude that the user enters a sleepy state (loss of attention) by detecting that the eyes are closed for more than two seconds. For the calculation of the frequency of blinks, the number of blinks is taken continuously at an interval of 5 s to determine the average blink rate of the user. The EAR threshold value is set to 0.2 based on the experiments performed.
In the equation, p1, p2, pn, etc., are the reference point locations. Since the blinking is performed by both eyes synchronously, the EAR is averaged to determine whether there is complete blinking.
The algorithm proposed for the design of the blink counter is developed in Python. In this, several libraries are applied, among which MediaPipe Face Mesh stands out, from which 468 referential points distributed on the person’s face are obtained when it is detected [
35,
36]. Of all the reference points, 12 points are taken to detect the eyes, six for the left eye and six for the right eye, as shown in
Figure 3.
In classification, generally, a low EAR value does not mean that a person is blinking. A low EAR value can occur when a subject intentionally closes their eyes for a long time or makes a facial expression, yawns, etc., or the EAR captures a brief random fluctuation of the reference points. In these cases, it is possible to use a classifier that takes as input a time window greater than one frame.
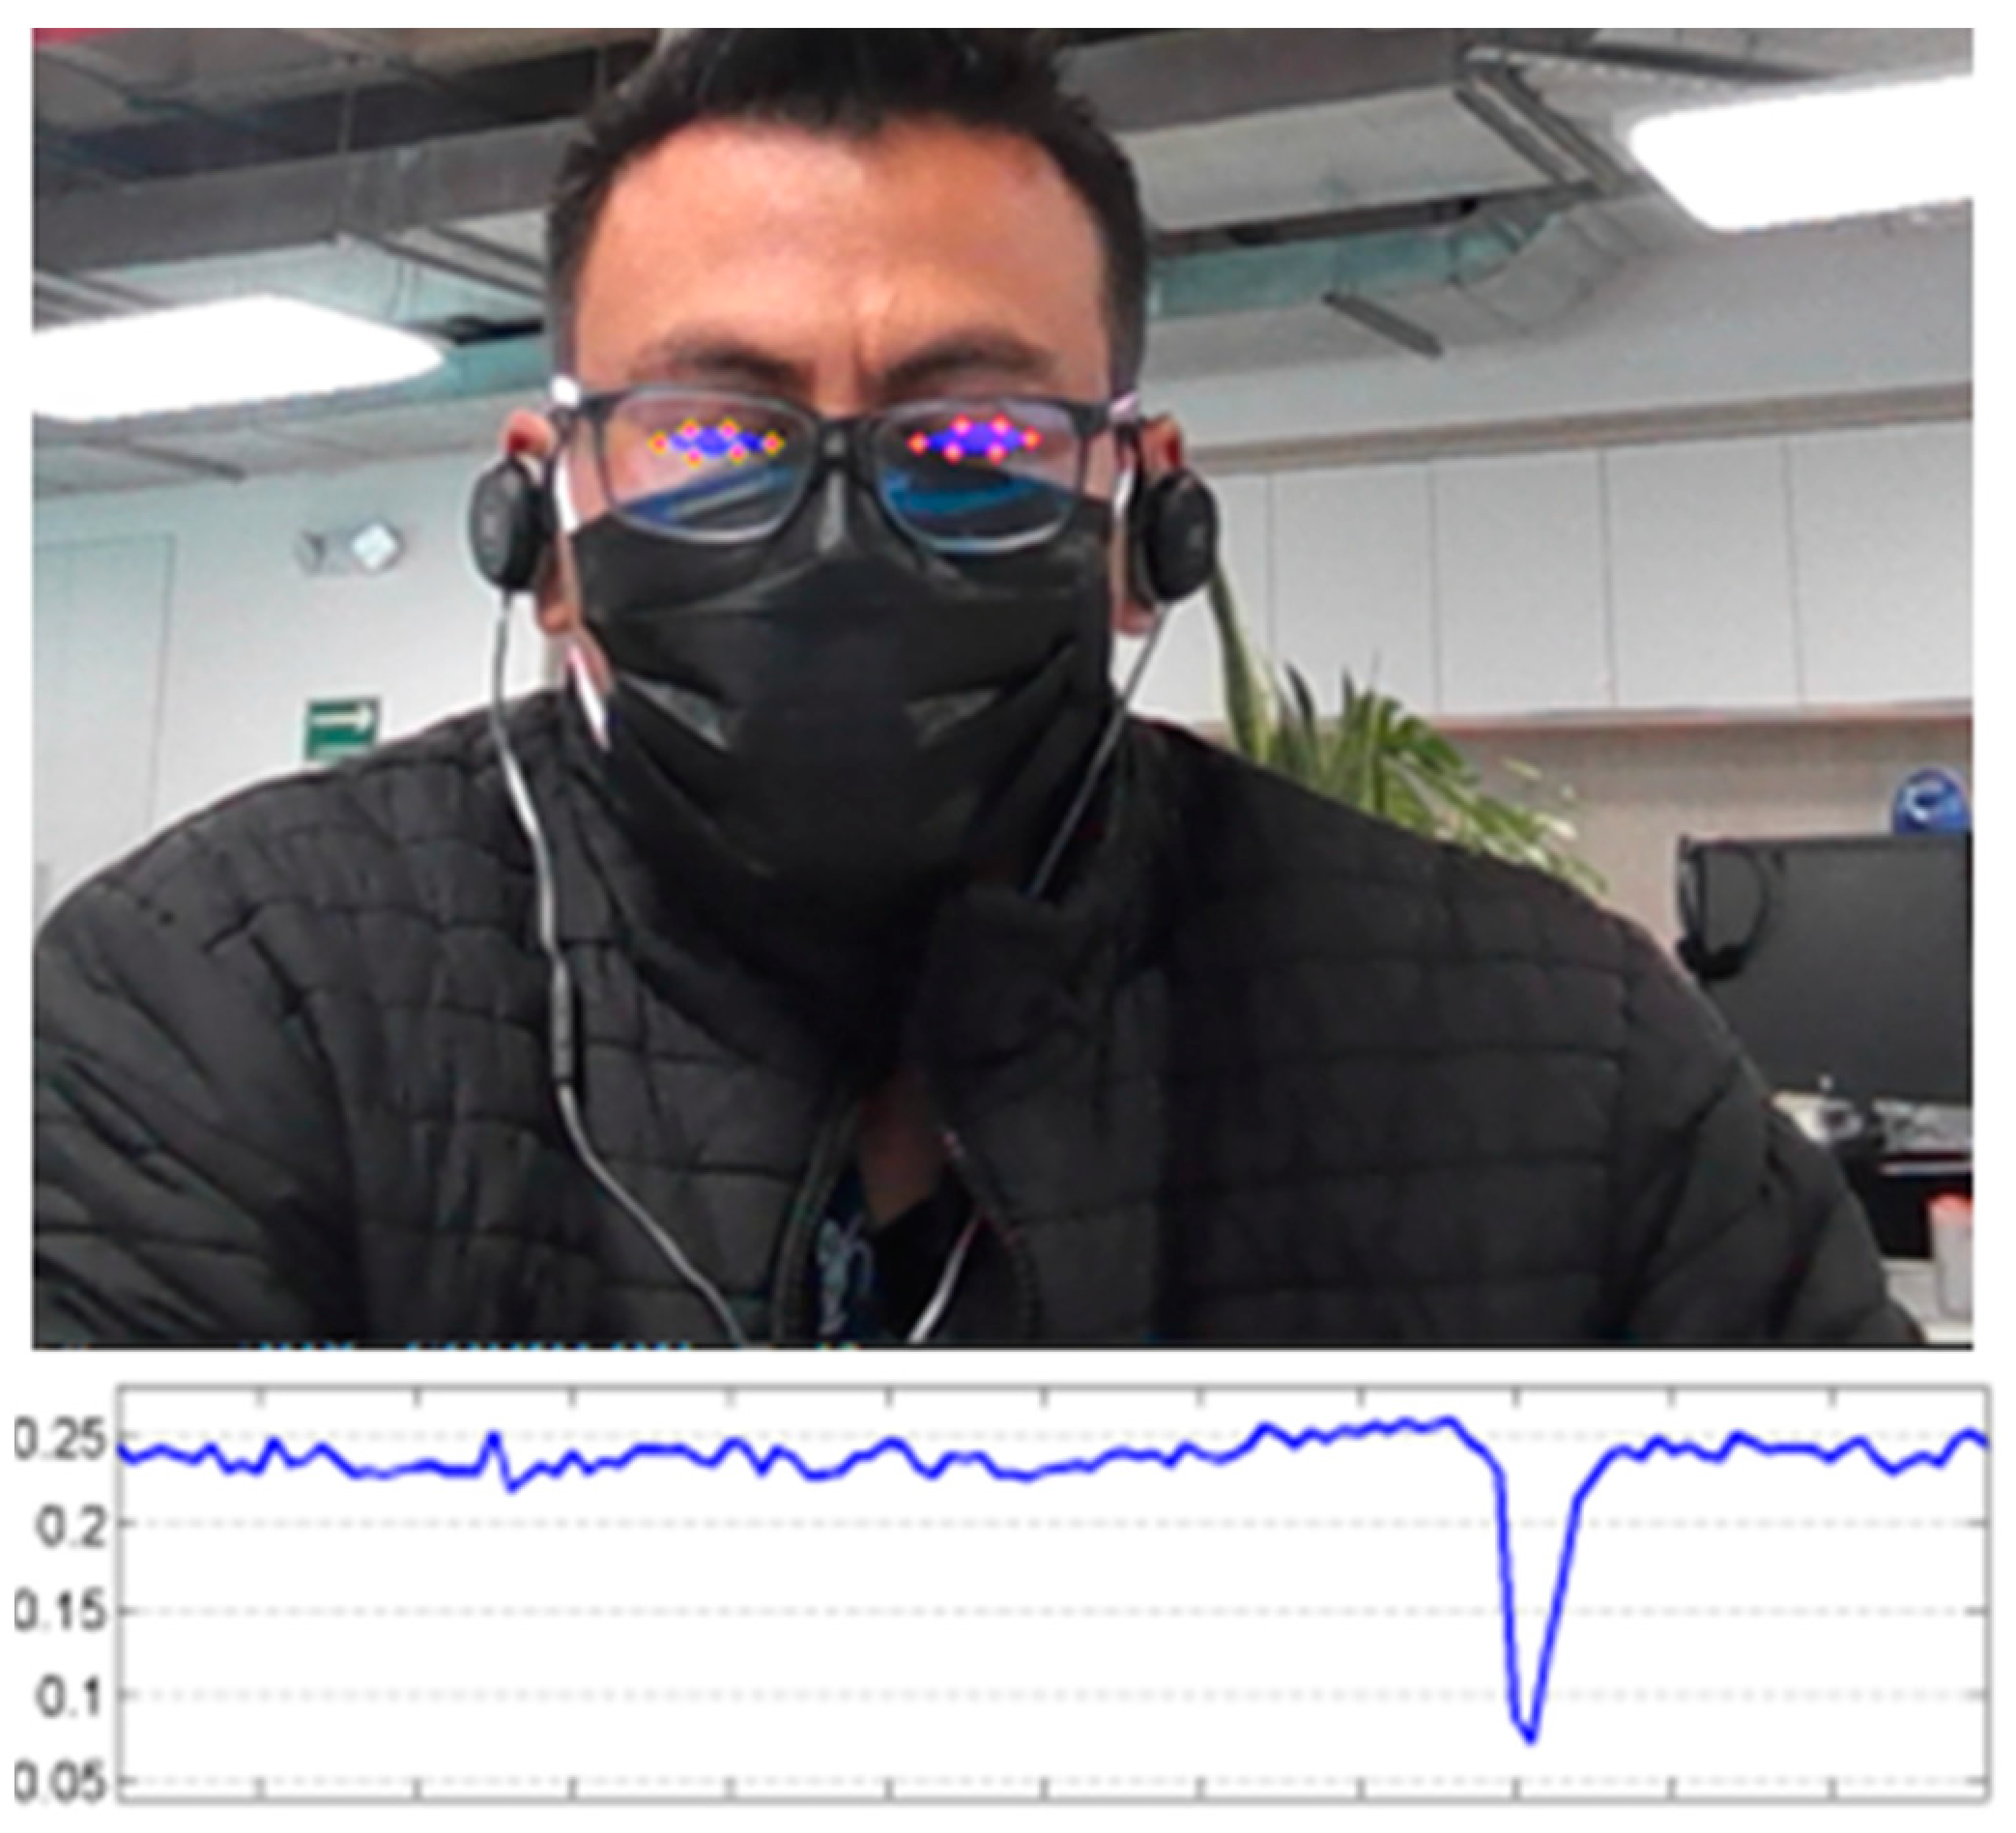
Figure 4 shows an example of an EAR signal in the video sequence, in which the student is wearing a mask and glasses. However, the algorithm easily detects the student’s eyes through the reference points and counts a blink, as shown by the fluctuation generated in the graph.
The algorithm uses the mediapipe, OpenCV, Numpy, and Matploylib libraries; these libraries oversee face detection and blink counting. For the use of these libraries, several functions are created where the detection of eye coordinates is declared using the reference points detected on the face [
37,
38]. The drawing_output function allows coloring the eye area and displaying the results, as can be seen in the previous figure. The eye_aspect_ratio function calculates the three distances shown in
Figure 5. The eye aspect ratio is involved in the calculation and returns the result of the EAR equation.
2.5. Design and Development of the Algorithm for the Recognition of Emotions
For the development of the algorithm, three fundamental bases are considered that guarantee the operation of the identification of the emotions of the students through the gestures that their faces generate in a didactic environment, as represented in
Figure 6. The bases considered are bases of image data, affective computing, and emotion recognition systems with artificial intelligence.
2.5.1. Image Database and Algorithm Training
The image base in the design of the gesture and emotion recognition algorithm refers to a collection of data used to train the recognition model. For this, the algorithm uses deep learning techniques, such as convolutional neural networks (CNN), to train the gesture recognition model. As the model learns to recognize patterns in images, it can identify gestures in new images that it has not seen before. The accuracy of the model will largely depend on the quality and diversity of the image base used to train it [
39,
40]. In Python, different libraries and tools are used to create and manipulate image bases in a gesture recognition algorithm. For the development of the algorithm, a practical comparison of libraries such as OpenCV, TensorFlow, and Keras was carried out. Of these libraries, TensorFlow was the one used in the algorithm, since it presented better characteristics about the available hardware requirements.
Affective computing arises from the need to provide computer equipment with a certain capacity to interact with people. This task is carried out using artificial vision techniques and machine learning algorithms; the objective of human–machine interaction is for the system to be capable of producing an effective response in people [
20]. According to [
21,
22], affective computing is subdivided into four research areas, as follows:
The analysis and characterization of affective states that identify through natural interactions the relationships between effect and cognitive processes in learning;
Automatic recognition of affective states by analyzing facial expressions and extracting features from linguistic expressions, posture, gaze tracking, and heart rate, among others;
The adequacy of the systems to respond to a particular affective state of the users;
The design of avatars that show appropriate affective states for better interaction with the user.
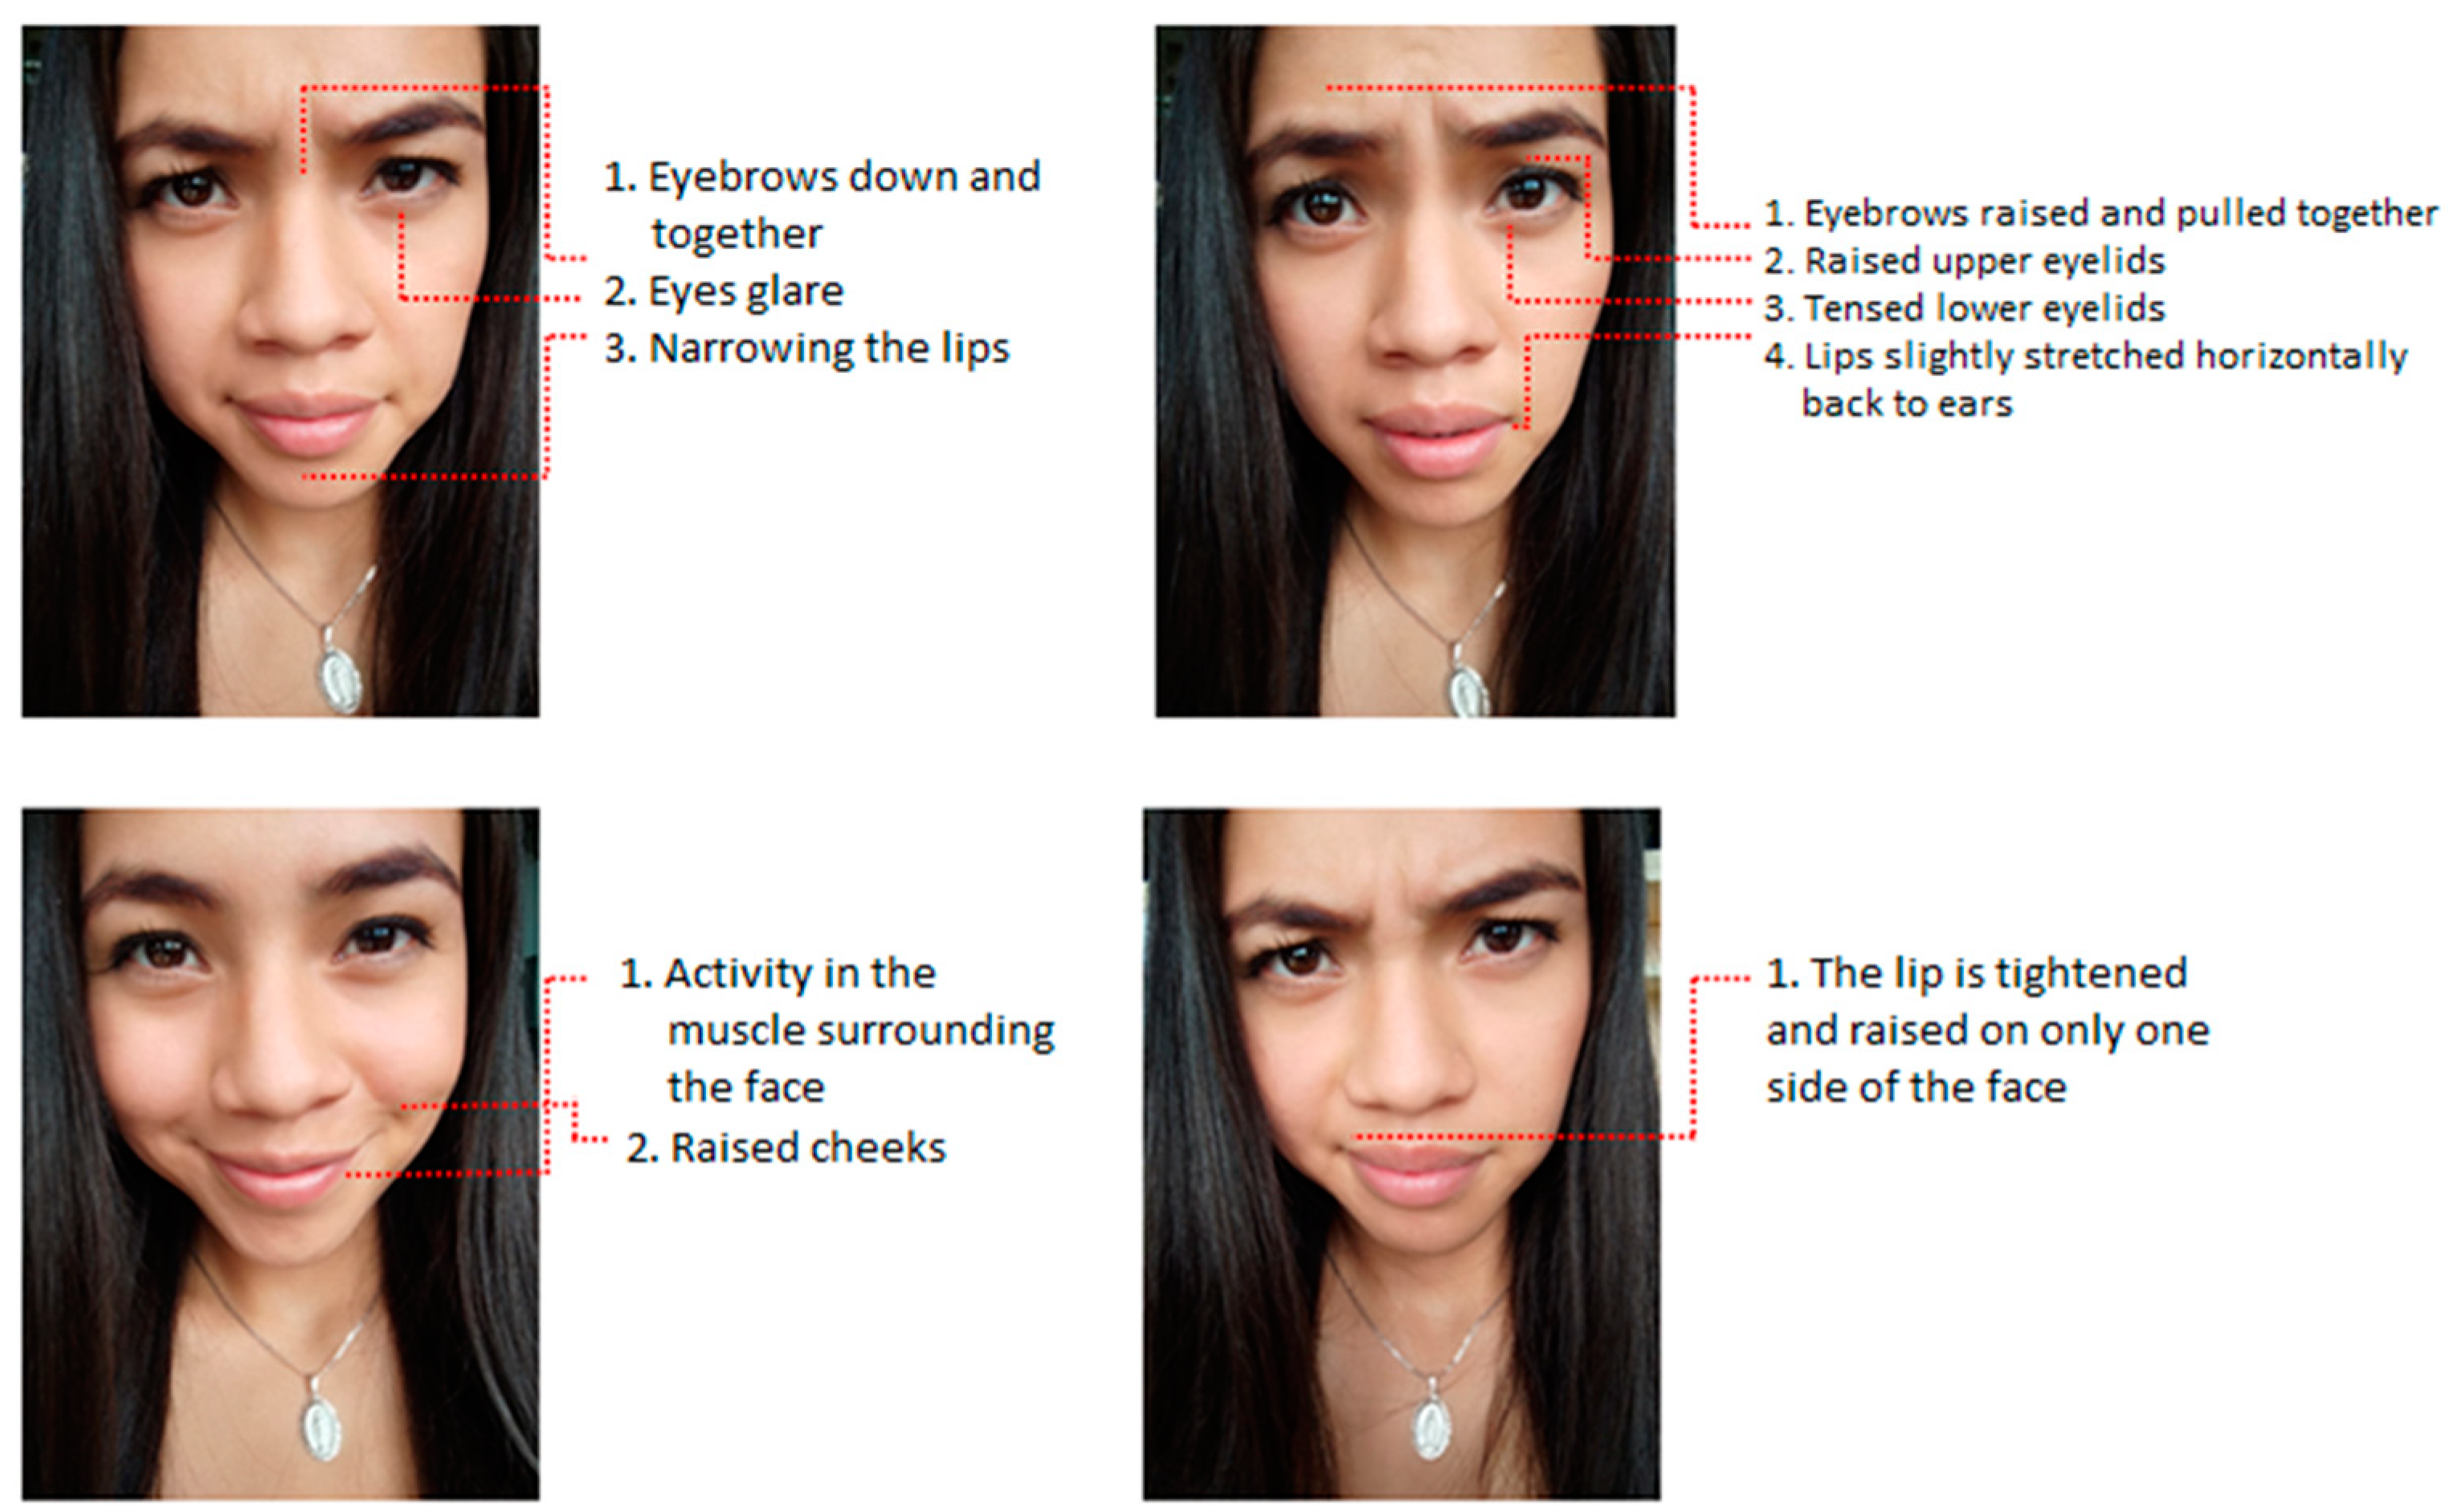
As for emotions, these are classified into two groups, primary or basic and secondary or alternative. In [
41], six basic emotions were identified, anger, disgust, fear, happiness, sadness, and surprise, and the gestures that appear on the face, as shown in
Figure 7. Secondary or alternative emotions are complex emotions that appear after primary emotions and depend on the situation and context of the person. For example, a person who is afraid (primary emotion) can turn it into anger or rage (secondary emotion) and provoke an aggressive reaction.
Facial expression analysis is applied in different areas of interest, such as education, video games, and telecommunications, to name a few. In addition, it is one of the most used in human–machine interactions. Facial expression recognition is an intelligent system that identifies a person’s face and, from it, obtains certain characteristics that it analyzes and processes to know the affective state of the person [
42].
2.5.2. Face Detection, Gesture Identification, and Emotion Classification
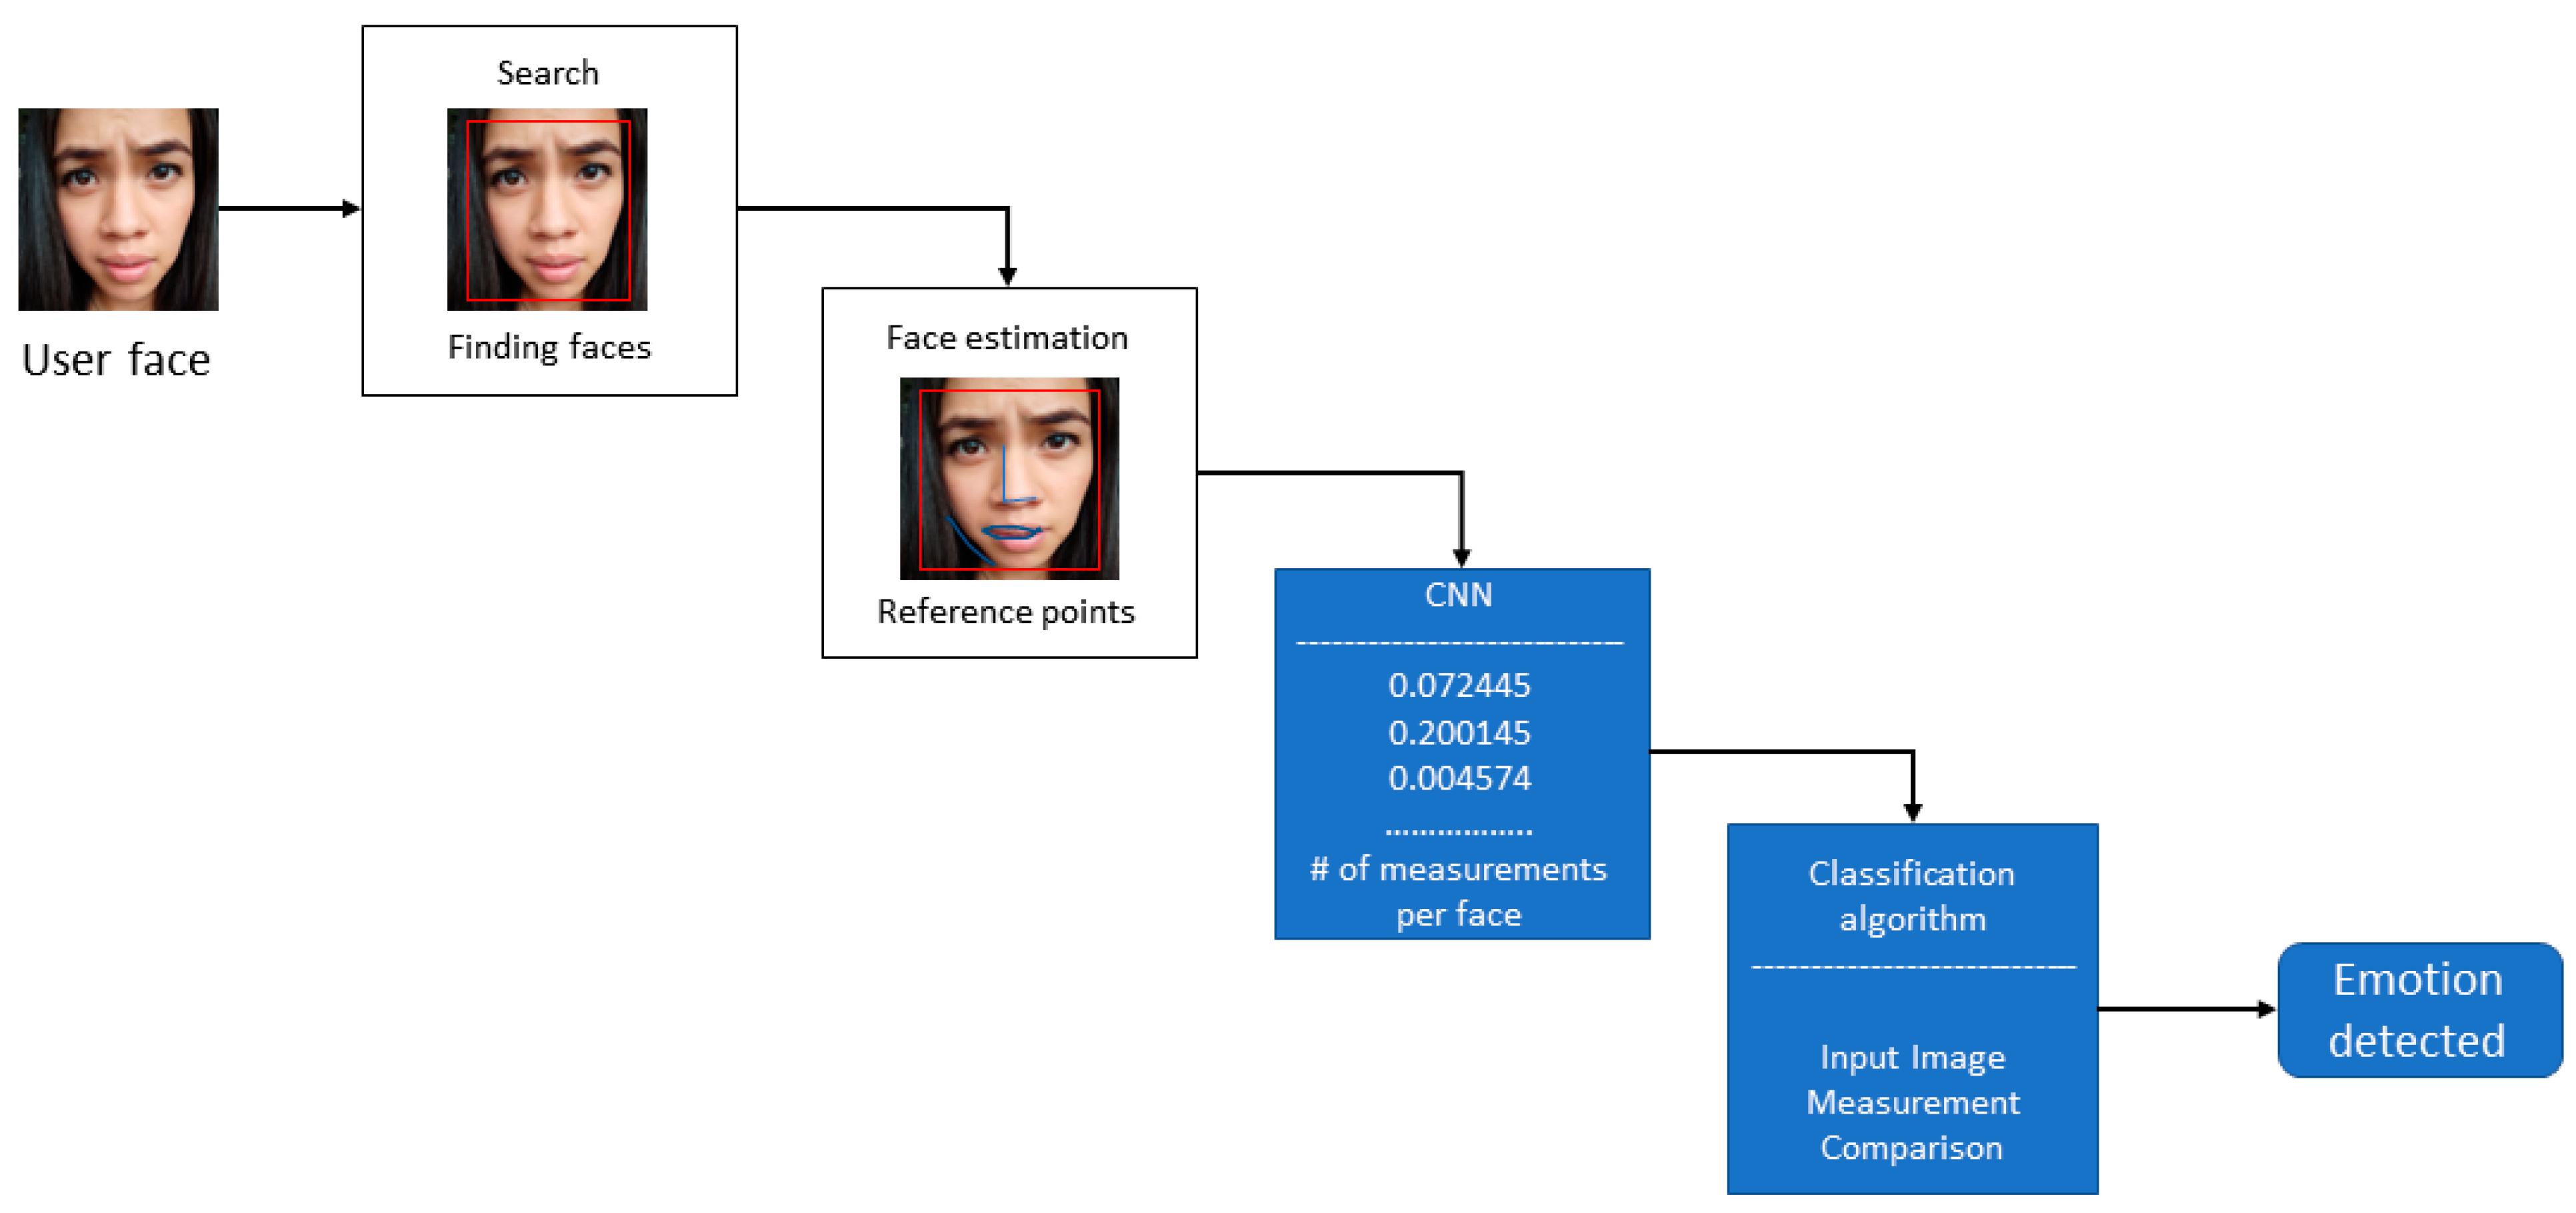
Face recognition depends on four steps shown in
Figure 8; the first step is to detect faces in an image, applying the oriented gradient histogram algorithm. In the second step, the facial landmark estimation algorithm is used, which identifies 68 landmarks on each face. In the third step, 128 measurements are created for each face through deep learning, which corresponds to the unique characteristics of the faces; finally, with the unique characteristics of each face, the person is identified.
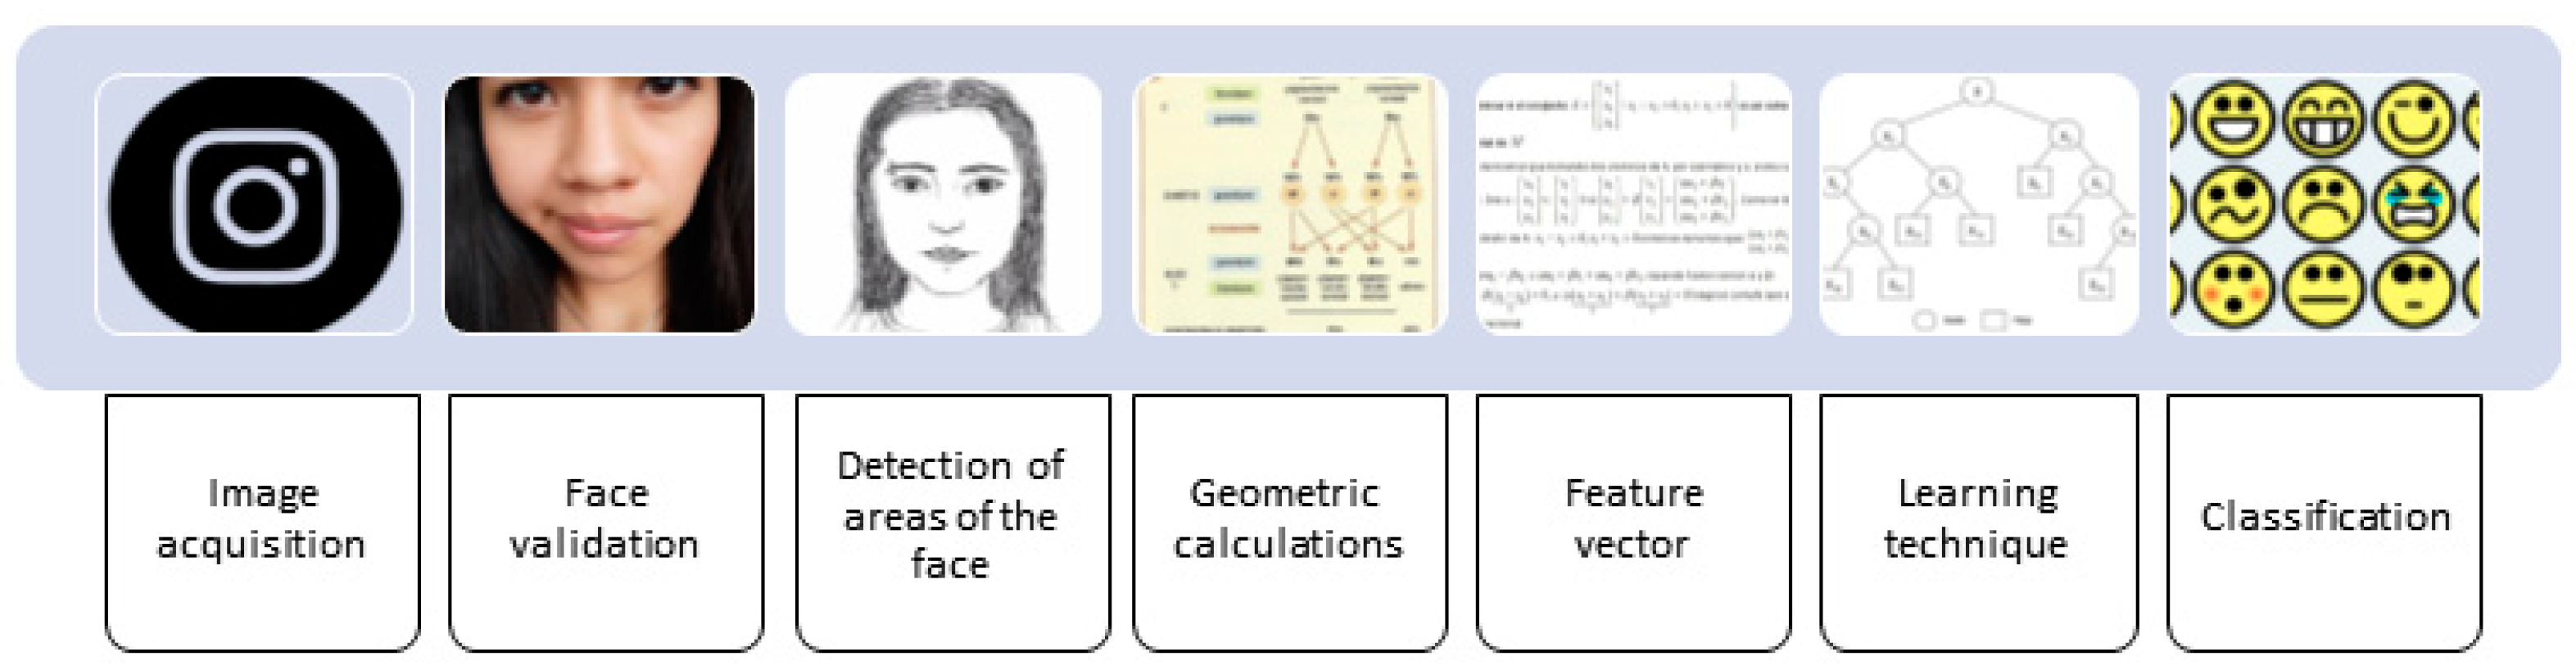
Figure 9 shows the stages that the system performs to correctly identify the emotion. The initial stage validates that the image received by the recognizer contains a face; if the algorithm does not find it, it discards the image. Next, a gray filter is applied to remove the different color channels to later detect some important parts of the face, such as the nose, eyes, eyebrows, and mouth. In the next stage, facial points are marked on the detected parts, and an initial reference point is placed in the center of the nose to identify various facial points on the face parts. Geometric calculations of the distance between the initial reference point and each facial point detected on the face are then performed. The result of the calculations is a matrix of facial features that are processed by the support vector algorithm with their emotion label so that it can learn to classify facial expressions. Finally, the trained neural network is sent more facial feature vectors to test whether the algorithm has learned to classify gestures and recognize emotions.
3. Results
According to the results obtained, the values obtained from the parameters measured by the developed algorithms are presented. These parameters correspond to the blink rate detection and emotion classification; these values are normalized to calculate the attention score according to Equation (2).
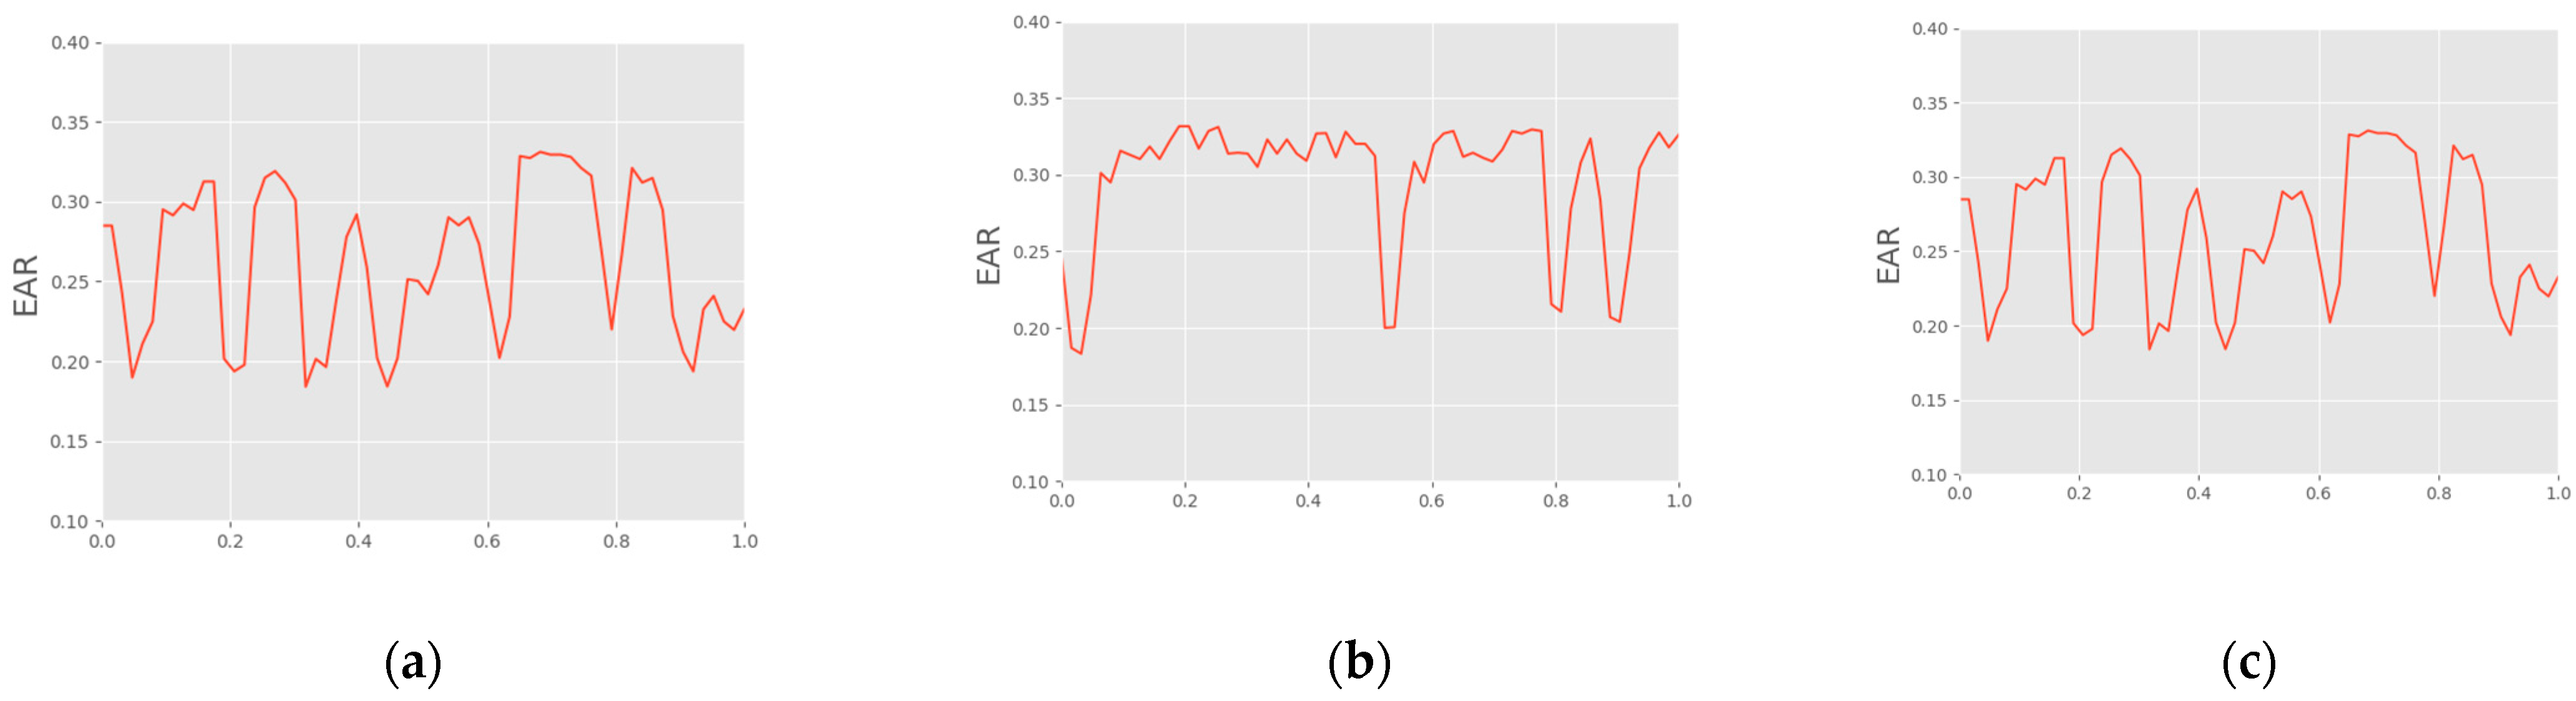
Figure 10 shows the live graphs of the EAR with the student’s expected attention level updated in real time. The figure shows the variation of the parameters measured with the designed algorithms.
Figure 10a detects the blinking frequency;
Figure 10b shows the classification of the emotion, and
Figure 10c presents the level of care. Facial recognition data are not presented because they do not contribute to determining the level of attention of the student; this parameter is specific to the system to offer personalized treatment to students.
To determine the performance of the system, a data set of 45 students corresponding to the 2020 cohort was analyzed. Even though the entire cohort is under analysis, two parallels were established as a sample that takes the subject of office automation 2. The groups evaluated are composed of 27 women and 18 men. For the evaluation, students were asked to attend online tutorials on specific topics of the subject. The tutorials lasted 45 min, divided into three sections of 15 min (900 s) each. During these sessions, students must turn on their web cameras and enable the blink frequency counting and emotion identification applications. The measurements are made online, and the data are stored in the cloud, where they are consumed by experts to determine the level of concentration per session. The mechanics of the tutorials has been determined considering three activities: one is the tutor’s explanation of a subject, and the second section is given by the development of a reading-type activity, especially scientific articles. In the third section, the development of a practical activity related to the theme developed is proposed. The sections within the session do not have a specific order, so the student does not generate a plan and affect the measurement.
Table 1 presents the results obtained from the evaluation; at this stage, the aim is to identify the number of students who are concentrated, distracted, and sleepy during the development of the activities of a session. According to the results obtained during the activity developed by the tutor (a class on a specific subject), 27 students are within the range of concentrating. This calculation is obtained according to the blink frequency count; that is, the blink rate is between four and five per minute. Within this same activity, 13 students were distracted; the calculation corresponds to their blink rate being greater than eight per minute. In this group, it was found that five students were in a sleepy state; for this identification, the algorithm identifies the time that the eyelids are closed. If this time is greater than two seconds, it is established that the student entered a state of sleepiness.
In the second activity, a reading of an article on a specific theme of the subject was established. This activity lasted 15 min; at the end of this period, it was found that 19 students were concentrated during reading, 18 had distraction stages, and 8 people presented drowsiness. These results indicate that this type of activity is usually not very effective during an online tutorial. In the third section of the tutorial, students are proposed to develop a practical activity; the results reflect a high concentration in most of the students, amounting to 37 with 82% concentration identified in the group. Of the group, only six students presented a distracted attitude toward the activity, and two of them were in a state of drowsiness.
Table 2 presents the results of the emotion classification algorithm. The Support Vector Machine (SVM) algorithm is used to classify students’ emotions into seven different classes: anger, disgust, fear, happiness, sadness, surprise, and neutral. Each emotion is given a score based on its effect on the user’s level of attention. The designed algorithm considers four classes of emotions: concentration, boredom, surprise, and neutral, these states being those identified within the classroom. However, it is necessary to consider that these emotions are based on those supported by SVM and the six universal emotions of people [
43]. According to the results of the tutoring activity, 13 concentrated people were identified, 7 were bored, 15 were surprised, and 10 had neutral emotions. Regarding the results obtained for the blink rate, it can be mentioned that the emotion of surprise and neutrality can be classified as emotions that have a certain relationship with distraction and drowsiness. For example, a student during the activity can demonstrate her interest in the topic by showing joy or with a neutral gesture. Similarly, a bored person can generate gestures that the algorithm detects as neutral emotions. This relationship is similar in the following activities; even in the development of the practical exercise, the relationship between the algorithms is more noticeable.
The acceptable limits of quality metrics vary depending on the specific application. Quality metrics are tools that allow you to assess the accuracy of models and predictions and are used to compare different models or to determine if a model is accurate enough for your application. Common quality metrics include root mean square error (RMSE), mean absolute error (MAE), coefficient of determination (R2), and mean absolute percentage error (MAPE). These metrics are presented in
Table 3, with the values corresponding to the performance of the system. By relating the results obtained from each algorithm and the EAR, it is possible to evaluate the general performance of the system. The table shows the performance metrics of the system.
According to the results obtained, it has been identified that the operation of the system is on the real state of the students during the educational environment developed. The general precision of the system was developed for the identification of the level of concentration, taking the average of the precisions of each module. Compiling the OpenCV DNN module with Deepface support improved performance and significantly reduced the inference time in the algorithms, as shown in
Table 4. We achieved an overall accuracy of 96.16%.
4. Discussion
According to the results obtained, it was identified that the system, when using the AI libraries to recognize the level of concentration of the students, must process a large volume of data to guarantee its effectiveness. For this, the training and test data set that contains information on the characteristics of emotions and the times that a person blinks when they generate a state of concentration requires a wide variety of images in different states, as well as different environments and settings. With a data set that allows the model to be adjusted and its performance to be evaluated, an adequate result that can be used in education is guaranteed. For this, unlike other works, several quality metrics have been used in a set of tests before the system goes to a production stage. The results of the quality metrics obtained in the set of tests are presented below:
RMSE: 11.351
MAE: 10.924
R2: 0.803
MAPE: 15%
Now, to determine the acceptable limits of these quality metrics, it is necessary to consider the context of the problem and the accuracy expectations of the model. For example, in testing, the model is expected to have acceptable accuracy if it can predict a student’s concentration level with an average error of +/−15.000. In this case, the RMSE value of 11.351 is less than the precision expectation, so the model could be considered acceptable in terms of precision. However, the MAE value of 10.924 indicates that the model has a systematic bias in its predictions, and adjustments may be necessary to improve its accuracy. The R2 value of 0.803 indicates that the model explains 80% of the variability in concentration levels demonstrated by a student, which would be considered acceptable in many cases. On the other hand, the MAPE value of 15% indicates that the model has an average percentage error of 15% in the predictions, which may or may not be acceptable, depending on the context and expectations of the problem.
It is important to consider that concentration in learning is a subjective experience, where there is great individual variability in what is considered “concentration”. Therefore, any AI algorithm used for concentration level identification should be designed to account for this individual variability and should not rely solely on technology to assess student performance [
44]. Other works mention that there are potential advantages of using AI tools in e-learning that allow personalization of learning; this can help to maximize the learning of each student and ensure that the material is adjusted to their individual needs. It is proposed to improve immediate feedback by allowing errors to be identified and corrected immediately. This can help students improve their understanding and retain information better, saving time and costs by automating many tasks where time and costs can be saved for teachers and educational institutions.
The work carried out uses computer vision techniques with AI techniques to perform a blink count to measure a person’s concentration [
39,
40]. This is based on similar studies where it has been identified that when a person is focused, they blink less than when they are distracted or bored. Therefore, if it is possible to measure a person’s number of blinks per minute, their level of concentration can be inferred. One advantage of blink counting with the developed algorithm is that it is a simple and non-invasive way to measure a person’s concentration, but it has limitations and should not be considered a precise and universal measure of concentration [
10]. To overcome this limitation, another algorithm that classifies students’ emotions during certain activities is used to evaluate multiple factors to obtain a complete picture of a person’s concentration.
The identification of emotions using an AI algorithm is a useful tool to measure the concentration level of students in an e-learning model [
42,
45]. Excitement and concentration are closely related, and a person who is excited or interested in a subject is more likely to be focused on it. Therefore, if a student’s emotion can be measured, the level of concentration can be inferred from it [
42,
43]. AI algorithms need large amounts of data to learn to accurately identify emotions; therefore, Python libraries are used that are previously trained. With this, the system improves its accuracy percentages and guarantees the results obtained [
44].
Compared to related works, the system developed using Python with AI libraries has several advantages. First, Python is a popular programming language in the AI community due to its ability to handle large data sets and its wide selection of AI libraries. AI libraries, such as TensorFlow, Keras, and Scikit-Learn, provide powerful tools for data processing and predictive modeling, allowing you to build complex and accurate models. Secondly, the developed system allows greater automation in the data analysis process, which reduces the time and costs necessary to perform this type of analysis. Third, the proposed system is highly customizable and adaptable to the specific needs of the educational institution or the online learning program. Machine learning algorithms can be trained to recognize specific patterns of student behavior and adapt to different student needs. In addition, the developed system can be integrated with other online learning management systems by using Python and its libraries, which allows a more integrated and complete analysis of student behavior [
33].
However, there are also some limitations identified in the development of the proposed system; these are focused on the use of Python with AI libraries for the identification of the concentration level of e-learning students. First, the use of sensors or cameras to capture student data may raise privacy and security concerns. Additionally, the accuracy of AI models can be affected by factors such as the quality of the input data, feature selection, and the choice of the machine learning algorithm [
46]. Finally, the developed system has several advantages compared to related works on the identification of the concentration level of e-learning students. The use of AI libraries allows for greater automation, customization, and adaptability to the specific needs of students and educational institutions. However, it is important to keep in mind the limitations in terms of privacy and data security, as well as the accuracy of the AI models.
5. Conclusions
Blink counting can be a useful technique for determining a student’s concentration level, as there is a correlation between attention and blink pattern. When a student is more focused, they generally blink less frequently, and their blinks are longer. However, the blink count only provides a rough estimate of the concentration level and is not a precise measurement. The blink pattern can be affected by factors such as eye strain, ambient lighting, the position of the student’s head, and individual blink habits. Additionally, blink counting can be difficult to perform in practical situations, such as in an e-learning environment where the student may be in different positions or moving around. Therefore, it is necessary to consider a methodological update in the way knowledge is provided. In the proposed environment, three activities have been established that can be considered a guideline to follow in the pedagogical development of a class.
On the other hand, the use of techniques for the identification of emotions using AI algorithms is useful to determine the level of concentration of a student in an e-learning environment. Emotions are closely related to attention and motivation and can indicate whether a student is interested in the learning material or is distracted or bored. However, it is important to note that emotion identification is an active field of research, and there are still challenges in accurately detecting emotions in different contexts and cultures. Additionally, emotion identification can be affected by the quality of the data set and the accuracy of the AI algorithm used. Therefore, although emotion identification can be a useful technique to determine a student’s concentration level in an e-learning environment, it should be used in combination with other monitoring and evaluation techniques to obtain a more accurate and complete picture of student performance.
This work makes use of AI as an integral part of education, considering that these tools are currently gaining ground in the educational sector. Additionally, the integration of AI into e-learning has the potential to significantly improve the quality of learning by providing students with a more personalized and adaptive learning experience. For example, AI algorithms can analyze the learning behavior of students, such as their progress in the course, their strengths and weaknesses, and their interaction patterns with course content. With this information, e-learning systems can offer students content recommendations and personalized learning activities that are tailored to their individual needs. In addition, technical limitations and the need for proper system design must be considered to ensure that AI is used effectively and efficiently in e-learning.
The designed concentration level identification system has demonstrated effectiveness in its usability and efficiency. Therefore, several recommendations can be made that may be useful in the use of the system or for institutions that design a similar system. Among the most important ones, an important recommendation is to ensure that any information collected by the system is used solely to improve the learning experience of students and is not shared with third parties without their consent. It is important to validate the system through rigorous testing, to ensure that the system works accurately and reliably before deploying it in a production environment. It is important to validate the system to ensure that the results are accurate and reliable. In the same way, it is important to provide feedback to students; the results of the system must be shared to provide feedback to students and help them improve their level of concentration and performance. Feedback can include advice on how to improve your concentration and suggestions on how to adjust your learning environment to increase your focus. Considering the context of learning, it must be taken into account that the level of concentration of students can be affected by external factors, such as the learning environment or the level of stress. Therefore, it is necessary to consider the learning context when interpreting the results of the system. Finally, it is a priority to evaluate the impact of the system, considering the performance and learning experience of the students.

 ,
, 


