Article

B1 Power Modification for Amide Proton Transfer Imaging in Parotid Glands: A Strategy for Image Quality Accommodation and Evaluation of Tumor Detection Feasibility

1
Department of Radiology, Peking Union Medical College Hospital, Chinese Academy of Medical Sciences, Beijing 100730, China
2
Yangtze Delta Region Institute of Tsinghua University, Jiaxing 314006, China
3
Department of Clinical and Technical Support, Philips Healthcare, Beijing 100600, China
4
Department of Stomatology, Peking Union Medical College Hospital, Chinese Academy of Medical Sciences, Beijing 100730, China
5
Department of Imaging and Interventional Radiology, Prince of Wales Hospital, The Chinese University of Hong Kong, Hong Kong 999077, China
*
Authors to whom correspondence should be addressed.
These authors contributed equally to this work.
Cancers 2024, 16(5), 888; https://doi.org/10.3390/cancers16050888
Submission received: 9 January 2024 / Revised: 17 February 2024 / Accepted: 19 February 2024 / Published: 22 February 2024

Abstract

:

Simple Summary

Amide proton transfer weighted (APTw) imaging is a contrast-free molecular imaging method based on the chemical exchange saturation transfer (CEST) technique, initially applied and explored in brain cancers. Previous studies of APTw imaging in the head and neck area have applied APTw protocols in the brain, and hyperintensity artifacts remain a problem to solve. A total of 32 lesions and 30 parotid glands were involved in this research to address the effect of B1 power modification on improving APTw imaging quality in parotid tumor identification, aiming to minimize hyperintensity artifacts. We found that hyperintensity artifacts declined with B1 power decreasing, and combinations of different APTw sequences could improve tumor detection feasibility compared to one APTw sequence. Our findings in this research could give an insight into APTw imaging quality improvement in the head and neck area, which might help the noninvasive diagnosis of parotid tumors in the future.

Abstract

Background: In the application of APTw protocols for evaluating tumors and parotid glands, inhomogeneity and hyperintensity artifacts have remained an obstacle. This study aimed to improve APTw imaging quality and evaluate the feasibility of difference B1 values to detect parotid tumors. Methods: A total of 31 patients received three APTw sequences to acquire 32 lesions and 30 parotid glands (one patient had lesions on both sides). Patients received T2WI and 3D turbo-spin-echo (TSE) APTw imaging on a 3.0 T scanner for three sequences (B1 = 2 μT, 1 μT, and 0.7 μT in APTw 1, 2, and 3, respectively). APTw image quality was evaluated using four-point Likert scales in terms of integrity and hyperintensity artifacts. Image quality was compared between the three sequences. An evaluable group and a trustable group were obtained for APTmean value comparison. Results: Tumors in both APT2 and APT3 had fewer hyperintensity artifacts than in APT1. With B1 values decreasing, tumors had less integrity in APTw imaging. APTmean values of tumors were higher than parotid glands in traditional APT1 sequence though not significant, while the APTmean subtraction value was significantly different. Conclusions: Applying a lower B1 value could remove hyperintensity but could also compromise its integrity. Combing different APTw sequences might increase the feasibility of tumor detection.

1. Introduction

The parotid gland (PG) is the most common site of salivary tumors anatomically [1]. Characterization and definitive diagnosis of parotid tumors (PTs) are required before therapy arrangement. Fine-needle aspiration has been extensively applied clinically nowadays; however, its sensitivity is limited by parotid tumor heterogeneity and insufficient biopsy coverage [2,3]. As a complement, modern imaging can provide an overall insight into tumor characterization, including ultrasonography, computed tomography, and especially magnetic resonance imaging (MRI) with its dynamic and advanced sequences [4]. MRI is generated from a strong magnetic field (B0) and pulses of radiofrequency energy (B1) by a coil, free from ionizing radiation [5]. Conventional MRI enables precise evaluation of tumor size, location, border, growth pattern, and signal intensity on T1WI and T2WI [6]. Application of functional MRI in PT evaluation, such as diffusion weighted imaging (DWI) and dynamic contrast enhanced (DCE) MRI, reflect tissue characterizations of diffusion restriction, contrast enhancement, and washout to differentiate benign and malignant lesions, nonetheless with still conflicting results and measured value overlaps [7,8]. Therefore, advanced MRI techniques have been explored for qualitative diagnosis of parotid tumors [4].
Amide proton transfer (APT) imaging is a contrast-free molecular imaging method based on the chemical exchange saturation transfer (CEST) technique, in which amide protons are saturated by a selective saturation radiofrequency (RF) pulse at 3.5 ppm (parts per million) and the saturation is continuously transferred to the bulk water by chemical exchange, reducing the water magnetization and signals [9,10]. The saturation build-up of water molecules amplifies signal reduction, enabling detection of free proteins and peptides at low concentrations [11]. The CEST effect is usually small and is sensitive to B0 and B1 fields and saturation pulse power. APT application for tumor detection and characterization was first explored and is best understood in the brain [12,13]. Until now, more and more APT studies have been reported in breast [14,15,16], cervix [17,18], prostate [19,20,21], and chest tumors [22,23], demonstrating its feasibility for tumor detection and characterization. However, APT weighted (APTw) imaging studies in head and neck tumors face obstacles considering motion effects such as breathing and swallowing, although the parotid glands are thought to be less influenced by such motion disturbance [24].
Based on previous studies of APTw imaging of brain tumors, a fast 3D acquisition technique, integrated with a feasible, optimized RF saturation scheme and an effective lipid suppression method, is recommended and TSE has been recommended among the candidate readout sequences [25]. In most APTw studies of parotid cancers, the APT protocol recommended for brain cancers (B1 = 2 μT, saturation time = 0.8~2 s) has been applied [13,24,26,27]. However, although this power and saturation time guarantee homogeneity in most normal brain areas, when applied to the parotid region, inhomogeneity and hyperintensity artifacts in PG and PT remain a hindrance [28,29]. APTw studies in the brain have demonstrated that lower B1 could lessen hyperintensity artifacts [30]. We expect that hyperintensity artifacts in PGs and PTs could also be minimized and tumor detection efficacy could be improved by B1 decreasing.
Therefore, in this study we investigated APTw image quality improvement by B1 power modification and evaluated the feasibility of different APTw sequences to detect parotid tumors.

2. Materials and Methods

2.1. Prospectively Enrolled Participants

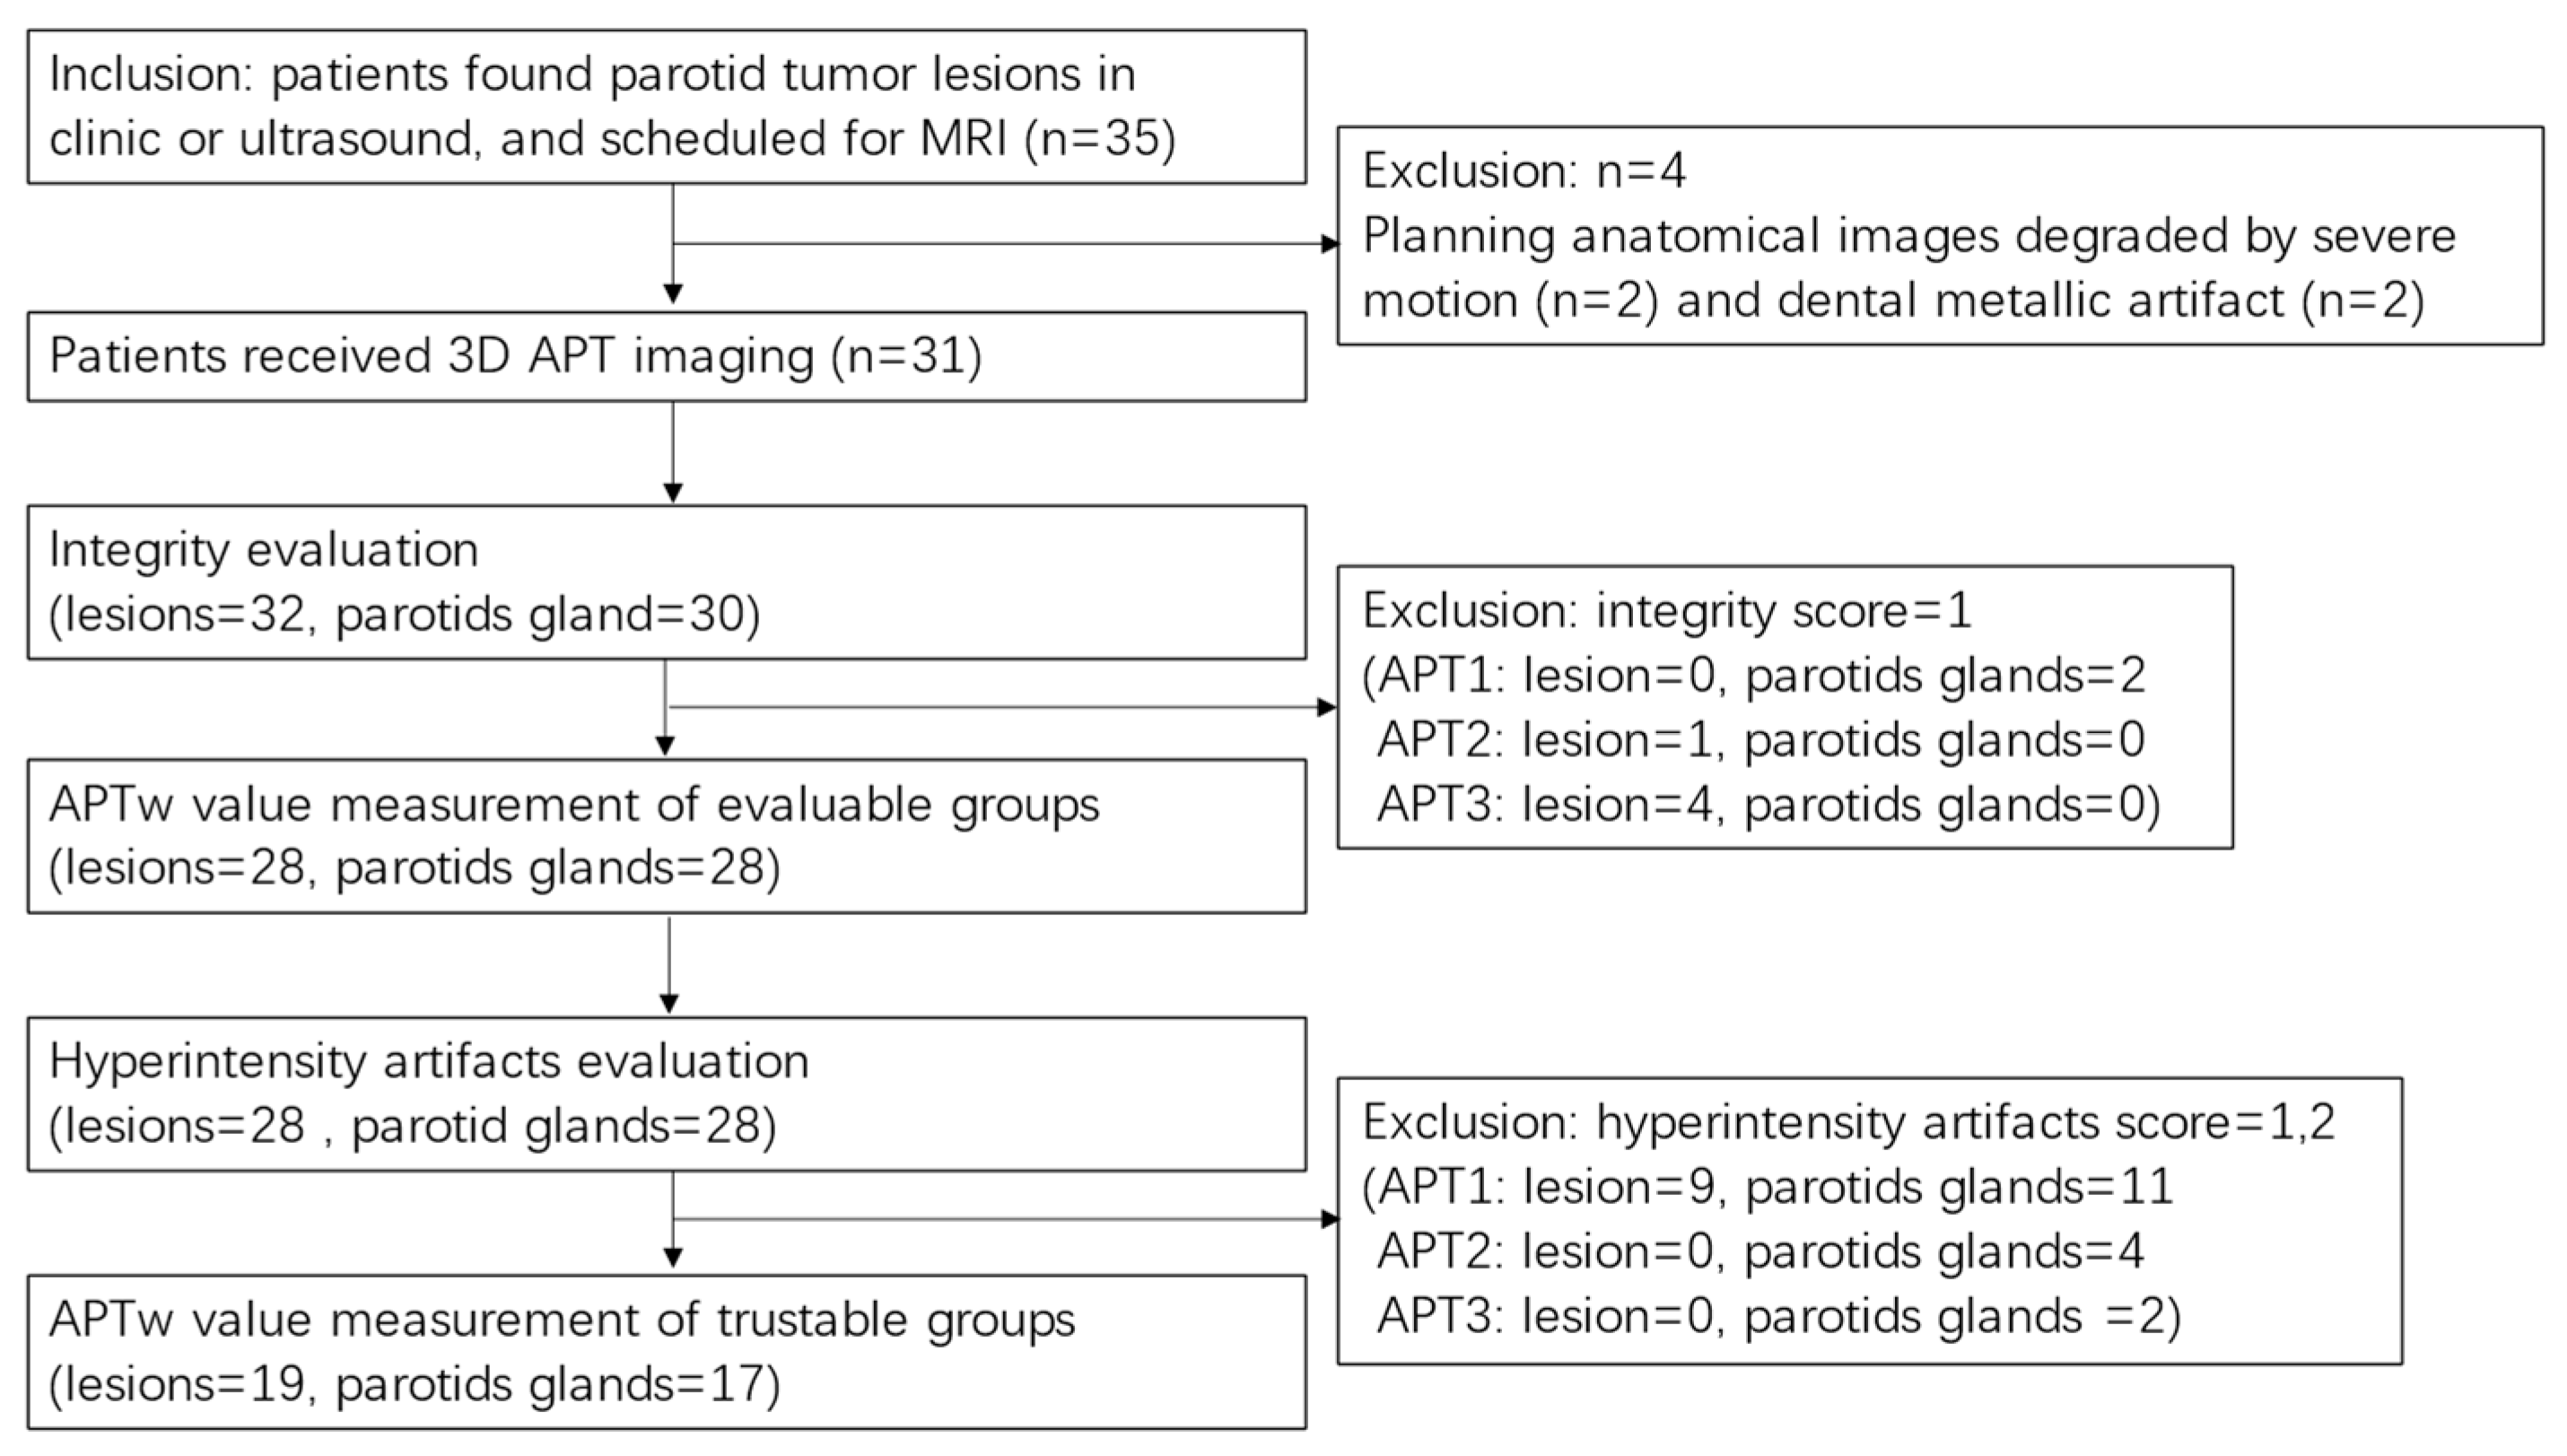
Inclusion criteria were as follows: (1) suspected diagnosis of PT clinically or by ultrasound, and (2) MRI examination plan. Exclusion criteria included severe image degradation which would impair further analysis caused by motion or dental artifacts. From October 2019 to December 2021, 35 consecutive patients meeting the inclusion criteria were enrolled in this study. Among them, four patients were excluded due to severe motion (n = 2) and dental artifacts (n = 2) that caused degradation of the anatomical planning images. Ultimately, 31 patients underwent 3D TSE APTw MRI on a 3T MRI scanner (Ingenia CX, Philips Healthcare, Amsterdam, The Netherlands) equipped with dual radiofrequency (RF) transmit coils and a 32-channel head-coil for image acquisition.

2.2. MRI

In this study, all patients underwent MR imaging using a 3.0T MRI system (Ingenia CX, Philips Healthcare, Amsterdam, The Netherlands) equipped with a 32-channel phased-array radiofrequency receiver coil. The scan sequences included axial T1w-TSE, axial T2w-TSE, and three APTw imaging protocols with different saturation pulse amplitudes: 2 μT, 1 μT, and 0.7 μT. The parameters were shown in Table 1. APTw images were reconstructed using the integrated software available in the MR control console [31].

2.3. Image Analysis

MR images and data were transferred to a workstation (Intellispace Portal; v. 10.1.0.64190; Philips Healthcare) for further analysis. Two independent reviewers, one radiologist (YC) and one radiology scientist (TS) with 24 and 10 years of head and neck experience, respectively, evaluated all MR images. Additionally, a third senior radiologist (ZJ) with 35 years of head and neck experience finally determined the score when there was inconsistency between the two readers. The three readers were blinded to all patients’ clinical and pathological data. Both the PTs and the PGs were evaluated on APTw images independently. The patients’ gender, age, and the largest lesion diameter in axial images were also recorded.

2.4. Qualitative Analysis

A qualitative analysis was performed to assess the image quality of APTw imaging, following the scoring strategy described in a previous study [28]. An area whose APTw value < −5% is defined as integrity loss, and one whose APTw value > 5% is defined as a hyperintensity artifact, both of which impair imaging quality. Two radiologists drew first regions of interest (ROI1) on the APTw images by manually outlining the entire PT or PG based on T2W images. The integrity and presence of hyperintensity artifacts within the ROI1 were evaluated using a 4-point Likert scale (4 = excellent, 3 = good, 2 = moderate, 1 = poor), shown in Table 2. PTs or PGs with score 1 or 2 in APTw images were excluded. The two radiologists independently scored the integrity and hyperintensity artifact of PTs and PGs, and the consistency between their assessments was analyzed. In cases where there were initially inconsistent scores, a third senior radiologist reviewed the images and made the final decision.

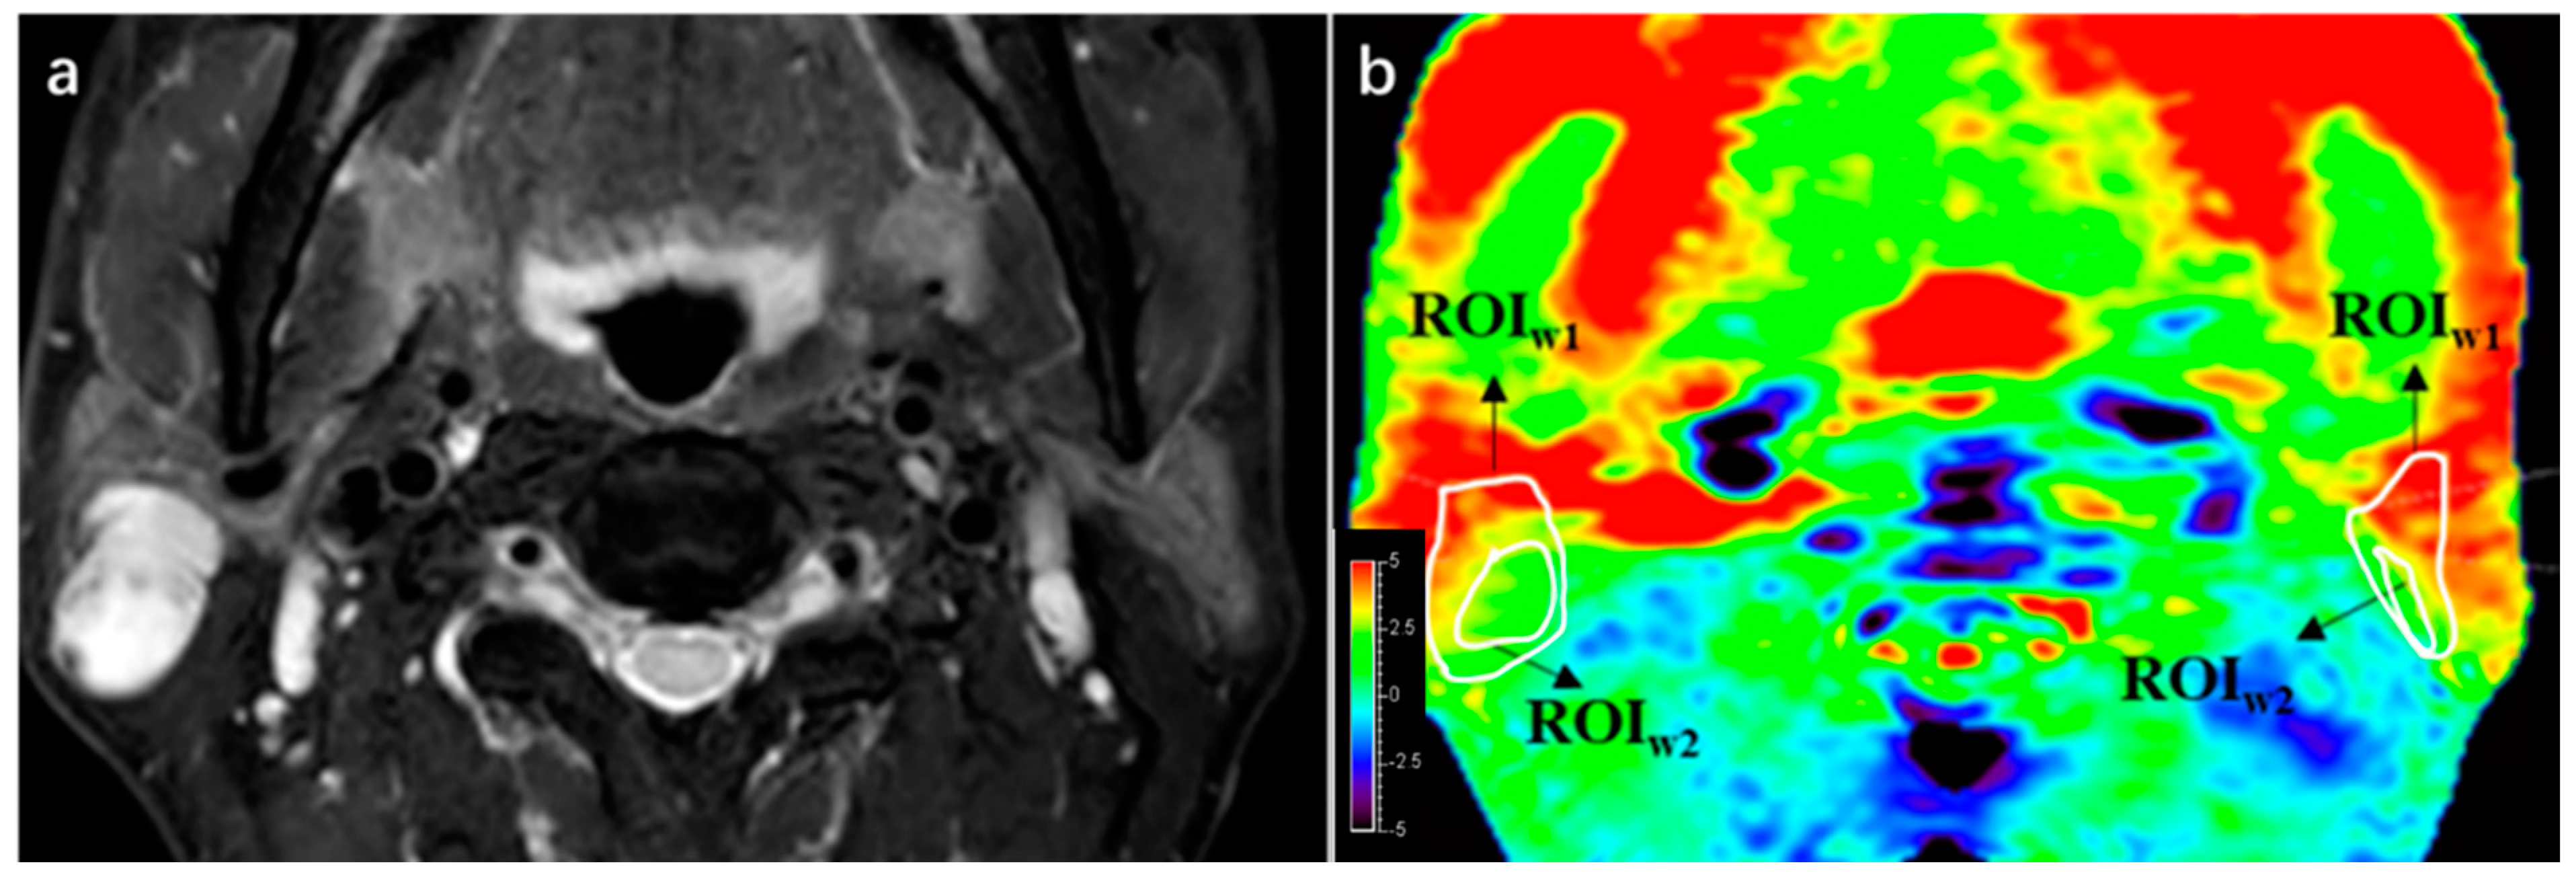
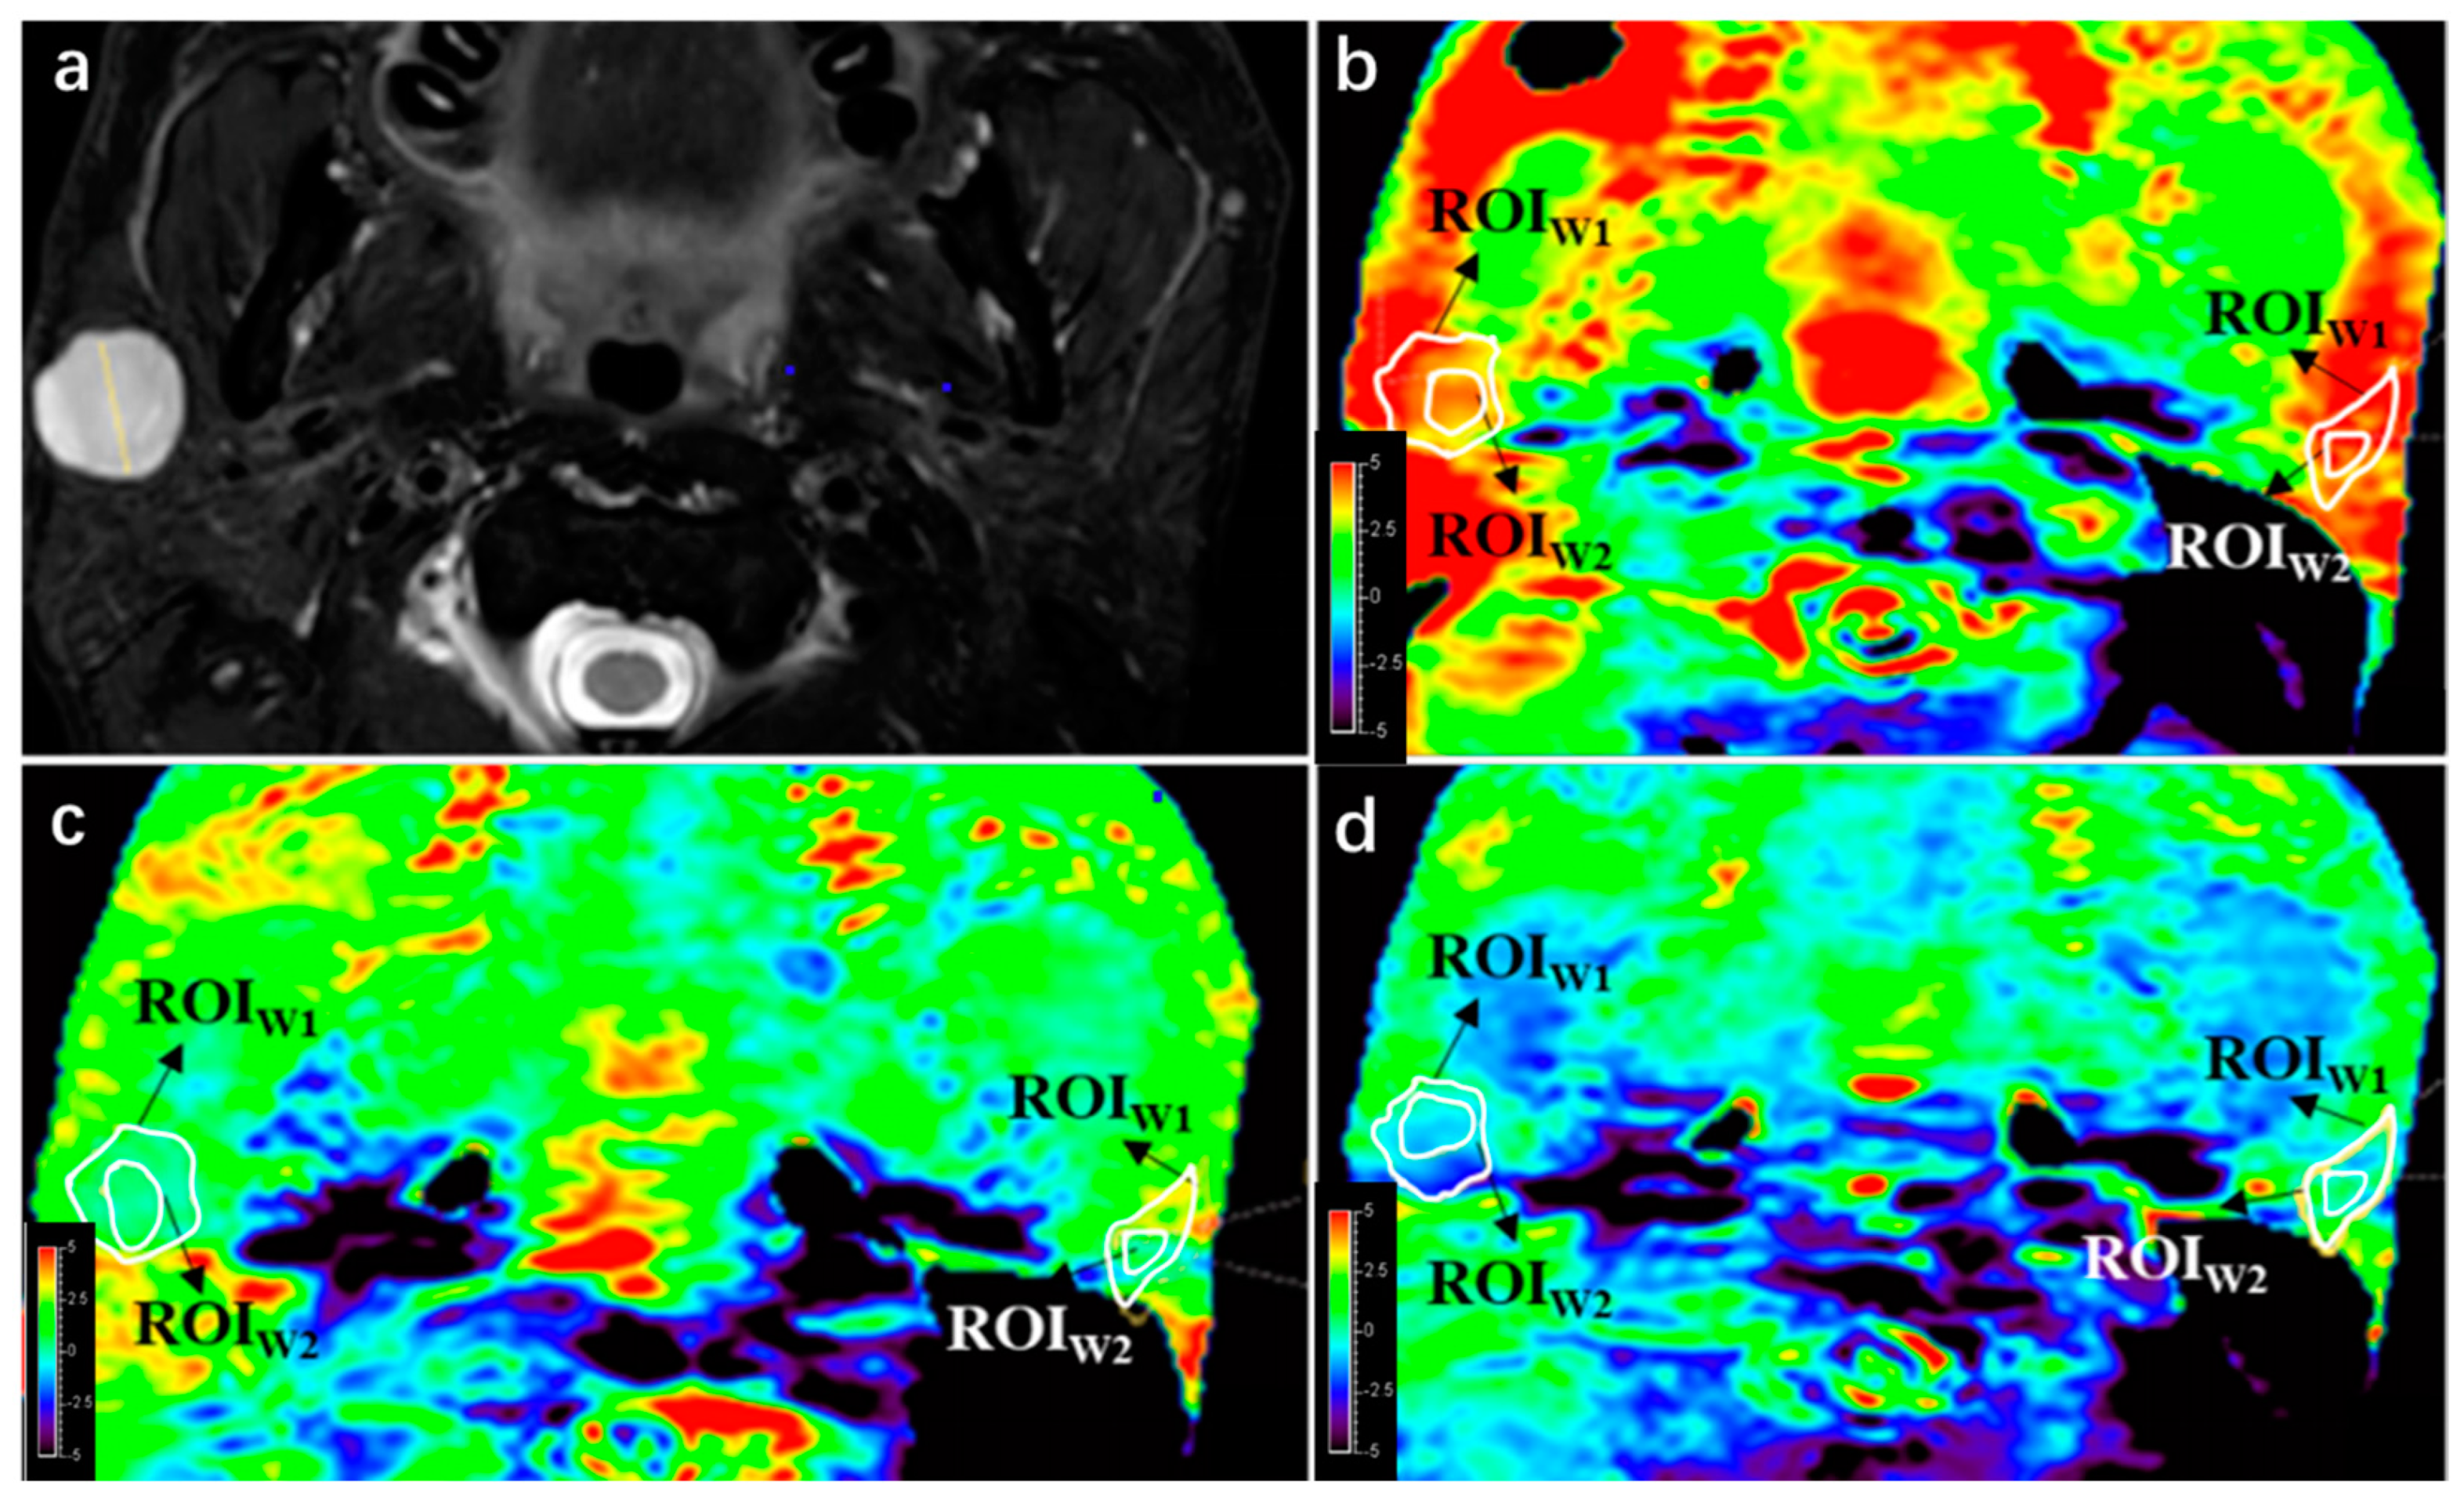
2.5. Quantitative Analysis

The quantitative analysis in this study involved the following steps: (1) Comparison of image quality: Scores for PTs and PGs were compared among three APTw sequences using the same 4-point Likert scale. (2) APTmean and subtraction values: A second ROI (ROI2) was drawn within ROI1, measuring APTmean values for PTs and PGs in each APTw sequence (using saturation B1rms of 2, 1, and 0.7 μT). The principle of drawing ROI2 is to maintain the largest area of normal gland or lesion while deleting hyperintensity areas, trying to obtain the real APTw value. APTmean and subtraction values were compared between PTs and PGs in the evaluable and trustable groups.

2.6. Statistical Analysis

The statistical analysis in this study was performed using IBM SPSS software, version 19.0 (SPSS Inc., Chicago, IL, USA). The differences of integrity and hyperintensity artifacts scores between tumor lesions and parotid glands were compared using the Mann–Whitney U test. The Wilcoxon paired signed-rank test was used to compare the difference of integrity and hyperintensity artifact scores between the three APTw sequences. A nonparametric test was used for comparing two related groups. The kappa coefficient was calculated to examine the correlation of integrity scores and hyperintensity artifact scores between the two radiologists. The Shapiro–Wilk test was performed to evaluate the normality of distribution of APTmean values. The paired sample t-test was used to compare the difference in APTmean values between the three sequences. APTmean values were presented as the mean ± standard deviation. All statistical tests were two-sided, and p ≤ 0.05 was considered statistically significant.

3. Results

3.1. Patients’ Characteristics

Among the 31 patients who underwent APTw examination, there were 21 men and 10 women with an average age of 57.74 ± 17.78 years (range, 15–92 years). One patient had lesions in both left and right sides of the parotid gland, and the normal parotid tissue was too small to evaluate, resulting in a total of 32 lesions and 30 parotid glands being included in the analysis. The average diameter of the lesions was 21.29 ± 8.28 mm (range: 9.1–52.6 mm). Out of the 31 patients, 22 received surgery and had pathological results available. Patients’ characteristics and pathological results are shown in Table 3.

3.2. Qualitative Analysis

In the images of the three sequences, four PTs and two PGs with an integrity score of 1 were excluded from the analysis to obtain an evaluable group for artifacts evaluation. In the evaluable group, which was consisted of 28 PTs and 28 PGs, hyperintensity was evaluated. Nine PTs and 11 PGs with a hyperintensity score of 1 or 2 were excluded to ensure trustable APTw value measurements. Consequently, 19 lesions and 17 parotid glands were enrolled in the trustable group for APTw value measurement. The patient selection flowchart is shown in Figure 1.
For qualitative analysis, the region of interest (ROI1) of each PG and PT was manually delineated based on the T2W images by the two radiologists. ROI2 was drawn in such a way as to maintain the most parotid gland or lesion area while excluding most of the hyperintensity artifacts (Figure 2).
Integrity and hyperintensity artifact scores were assessed independently by two radiologists for PTs and PGs in ROI1. As shown in Table 4, the integrity and hyperintensity artifact scores made by the two radiologists had great consistency. The scores used for subsequent quality comparison between sequences were based on the final scores determined by the third senior radiologist.
The integrity and hyperintensity artifact scores were compared between PTs and PGs for each APT sequence. Statistical significance was determined using appropriate statistical tests, and p-values are shown. No significant difference indicates p > 0.05. The results of qualitative analysis showed that there was no significant difference in integrity between PTs and PGs in APT 1 and APT 2 (p = 0.082 and 0.723, respectively), while PGs had better integrity than PTs in APT 3 (p < 0.05). After excluding PTs and PGs with integrity score = 1, the hyperintensity artifact analysis revealed that PTs had better image quality of hyperintensity compared to PGs in APT sequences 2 and 3 (p < 0.05), while there was no significant difference in APT sequence 1 (p = 0.669). Further details and a case example can be seen in Table 5 and Figure 3, respectively.
The results of the comparison among the three APTw sequences (APT1, APT2, and APT3) showed that PTs had better integrity in APT 1 compared to APT 2, and APT 2 had better integrity compared to APT 3. However, there was no significant difference in integrity between the three sequences for PGs. In terms of hyperintensity artifacts, lesions in both APT 2 and APT3 had less hyperintensity artifacts compared to APT1 (p < 0.05), while there was no significant difference in hyperintensity artifacts between APT 2 and APT 3 for PTs (p = 0.157). Similarly, PTs in APT 2 and APT 3 also had less hyperintensity artifacts compared to APT 1 (p < 0.05), and there was no significant difference between APT 2 and APT 3 (p = 0.083). Further details can be seen in Table 6.

3.3. Quantitative Analysis

In the evaluable group, there was a significant difference in APTmean between PTs and PGs in sequence 2 and sequence 3 (0.60% ± 0.75% vs. 1.46% ± 1.82% and 0.06% ± 0.83% vs. 0.88% ± 1.85%, respectively), while there was no significant difference in APTmean between PTs and PGs in sequence 1 (3.18% ± 2.74% vs. 2.21% ± 2.12%, p = 0.144). PTs had significantly higher APT1mean–APT2mean and APT1mean–APT3mean values compared to PGs (2.59% ± 2.48% vs. 0.75% ± 1.20%; 3.13% ± 2.64% vs. 1.33% ± 1.48%).
In the trustable group, there was no significant difference in APTmean between PTs and PGs in all three sequences. However, PTs had significant higher APT1mean–APT2mean and APT1mean–APT3mean values compared to PGs (1.49% ± 1.54% vs. 0.20% ± 0.51%; 1.91% ± 1.88% vs. 0.51% ± 0.56%). The quantitative analysis results of the three sequences are shown in Table 7.

4. Discussion

APTw imaging is a contrast-free molecular imaging method based on the chemical exchange saturation transfer (CEST) technique, initially applied and explored in brain tumors. Previous studies of APTw imaging in head and neck area apply APTw protocols in the brain, and hyperintensity artifacts remain a problem to solve. This study aimed to investigate the effect of B1 power modification in 3D TSE APTw for parotid gland tumor detection, with the target to minimize hyperintensity artifact in APTw images. A total of 32 lesions and 30 parotid glands were involved in this research to address effect of B1 power modification. The study found that B1 power decreasing resulted in decreased hyperintensity artifacts with the expense of losing image integrity. The comparison of APTmean values between lesions and parotid glands revealed that the subtraction value of APTmean between two sequences might be a stronger parameter than APTmean value in one single sequence, indicating that combining APTw sequences with different B1 powers could potentially improve parotid tumor detection. Our findings in this research could give an insight into APTw imaging quality improvement in the head and neck area, which might help the noninvasive diagnosis of parotid tumors in the future.
In terms of data analysis of this study, the choices of statistical tests used and their suitability for the type of data and research questions posed are discussed thoroughly here. A 4-point Likert scale was used to quantify the image quality of APT. The Mann–Whitney U test was used to compare the differences of integrity and hyperintensity artifacts scores between tumor lesions and parotid glands, because its application is to compare the differences between two independent samples when the sample distributions are not normally distributed and the sample sizes are small (n < 30). The Wilcoxon paired signed-rank test was used to compare the difference of integrity and hyperintensity artifact scores between the three APTw sequences for the same reason. As for APTw values, the Shapiro–Wilk test was performed firstly to evaluate the normality of distribution, and proved its normality. Therefore, the paired sample t-test was used to compare the difference in APTmean values between the three sequences.
APTw MRI images in parotid tumors are mainly studied to differentiate malignant and benign tumors. Bae et al. studied APTw imaging on 23 benign and 15 malignant parotid tumors, finding mean APTw values had better diagnostic performance compared with maximum and median APTw values [32]. Kamitani et al. compared mean APTw values between 21 benign and 12 malignant parotid tumors, and found significantly higher APTw values of malignant tumors (2.99 ± 0.99% vs. 2.23% ± 0.80%, p = 0.01) [24]. Law et al. also addressed similar findings of APTw values between malignant and benign parotid tumors, and also found that adding APTw value to ADC could increase the area under the curve from 0.87 to 0.96. These studies on differentiation between malignant and benign parotid tumors, however, depended on other MRI images to recognize parotid tumors in APTw images. It remains a question for parotid tumor detection in APTw imaging whether the APTw value between parotid tumors and normal parotid glands is significantly different. Our previous study showed differences in APTw values between lesions and parotid glands only in trustable samples after excluding images with hyperintensity artifacts, suggesting that hyperintensity artifacts are a notable interference factor in the application of APTw MRI for parotid lesion detection [28], which led to this study to decrease the interference of hyperintensity artifacts, and to improve image quality of APTw imaging for parotid tumor detection.
CEST imaging is sensitive to B0 and B1 field inhomogeneity, which can induce artifacts [33,34]. In this study, the effect of B0 inhomogeneity on APTw values was minimized by z-spectrum correction based on the B0 field map. Other studies have shown that APTw values increase with B1 power, while CEST contrast is not sensitive to B1 inhomogeneity [35], indicating the potential of using weaker RF to decrease hyperintensity artifacts without attenuating APTw contrast. When B1 = 0.5 μT was applied in our pre-experiment, there were large areas of signal loss which impaired tumor detection, so we chose a B1 gradient of 2, 1, 0.7 μT. In this study, it was found that with decreasing B1 power, the artifacts of both PTs and PGs declined, although with integrity loss of lesions.
Theoretically, APTmean value would be higher in PT compared to PG due to the increased content of mobile protein and peptides, resulting in an increased amide proton transfer rate in tumors [12]. However, previous studies have shown controversial results regarding APT values between parotid lesions and parotid glands. Yuan et al. found the mean APTw value of 12 normal parotid glands was 7.62%, while the APTw value of parotid pleomorphic adenoma was 1.18% [27]. Chen et al. found the difference between parotid tumors and parotid glands is significant in the trustable group (1.99% ± 1.18% vs. 1.03% ± 1.09%, p = 0.018) [28]. This study found different results depending on the B1 power used: APTw values of PTs were higher than PGs in strong B1 power (B1 = 2 μT), although not significant, but lower in weaker B1 power. That significant differences were found in evaluable groups, while not in trustable groups (see in Table 7), might be explained as the limitation of the sample size of trustable groups. In addition, the difference of APT1 value between PTs and PGs of the evaluable group was found not significant, possibly because the distinction of APTw values was small and a relatively larger sample size was required. Moreover, it was an interesting finding that APTmean of lesions might decease more than normal parotid glands with decreasing B1 power. Therefore, the difference in APTmean subtraction values between PTs and PGs was compared, revealing a significant difference as expected.
The positive results of the comparison between sequences might be due to several reasons. First, the signals collected by APT sequences from parotid glands and tumors can be easily corrupted by slight body motions, such as swallowing, etc. [33]. The subtraction of APT signals collected from two RF powers might have the potential to reduce motion impact. Second, the signals obtained from APT sequences consist of APT signal, nuclear over Hauser enhancement (NOE) effect and conventional magnetization transfer (MT) signal, which have different compositions in normal and tumor tissues and have different trends of signal strength with B1 change [13]. The subtraction of signals from two RF powers could possibly weight the key factors that matter most, leading to better results compared to using a single RF power. Thirdly, B1 power might have a different extent of impact for different molecules, which could be presented in the APTw subtraction values in different B1 powers between lesions and parotid glands.
The study has several limitations that should be acknowledged. First, the limited number of patients included in the study may affect the generalizability of the findings. Patient selection criteria and exclusion of unreliable images may have led to a smaller sample size, which could decrease the confidence level of the data. According to our published pre-experiment [28], the difference between parotid tumors and parotid glands is significant in the trustable group (1.99% ± 1.18% vs. 1.03% ± 1.09%, p = 0.018), when α = 0.05, β = 0.2, μ1, μ2, σ1, and σ2 are set as listed above, N1 and N2 are calculated as 23 and 23 to obtain a significant result, respectively (PASS 2021, v21.0.3). Therefore, 23 parotid tumors and 23 parotid glands in a trustable group are required to find a significant difference. In this study, after evaluation and selection, only 19 parotid tumors and 17 parotid glands were left in the trustable group in the analysis. Further studies with larger sample sizes are needed to validate the findings. Second, the modification of B1 power in this study was performed using only three gradients, which may not have captured the optimal balance between maintaining integrity and decreasing hyperintensity artifacts. More precise parameter modifications and optimization of B1 power may be necessary to achieve better results in future studies. Third, while the study provided some possible explanations for the APTmean subtraction values between sequences, the underlying theoretical representation remains to be discovered. The exact mechanisms and molecular basis for the observed differences in APTw values between different B1 powers and their impact on parotid tumor detection are not fully understood and require further investigation.
In conclusion, despite the findings of this study, there are limitations that should be taken into consideration, including the small sample size, limited parameter modifications, and the need for further research to better understand the underlying mechanisms. Future studies with (1) larger sample sizes: as calculated above, at least 23 parotid tumors and 23 parotid glands after selection in trustable group; (2) more precise parameter modifications: the B1 power gradient decrease and specification especially; and (3) in-depth investigations into the molecular basis of APTw MRI findings are recommended to validate and expand on the results of this study.

5. Conclusions

The discoveries of this study suggest that modification of B1 power might improve APTw image quality in parotid tumor identification by reducing hyperintensity artifacts, although at the expense of losing integrity. Combining different APTw sequences may enhance the efficacy of parotid tumor detection, potentially overcoming the limitations of individual sequences. Additionally, the study highlights the need for precise parameter modifications in APTw MRI for further quality improvement, particularly in the challenging head and neck area where hyperintensity artifacts can be prominent. The findings of this study contribute to the understanding of the potential benefits and limitations of B1 power modification in APTw MRI for parotid tumor identification. However, it is important to acknowledge the limitations of the study, including the small sample size and the need for further research to better understand the underlying mechanisms of APTw MRI findings. Future studies with larger sample sizes, more precise parameter modifications, and comprehensive evaluation of different APTw sequences are warranted to validate and expand on the results of this study, to ultimately improve the clinical utility of APTw MRI in the detection and characterization of parotid tumors.

Author Contributions

Conceptualization, X.W. (Xiaoqian Wu), T.S. and Y.C.; methodology, T.S., Y.C., Z.X., X.W. (Xiaoqi Wang) and G.H.; software, Z.X., X.W. (Xiaoqi Wang) and G.H.; validation, X.W. (Xiaoqian Wu), T.S. and Y.C.; formal analysis, X.W. (Xiaoqian Wu); investigation, T.S., Y.C., Y.W. and Z.Z.; resources, Z.Z., T.Z. and Z.J.; data curation, X.W. (Xiaoqian Wu), T.S., L.M.W. and Y.C.; writing—original draft preparation, X.W. (Xiaoqian Wu) and T.S.; writing—review and editing, Y.C., X.W. (Xiaoqi Wang), L.M.W. and G.H.; visualization, X.W. (Xiaoqian Wu), T.S. and Y.C.; supervision, Y.C., T.Z. and Z.J.; project administration, Z.Z., T.Z. and Z.J.; funding acquisition, Z.J. and Z.Z. All authors have read and agreed to the published version of the manuscript.

Funding

This work was funded by National Natural Science Foundation of China (82371962), National High Level Hospital Clinical Research Funding (2022-PUMCH-B-067) and 2021SKY Beijing Imaging Research Fund of China International Medical Foundation (Z-2014-07-2101).

Institutional Review Board Statement

The study was conducted in accordance with the Declaration of Helsinki, and approved by the Institutional Review Board of Peking Union Medical College Hospital (KS2017118, approval date: 25 July 2017).

Informed Consent Statement

Informed consent was obtained from all subjects involved in the study. Written informed consent has been obtained from the patients to publish this paper.

Data Availability Statement

Data of this study are unavailable due to privacy and ethical restrictions.

Conflicts of Interest

The authors declare no conflicts of interest. The funders had no role in the design of the study; in the collection, analyses, or interpretation of data; in the writing of the manuscript; or in the decision to publish the results.

References

  1. Guzzo, M.; Locati, L.D.; Prott, F.J.; Gatta, G.; McGurk, M.; Licitra, L. Major and minor salivary gland tumors. Crit. Rev. Oncol./Hematol. 2010, 74, 134–148. [Google Scholar] [CrossRef]
  2. Altin, F.; Alimoglu, Y.; Acikalin, R.M.; Yasar, H. Is fine needle aspiration biopsy reliable in the diagnosis of parotid tumors? Comparison of preoperative and postoperative results and the factors affecting accuracy. Braz. J. Otorhinolaryngol. 2019, 85, 275–281. [Google Scholar] [CrossRef]
  3. Jering, M.; Thölken, R.; Zenk, J. Indications for fine-needle aspiration and core needle biopsy for diagnosis of salivary gland tumors. Hno 2023, 71, 154–163. [Google Scholar] [CrossRef]
  4. Stoia, S.; Băciuț, G.; Lenghel, M.; Badea, R.; Csutak, C.; Rusu, G.M.; Băciuț, M.; Tamaș, T.; Boțan, E.; Armencea, G.; et al. Cross-sectional imaging and cytologic investigations in the preoperative diagnosis of parotid gland tumors—An updated literature review. Bosn. J. Basic Med. Sci. 2021, 21, 19–32. [Google Scholar] [CrossRef]
  5. What is an MRI scan and what can it do? Drug Ther. Bull. 2011, 49, 141–144. [CrossRef] [PubMed]
  6. Coudert, H.; Mirafzal, S.; Dissard, A.; Boyer, L.; Montoriol, P.F. Multiparametric magnetic resonance imaging of parotid tumors: A systematic review. Diagn. Interv. Imaging 2021, 102, 121–130. [Google Scholar] [CrossRef]
  7. Kato, H.; Kawaguchi, M.; Ando, T.; Shibata, H.; Ogawa, T.; Noda, Y.; Hyodo, F.; Matsuo, M. Current status of diffusion-weighted imaging in differentiating parotid tumors. Auris Nasus Larynx 2023, 50, 187–195. [Google Scholar] [CrossRef] [PubMed]
  8. Chen, F.; Ni, Y. Chapter 7—Magnetic Resonance Imaging of Cancer Therapy. In Cancer Theranostics; Chen, X., Wong, S., Eds.; Academic Press: Oxford, UK, 2014; pp. 95–126. [Google Scholar] [CrossRef]
  9. Zhou, J.; Payen, J.F.; Wilson, D.A.; Traystman, R.J.; van Zijl, P.C. Using the amide proton signals of intracellular proteins and peptides to detect pH effects in MRI. Nat. Med. 2003, 9, 1085–1090. [Google Scholar] [CrossRef] [PubMed]
  10. Ward, K.M.; Aletras, A.H.; Balaban, R.S. A new class of contrast agents for MRI based on proton chemical exchange dependent saturation transfer (CEST). J. Magn. Reson. 2000, 143, 79–87. [Google Scholar] [CrossRef] [PubMed]
  11. Kamimura, K.; Nakajo, M.; Yoneyama, T.; Takumi, K.; Kumagae, Y.; Fukukura, Y.; Yoshiura, T. Amide proton transfer imaging of tumors: Theory, clinical applications, pitfalls, and future directions. Jpn. J. Radiol. 2019, 37, 109–116. [Google Scholar] [CrossRef]
  12. Zhou, J.; Lal, B.; Wilson, D.A.; Laterra, J.; van Zijl, P.C. Amide proton transfer (APT) contrast for imaging of brain tumors. Magn. Reson. Med. 2003, 50, 1120–1126. [Google Scholar] [CrossRef] [PubMed]
  13. Zhou, J.; Heo, H.Y.; Knutsson, L.; van Zijl, P.C.M.; Jiang, S. APT-weighted MRI: Techniques, current neuro applications, and challenging issues. J. Magn. Reson. Imaging 2019, 50, 347–364. [Google Scholar] [CrossRef] [PubMed]
  14. Liu, Z.; Wen, J.; Wang, M.; Ren, Y.; Yang, Q.; Qian, L.; Luo, H.; Feng, S.; He, C.; Liu, X.; et al. Breast Amide Proton Transfer Imaging at 3 T: Diagnostic Performance and Association With Pathologic Characteristics. J. Magn. Reson. Imaging 2023, 57, 824–833. [Google Scholar] [CrossRef] [PubMed]
  15. Zhang, S.; Rauch, G.M.; Adrada, B.E.; Boge, M.; Mohamed, R.M.M.; Abdelhafez, A.H.; Son, J.B.; Sun, J.; Elshafeey, N.A.; White, J.B.; et al. Assessment of Early Response to Neoadjuvant Systemic Therapy in Triple-Negative Breast Cancer Using Amide Proton Transfer-weighted Chemical Exchange Saturation Transfer MRI: A Pilot Study. Radiol. Imaging Cancer 2021, 3, e200155. [Google Scholar] [CrossRef]
  16. Loi, L.; Zimmermann, F.; Goerke, S.; Korzowski, A.; Meissner, J.E.; Deike-Hofmann, K.; Stieber, A.; Bachert, P.; Ladd, M.E.; Schlemmer, H.P.; et al. Relaxation-compensated CEST (chemical exchange saturation transfer) imaging in breast cancer diagnostics at 7T. Eur. J. Radiol. 2020, 129, 109068. [Google Scholar] [CrossRef] [PubMed]
  17. Meng, N.; Wang, X.; Sun, J.; Han, D.; Ma, X.; Wang, K.; Wang, M. Application of the amide proton transfer-weighted imaging and diffusion kurtosis imaging in the study of cervical cancer. Eur. Radiol. 2020, 30, 5758–5767. [Google Scholar] [CrossRef]
  18. He, Y.L.; Li, Y.; Lin, C.Y.; Qi, Y.F.; Wang, X.; Zhou, H.L.; Yang, J.J.; Xiang, Y.; Xue, H.D.; Jin, Z.Y. Three-dimensional turbo-spin-echo amide proton transfer-weighted mri for cervical cancer: A preliminary study. J. Magn. Reson. Imaging 2019, 50, 1318–1325. [Google Scholar] [CrossRef]
  19. Jia, G.; Abaza, R.; Williams, J.D.; Zynger, D.L.; Zhou, J.; Shah, Z.K.; Patel, M.; Sammet, S.; Wei, L.; Bahnson, R.R.; et al. Amide proton transfer MR imaging of prostate cancer: A preliminary study. J. Magn. Reson. Imaging 2011, 33, 647–654. [Google Scholar] [CrossRef]
  20. Guo, Z.; Qin, X.; Mu, R.; Lv, J.; Meng, Z.; Zheng, W.; Zhuang, Z.; Zhu, X. Amide Proton Transfer Could Provide More Accurate Lesion Characterization in the Transition Zone of the Prostate. J. Magn. Reson. Imaging 2022, 56, 1311–1319. [Google Scholar] [CrossRef]
  21. Takayama, Y.; Nishie, A.; Sugimoto, M.; Togao, O.; Asayama, Y.; Ishigami, K.; Ushijima, Y.; Okamoto, D.; Fujita, N.; Yokomizo, A.; et al. Amide proton transfer (APT) magnetic resonance imaging of prostate cancer: Comparison with Gleason scores. Magma 2016, 29, 671–679. [Google Scholar] [CrossRef]
  22. Meng, N.; Fu, F.; Sun, J.; Feng, P.; Luo, Y.; Wu, Y.; Li, X.; Yuan, J.; Yang, Y.; Liu, H.; et al. Sensitivity and specificity of amide proton transfer-weighted imaging for assessing programmed death-ligand 1 status in non-small cell lung cancer: A comparative study with intravoxel incoherent motion and (18)F-FDG PET. Quant. Imaging Med. Surg. 2022, 12, 4474–4487. [Google Scholar] [CrossRef] [PubMed]
  23. Meng, N.; Fu, F.; Feng, P.; Li, Z.; Gao, H.; Wu, Y.; Zhang, J.; Wei, W.; Yuan, J.; Yang, Y.; et al. Evaluation of Amide Proton Transfer-Weighted Imaging for Lung Cancer Subtype and Epidermal Growth Factor Receptor: A Comparative Study With Diffusion and Metabolic Parameters. J. Magn. Reson. Imaging 2022, 56, 1118–1129. [Google Scholar] [CrossRef]
  24. Kamitani, T.; Sagiyama, K.; Togao, O.; Yamasaki, Y.; Hida, T.; Matsuura, Y.; Murayama, Y.; Yasumatsu, R.; Yamamoto, H.; Yabuuchi, H. Amide proton transfer (APT) imaging of parotid tumors: Differentiation of malignant and benign tumors. Eur. J. Radiol. 2020, 129, 109047. [Google Scholar] [CrossRef]
  25. Zhou, J.; Zaiss, M.; Knutsson, L.; Sun, P.Z.; Ahn, S.S.; Aime, S.; Bachert, P.; Blakeley, J.O.; Cai, K.; Chappell, M.A.; et al. Review and consensus recommendations on clinical APT-weighted imaging approaches at 3T: Application to brain tumors. Magn. Reson. Med. 2022, 88, 546–574. [Google Scholar] [CrossRef]
  26. Law, B.K.H.; King, A.D.; Ai, Q.Y.; Poon, D.M.C.; Chen, W.; Bhatia, K.S.; Ahuja, A.T.; Ma, B.B.; Ka-Wai Yeung, D.; Fai Mo, F.K.; et al. Head and Neck Tumors: Amide Proton Transfer MRI. Radiology 2018, 288, 782–790. [Google Scholar] [CrossRef]
  27. Yuan, J.; Chen, S.; King, A.D.; Zhou, J.; Bhatia, K.S.; Zhang, Q.; Yeung, D.K.; Wei, J.; Mok, G.S.; Wang, Y.X. Amide proton transfer-weighted imaging of the head and neck at 3 T: A feasibility study on healthy human subjects and patients with head and neck cancer. NMR Biomed. 2014, 27, 1239–1247. [Google Scholar] [CrossRef]
  28. Chen, Y.; Wang, X.; Su, T.; Xu, Z.; Wang, Y.; Zhang, Z.; Xue, H.; Zhuo, Z.; Zhu, Y.; Jin, Z.; et al. Feasibility evaluation of amide proton transfer-weighted imaging in the parotid glands: A strategy to recognize artifacts and measure APT value. Quant. Imaging Med. Surg. 2021, 11, 2279–2291. [Google Scholar] [CrossRef]
  29. Zhao, X.; Wen, Z.; Huang, F.; Lu, S.; Wang, X.; Hu, S.; Zu, D.; Zhou, J. Saturation power dependence of amide proton transfer image contrasts in human brain tumors and strokes at 3 T. Magn. Reson. Med. 2011, 66, 1033–1041. [Google Scholar] [CrossRef]
  30. Kanazawa, Y.; Fushimi, Y.; Sakashita, N.; Okada, T.; Arakawa, Y.; Miyazaki, M. B(1) Power Optimization for Chemical Exchange Saturation Transfer Imaging: A Phantom Study Using Egg White for Amide Proton Transfer Imaging Applications in the Human Brain. Magn. Reson. Med. Sci. 2018, 17, 86–94. [Google Scholar] [CrossRef] [PubMed]
  31. Eggers, H.; Brendel, B.; Duijndam, A.; Herigault, G. Dual-echo Dixon imaging with flexible choice of echo times. Magn. Reson. Reson. Reson. Med. 2011, 65, 96–107. [Google Scholar] [CrossRef] [PubMed]
  32. Bae, Y.J.; Choi, B.S.; Jeong, W.J.; Jung, Y.H.; Park, J.H.; Sunwoo, L.; Jung, C.; Kim, J.H. Amide Proton Transfer-weighted MRI in the Diagnosis of Major Salivary Gland Tumors. Sci. Rep. 2019, 9, 8349. [Google Scholar] [CrossRef] [PubMed]
  33. Togao, O.; Keupp, J.; Hiwatashi, A.; Yamashita, K.; Kikuchi, K.; Yoneyama, M.; Honda, H. Amide proton transfer imaging of brain tumors using a self-corrected 3D fast spin-echo dixon method: Comparison With separate B(0) correction. Magn. Reson. Med. 2017, 77, 2272–2279. [Google Scholar] [CrossRef]
  34. Zhou, J.; Zhu, H.; Lim, M.; Blair, L.; Quinones-Hinojosa, A.; Messina, S.A.; Eberhart, C.G.; Pomper, M.G.; Laterra, J.; Barker, P.B.; et al. Three-dimensional amide proton transfer MR imaging of gliomas: Initial experience and comparison with gadolinium enhancement. J. Magn. Reson. Imaging 2013, 38, 1119–1128. [Google Scholar] [CrossRef] [PubMed]
  35. Sumi, M.; Van Cauteren, M.; Sumi, T.; Obara, M.; Ichikawa, Y.; Nakamura, T. Salivary gland tumors: Use of intravoxel incoherent motion MR imaging for assessment of diffusion and perfusion for the differentiation of benign from malignant tumors. Radiology 2012, 263, 770–777. [Google Scholar] [CrossRef] [PubMed]
Figure 1. Patient selection and APT evaluation flowchart. APT, amide proton transfer.
Cancers 16 00888 g001
Figure 2. An example of ROI1 and ROI2 drawn in a patient with WT and image quality score. (a) A lesion was found at right side of parotid gland in this 55-year-old male on T2WI. (b) ROI1 of both the lesion and parotid gland were delineated in APTw sequence 1 imaging according to T2WI, then ROI2 was drawn inside ROI1, maintaining the greatest area of normal gland or lesion while deleting hyperintensity areas. Integrity scores of both lesion and parotid were 4, considering that the entire lesion and parotid gland were displayed. Hyperintensity of lesion and parotid gland were both 3.
Cancers 16 00888 g002
Figure 3. APTw image quality change with B1 power change. (a) A lesion was found at right side of parotid gland in this 42-year-old male on T2WI, a pathologically proven pleomorphic adenoma. (b) APTw image with B1 = 2 μT; integrity scores of the lesion and parotid gland were both 4, while hyperintensity artifact scores were 3 and 2, respectively. (c) APTw image with B1 = 1 μT; integrity scores of the lesion and parotid gland were both 4, respectively, while hyperintensity artifact scores were both 4. (d) APTw image with B1 = 0.7 μT; integrity scores of the lesion and parotid gland were 3 and 4, respectively, while hyperintensity artifact scores were both 4.
Cancers 16 00888 g003
Table 1. Details of MRI Parameters.
ParametersT1w-mDIXONT2w-mDIXONAPTw 1APTw 2APTw 3
Imaging technique/Orientation3DTSE/Axial3DTSE/Axial3DTSE/Axial3DTSE/Axial3DTSE/Axial
TR/TE (msec)514/7.32500/936120/8.33474/8.33474/8.3
Flip angle (degrees)90100909090
FOV (AP × RL × FH) (mm3)200/200/99200/200/119230/180/60230/180/60230/180/60
Matrix (AP × RL × FH)252/219/2031/222/24128/100/10128/100/10128/100/10
Voxel size (mm3)0.8/0.9/40.64/0.81/41.8/1.8/61.8/1.8/61.8/1.8/6
Slice gap11000
NSA1.62111
No. of slices2024101010
TSE factor823174174174
SENSE factor2.22.01.61.61.6
Fat suppressionmDIXONmDIXONSPIRSPIRSPIR
Saturation B1 rms (μT)//210.7
Saturation duration (s)//222
Scan time (min/s)1:452:053:462:092:09
Table 2. Scores of hyperintensity artifact and their indications.
Scores of Hyperintensity ArtifactsIndication
4without or with small hyperintensity that does not impair the lesion or parotid gland
3hyperintensity artifacts impair less than 50% of the lesion or parotid gland
2hyperintensity artifacts impair more than 50% of the lesion or parotid gland
1the entire tumor lesion or normal gland is impaired by hyperintensity artifacts
Table 3. Characteristics of included patients.
CharacteristicValue
Total number of patients31
      Age (years)57.74 ± 17.78
      Gender (Male/Female)21/10
Average lesion diameter (mm)21.29 ± 8.28
Number of patients who received surgery and had pathological diagnosis22
      Age(years)56.86 ± 18.85
      Gender (Male/Female)17/5
Pathological result23
      Benign tumors17
            Warthin tumor8
            Pleomorphic adenoma5
            Basal cell adenoma3
            Neurilemmoma1
      Malignant tumor6
            Acinar cell carcinoma2
            Lymphoma2
            Adenoid cystic carcinoma1
            Carcinoma ex pleomorphic adenoma1
3D, three dimensional; APT, amide proton transfer.
Table 4. Observer consistence analysis of integrity and hyperintensity artifact score.
SequenceScoreKappa Coefficient95%CIp Value
APT 1IntegrityPTs (n = 32)0.827(0.594, 1.060)<0.001
PGs (n = 30)0.886(0.731, 1.041)<0.001
HyperintensityPTs (n = 28)0.896(0.757, 1.035)<0.001
PGs (n = 28)0.889(0.754, 1.024)<0.001
APT 2IntegrityPTs (n = 32)0.894(0.749, 1.039)<0.001
PGs (n = 30)0.874(0.705, 1.043)<0.001
HyperintensityPTs (n = 28)0.781(0.369, 1.193)<0.001
PGs (n = 28)0.885(0.728, 1.042)<0.001
APT 3IntegrityPTs (n = 32)0.913(0.795, 1.031)<0.001
PGs (n = 30)0.884(0.731, 1.037)<0.001
HyperintensityPTs (n = 28)0.462(−0.169, 1.092)0.015
PGs (n = 28)0.859(0.669, 1.049)<0.001
APT, amide proton transfer; PTs, parotid tumors; PGs, parotid glands; CI, confidence interval.
Table 5. Qualitative analysis between parotid lesions and normal parotid glands.
SequenceProjectsScore 1 (%)Score 2 (%)Score 3 (%)Score 4 (%)p Value
APT 1IntegrityPTs (n = 32)02 (6.25)6 (18.75)24 (75.00)0.082
PGs (n = 30)2 (6.67)1 (3.33)11 (36.67)16 (53.33)
HyperintensityPTs (n = 28)9 (32.14)09 (32.14)10 (35.71)0.669
PGs (n = 28)2 (7.14)9 (32.14)12 (42.86)5 (17.86)
APT 2IntegrityPTs (n = 32)1 (3.13)3 (9.38)12 (37.5)16 (50.00)0.723
PGs (n = 30)01 (3.33)14 (46.67)15 (50.00)
HyperintensityPTs (n = 28)003 (10.71)25 (89.29)0.001
PGs (n = 28)1 (3.57)3 (10.71)11 (39.29)13 (46.43)
APT 3IntegrityPTs (n = 32)4 (12.50)7 (21.88)13 (40.63)8 (25.00)0.022
PGs (n = 30)03 (10.00)14 (46.67)13 (43.33)
HyperintensityPTs (n = 28)001 (3.57)27 (96.43)0.001
PGs (n = 28)1 (3.57)1 (3.57)9 (32.14)17 (60.71)
APT, amide proton transfer; PTs, parotid tumors; PGs, parotid glands.
Table 6. Qualitative analysis between three APTw sequences.
SequenceProjectsScore 1 (%)Score 2 (%)Score 3 (%)Score 4 (%)p Value
PTsIntegrityAPT 1 (n = 32)02 (6.25)6 (18.75)24 (75.00)APT 1 vs. APT 20.021
APT 2 (n = 32)1 (3.13)3 (9.38)12 (37.5)16 (50.00)APT 2 vs. APT 30.002
APT 3 (n = 32)4 (12.50)7 (21.88)13 (40.63)8 (25.00)APT 1 vs. APT 3<0.001
HyperintensityAPT 1 (n = 28)9 (32.14)09 (32.14)10 (35.71)APT 1 vs. APT 2<0.001
APT 2 (n = 28)003 (10.71)25 (89.29)APT 2 vs. APT 30.157
APT 3 (n = 28)001 (3.57)27 (96.43)APT 1 vs. APT 3<0.001
PGsIntegrityAPT 1 (n = 30)2 (6.67)1 (3.33)11 (36.67)16 (53.33)APT 1 vs. APT 20.765
APT 2 (n = 30)01 (3.33)14 (46.67)15 (50.00)APT 2 vs. APT 30.206
APT 3 (n = 30)03 (10.00)14 (46.67)13 (43.33)APT 1 vs. APT 30.740
HyperintensityAPT 1 (n = 28)2 (7.14)9 (32.14)12 (42.86)5 (17.86)APT 1 vs. APT 20.004
APT 2 (n = 28)1 (3.57)3 (10.71)11 (39.29)13 (46.43)APT 2 vs. APT 30.083
APT 3 (n = 28)1 (3.57)1 (3.57)9 (32.14)17 (60.71)APT 1 vs. APT 30.003
APT, amide proton transfer; PTs, parotid tumors; PGs, parotid glands.
Table 7. Quantitative analysis of parotid lesions and normal parotid glands.
ProjectsPTsPGsp Value
Evaluable group
Number2828
APT 1 value (%)3.18 ± 2.742.21 ± 2.120.144
APT 2 value (%)0.60 ± 0.751.46 ± 1.820.024
APT 3 value (%)0.06 ± 0.830.88 ± 1.850.036
APT 1–APT 2 (%)2.59 ± 2.480.75 ± 1.200.001
APT 1–APT 3 (%)3.13 ± 2.641.33 ± 1.480.003
APT 2–APT 3 (%)0.54 ± 0.830.58 ± 0.860.860
Trustable group
Number1917
APT 1 value (%)1.95 ± 1.771.57 ± 2.230.570
APT 2 value (%)0.46 ± 0.671.37 ± 2.120.085
APT 3 value (%)0.04 ± 0.841.05 ± 2.340.086
APT 1–APT 2 (%)1.49 ± 1.540.20 ± 0.510.002
APT 1–APT 3 (%)1.91 ± 1.880.51 ± 0.560.005
APT 2–APT 3 (%)0.42 ± 0.900.32 ± 0.490.666
APT, amide proton transfer; PTs, parotid tumors; PGs, parotid glands.
Disclaimer/Publisher’s Note: The statements, opinions and data contained in all publications are solely those of the individual author(s) and contributor(s) and not of MDPI and/or the editor(s). MDPI and/or the editor(s) disclaim responsibility for any injury to people or property resulting from any ideas, methods, instructions or products referred to in the content.

