Article

Gene Expression Pattern of ESPL1, PTTG1 and PTTG1IP Can Potentially Predict Response to TKI First-Line Treatment of Patients with Newly Diagnosed CML

1
Department of Hematology and Oncology, Medical Faculty Mannheim, Heidelberg University, 68167 Mannheim, Germany
2
Department of Medical Statistics and Biomathematics, Medical Faculty Mannheim, Heidelberg University, 68167 Mannheim, Germany
*
Author to whom correspondence should be addressed.
Cancers 2023, 15(9), 2652; https://doi.org/10.3390/cancers15092652
Submission received: 17 April 2023 / Revised: 4 May 2023 / Accepted: 5 May 2023 / Published: 8 May 2023
(This article belongs to the Section Cancer Biomarkers)

Abstract

:

Simple Summary

There is still a lack of reliable molecular predictors to achieve major molecular response (MMR, BCR::ABL1 ≤ 0.1% IS) within the first year of treatment with tyrosine kinase inhibitors (TKI) in the therapeutic management of newly diagnosed chronic myeloid leukemia (CML). Employing a proprietary fluorogenic flow cytometry assay, we recently identified separase proteolytic activity as a potential marker of molecular response and BCR::ABL1 positivity of CD34+ cells in TKI-treated CML patients. Here, we analyzed the expression and predictive value of ESPL1/Separase, PTTG1/Securin and PTTG1IP/Securin interacting protein transcript levels in white blood cells of CML patients (n = 97) at the time of diagnosis by means of qRT-PCR. We establish a novel distance (cut-off) score based on ESPL1, PTTG1 and PTTG1IP gene expression levels that can serve as predictors of TKI non-response in about 10% of analyzed non-responding patients and may have potential benefit for the risk stratification of CML patients.

Abstract

The achievement of major molecular response (MMR, BCR::ABL1 ≤ 0.1% IS) within the first year of treatment with tyrosine kinase inhibitors (TKI) is a milestone in the therapeutic management of patients with newly diagnosed chronic myeloid leukemia (CML). We analyzed the predictive value of gene expression levels of ESPL1/Separase, PTTG1/Securin and PTTG1IP/Securin interacting protein for MMR achievement within 12 months. Relative expression levels (normalized to GUSB) of ESPL1, PTTG1 and PTTG1IP in white blood cells of patients (responders n = 46, non-responders n = 51) at the time of diagnosis were comparatively analyzed by qRT-PCR. 3D scatter plot analysis combined with a distance analysis performed with respect to a commonly calculated centroid center resulted in a trend to larger distances for non-responders compared to the responder cohort (p = 0.0187). Logistic regression and analysis of maximum likelihood estimates revealed a positive correlation of distance (cut-off) with non-achieving MMR within 12 months (p = 0.0388, odds ratio 1.479, 95%CI: 1.020 to 2.143). Thus, 10% of the tested non-responders (cut-off ≥ 5.9) could have been predicted already at the time of diagnosis. Future scoring of ESPL1, PTTG1 and PTTG1IP transcript levels may be a helpful tool in risk stratification of CML patients before initiation of TKI first-line treatment.

1. Introduction

1.1. Molecular Response in Treatment of Chronic Myeloid Leukemia

An improved therapy regimen employing selective tyrosine kinase inhibitors (TKI) directed at the abnormal BCR::ABL1 tyrosine kinase led to durable cytogenetic (CyR) and molecular response (MR) in the majority of patients with chronic myeloid leukemia (CML), thus achieving an almost normal life expectancy [1,2]. TKI treatment leads to a reduction in malignant cells by several orders of magnitude, in some cases even below the level of detection using quantitative reverse transcriptase polymerase chain reaction (qRT-PCR), which is the gold standard method for patient follow-up [3,4,5].
The molecular response is assessed according to the International Scale (IS) as the ratio of BCR::ABL1 transcripts to ABL1 or beta-glucuronidase (GUSB) transcripts. It is reported as BCR::ABL1% on a log scale, where 1%, 0.1%, 0.01%, 0.0032%, and 0.001% correspond to a decrease of 2, 3, 4, 4.5, and 5 logs, respectively, below the standardized baseline that was established in the IRIS study [3,4,5]. A BCR::ABL1 transcript level of ≤0.1% is defined as a major molecular response (MMR) or MR3. According to the current European LeukemiaNet (ELN), recommendations monitoring milestones of BCR::ABL1 transcript levels at 3, 6, and 12 months determine whether the current treatment should be continued (optimal response), changed (failure/resistance), or carefully reconsidered, depending on patients’ characteristics, co-morbidities and tolerance (warning) [2,6,7]. Achieving an MMR (BCR::ABL1 ≤ 0.1%) within 12 months predicts a CML-specific survival close to 100%, as disease progression is uncommon once this level of cytoreduction has been achieved. A change of treatment may be considered (warning) if MMR is not reached by 12 months [2,8].
There is still a search for robust diagnostic prediction markers for the desired fast and/or deep response to TKI first-line treatment. Such markers could improve patient management by helping to select patients at diagnosis that are a priori candidates for intensified treatment concepts, also justifying the potential risk of side effects, preventing over- or under-treatment and saving costs [9]. So far, response-related dynamic variables are still the most relevant predictors for long-term outcomes (as mirrored in the ELN recommendations) [2,9,10,11,12]. Recently, intracellular Separase proteolytic activity was identified as a potential marker of molecular response, BCR::ABL1 positivity and proliferation of CD34+ cells in TKI-treated CML patients [13].

1.2. ESPL1/Separase, PTTG1/Securin and PTTG1IP/Securin Interacting Protein

ESPL1/Separase, a cysteine endopeptidase, is a key player in chromosomal segregation. In mitotic anaphase, it accomplishes proteolytic cleavage of Cohesin, a “glue” multi-protein complex that holds sister chromatids together [14,15]. Furthermore, Separase maintains chromatin architecture, thereby mediating regulatory domain interactions within transcriptionally associated domains (TADs) [16]. This activity on interphase chromosomes involves controlling replication fork speed and DNA repair mechanisms, thereby preventing oncogenic transformation [17,18,19]. In human cancers, ESPL1/Separase is frequently overexpressed and associated with the emergence of aneuploidy, a hallmark of advanced human malignancies [20,21,22,23]. Consequently, Separase is considered an aneuploidy promoter that, when overexpressed, can function as an oncogene [24].
Proper temporal and spatial activation of Separase proteolytic activity is ensured by multiple inhibitory mechanisms; first of all, PTTG1/Securin binding [14,25,26,27]. Securin binds Separase in a chaperone-like manner and inhibits its proteolytic activity by both blocking substrate interaction and compelling an inactive conformational state [28,29]. For Separase activation, Securin is targeted for proteasomal degradation by the ubiquitin ligase APC (anaphase-promoting complex), resulting in the broad destruction of intracellular Securin. This mediates the degradation of Cohesin followed by autocatalytic inactivation and complete proteolysis of Separase itself [14,30]. Therefore, post-mitotic cells lack both functional Separase and Securin that must be expressed de novo before the next mitotic round can take place [26]. Securin and Securin-interacting protein (PTTG1IP) are important for the nuclear accumulation of newly synthesized Separase molecules [28]. PTTG1IP represents a multifunctional glycosylated type I integral membrane protein, which mediates the translocation of Securin into the nucleus [29,31]. Since the overexpression of PTTG1IP has been associated with dysregulated p53 functions, PTTG1IP has been identified as a putative oncogene, thereby consorting with Separase and Securin [32].
Here, we investigated the predictive value of ESPL1, PTTG1 and PTTG1IP gene expression for achievement of MMR under TKI first-line therapy within 12 months in newly diagnosed CML patients (n = 97). We found that distinct expression levels of the three functionally associated genes can predict MMR non-achievement. Pathogenetic context and the potential benefit in risk stratification of CML patients eligible for TKI first-line treatment are discussed.

2. Materials and Methods

2.1. Patients and Controls

Our investigation represents a small experimental pilot study with highly limited retrospective cDNA samples collected between the years 2002 and 2017 from BCR::ABL1 routine diagnostics carried out at the laboratory for leukemic diseases of the Department of Hematology and Oncology, Medical Faculty Mannheim, University of Heidelberg. All cDNA samples were remains of a regular BCR::ABL1 monitoring procedure accompanying the TKI treatment of patients at our site. By default, excess samples were kept frozen at −20 °C until they were selected for this investigation. Since the majority of patients were included in clinical CML studies, comprehensive clinical and molecular data for each patient, stored in a local database (LeukDB), was available for this investigation. In total, 97 CML patients in chronic phase (CP) at the time of initial diagnosis (ID) and 51 healthy controls were investigated (Table S1). Randomly selected samples were solely classified based on time until the achievement of MMR (=0.1%IS). No additional criteria were applied that may cause potential biases. Of these, 46 patients (mean age 58 y, range 14–85 y, 59% male) were classified as responders (=R, achievement of MMR within 12 months of TKI treatment). Fifty-one patients (mean age 58 y, range 26–87 y, 59% male) were classified as non-responders (=NR, no MMR within 12 months of TKI treatment). The mean time until the achievement of MMR for the R cohort was 5 months (±3 M). The mean time until MMR for the NR cohort was 26 months (±15 M). With 27 (53%), more than half achieved MMR after the first 12 months of TKI treatment, while almost half of the NRs (n = 24, 47%) never achieved MMR (refer to Table S1).
The distribution of the BCR::ABL1 fusion type variants e13a2 and e14a2 was 48%/30% for R (n = 46) and 41%/37% for the NR group (n = 50), respectively. Two patients of the NR group (4%) expressed e1a2 fusion type. The mean white blood cell counts at ID were 42,089 (range: 3400 to 316,000) for the R and 90,978 (range: 2000 to 404,000) for the NR cohort. A total of 91 of all CML patients (n = 97) were untreated at the time of sampling. The remaining six patient samples stem from a point before therapy restarted after a pause of at least 3 months once the patients relapsed from initial remission. A total of 63% of all patients received only one TKI during the first 12 months after diagnosis, 37% of all patients have undergone a combination or change of therapy. The majority of patients received imatinib as the only drug (32%), followed by nilotinib (23%), dasatinib (7%) and bosutinib (1%) (Table S3). BCR::ABL1 tumor load reported as BCR::ABL1%IS, where available at the time of ID, averaged out at 29% (range: 0.02% to 85%) for the R and 35% (range: 0.15% to 178%) for the NR cohort. None of the analyzed patients showed additional cytogenetic aberrations. The study has been approved by the institutional ethics committee (Medizinische Ethikkommission II, Medizinische Fakultät Mannheim, Ruprecht Karls-Universität Heidelberg, #2016-506N-MA). All patients provided written informed consent in accordance with the Declaration of Helsinki.

2.2. Sample Preparation and Quantification of BCR::ABL1

Whole peripheral blood was subjected to red blood cell lysis, and the resulting white blood cell (WBC) pellets were used for total RNA extraction, as described recently [33,34,35]. WBC prepared from whole blood samples of 51 anonymous healthy donors served as experimental controls and were treated in the same way as the patient samples. Total RNA preparation from clinical samples (Maxwell®MDx technology, Promega, Mannheim, Germany), absolute quantification of BCR::ABL1 transcript levels (TaqMan 7500 Fast Real-Time PCR System, ThermoFisherScientific/Applied Biosystems, Waltham, MA, USA) and data evaluation were performed as described previously [35]. GUSB served as the housekeeping gene in all qRT-PCR experiments.

2.3. Relative Quantification of ESPL1, PTTG1, PTTG1IP Transcript Levels

The LightCycler 480 platform (Roche Applied Science, Mannheim, Germany) was used for qRT-PCR of the GUSB, ESPL1, PTTG1 and PTTG1IP transcript levels employing SYBR Green I Master Mix” (Roche Applied Science), and target-specific primer sets (Hs_ESPL1_1_SG QuantiTect, Cat. No. QT00027216; Hs_PTTG1IP_1_SG QuantiTect, Cat. No. QT00076601; Hs_PTTG1_1_SG QuantiTect, Cat. No. QT00044037) according to the manufacturer’s manual (Qiagen, Hilden, Germany). Experiments were performed in triplicate. Relative quantification (2(−ΔΔCt) method) followed the method of Livak and Schmittgen from 2001 [36].

2.4. Statistics

Our investigation represents a small experimental pilot study with preselected (R or NR) and highly limited retrospective cDNA samples collected for years from BCR::ABL1 routine diagnostics at our site. All available samples that matched the R and NR criteria as outlined in the Materials and Methods section are included in the investigation. Since no sample/patient randomization was carried out, no sample size calculation analysis has been performed. Statistical calculations and a 3D scatter plot were performed using SAS version 9.4 (SAS Institute GmbH, Heidelberg) and SPSS version 27 (IBM, Ehningen, Germany), respectively. Unpaired (Student’s t-test) and paired analyses (Wilcoxon signed rank test) were employed to calculate the variation ranges between the relative qRT-PCR data. Logistic regression (Fisher’s scoring) and analysis of maximum likelihood estimates were used to test for the correlation of distance with response. Clinical data were compared using parametric tests (Student’s t-test) and non-parametric (Mann–Whitney U-test, Fisher test, and chi-squared test). For association with time non-parametric data, Spearman, Kruskal–Wallis and Mann–Whitney U-tests were used. Values of p < 0.05 were considered significant.

3. Results

3.1. Relative Gene Expression of ESPL1, PTTG1 and PTTG1IP

We have investigated relative transcript levels of ESPL1, PTTG1 and PTTG1IP in the WBC of 97 CML patients (R, n = 46; NR, n = 51) at the time of ID and of 51 healthy controls by means of qRT-PCR. The measured Ct values were normalized to the housekeeping gene GUSB. The resulting ΔCt data were subjected to statistical analysis. It is noted that the ΔCt values are inversely correlated to the respective real transcript levels.
Analysis of variance (Table 1) revealed global p-values of p < 0.0001 (ESPL1), p = 0.0036 (PTTG1) and p = 0.1736 (PTTG1IP). Pairwise testing for ESPL1 and PTTG1 showed significant differences between CML groups (R, NR) and controls, i.e., elevated transcript levels (FC = fold change) in the CML groups when compared to the control group. ESPL1 and PTTG1 showed significantly higher respective transcript levels in the CML NR (mean ΔCtESPL1 = 4.53 ± 1.86, FCESPL1 = 4.40, ΔCtPTTG1 = 3.41 ± 1.72, FCPTTG1 = 3.64) and R (mean ΔCtESPL1 = 4.94 ± 01.51, FCESPL1 = 3.13, ΔCtPTTG1 = 3.42 ± 0.78, FCPTTG1 = 1.88) group when compared to the control group (mean ΔCtESPL1 = 5.89 ± 0.76, ΔCtPTTG1 = 4.10 ± 0.65). There were no significantly different respective transcript levels of PTTG1IP in the CML NRs (mean ΔCtPTTG1IP = 2.87 ± 2.57; FCPTTG1IP = 3.05) or R (mean ΔCtPTTG1IP = 2.38 ± 1.69, FCPTTG1IP = 2.67) group than in the control group (mean ΔCtPTTG1IP = 3.07 ± 0.93). No significance was observed when the CML R and NR groups were compared. For detailed statistics, see Table S2. Correlations between gene pairs (Pearson) showed significance between ESPL1/PTTG1 for the NR (r = 0.58, p < 0.0001) and R (r = 0.55, p < 0.0001) cohorts and PTTG1/PTTG1IP (r = 0.52, p = 0.0001) for the NR cohort.

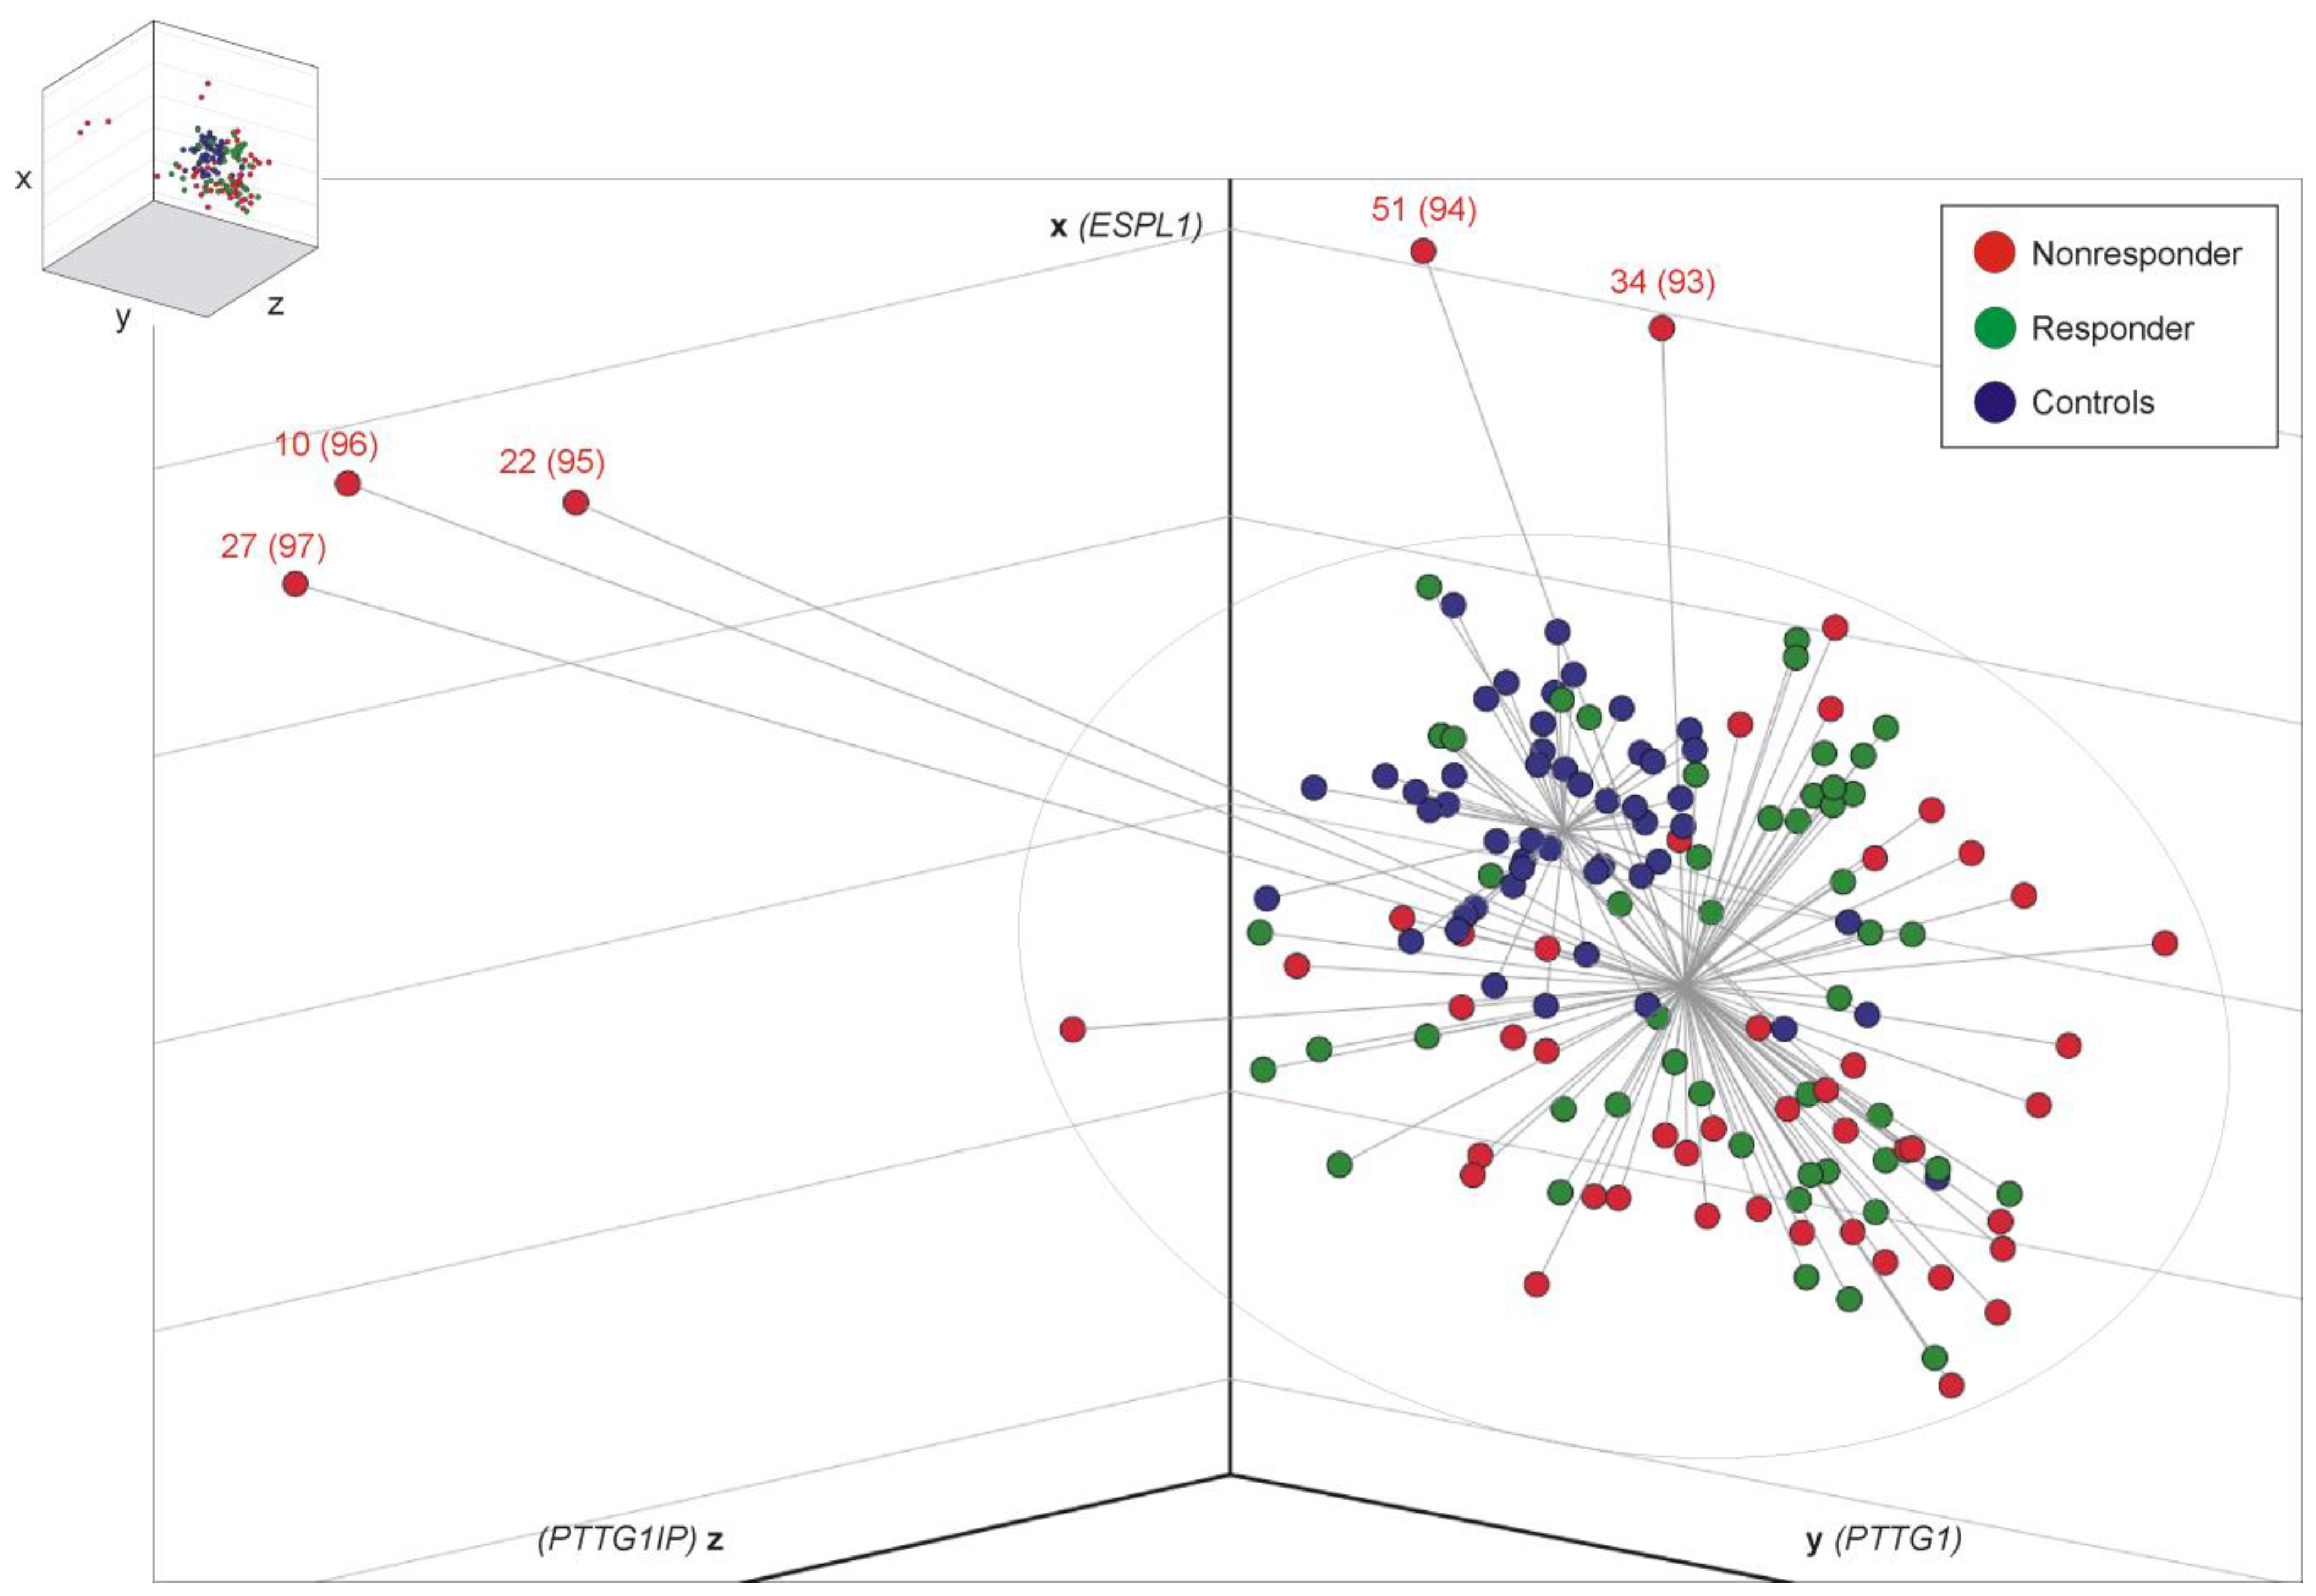
3.2. Distance Analysis for Risk Stratification

In the search for a better discriminatory power (R vs. NR), we ordered sample data within the three-dimensional room by constructing centroid spheres, one for each cohort, as illustrated in Figure 1. The center of each centroid corresponds to the respective mean ΔCt values of ESPL1 (x-axis), PTTG1 (y-axis) and PTTG1IP (z-axis). Distance (=cut-off) analysis of each CML sample (represented by xyz-coordinates) with respect to the commonly calculated CML centroid center resulted in a significant difference in spatial distance for NR when compared to the R group (NR, 2.98, 95% confidence limits: 2.40 to 3.55 vs. R, 2.23, 95% confidence limits: 1.97 to 2.49, t-test (Satterthwaite approximation) p = 0.0187). Logistic regression and analysis of maximum likelihood estimates revealed a positive correlation of distance with MMR non-achievement (p = 0.0388, odds ratio 1.479, 95% Wald confidence limits: 1.020 to 2.143). Thus, the larger the calculated distance, the higher the probability for prognosis of “NRs”. Calculated cut-offs (distances), including sensitivities and specificities for all CML samples (n = 97), are given in Table 2. Accordingly, 5 NR (10%) with distance values >5.9 display a 75% probability for MMR non-achievement. For distance values >5.9810, the specificity is 100%, concurring with a probability for MMR non-achievement of 81%. Patients with a distance of 8 display ≥90% probability for MMR non-achievement, which applies to 6% (n = 3) of the observed NR.
Since samples 93, 94, 95, 96 and 97 (as shown at the end of Table 2) that correspond to patients 34, 51, 22, 10 and 27 (shown in Supplementary Table S1), respectively, show cut-offs of ≥5.9180 and 100% specificity, we state that these five NR samples are “predictable”. No additional criteria were applied that may cause potential biases. For detailed statistics, see Table S2. ROC curve analysis revealed the best possible overall diagnostic accuracy of combined ESPL1, PTTG1 and PTTG1IP transcript level testing at cut-off 3, i.e., 85% specificity concurring with 37% sensitivity (Figure S1).

3.3. Leukocyte Count at ID Differs between R and NR Cohort

Further analyses of variance with respect to basic and clinical parameters between the R and NR cohorts revealed no significant differences regarding age, sex or BCR::ABL1 fusion type (Table 3). As to be expected, the time until the achievement of MMR showed significance (p < 0.001). Furthermore, approximately twice the number of leukocytes at ID were found in the NR cohort (mean 90,977.45 cells/µL) when compared to the R cohort (mean 42,089.13 cells/µL; p = 0.018). The BCR::ABL1 quotients showed a similar strong trend (p = 0.067). The proportion of imatinib to administered TKIs in total (n = 96, see Table S3) was higher (p = 0.007) in the NR cohort (68%) than in the R cohort (31%).

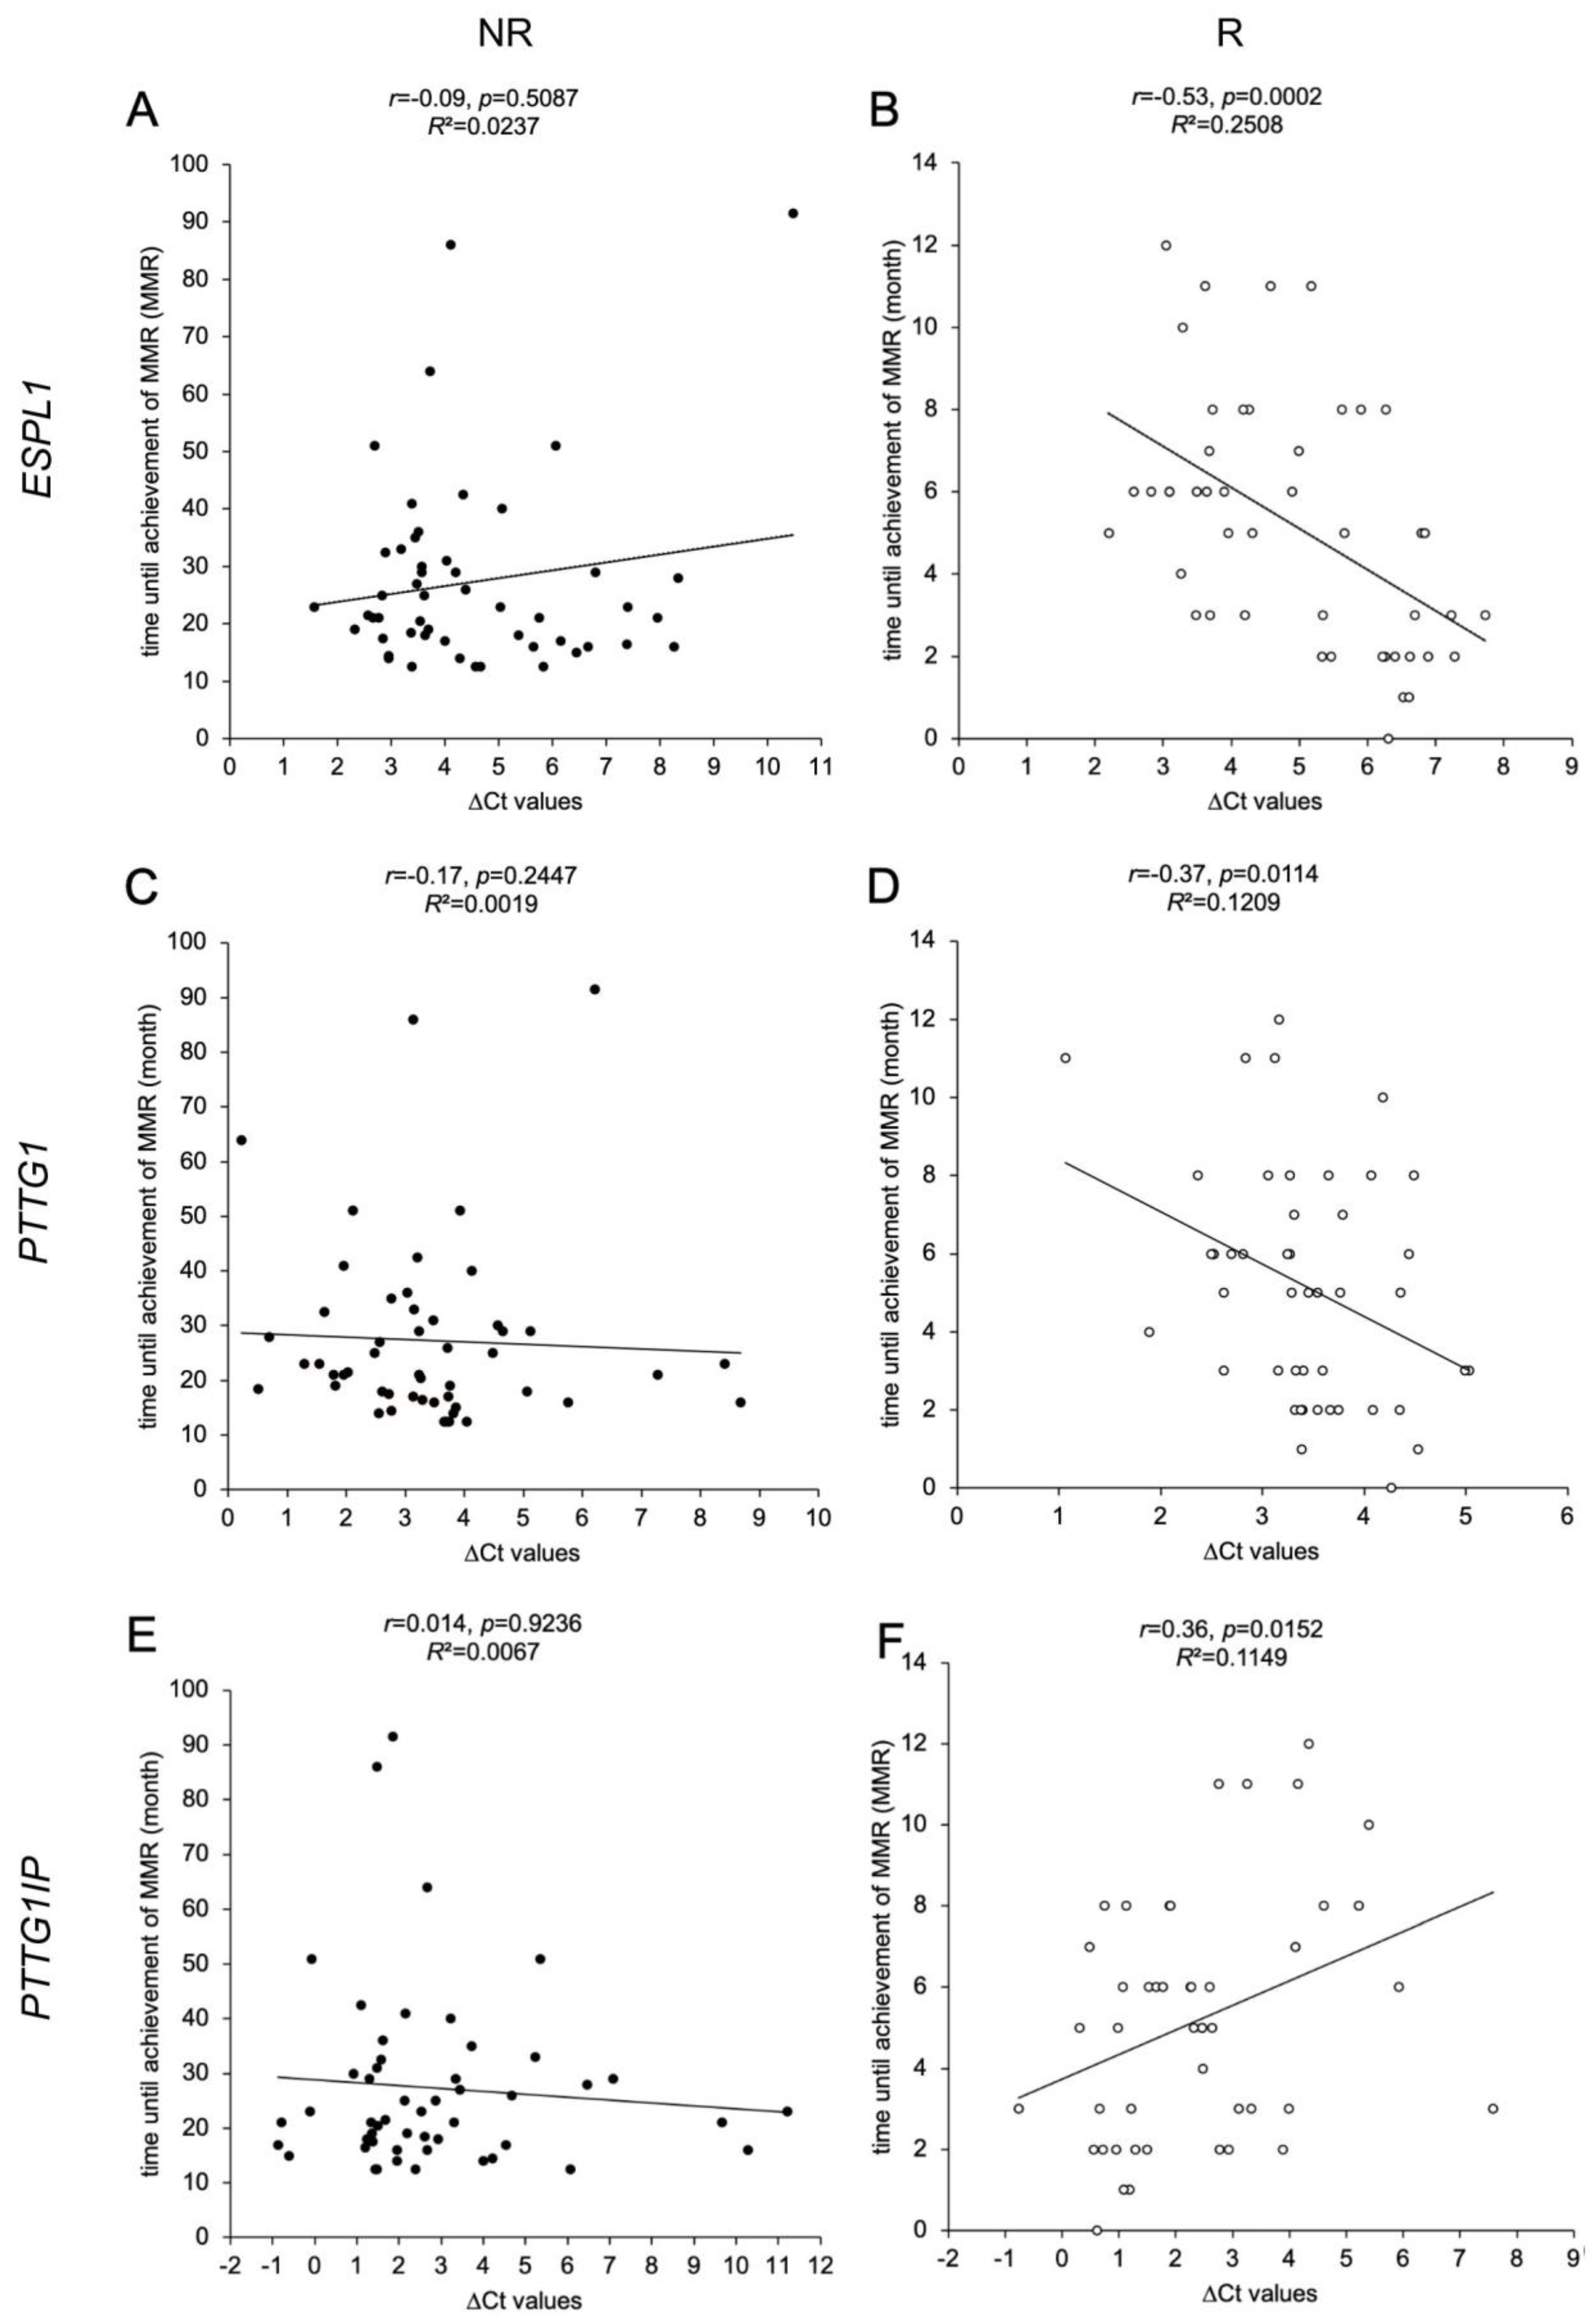
3.4. ESPL1, PTTG1 and PTTG1IP Gene Expression Levels in R Cohort Correlate with Time until Achievement of MMR

We have investigated potential correlations between time until the achievement of MMR and the gene expression levels of ESPL1, PTTG1 and PTTG1IP (Figure 2). For the R cohort, negative correlations were found for the ΔCt values of ESPL1 (p = 0.0002, panel B) and PTTG1 (p = 0.0114, panel D). Due to the inverse correlation, this indicates that a lower gene expression of the ESPL1 and PTTG1 correlates with a faster achievement of MMR. In contrast, ΔCt values of PTTG1IP (p = 0.0152, panel E) correlated positively with time until the achievement of MMR, indicating that a higher expression of PTTG1IP correlates with a faster response to therapy. In contrast, the NR cohort did not show any relation regarding the gene expression levels.

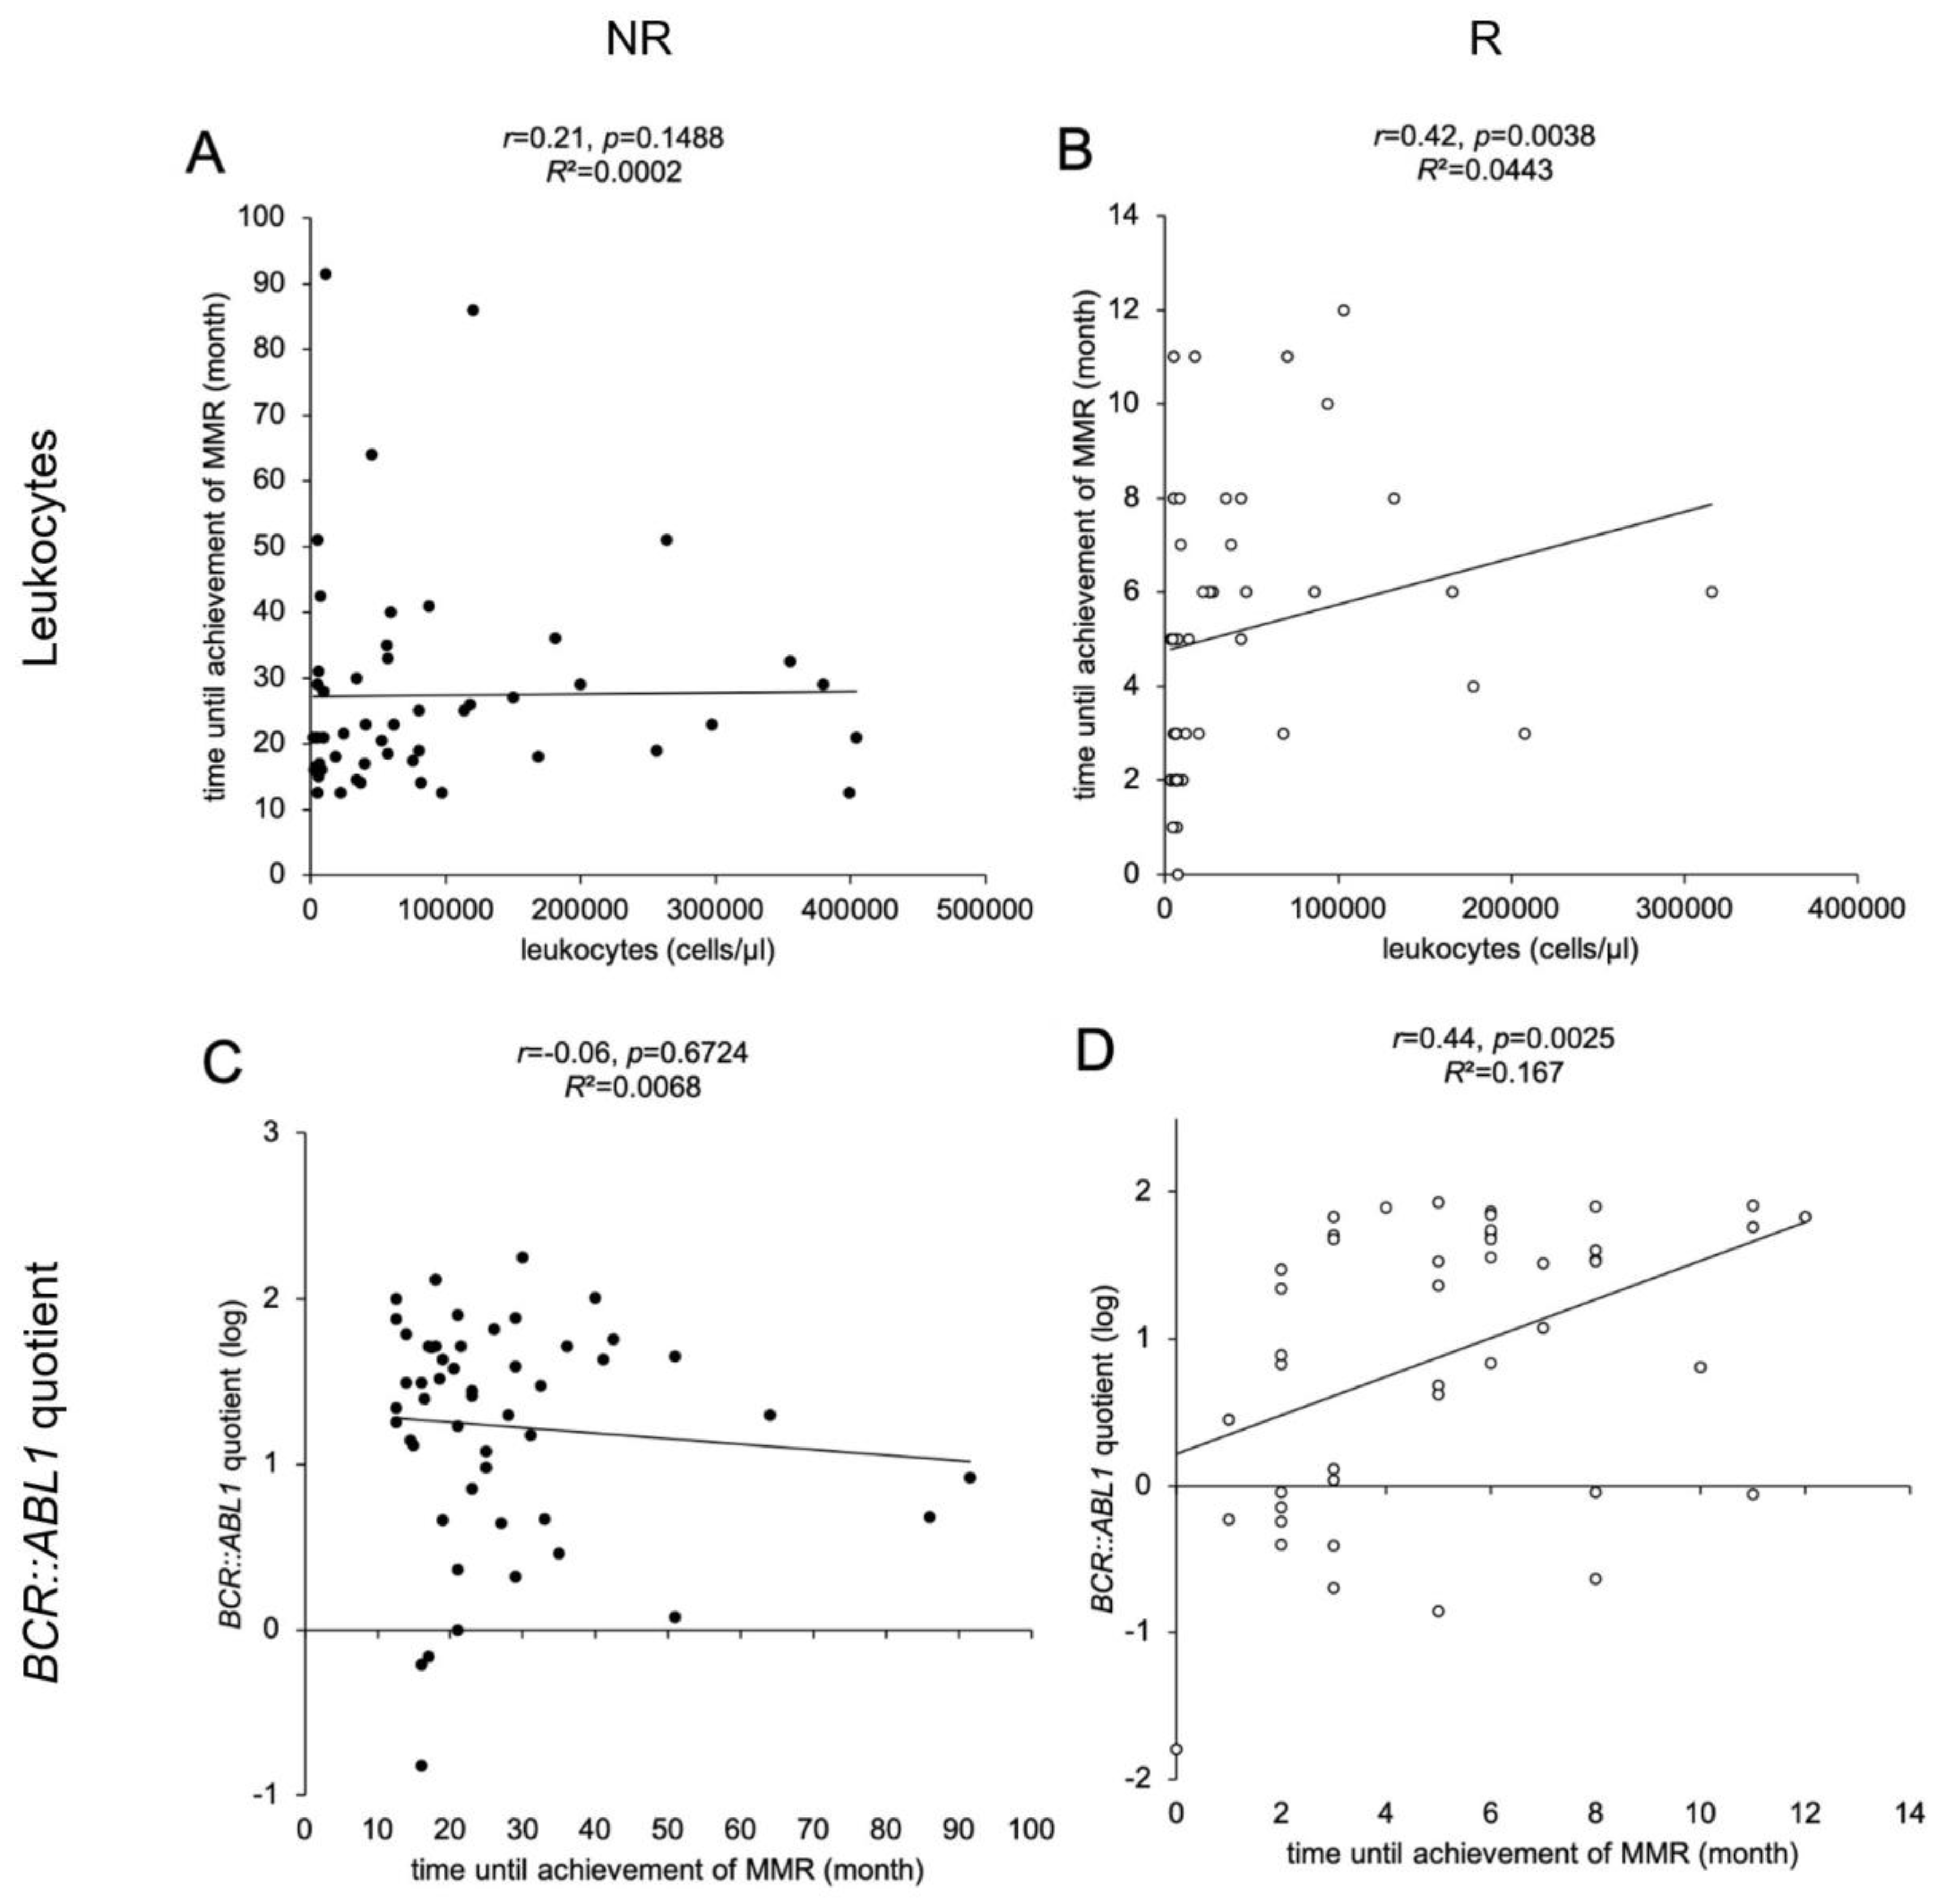
3.5. Leukocyte Counts at Time of ID, BCR::ABL1 Quotients and TKI Therapy Correlate with Time until Achievement of MMR

We observed a significant correlation between the leukocyte count at the time of ID and the time until the achievement of MMR for the NR (Figure 3A) R cohort (p = 0.0038, Figure 3B). A significant linear correlation in the R cohort was found between BCR::ABL1% and the time until the achievement of MMR (p = 0.0025, Figure 3D) but not in the NR cohort (Figure 3C). This indicates that higher leukocyte counts and higher BCR::ABL1 quotients at ID correlate with a slower response to TKI therapy. We further analyzed the 53 (55%) patients receiving monotherapy with nilotinib or imatinib during the first 12 months. We found a significant negative correlation between the time until the achievement of MMR and the choice of TKI therapy in the R cohort (r = −0.46, p = 0.019). No significant relationship between basic parameters (age, gender) and type of BCR::ABL1 gene fusion with the time until the achievement of MMR could be detected.

3.6. Predictable NR Display Lower ESPL1 and PTTG1IP Transcript Levels Compared to Corresponding R

Data comparison between the five predictable NR (patients no. 10, 22, 27, 34, 51, selected according to data shown in Figure 1 and Table 2) and the five fastest R patients (no. 1, 2, 3, 4, 5; compare Table S1) revealed a significantly larger distance (p = 0.0028), lower ESPL1 (p = 0.018) and PTTG1IP (p = 0.0168) transcript levels (higher ΔCt values) and a higher BCR::ABL1 quotient (p = 0.0414) in the NR compared to the fastest R patients (Table 4). Two of the predictable NR never achieved MMR, and one predictable NR achieved MMR within the respective observation period (median 23, range 16 to 91 months), whereas all of the five fastest R achieved MR4 at minimum.

3.7. NR and R Cohort Assignment Concurs with Rate of BCR::ABL1 Decline after 3 Months of TKI Treatment

Recently, the rate of BCR::ABL1 decline at 3 months has been reported as a critical prognostic discriminator of CML patients [10]. In order to check the validity of our NR and R cohorts, we have calculated the rate of BCR::ABL1 decline from baseline (time of ID) with respect to BCR::ABL1%IS load at 3 months resulting in the BCR::ABL1 halving time (in days). As depicted in Table 5, we found that the halving time of the NR cohort (mean 86, range 45–541) differed significantly (p = 0.0176) from that of the R cohort (mean 51, range 45–133). It is to note that for 9 patients of the NR cohort and for 4 patients of the R cohort, increased values were found after 3 months of TKI treatment (maybe due to resistance or bad compliance). For these, doubling times were calculated and listed separately. Here, a trend of increased doubling times for the R cohort (mean 268) was found when compared to the NR cohort (mean 72), pointing to lower proliferation rates of tumor cells within the R cohort.
Our findings concur with the observations of Branford and others that the rate of BCR::ABL1 decline can serve as a critical prognostic discriminator of CML patients after the first 3 months of TKI treatment [10].

4. Discussion

In this study, we demonstrate that the gene expression levels of ESPL1/Separase and two functionally associated genes, PTTG1/Securin and PTTG1IP (Securin interacting protein), can have a predictive value for achievement of MMR under TKI first-line therapy within 12 months for a distinct set of newly diagnosed CML patients. Several lines of evidence point to the beneficial value of gene expression level testing at the time of diagnosis.
First, we found that ESPL1 and PTTG1 are expressed at higher transcript levels in CML patients than in the control group. Furthermore, the observed correlations between the expression levels of ESPL1/PTTG1 and PTTG1/PTTG1IP confirm the state of knowledge about the functional interaction of these proteins on a genetic level also for CML patients [28,37]. This is the first comprehensive examination of transcript levels of ESPL1, PTTG1 and PTTG1IP in CML patients, and the observed overexpression confirms the role of ESPL1 as a surrogate marker of proliferation in CML [38,39]. Our findings further support the hypothesis that increased activity of Separase in CML patients may concur with an altered expression of ESPL1 [21]. Our gene expression data are consistent with diagnostic clinical parameters as higher leukocyte counts and higher BCR::ABL1 quotients at ID are found in the NR cohort and concur with a slow response to therapy. The most plausible explanation for these correlating observations is that CML patients at the time of ID are characterized by more or less severe leucocytosis and display a high proportion of BCR::ABL1 positive peripheral blood cells with high proliferation potential and dysfunctional cell differentiation. Therefore, the higher the tumor load, as indicated by BCR::ABL1%, the longer an administered TKI therapy will take to reduce tumor cell burden to MMR levels (=0.1% BCR::ABL1 IS).
Second, we found a significant correlation between the time until the achievement of MMR and the relative transcript levels of ESPL1, PTTG1 and PTTG1IP in the R cohort. Our results indicate that lower expressions of ESPL1 and PTTG1 at ID (as indicated by high ΔCt values) are associated with a shorter time until the achievement of MMR in the R cohort and hence a better response to TKI therapy. To our knowledge, this is the first report of this correlation in CML patients. These findings are in line with previous observations that linked an overexpression of ESPL1/Separase and PTTG1/Securin to a less favorable tumor classification [24,40]. Valid correlations could not be stated for the NR cohort, most likely due to vastly scattering data (time until the achievement of MMR) within the small cohort (n = 51).
Our results that the observed lower expression levels of ESPL1 and PTTG1 at ID concur with faster response to TKI therapy are not valid for the five predictable NR where an inverse correlation has been found (Table 4). Here, lower ESPL1 and PTTG1IP transcript levels (as indicated by higher ΔCt values) were displayed by the predictable NR (n = 5) when compared to the five fastest R. However, leukocyte counts (trend) and BCR::ABL1% quotient are in line with the respective R and NR overall data set. It is currently unclear what molecular mechanisms or genetic alterations (may be due to genetic predisposition) may be responsible for the unexpected gene expression pattern of the five NR, which can also obviously serve as a marker for MMR prediction. Potential explanations are offered in previous studies indicating a correlation between the downregulation of Separase, polyploidy and the development of different cancer entities [26,41]. Furthermore, one could imagine that a compensatory mechanism that elevates the proteolytic activity of Separase in NR after TKI induced decrease of ESPL1 expression may lead to a delayed response to TKI therapy and a worse course of the disease as assumed recently [39]. On the other hand, depletion of Separase may prevent the segregation of sister chromatids leading to Structural maintenance of chromosomes protein 3 (SMC3) acetylation and a failure in blocking the cell cycle during replication [18]. Resulting in erratic replication rounds would be in line with the higher leukocyte counts and elevated BCR::ABL1 quotients in the predictable NR patients.
For the overall R cohort (Figure 2F), our data correlate high PTTG1IP expression levels (as indicated by low ΔCt values) with fast response to TKI therapy. This is in accordance with the PTTG1IP expression data of the five predictable NR (Table 4) that showed significantly smaller transcript levels than the fastest R. These findings are in line with previous observations linking underexpression of PTTG1IP and a higher expression of Securin with a higher risk in breast cancer patients for a more aggressive progression. Mechanistically, an underexpression of PTTG1IP may result in a missing nuclearization of Securin, leading to aberrant high Securin levels located in the cytoplasma and a lack of proper Separase control [42]. The resulting uncontrolled proteolytic activity of Separase and unscheduled replication rounds would be in line with higher leukocyte counts and elevated BCR::ABL1 quotients observed in the NR patient cohort.
It is unquestionable that TKI therapy regimen, i.e., type of initial TKI, cytoreductive (HU, AraC) or immune-modulating (IFN-alpha) pre-therapies play a considerable role in the time interval until the achievement of MMR. In our study, fewer patients of the R cohort received imatinib as first-line TKI (compare Tables S1 and S2). Additionally, we found a negative correlation in the R cohort between time until the achievement of MMR and choice of TKI with regards to those patients (55% of patients) receiving only imatinib or nilotinib (monotherapies) within the first 12 months after diagnosis. This may indicate that 2nd generation TKIs lead to faster achievement of MMR, congruent with past observations showing that patients receiving first-line nilotinib show better response with higher rates of cytogenetic and molecular remissions [2]. However, due to the high heterogeneity of TKI therapies within the relatively small R and NR cohorts, we cannot make valid statements about the influence of the various TKIs on the predictability of MMR achievement within 12 months of treatment.
One could argue that the accuracy of conventional BCR::ABL1 minimal residual disease assessment may depend on the applied PCR technique as RT-qPCR has been reported as amplifying b3a2 and b2a2 with different performance resulting in underestimation of the e14a2 variant compared to the e13a2 variant [43,44]. Digital PCR (dPCR) may overcome this limit as it is independent of amplicon length. In this study, the diagnostic status “MMR” was assessed according to the international guidelines of Foroni et al. 2011 [45]. The robustness and comparability of the diagnostic data measured here have been repeatedly confirmed by international harmonization trials within the European Treatment and Outcome Study for CML (EUTOS) [46]. Between 2016 and 2021, we have been using cell-based BCR::ABL1 reference panels traceable to the World Health Organization primary reference material to standardize and validate our local laboratory qRT-PCR test system and the corresponding validated conversion factors (CFs) to the International Scale as described previously [35]. Therefore, we consider the influence of the applied method on the observed findings to be negligible.
However, it is to note that the findings of our investigation strongly depend on the qRT-PCR methodology used here. It is conceivable that methods with the potential for higher sensitivity, such as digital PCR (dPCR), may shift the diagnostic log level classification for a minor subset of NR patients. Therefore, the assignment of our patient collective to NR or R is definitely valid only in combination with the RT-qPCR method applied in this investigation.
Third, the prognostic value is the spatial distance of a patient’s data set to a defined centroid (depicted in Figure 1) when ΔCt values of the three genes are arranged in an xyz-coordinate system. Data evaluation can easily be automated and implemented into routine laboratory BCR::ABL1 monitoring algorithms. Since resistance to the initial TKI therapy occurs in 10–15% of patients receiving imatinib and in about 10% of patients receiving therapy with second-generation TKIs as first-line treatment [2], patients could benefit from an improved risk stratification instead of losing valuable time with therapy changes and preventable progression of the disease. Furthermore, the economic burden could be considerably lowered (e.g., in Germany, €48,000–81,000 annually) [47], emotional suffering prevented and compliance with therapy improved.
Recently, TKI response-related dynamic variables, such as the rate of BCR::ABL1, decline at 3 months of TKI treatment was reported as a critical prognostic discriminator of CML patients [2,9,10,11,12]. The calculation of BCR::ABL1 decline rates (halving times) for our NR and R cohorts confirm the observations of Branford and others that the rate of BCR::ABL1 decline can serve as a prognostic discriminator of CML patients after the first 3 months of TKI treatment [10]. However, patients have to undergo 3 months of TKI treatment before prognostic statements can be made. Therefore, a qRT-PCR-based assay that can be applied to patients at the time of ID may be a valuable addition to the existing set of diagnostic tools. This may contribute to a more personalized TKI therapy in CML, albeit the benefit may be limited to 10% of patients.
Despite the poor performance in terms of the separation of overall R and NR cohorts, 10% of the observed NR could have been reliably predicted at the time of diagnosis. At a distance value of 5.9 and with a probability of 75%, an insufficient response to TKI therapy is very likely to advocate for the initiation of more individualized therapy. With increasing distance, it becomes more and more likely to predict a NR since the probability increases by 48% when the distance is increased by one. Accordingly, patients with a distance of 8 display ≥90% probability of MMR failure, which applies to 6% of the observed NR. Thus, a distinct subset of CML patients lacking response to an inadequate TKI therapy could be identified already at the time of diagnosis. On the other hand, with the suggested cut-off at 3, about 37% of therapy failures could already be identified at the time of diagnosis, while less than one-fifth of R would mistakenly be classified as a treatment failure. One could argue that only a rather small portion of all CML patients would benefit from this prediction tool, as for patients with a distance value <5, a safe classification into a response group is not possible. However, the novel distance score could still be used as a tendency indicator of TKI response and a useful tool on the way toward individualized therapy in CML. A prospective controlled and randomized study with larger cohorts should be performed to measure the reliability of the proposed cut-offs and to check the applicability of the qRT-PCR assay in CML routine diagnostics.

5. Conclusions

In conclusion, we have demonstrated that the analysis of ESPL1, PTTG1 and PTTG1IP gene expression levels by qRT-PCR in the peripheral blood of patients at the time of ID can contribute to an early individualized TKI therapy in CML. Our established novel distance (cut-off) score based on ESPL1, PTTG1 and PTTG1IP gene expression levels can serve as a predictor of TKI non-response and a tool in risk stratification of CML patients before initiation of TKI first-line treatment.

Supplementary Materials

The following supporting information can be downloaded at: https://www.mdpi.com/2072-6694/15/9/2652/s1, Table S1: CML patient’s characteristics; Table S2: Statistical data analyses on qRT-PCR data; Table S3: Distribution of therapies; Table S4: CML patients (NR, R cohorts): rate of BCR::ABL1 decline, halving and doubling times after 3 months of TKI treatment; Figure S1: ROC curve for cut-offs of CML samples analyzed.

Author Contributions

Conceptualization, B.S. and W.S.; methodology, E.C., N.N., H.K. and W.S.; software, N.N. and C.W.; validation, B.S., A.F., S.S. and W.S.; formal analysis, C.W.; investigation, E.C. and H.K.; resources, B.S., A.F, S.S., W.-K.H. and W.S.; data curation, E.C. and C.W.; writing—original draft preparation, E.C. and W.S.; writing—review and editing, E.C., W.S., B.S., A.F., W.-K.H., S.S. and W.S.; visualization, E.C. and N.N.; supervision, A.F., S.S., W.-K.H. and W.S.; project administration, W.S. and S.S.; and funding acquisition, W.S. All authors have read and agreed to the published version of the manuscript.

Funding

W.S. received grants from the Deutsche José Carreras Leukämie-Stiftung e.V. (www.carreras-stiftung.de/ (accessed on 4 May 2023), no. 13R/2017) and the Wilhelm Sander-Stiftung (www.wilhelm-sander-stiftung.de/ (accessed on 4 May 2023), no. 2019.021.1). The funders had no role in the study design, data collection and analysis, interpretation of data and in writing the manuscript.

Institutional Review Board Statement

The study was conducted according to the guidelines of the Declaration of Helsinki and approved by the Institutional Review Board (Ethics Committee) of the Medical Faculty Mannheim, Heidelberg University, Germany (# 2016-506N-MA), approved date 22 January 2016.

Informed Consent Statement

Informed consent was obtained from all subjects involved in the study.

Data Availability Statement

All data generated in this study has been included in the published article and/or the respective Supplementary File.

Acknowledgments

The authors would like to thank Katrin Ackermann, Heike Braun, Elena Felde, Carolin Hölting, Susanne Keppler-Gerner and Irina Tarnopolscaia for clinical sample preparation. We are further thankful to our database/IT administrator Norbert Galuschek for LeukDB clinical data mining.

Conflicts of Interest

S.S. has received honoraria from Novartis, BMS, Incyte and Pfizer and research support from Novartis, BMS and Incyte with no influence on the data presented. All other authors declare no conflicts of interest. The funders had no role in the design of the study; in the collection, analyses, or interpretation of data; in the writing of the manuscript, or in the decision to publish the results.

References

  1. Hehlmann, R.; Lauseker, M.; Saussele, S.; Pfirrmann, M.; Krause, S.; Kolb, H.J.; Neubauer, A.; Hossfeld, D.K.; Nerl, C.; Gratwohl, A.; et al. Assessment of imatinib as first-line treatment of chronic myeloid leukemia: 10-year survival results of the randomized CML study IV and impact of non-CML determinants. Leukemia 2017, 31, 2398–2406. [Google Scholar] [CrossRef] [PubMed]
  2. Hochhaus, A.; Baccarani, M.; Silver, R.T.; Schiffer, C.; Apperley, J.F.; Cervantes, F.; Clark, R.E.; Cortes, J.E.; Deininger, M.W.; Guilhot, F.; et al. European LeukemiaNet 2020 recommendations for treating chronic myeloid leukemia. Leukemia 2020, 34, 966–984. [Google Scholar] [CrossRef] [PubMed] [Green Version]
  3. Branford, S.; Fletcher, L.; Cross, N.C.; Muller, M.C.; Hochhaus, A.; Kim, D.W.; Radich, J.P.; Saglio, G.; Pane, F.; Kamel-Reid, S.; et al. Desirable performance characteristics for BCR-ABL measurement on an international reporting scale to allow consistent interpretation of individual patient response and comparison of response rates between clinical trials. Blood 2008, 112, 3330–3338. [Google Scholar] [CrossRef] [PubMed] [Green Version]
  4. Cross, N.C.; White, H.E.; Muller, M.C.; Saglio, G.; Hochhaus, A. Standardized definitions of molecular response in chronic myeloid leukemia. Leukemia 2012, 26, 2172–2175. [Google Scholar] [CrossRef] [PubMed] [Green Version]
  5. Cross, N.C.; White, H.E.; Colomer, D.; Ehrencrona, H.; Foroni, L.; Gottardi, E.; Lange, T.; Lion, T.; Machova Polakova, K.; Dulucq, S.; et al. Laboratory recommendations for scoring deep molecular responses following treatment for chronic myeloid leukemia. Leukemia 2015, 29, 999–1003. [Google Scholar] [CrossRef] [PubMed] [Green Version]
  6. Druker, B.J.; Guilhot, F.; O’Brien, S.G.; Gathmann, I.; Kantarjian, H.; Gattermann, N.; Deininger, M.W.; Silver, R.T.; Goldman, J.M.; Stone, R.M.; et al. Five-year follow-up of patients receiving imatinib for chronic myeloid leukemia. N. Engl. J. Med. 2006, 355, 2408–2417. [Google Scholar] [CrossRef] [PubMed]
  7. Baccarani, M.; Castagnetti, F.; Gugliotta, G.; Rosti, G. A review of the European LeukemiaNet recommendations for the management of CML. Ann. Hematol. 2015, 94 (Suppl. S2), S141–S147. [Google Scholar] [CrossRef]
  8. Guilhot, J.; Preudhomme, C.; Mahon, F.X.; Guilhot, F. Analyzing molecular response in chronic myeloid leukemia clinical trials: Pitfalls and golden rules. Cancer 2015, 121, 490–497. [Google Scholar] [CrossRef]
  9. Wolf, D.; Sopper, S. Molecular response prediction in CML: Novel ideas? Oncotarget 2017, 8, 80105–80106. [Google Scholar] [CrossRef]
  10. Branford, S.; Yeung, D.T.; Parker, W.T.; Roberts, N.D.; Purins, L.; Braley, J.A.; Altamura, H.K.; Yeoman, A.L.; Georgievski, J.; Jamison, B.A.; et al. Prognosis for patients with CML and >10% BCR-ABL1 after 3 months of imatinib depends on the rate of BCR-ABL1 decline. Blood 2014, 124, 511–518. [Google Scholar] [CrossRef] [Green Version]
  11. Breccia, M.; Molica, M.; Colafigli, G.; Massaro, F.; Alimena, G. Early molecular response in chronic myeloid leukemia and halving time: Latest evidences. Leuk. Res. 2016, 48, 20–25. [Google Scholar] [CrossRef] [PubMed]
  12. Glauche, I.; Kuhn, M.; Baldow, C.; Schulze, P.; Rothe, T.; Liebscher, H.; Roy, A.; Wang, X.; Roeder, I. Quantitative prediction of long-term molecular response in TKI-treated CML—Lessons from an imatinib versus dasatinib comparison. Sci. Rep. 2018, 8, 12330. [Google Scholar] [CrossRef] [PubMed] [Green Version]
  13. Spiess, B.; Kleiner, H.; Flach, J.; Fabarius, A.; Saussele, S.; Hofmann, W.K.; Seifarth, W. Separase activity distribution can be a marker of major molecular response and proliferation of CD34(+) cells in TKI-treated chronic myeloid leukemia patients. Ann. Hematol. 2020, 99, 991–1006. [Google Scholar] [CrossRef] [PubMed] [Green Version]
  14. Chestukhin, A.; Pfeffer, C.; Milligan, S.; DeCaprio, J.A.; Pellman, D. Processing, localization, and requirement of human separase for normal anaphase progression. Proc. Natl. Acad. Sci. USA 2003, 100, 4574–4579. [Google Scholar] [CrossRef] [Green Version]
  15. Schockel, L.; Mockel, M.; Mayer, B.; Boos, D.; Stemmann, O. Cleavage of cohesin rings coordinates the separation of centrioles and chromatids. Nat. Cell. Biol. 2011, 13, 966–972. [Google Scholar] [CrossRef]
  16. Leeke, B.; Marsman, J.; O’Sullivan, J.M.; Horsfield, J.A. Cohesin mutations in myeloid malignancies: Underlying mechanisms. Exp. Hematol. Oncol. 2014, 3, 13. [Google Scholar] [CrossRef] [Green Version]
  17. McAleenan, A.; Clemente-Blanco, A.; Cordon-Preciado, V.; Sen, N.; Esteras, M.; Jarmuz, A.; Aragon, L. Post-replicative repair involves separase-dependent removal of the kleisin subunit of cohesin. Nature 2013, 493, 250–254. [Google Scholar] [CrossRef]
  18. Cucco, F.; Palumbo, E.; Camerini, S.; D’Alessio, B.; Quarantotti, V.; Casella, M.L.; Rizzo, I.M.; Cukrov, D.; Delia, D.; Russo, A.; et al. Separase prevents genomic instability by controlling replication fork speed. Nucleic Acids Res. 2018, 46, 267–278. [Google Scholar] [CrossRef] [Green Version]
  19. Hellmuth, S.; Gutierrez-Caballero, C.; Llano, E.; Pendas, A.M.; Stemmann, O. Local activation of mammalian separase in interphase promotes double-strand break repair and prevents oncogenic transformation. EMBO J. 2018, 37, e99184. [Google Scholar] [CrossRef]
  20. Zhang, N.; Ge, G.; Meyer, R.; Sethi, S.; Basu, D.; Pradhan, S.; Zhao, Y.J.; Li, X.N.; Cai, W.W.; El-Naggar, A.K.; et al. Overexpression of Separase induces aneuploidy and mammary tumorigenesis. Proc. Natl. Acad. Sci. USA 2008, 105, 13033–13038. [Google Scholar] [CrossRef] [Green Version]
  21. Haass, W.; Kleiner, H.; Weiss, C.; Haferlach, C.; Schlegelberger, B.; Muller, M.C.; Hehlmann, R.; Hofmann, W.K.; Fabarius, A.; Seifarth, W.; et al. Clonal Evolution and Blast Crisis Correlate with Enhanced Proteolytic Activity of Separase in BCR-ABL b3a2 Fusion Type CML under Imatinib Therapy. PLoS ONE 2015, 10, e0129648. [Google Scholar] [CrossRef] [PubMed]
  22. Mukherjee, M.; Ge, G.; Zhang, N.; Huang, E.; Nakamura, L.V.; Minor, M.; Fofanov, V.; Rao, P.H.; Herron, A.; Pati, D. Separase loss of function cooperates with the loss of p53 in the initiation and progression of T- and B-cell lymphoma, leukemia and aneuploidy in mice. PLoS ONE 2011, 6, e22167. [Google Scholar] [CrossRef] [PubMed] [Green Version]
  23. Pati, D. Oncogenic activity of separase. Cell Cycle 2008, 7, 3481–3482. [Google Scholar] [CrossRef] [PubMed]
  24. Meyer, R.; Fofanov, V.; Panigrahi, A.; Merchant, F.; Zhang, N.; Pati, D. Overexpression and mislocalization of the chromosomal segregation protein separase in multiple human cancers. Clin. Cancer Res. 2009, 15, 2703–2710. [Google Scholar] [CrossRef] [Green Version]
  25. Uhlmann, F. Secured cutting: Controlling separase at the metaphase to anaphase transition. EMBO Rep. 2001, 2, 487–492. [Google Scholar] [CrossRef] [Green Version]
  26. Waizenegger, I.; Gimenez-Abian, J.F.; Wernic, D.; Peters, J.M. Regulation of human separase by securin binding and autocleavage. Curr. Biol. 2002, 12, 1368–1378. [Google Scholar] [CrossRef] [Green Version]
  27. Holland, A.J.; Taylor, S.S. Cyclin-B1-mediated inhibition of excess separase is required for timely chromosome disjunction. J. Cell Sci. 2006, 119, 3325–3336. [Google Scholar] [CrossRef] [Green Version]
  28. Hornig, N.C.; Knowles, P.P.; McDonald, N.Q.; Uhlmann, F. The dual mechanism of separase regulation by securin. Curr. Biol. 2002, 12, 973–982. [Google Scholar] [CrossRef] [Green Version]
  29. Vlotides, G.; Eigler, T.; Melmed, S. Pituitary tumor-transforming gene: Physiology and implications for tumorigenesis. Endocr. Rev. 2007, 28, 165–186. [Google Scholar] [CrossRef] [Green Version]
  30. Agircan, F.G.; Schiebel, E. Sensors at centrosomes reveal determinants of local separase activity. PLoS Genet. 2014, 10, e1004672. [Google Scholar] [CrossRef] [Green Version]
  31. Imruetaicharoenchoke, W.; Fletcher, A.; Lu, W.; Watkins, R.J.; Modasia, B.; Poole, V.L.; Nieto, H.R.; Thompson, R.J.; Boelaert, K.; Read, M.L.; et al. Functional consequences of the first reported mutations of the proto-oncogene PTTG1IP/PBF. Endocr. Relat. Cancer 2017, 24, 459–474. [Google Scholar] [CrossRef] [PubMed] [Green Version]
  32. Read, M.L.; Seed, R.I.; Fong, J.C.; Modasia, B.; Ryan, G.A.; Watkins, R.J.; Gagliano, T.; Smith, V.E.; Stratford, A.L.; Kwan, P.K.; et al. The PTTG1-binding factor (PBF/PTTG1IP) regulates p53 activity in thyroid cells. Endocrinology 2014, 155, 1222–1234. [Google Scholar] [CrossRef] [Green Version]
  33. Cross, N.C.; Feng, L.; Bungey, J.; Goldman, J.M. Minimal residual disease after bone marrow transplant for chronic myeloid leukaemia detected by the polymerase chain reaction. Leuk. Lymphoma 1993, 11 (Suppl. S1), 39–43. [Google Scholar] [CrossRef] [PubMed]
  34. Emig, M.; Saussele, S.; Wittor, H.; Weisser, A.; Reiter, A.; Willer, A.; Berger, U.; Hehlmann, R.; Cross, N.C.; Hochhaus, A. Accurate and rapid analysis of residual disease in patients with CML using specific fluorescent hybridization probes for real time quantitative RT-PCR. Leukemia 1999, 13, 1825–1832. [Google Scholar] [CrossRef] [PubMed] [Green Version]
  35. Spiess, B.; Rinaldetti, S.; Naumann, N.; Galuschek, N.; Kossak-Roth, U.; Wuchter, P.; Tarnopolscaia, I.; Rose, D.; Voskanyan, A.; Fabarius, A.; et al. Diagnostic performance of the molecular BCR-ABL1 monitoring system may impact on inclusion of CML patients in stopping trials. PLoS ONE 2019, 14, e0214305. [Google Scholar] [CrossRef]
  36. Livak, K.J.; Schmittgen, T.D. Analysis of relative gene expression data using real-time quantitative PCR and the 2(-Delta Delta C(T)) Method. Methods 2001, 25, 402–408. [Google Scholar] [CrossRef]
  37. Yu, H.; Wang, L.; Chen, D.; Li, J.; Guo, Y. Conditional transcriptional relationships may serve as cancer prognostic markers. BMC Med. Genom. 2021, 14, 101. [Google Scholar] [CrossRef]
  38. Smahelova, J.; Kastankova, I.; Polakova, K.M.; Klamova, H.; Zemanova, K.; Tachezy, R.; Hamsikova, E.; Smahel, M. Expression of genes encoding centrosomal proteins and the humoral response against these proteins in chronic myeloid leukemia. Oncol. Rep. 2017, 37, 547–554. [Google Scholar] [CrossRef] [Green Version]
  39. Haass, W.; Stehle, M.; Nittka, S.; Giehl, M.; Schrotz-King, P.; Fabarius, A.; Hofmann, W.K.; Seifarth, W. The proteolytic activity of separase in BCR-ABL-positive cells is increased by imatinib. PLoS ONE 2012, 7, e42863. [Google Scholar] [CrossRef]
  40. Noll, J.E.; Vandyke, K.; Hewett, D.R.; Mrozik, K.M.; Bala, R.J.; Williams, S.A.; Kok, C.H.; Zannettino, A.C. PTTG1 expression is associated with hyperproliferative disease and poor prognosis in multiple myeloma. J. Hematol. Oncol. 2015, 8, 106. [Google Scholar] [CrossRef] [Green Version]
  41. Xu, J.; Wang, M.; Gao, X.; Hu, B.; Du, Y.; Zhou, J.; Tian, X.; Huang, X. Separase phosphosite mutation leads to genome instability and primordial germ cell depletion during oogenesis. PLoS ONE 2011, 6, e18763. [Google Scholar] [CrossRef] [PubMed] [Green Version]
  42. Repo, H.; Gurvits, N.; Loyttyniemi, E.; Nykanen, M.; Lintunen, M.; Karra, H.; Kurki, S.; Kuopio, T.; Talvinen, K.; Soderstrom, M.; et al. PTTG1-interacting protein (PTTG1IP/PBF) predicts breast cancer survival. BMC Cancer 2017, 17, 705. [Google Scholar] [CrossRef] [PubMed] [Green Version]
  43. Kjaer, L.; Skov, V.; Andersen, M.T.; Aggerholm, A.; Clair, P.; Gniot, M.; Soeby, K.; Udby, L.; Dorff, M.H.; Hasselbalch, H.; et al. Variant-specific discrepancy when quantitating BCR-ABL1 e13a2 and e14a2 transcripts using the Europe Against Cancer qPCR assay. Eur. J. Haematol. 2019, 103, 26–34. [Google Scholar] [CrossRef]
  44. Bernardi, S.; Bonifacio, M.; Iurlo, A.; Zanaglio, C.; Tiribelli, M.; Binotto, G.; Abruzzese, E.; Russo, D. “Variant-specific discrepancy when quantitating BCR-ABL1 e13a2 and e14a2 transcripts using the Europe Against Cancer qPCR assay.” Is dPCR the key? Eur. J. Haematol. 2019, 103, 272–273. [Google Scholar] [CrossRef] [Green Version]
  45. Foroni, L.; Wilson, G.; Gerrard, G.; Mason, J.; Grimwade, D.; White, H.E.; de Castro, D.G.; Austin, S.; Awan, A.; Burt, E.; et al. Guidelines for the measurement of BCR-ABL1 transcripts in chronic myeloid leukaemia. Br. J. Haematol. 2011, 153, 179–190. [Google Scholar] [CrossRef] [PubMed]
  46. White, H.E.; Salmon, M.; Albano, F.; Andersen, C.S.A.; Balabanov, S.; Balatzenko, G.; Barbany, G.; Cayuela, J.M.; Cerveira, N.; Cochaux, P.; et al. Standardization of molecular monitoring of CML: Results and recommendations from the European treatment and outcome study. Leukemia 2022, 36, 1834–1842. [Google Scholar] [CrossRef]
  47. Experts in Chronic Myeloid, L. The price of drugs for chronic myeloid leukemia (CML) is a reflection of the unsustainable prices of cancer drugs: From the perspective of a large group of CML experts. Blood 2013, 121, 4439–4442. [Google Scholar] [CrossRef] [Green Version]
Figure 1. 3D scatter plot illustration of 148 analyzed samples. Relative transcript level data (ΔCt values) of the genes ESPL1 (x-axis), PTTG1 (y-axis) and PTTG1IP (z-axis) was arranged in the three-dimensional room with a center for healthy controls (blue, n = 51) and a common center for CML R (green, n = 46) and NR samples (red, n = 51). Logistic regression and analysis of maximum likelihood estimates revealed a positive correlation of distance with MMR failure (p = 0.0388, odds ratio 1.479, 95% Wald confidence limits: 1.020 to 2.143). The ellipsoid in grey symbolizes the cut-off (distance) of 5.9180; then, the test reached 100% specificity, as outlined in Table 2. Therefore, about 10% (5 of 51) of the NR samples could have been predicted correctly at the time of ID. The first numbers refer to the patient data in Supplementary Table S1, and the numbers in brackets refer to Table 2. Statistical analysis: the MEANS, TTEST (Satterthwaite approximation), and LOGISTIC (Fisher’s scoring, Wald testing) procedures used SAS Version 9.4.
Cancers 15 02652 g001
Figure 2. Correlations of ESPL1, PTTG1 and PTTG1IP expression levels with time until the achievement of MMR in CML patients. Scatter plot illustrations of 97 analyzed samples (non-responders (NR) as black dots, n = 51, (A,C,E); responders (R) as white dots, n = 46, (B,D,F)). The illustrations show the association between time until the achievement of MMR (y-axis in A-F) in CML patients with the calculated ΔCt values that serve as a measure of relative gene expressions of ESPL1/Separase (x-axis; (A,B)), PTTG1/Securin (x-axis; (C,D)), PTTG1IP (x-axis; (E,F)). It is noted that the ΔCt values are inversely correlated to the respective real transcript levels. Each data point in the illustration represents the mean ΔCt value of triplicate measurements. Time until the achievement of MMR was derived from the patient database (LeukDB) of the laboratory for leukemia diagnostics of the III. Medical University Clinic Mannheim. Statistical analysis: MEANS, Spearman correlation coefficient, effect size r, and coefficient of determination R2.
Cancers 15 02652 g002
Figure 3. Correlations of leukocyte counts and BCR::ABL1 quotients with time until the achievement of MMR in CML patients. Scatter plot illustrations of 97 analyzed samples (non-responders (NR) as black dots, n = 51, (A,C)); responders (R) as white dots, n = 46, (B,D)). The illustrations show the association between time until the achievement of MMR (y-axis in A, B; x-axis in (C,D)) in CML patients with leukocytes at ID (x-axis; (A,B)) and BCR::ABL1 quotient at ID (y-axis; (C,D)). Each data point in the illustration represents one examined patient. Time until the achievement of MMR, leukocyte count at ID and BCR::ABL1 quotient were derived from the patient database (LeukDB) of the laboratory for leukemia diagnostics of the III. Medical University Clinic Mannheim. Statistical analysis: MEANS, Spearman correlation coefficient, effect size r, and coefficient of determination R2.
Cancers 15 02652 g003
Table 1. ANOVA and pairwise testing for relative transcript levels (ΔCt values) of ESPL1, PTTG1 and PTTG1IP within the R, NR and control groups.
ANOVAESPL1PTTG1PTTG1IP
globalp < 0.0001p = 0.0036p = 0.1736
controls vs. NR *p < 0.0001p = 0.0127-
controls vs. R *p = 0.0061p = 0.0167-
NR vs. R *p = 0.3910p = 0.9998-
* Post-hoc pairwise testing according to Scheffé.
Table 2. Cut-offs (distances), sensitivities and specificities for CML samples tested (n = 97).
Sample No.SensitivitySpecificitySumCut-Off
11010.549594
210.0217391.0217390.633119
310.0434781.0434780.750284
410.0652171.0652170.773095
510.0869571.0869570.951466
610.1086961.1086960.980357
70.9803920.1086961.0890881.150964
80.9607840.1086961.069481.156968
90.9607840.1304351.0912191.162309
100.9607840.1521741.1129581.17719
110.9411760.1521741.093351.244523
120.9215690.1521741.0737431.335997
130.9019610.1521741.0541351.355251
140.8823530.1521741.0345271.441234
150.8823530.1739131.0562661.488975
160.8627450.1739131.0366581.534161
170.8431370.1739131.017051.601827
180.8235290.1739130.9974421.605338
190.8235290.1956521.0191821.61878
200.8235290.2173911.0409211.637496
210.8039220.2173911.0213131.647798
220.8039220.239131.0430521.652854
230.7843140.239131.0234441.708054
240.7647060.239131.0038361.757046
250.7647060.260871.0255751.793212
260.7450980.260871.0059681.793669
270.725490.260870.986361.79974
280.7058820.260870.9667521.810044
290.7058820.2826090.9884911.840533
300.6862750.2826090.9688831.864345
310.6862750.3043480.9906221.95028
320.6666670.3043480.9710141.964042
330.6666670.3260870.9927542.015026
340.6666670.3478261.0144932.039745
350.6470590.3478260.9948852.042153
360.6274510.3478260.9752772.05187
370.6274510.3695650.9970162.057197
380.6078430.3695650.9774082.069368
390.6078430.3913040.9991472.085874
400.5882350.3913040.979542.096926
410.5686270.3913040.9599322.122027
420.5686270.4130430.9816712.124711
430.5686270.4347831.003412.180675
440.5686270.4565221.0251492.189591
450.549020.4565221.0055412.195555
460.549020.4782611.027282.20937
470.549020.51.049022.277969
480.549020.5217391.0707592.283053
490.549020.5434781.0924982.316287
500.549020.5652171.1142372.358355
510.549020.5869571.1359762.363681
520.5294120.5869571.1163682.376338
530.5098040.5869571.096762.405917
540.5098040.6086961.11852.429324
550.5098040.6304351.1402392.444764
560.5098040.6521741.1619782.456408
570.5098040.6739131.1837172.465865
580.4901960.6739131.1641092.469809
590.4705880.6739131.1445012.516639
600.450980.6739131.1248932.564055
610.450980.6956521.1466332.565945
620.450980.7173911.1683722.611456
630.4313730.7173911.1487642.678705
640.4313730.739131.1705032.710391
650.4313730.760871.1922422.73141
660.4117650.760871.1726342.771444
670.3921570.760871.1530262.799222
680.3921570.7826091.1747662.815116
690.3921570.8043481.1965052.85643
700.3921570.8260871.2182442.860967
710.3725490.8260871.1986362.880366
72 *0.3725490.8478261.2203753.021803
730.3529410.8478261.2007673.028484
740.3333330.8478261.1811593.061431
750.3137250.8478261.1615523.115181
760.3137250.8695651.1832913.149723
770.3137250.8913041.205033.156747
780.2941180.8913041.1854223.205288
790.274510.8913041.1658143.209935
800.274510.9130431.1875533.334363
810.2549020.9130431.1679453.347152
820.2352940.9130431.1483383.452303
830.2352940.9347831.1700773.481048
840.2156860.9347831.1504693.481381
850.2156860.9565221.1722083.547112
860.2156860.9782611.1939473.579134
870.1960780.9782611.1743393.624489
880.1764710.9782611.1547313.698418
890.1568630.9782611.1351243.789116
900.1372550.9782611.1155163.802186
910.1176470.9782611.0959084.781442
920.0980390.9782611.07635.099709
93 **0.09803911.0980395.917999
940.07843111.0784316.435286
950.05882411.0588248.635014
960.03921611.0392169.944185
970.01960811.01960810.28212
* Best cut-off is reached when the sum of specificity and sensitivity reaches a maximum. ** For samples with cut-offs ≥5.9180, the specificity is 100%.
Table 3. Analyses of variance of basic and clinical parameters in CML R vs. NR patients (n = 97).
ParameterTestp-Value
Aget-test0.873
SexChi2-test0.990
Time until achievement of MMRU-test<0.001
Leukocyte count at IDU-test0.018
BCR::ABL1 gene fusion typeFisher-test0.487
BCR::ABL1 quotientU-test0.067
BCR::ABL1 quotient IS *U-test0.173
Proportion of imatinib to administered TKIsU-test0.007
* BCR::ABL1%IS values only available for BCR::ABL1 < 10% (n = 37).
Table 4. Comparison of the predictable NR (n = 5) vs. the fastest R patients (n = 5).
NRRp-Values
Distance *8.42 ± 1.992.47 ± 0.180.0028
ΔCt ** ESPL18.48 ± 1.176.52 ± 0.250.018
ΔCt ** PTTG16.26 ± 3.263.97 ± 0.570.1936
ΔCt ** PTTG1IP7.89 ± 3.821.32 ± 0.840.0168
Leukocytes (cells/μL)19760 ± 233027180 ± 20970.2946
BCR::ABL1 quotient (%)14.29 ± 10.160.88 ± 1.100.0414
* To common centroid of CML patients (NR and R). ** High ΔCt values mean low real transcript levels.
Table 5. Rates of BCR::ABL1 decline (halving time) at 3 months after TKI treatment for NR (n = 49) and R (n = 45) cohorts.
NR (n = 49) R (n = 45)
Halving Time (Days) *
3 M (n = 40)
Doubling Time (Days) * 3 M (n = 9)Halving Time (Days) *
3 M (n = 41)
Doubling Time (Days) *
3 M (n = 4)
Mean86 ± 8772 ± 5551 ± 18268 ± 280
Median555245223
Min45114526
Max541186133600
Range49617588574
* See Supplementary Table S4 for raw data and sample selection.
Disclaimer/Publisher’s Note: The statements, opinions and data contained in all publications are solely those of the individual author(s) and contributor(s) and not of MDPI and/or the editor(s). MDPI and/or the editor(s) disclaim responsibility for any injury to people or property resulting from any ideas, methods, instructions or products referred to in the content.

