Article

Alterations in Natural Killer Cells in Colorectal Cancer Patients with Stroma AReactive Invasion Front Areas (SARIFA)

1
Pathology, Faculty of Medicine, University of Augsburg, 86156 Augsburg, Germany
2
General and Visceral Surgery, Faculty of Medicine, University of Augsburg, 86156 Augsburg, Germany
3
Gastroenterology, Faculty of Medicine, University of Augsburg, 86156 Augsburg, Germany
4
Hematology and Oncology, Faculty of Medicine, University of Augsburg, 86156 Augsburg, Germany
*
Author to whom correspondence should be addressed.
These authors contributed equally to this work.
Cancers 2023, 15(3), 994; https://doi.org/10.3390/cancers15030994
Submission received: 25 December 2022 / Revised: 22 January 2023 / Accepted: 2 February 2023 / Published: 3 February 2023
(This article belongs to the Special Issue Natural Killer Cells in Cancer Biology and Therapy)

Abstract

:

Simple Summary

Our group recently presented Stroma AReactive Invasion Front Areas (SARIFA) as an independent prognostic biomarker for a poorer outcome in different gastrointestinal cancers, including colon cancer. We hypothesized that the lack of desmoplastic and inflammatory reactions in these carcinomas is based on immunologic alterations. To elucidate this phenomenon, we characterized the peripheral blood lymphocyte subsets and some parts of the local immune responses in colorectal cancer (CRC) patients, in relation to their SARIFA status. Through this, we could observe significant differences between SARIFA-positive and SARIFA-negative CRCs, especially with respect to natural killer (NK) cells. Modifying immune responses by using immunotherapy is already present in clinical routines. Therefore, understanding the basis of SARIFA is crucial for therapeutic strategies, specifically exploiting this new biomarker in CRC patients. This study reveals NK cells as potentially key players in this context, and they should be further investigated.

Abstract

Background: Recently, our group introduced Stroma AReactive Invasion Front Areas (SARIFA) as an independent prognostic predictor for a poorer outcome in colon cancer patients, which is probably based on immunologic alterations combined with a direct tumor-adipocyte interaction: the two together reflecting a distinct tumor biology. Considering it is already known that peripheral immune cells are altered in colorectal cancer (CRC) patients, this study aims to investigate the changes in lymphocyte subsets in SARIFA-positive cases and correlate these changes with the local immune response. Methods: Flow cytometry was performed to analyze B, T, and natural killer (NK) cells in the peripheral blood (PB) of 45 CRC patients. Consecutively, lymphocytes in PB, tumor-infiltrating lymphocytes (TILs), and CD56+ and CD57+ lymphocytes at the invasion front and the tumor center were compared between patients with SARIFA-positive and SARIFA-negative CRCs. Results: Whereas no differences could be observed regarding most PB lymphocyte populations as well as TILs, NK cells were dramatically reduced in the PB of SARIFA-positive cases. Moreover, CD56 and CD57 immunohistochemistry suggested SARIFA-status-dependent changes regarding NK cells and NK-like lymphocytes in the tumor microenvironment. Conclusion: This study proves that our newly introduced biomarker, SARIFA, comes along with distinct immunologic alterations, especially regarding NK cells.

1. Introduction

With more than 900,000 deaths annually in 2020, colorectal cancer (CRC) contributes extensively to the burden of diseases globally [1].
Even though the five-year survival rate of CRC patients is 90% when diagnosed at an early stage, this rate rapidly decreases to 13% for those diagnosed later and reaching stage IV [2].
There are multiple approaches for predicting the outcome of CRC patients, in addition to the initial stage of diagnosis. One of them, the Immunoscore [3], which considers the amount of CD8+ and CD3+ lymphocytes at both the invasive front and central tumor parts of CRCs, has been extensively validated as a prognostic biomarker for CRC [4]. Although focusing on CD8+ and CD3+ cells in the context of IO (immune-oncology) therapy seems logical and useful, it is well known that the immune contexture of a tumor comprises many other cell types beyond CD8+ and CD3+ populations, which have potential prognostic and even predictive relevance too [5]. Therefore, many other immune cells, such as regulatory T cells (Tregs) [6], monocytes [7,8], and tumor-associated macrophages (TAMs) [9,10,11], have been shown to play a role in the progression of CRC and the outcomes of CRC patients.
Recently, our group [12] as well as other research groups [13,14] have been able to show that CRC patients exhibit alterations regarding their lymphocyte subsets in their peripheral blood. In addition, we demonstrated that these circulating lymphocytes, to some extent, even reflect the local antitumor immune response [15].
Additionally, our group recently introduced Stroma AReactive Invasion Front Areas (SARIFAs) as independent negative prognostic biomarkers in colon cancer and gastric cancer (GC) patients, which comes along with a direct tumor-promoting tumor-adipocyte interaction [16,17]. Moreover, we provided the first evidence for a specific metabolic interaction between adipocytes and tumor cells in the context of SARIFAs using digital spatial profiling (DSP) [17], which adds up to the already known important role of lipids and adipocytes in tumor progression [18]. Notably, Wulczyn et al. independently identified a morphologically very similar phenomenon (tumor cell clusters adjacent to fat tissue, here called “tumor adipose feature (TAF)”), using a deep learning approach [19], which was also associated with lower survival. Just recently, Foersch et al. similarly identified tumor cell/adipocyte co-localization as a so-far underappreciated morphological feature, which has an influence on the prognosis of CRC patients, by deploying Guided Grad-Cam images [20].
Compared to many other histomorphological or molecular features of CRCs, which have been established to guide therapeutic decisions, such as tumor budding [21], tumor deposits [22], consensus molecular subtypes [23], microsatellite status [24], and EGFR- or BRAF-mutation status, SARIFA does not need any further expensive testing and provides an extremely low interobserver variability [16,17]; thus, it is easy to implement into the diagnostic workflow. Furthermore, it is already known that adipocytes located next to cancer cells can promote tumor growth – for example, by providing energy for the cancer cells [25].
Now considering, in addition to our own results, the numerous, experimental studies on the major role of adipocytes and lipids in cancer [18], it is very likely that our hematoxylin-eosin (H&E) based SARIFA classification represents the morphological correlate of a certain aggressive tumor biology. Moreover, we believe this specific tumor biology is characterized by not only metabolic but also immunologic alterations. Utilizing the analyses of a previous study [15], we investigated the composition of peripheral blood lymphocytes and tumor-infiltrating lymphocytes (TILs), in relation to the SARIFA status.
Thus, this study connects two research approaches that we have previously considered separately by (i) analyzing the composition of peripheral blood lymphocytes in healthy controls vs. SARIFA-positive vs. SARIFA-negative CRC cases via flow cytometry; (ii) correlating our findings in the peripheral blood with local immune processes specifically at the invasion front (IF, SARIFA, and non-SARIFA) of the primary tumors via conventional immunohistochemistry (IHC).

2. Materials and Methods

2.1. Patient Cohort, Trial Design, and Ethical Approval

Our study cohort consisted of 45 patients diagnosed with CRC and treated by surgery, in addition to 27 healthy controls (healthy controls’ age; median: 55 (range: 49–61); healthy controls vs. SARIFA-negative, p = 0.038; healthy controls vs. SARIFA-positive, not significant at p < 0.05; healthy controls: male/female-ratio: 13/14). The control group composed of healthy blood donors from the blood bank of University Hospital Augsburg (Bavaria, Germany), which had been aged-matched in the best possible method and were also partly used in one of our previous publications [12]. According to the national guidelines for blood donation, our healthy controls had been routinely tested to exclude any acute or chronic diseases. CRC patients’ characteristics are displayed in Table 1. Patient inclusion took place at the University Hospital Augsburg over a two-year period (between December 2018 and November 2020). Previous investigations on the same prospective CRC cohort have also been published by us [12,15]. None of the patients received neoadjuvant treatment. Patients with confounding factors with a direct influence on the immune system, such as acute/chronic infectious diseases, immunodeficiency (inherited or acquired), and autoimmune disorders were excluded. The diagnosis of secondary tumors was also an exclusion criterion. Although operative treatment was scheduled according to guidelines for tumor stages UICC I–III, a small number of patients with a so-far unknown UICC stage IV prior to surgery were also included in the study. Our study was approved by the ethical committee of Ludwig Maximilian University of Munich (reference: Project number 18-726). It was also performed in accordance with the Declaration of Helsinki. Prior to inclusion, all patients consented to study enrollment by written informed consent.

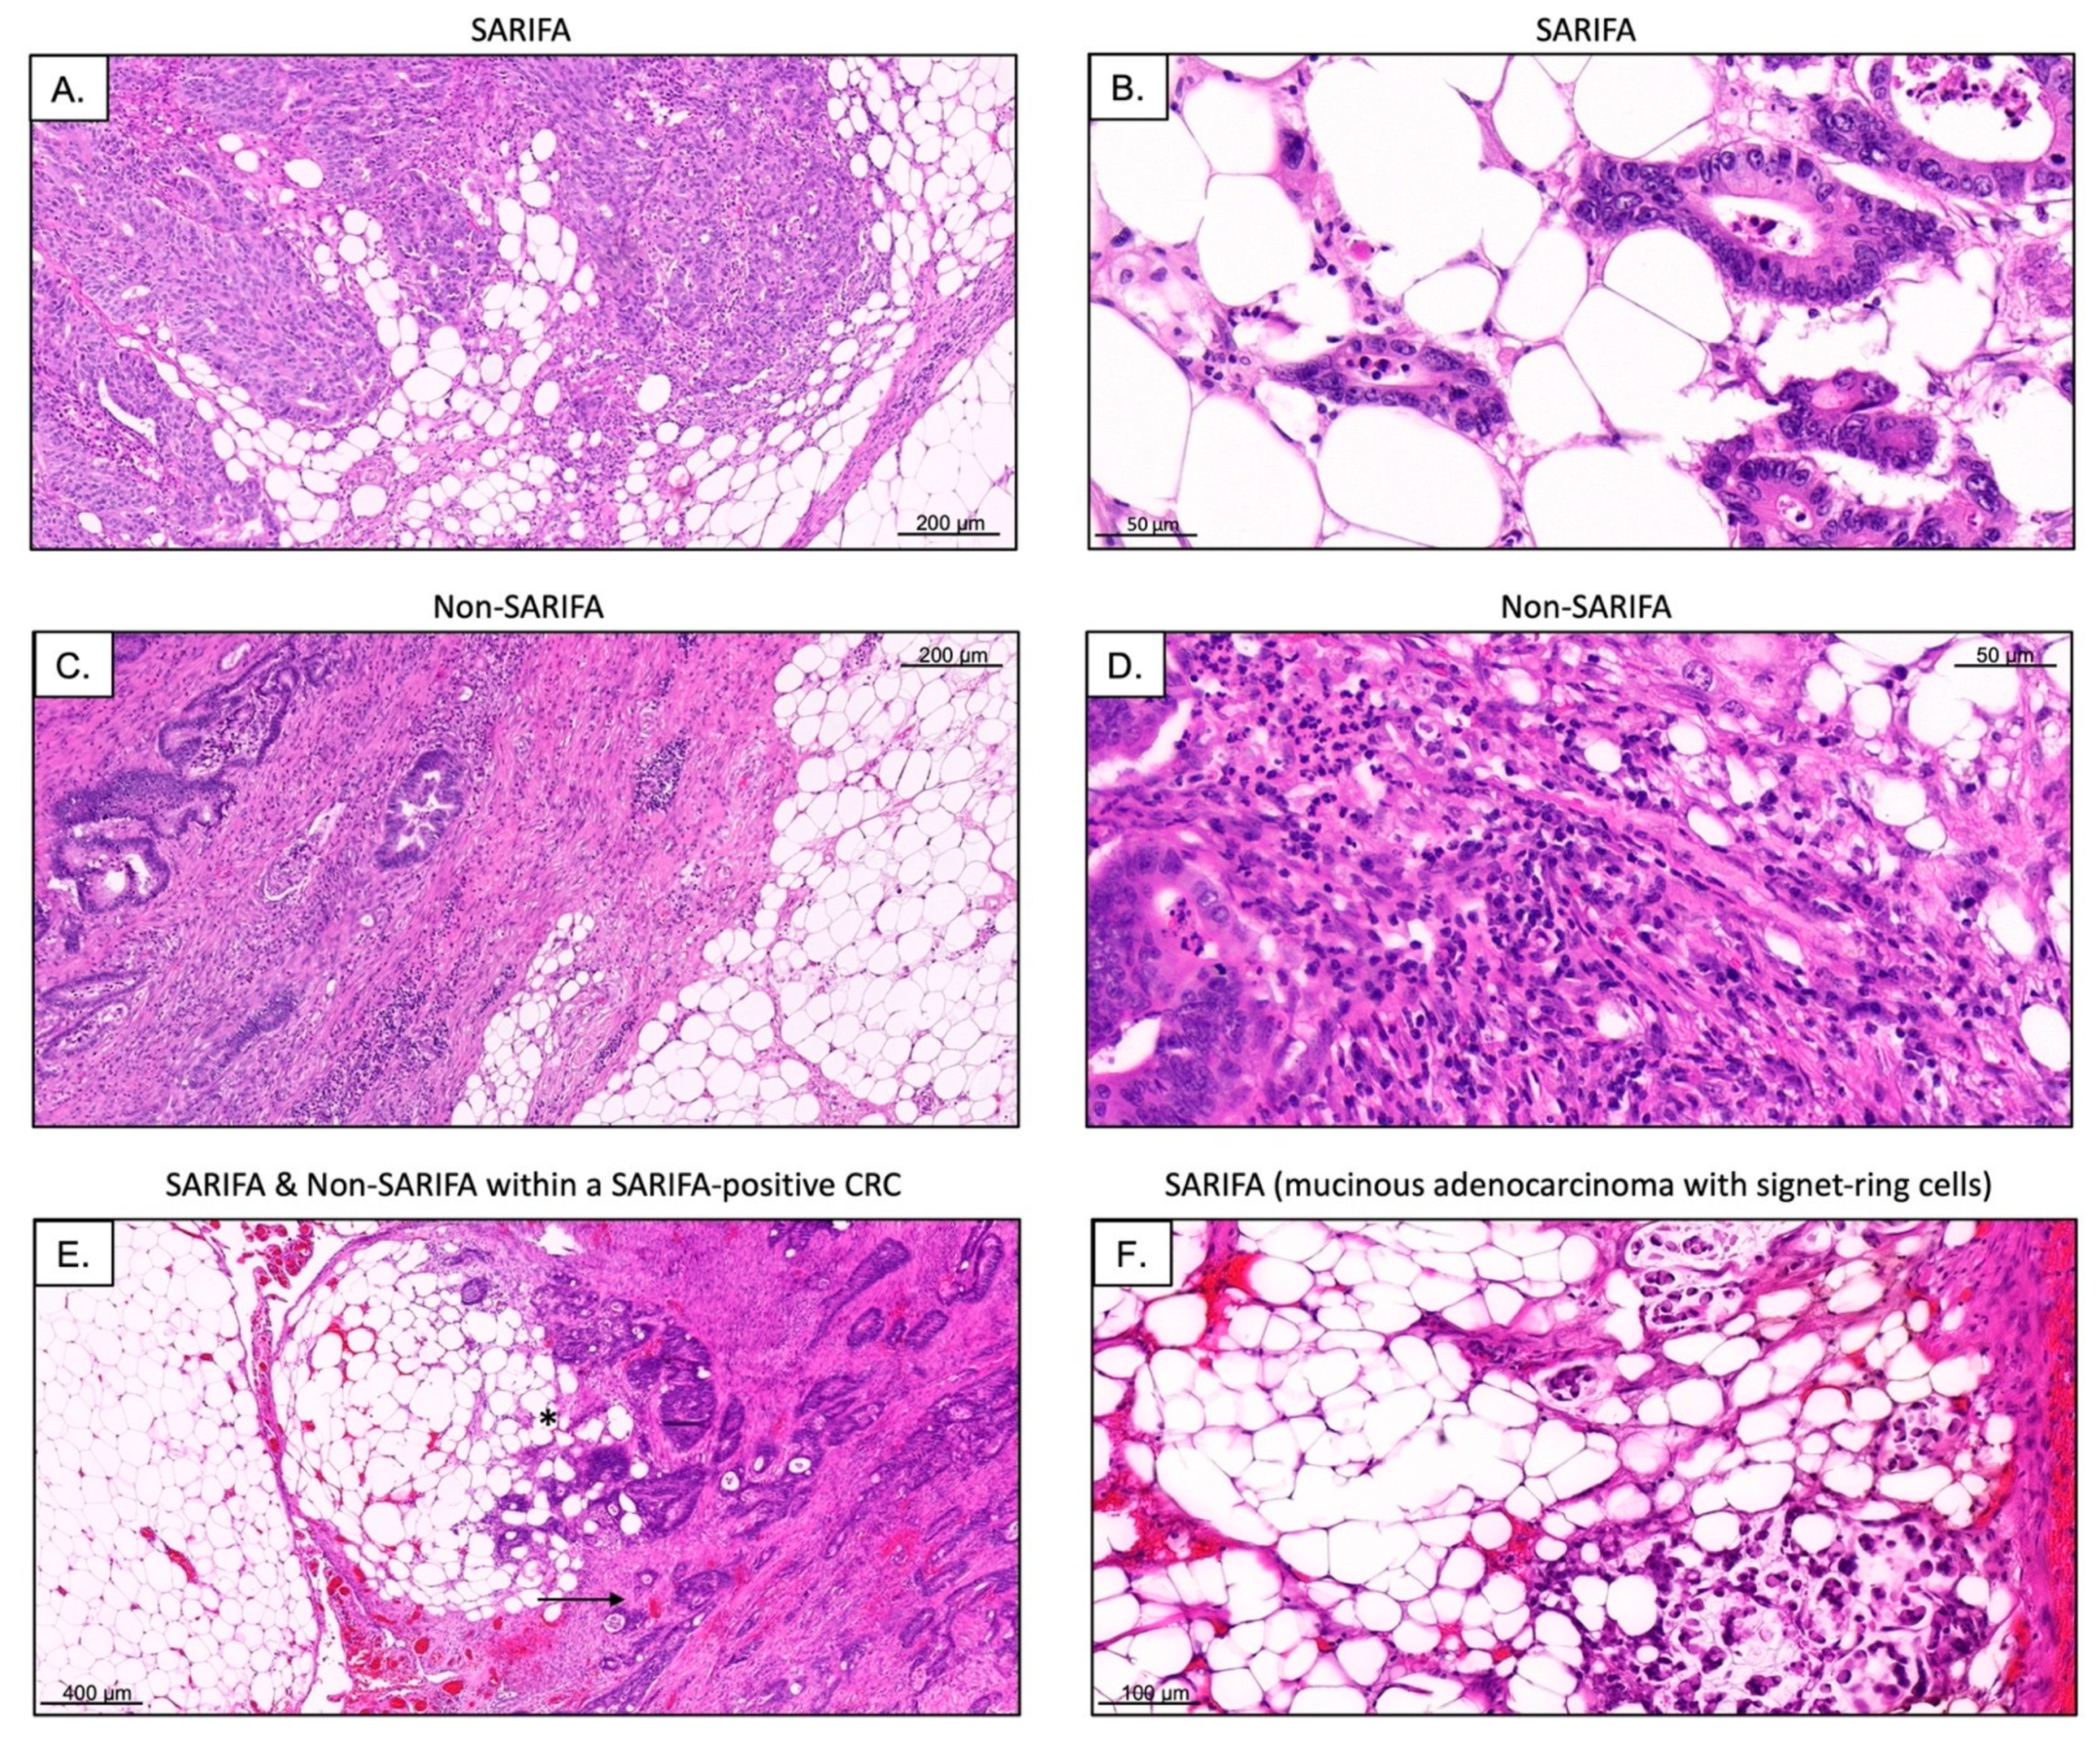
2.2. Definition of SARIFA

SARIFA status was evaluated based on all available tumor slide sections, including the sections with the greatest depth of invasion. SARIFA status can be easily assessed using H&E stains. SARIFA was defined—in line with our previous publication regarding SARIFA in colon cancer [16]—as an area at the tumor invasion front (IF), in which at least one tumor gland or a group of at least five tumor cells are directly adjacent to adipocytes without interjacent inflammatory infiltrate, or without a desmoplastic stromal reaction (Figure 1). The stromal reaction can present as collagen formation, reactive histiocytes, or fibroblastic proliferation. Even if only a single SARIFA were present, for example, a single tumor gland surrounded directly by adipose tissue, the case was classified as SARIFA-positive [16,17]. The first author (N.G.R.) classified all tumors and was blind to the clinical data, clinical course, and other characteristics. In the rare cases where SARIFA status was not immediately obvious, the second author (B.M.), a board-certified pathologist, was consulted and a consensus diagnosis was made using a double-headed microscope.

2.3. Analysis of Lymphocyte Subsets via Flow Cytometry

Blood samples were taken prior to surgery and flow cytometry was performed within 24 h at our local laboratory using an FC 500 flow cytometer from Beckman Coulter (Brea, CA, USA). The gating strategy was used as previously published by our study group [12,15,26,27,28] and is displayed in detail in Supplementary Figure S1. For cell staining, antibodies from Beckman Coulter (Brea, CA, USA) and Biolegend (San Diego, CA, USA) were applied. Absolute values of lymphocytes were calculated using leukocyte counts measured with Stem-Count (Stem-Kit, Beckman Coulter). Initial lymphocyte values were reported as percentages. Detailed information regarding the used antibodies and gating strategy is displayed in Supplementary Figure S1 and Table S1. In brief, lymphocytes were identified by using forward and side scatter. B lymphocytes were defined by CD19 positivity and further subdivided into naïve, class-switched memory, non-class-switched memory, and transitional B cells. NK-like T cells were primarily identified (CD3+ CD56+) [29,30]. NK lymphocytes, which were of special interest in this study, were detected as CD56+ cells and subdivided into three functional NK subsets, namely CD56+ CD16+, CD56dim CD16bright, and CD56bright CD16dim. T cells were identified by CD4 or CD8 positivity, and both were further subdivided into memory, naïve, central memory, effector memory, and effector memory RA (herein called “EMRA”) cells. To further analyze CD8+ cells, they were divided into early, intermediate, late, or exhausted and terminal effector cells. CD4+ T helper cells were classified into Th1, Th2, and Th17/22. Moreover, CD4+ and CD8+ were subdivided into activated and regulatory cells.

2.4. Immunohistochemistry

All IHC was performed on representative 2 µm slides on the Leica Bond RX automated staining system (Leica, Wetzlar, Germany), following the automated standard IHC protocol optimized for use on this platform. For each SARIFA-positive and SARIFA-negative case, 2-µm thick, whole-slide, formalin-fixed paraffin-embedded (FFPE) sections with the greatest depth of tumor invasion were used. FFPE sections were deparaffinized in the instrument, which was followed by epitope retrieval for 20 min at 95 °C in EDTA and peroxidase block for 5 min at 25 °C. The slides were incubated with antibodies against CD56 (MRQ-62 rabbit monoclonal antibody, 1:200, Cell Marque, Rocklin, CA, USA) and CD57 (NK-1 mouse monoclonal antibody, 1:100, Cell Marque, Rocklin, CA, USA), diluted in Dako’s antibody diluting solution (Dako, DM830) for 32 min at 42 °C. Chromogen detection and hematoxylin counterstaining were performed using a bond polymer refine detection kit (Leica, Cat. No.: DS9800).
To assess the number of NK cells and NK-like lymphocytes at the tumor center (TC) as well as at the SARIFAs and non-SARIFAs at the IF, CD56+, and CD57+ lymphocytes were counted manually. Even though CD56 is expressed in other immune cells such as dendritic cells, it is considered the characteristic phenotypic marker of NK cells [31]. CD57 served as a marker for a terminally differentiated, yet also highly cytotoxic NK cell subpopulation [32]. To reflect heterogeneity, three areas with the highest positive lymphocyte density per case (SARIFA-negative CRC: 3× TC, 3× non-SARIFA; SARIFA-positive CRC: 3× TC, 3× SARIFA, 3× non-SARIFA) were considered. Here, it is important to note that even within SARIFA-positive CRCs, there can be other invasion front areas that are not SARIFAs (Figure 1E), which were also investigated. Representative slides of CD56 and CD57 IHC as well as H&E stains were digitized using 3D Histech Pannoramic Scan II (3D Histech, Budapest, Hungary).
Immunohistochemical staining with CD3 (2GV6 rabbit monoclonal antibody, 1:100, Roche Ventana Medical Systems, Tucson, AZ, USA) CD8 (144B mouse monoclonal antibody, ready to use, Cell Marque, Rocklin, CA, USA) antibodies was performed on 2 µm whole slide sections in an automated manner on a Ventana BenchMark ULTRA platform with an iVIEW DAB detection system (Roche, Mannheim, Germany), as has been described by our group previously [15]. For the assessment of TILs, we used a different automatic approach than has already been described, in detail, in our previous publication [15]. We used digital quantifier software (VMscope, Berlin, Germany) since CD3+/CD8+ TILs are far more numerous than NK/NK-like cells, and automatic cell counting is apparently faster and at least equally consistent [33,34]. Due to the different workflows, CD3 and CD8 IHC slides were digitized with a Philips Ultrafast Scanner (Philips Health Systems, Hamburg, Germany). Since the TILs were counted automatically in the TC areas and at the invasive margin with high T cell density, it is important to clarify that it was solely SARIFAs that were counted as IF within the SARIFA-positive CRCs. As mentioned earlier, this is because non-SARIFAs are present at the invasive margin, even within SARIFA-positive CRCs, as visualized in Figure 1E. Therefore, with respect to TILs, we only distinguished between SARIFA-positive and SARIFA-negative CRC cases and not specifically between the invasive margins containing SARIFAs with direct tumor-fat interactions and those without SARIFA.

2.5. dMMR/MSI Testing

For the detection of deficient mismatch repair (dMMR), IHC staining, which shows a high consistency with PCR-based MSI-testing [35], was performed using the purported two-stain method to initially only test for PMS2 and MSH6 [36,37]. For further identification of the MSI status, for example, in the case of unclear IHC results, molecular MSI testing was performed on normal DNA and tumor DNA by investigating five microsatellite markers via multiplex amplification. Both these methods and the materials used have been described in detail in our previous publication [38].

2.6. Next-Generation Sequencing

To further characterize our cohort on a molecular level, we performed next-generation sequencing (NGS). For DNA extractions from formalin-fixed, paraffin-embedded (FFPE) samples, a pathologist manually marked the tumor areas on an H&E-stained slide. The corresponding area on the slide, with at least 20% tumor cellularity, was macro dissected from 10 µm sections (2–3×). For the library preparation, the multiplex PCR-based AmpliSeq Illumina Focus Panel or AmpliSeq for Illumina Cancer Hotspot Panel v2 (Illumina, San Diego, CA, USA) was used. DNA was isolated with a Maxwell FFPE Plus DNA Kit (Promega, Madison, WI, USA) and RNA with a Maxwell RSC RNA FFPE Kit (Promega), according to the manufacturer’s recommendations. Concentrations were determined via a fluorometric method with Quantus (Promega). Consecutively, RNA was transcribed into cDNA via reverse transcriptase. The Focus Panel consisted of 269 (DNA) and 284 (RNA) primer pairs for the detection of hot-spot regions and full genes of 52 genes with a targeted size of 29 kb (DNA) and 26 kb (RNA). The Hotspot Panel consisted of 207 primer pairs for the detection of Hotspot regions in 50 genes with a targeted size of 22k kb (DNA). Our laboratory workflow for NGS and used materials have been described extensively in our previous publication [38]. Data analysis was performed using the Illumina Base Space application for DNA/RNA amplicons and the subsequent interpretation using the Variant Interpreter (Illumina), in which non-synonymous and non-polymorphic changes were filtered. Of the remaining mutations, those with an allele frequency below 5% were not considered. Mutations below this threshold were individually matched using Integrated Genome Viewer (IGV, Broad Institute) with the human reference genome hg19 to exclude sequence errors. Moreover, data were analyzed with the BaseSpace Knowledge Network and the variants were documented accordingly.
Analyzed genes with AmpliSeq Focus Panel (Illumina):
  • Analysis of mutations in the following genes: AKT1, ALK, AR, BRAF, CCND1, CDK4, CDK6, CTNNB1, DDR2, EGFR, ERBB2, ERBB3, ERBB4, ESR1, FGFR1, FGFR2, FGFR3, FGFR4, GNA11, GNAQ, HRAS, IDH1, IDH2, JAK1, JAK2, JAK3, KIT, KRAS, MAP2K1, MAP2K2, MET, MTOR, MYC, MYCN, NRAS, PDGFRA, PIK3CA, RAF1, RET, ROS1, and SMO.
  • Analysis of fusions in the following genes: ABL1, ALK, AKT3, AXL, BRAF, EGFR, ERBB2, ERG, ETV1, ETV4, ETV5, FGFR1, FGFR2, FGFR3, MET, NTRK1, NTRK2, NTRK3, PDGFRA, PPARG, RAF1, RET, and ROS1.
Analyzed genes with AmpliSeq for Illumina Cancer Hotspot Panel v2 (Illumina):
ABL1, EGFR, GNAS, KRAS, PTPN11, AKT1, ERBB2, GNAQ, MET, RB1, ALK, ERBB4, HNF1A, MLH1, RET, APC, EZH2, HRAS, MPL, SMAD4, ATM, FBXW7, IDH1, NOTCH1, SMARCB1, BRAF, FGFR1, JAK2, NPM1, SMO, CDH1, FGFR2, JAK3, NRAS, SRC, CDKN2A, FGFR3, IDH2, PDGFRA, STK11, CSF1R, FLT3, KDR, PIK3CA, TP53, CTNNB1, GNA11, KIT, PTEN, and VHL.
As different panels were used to characterize our cohort (some in routine diagnostics, some for research use only), we logically compared only the mutational status of genes that were well covered by both panels between our SARIFA-positive and SARIFA-negative CRC patients. Variant calling and interpretation were performed identically.
The overlapping genes (subsequently used for subgroup analysis) included the following:
ABL1, AKT1, ALK, BRAF, CTNNB1, EGFR, ERBB2, ERBB4, FGFR1, FGFR2, FGFR3, GNAQ, HRAS, IDH1, IDH2, JAK2, JAK3, KIT, KRAS, MET, NRAS, PDGFRA, PIK3CA, RET, and SMO.

2.7. Statistical Analysis

Descriptive analysis results were reported as median values and interquartile ranges. For hypothesis testing of the differences between relative frequencies, Fisher exact tests were applied. Continuous variables were compared by using the Wilcoxon rank-sum test. When comparing three groups (healthy controls, SARIFA-negative, and SARIFA-positive), we performed a pairwise Wilcoxon test with Benjamini-Hochberg correction and reported adjusted p-values. The p-values are reported as follows: * p < 0.05, ** p < 0.01, *** p < 0.001, **** p < 0.0001. Data were analyzed using either SPSS for Windows, version 24 (IBM, Armonk, NY, USA) or R, version 4.2.1 (R Foundation for Statistical Computing, Vienna, Austria). The figures were designed using R, version 4.2.1.

3. Results

3.1. Patient Characteristics and NGS Analysis

The clinical characteristics of our patient cohort are summarized in Table 1 (see Section 2.1.). A total of 15 (33.3%) out of 45 patients showed a SARIFA-positive CRC. SARIFA-positive CRC patients were significantly younger (p = 0.043) and predominantly men (p = 0.012). Regarding the UICC stage, tumor location, and microsatellite status, the two cohorts did not differ significantly.
To characterize our cohort molecularly beyond MSI and in more detail, NGS-based multigene testing was performed on 38 of 45 CRC specimens. By comparing the relative frequencies of the observed mutations in SARIFA-positive and SARIFA-negative CRCs, we could show that none of these mutations are over-represented in any of our subgroups. Hence, we proved, at least for our cohort, that SARIFA-positive and SARIFA-negative CRC are both heterogenous groups regarding their tumor genetics and did not differ significantly (Table 2).

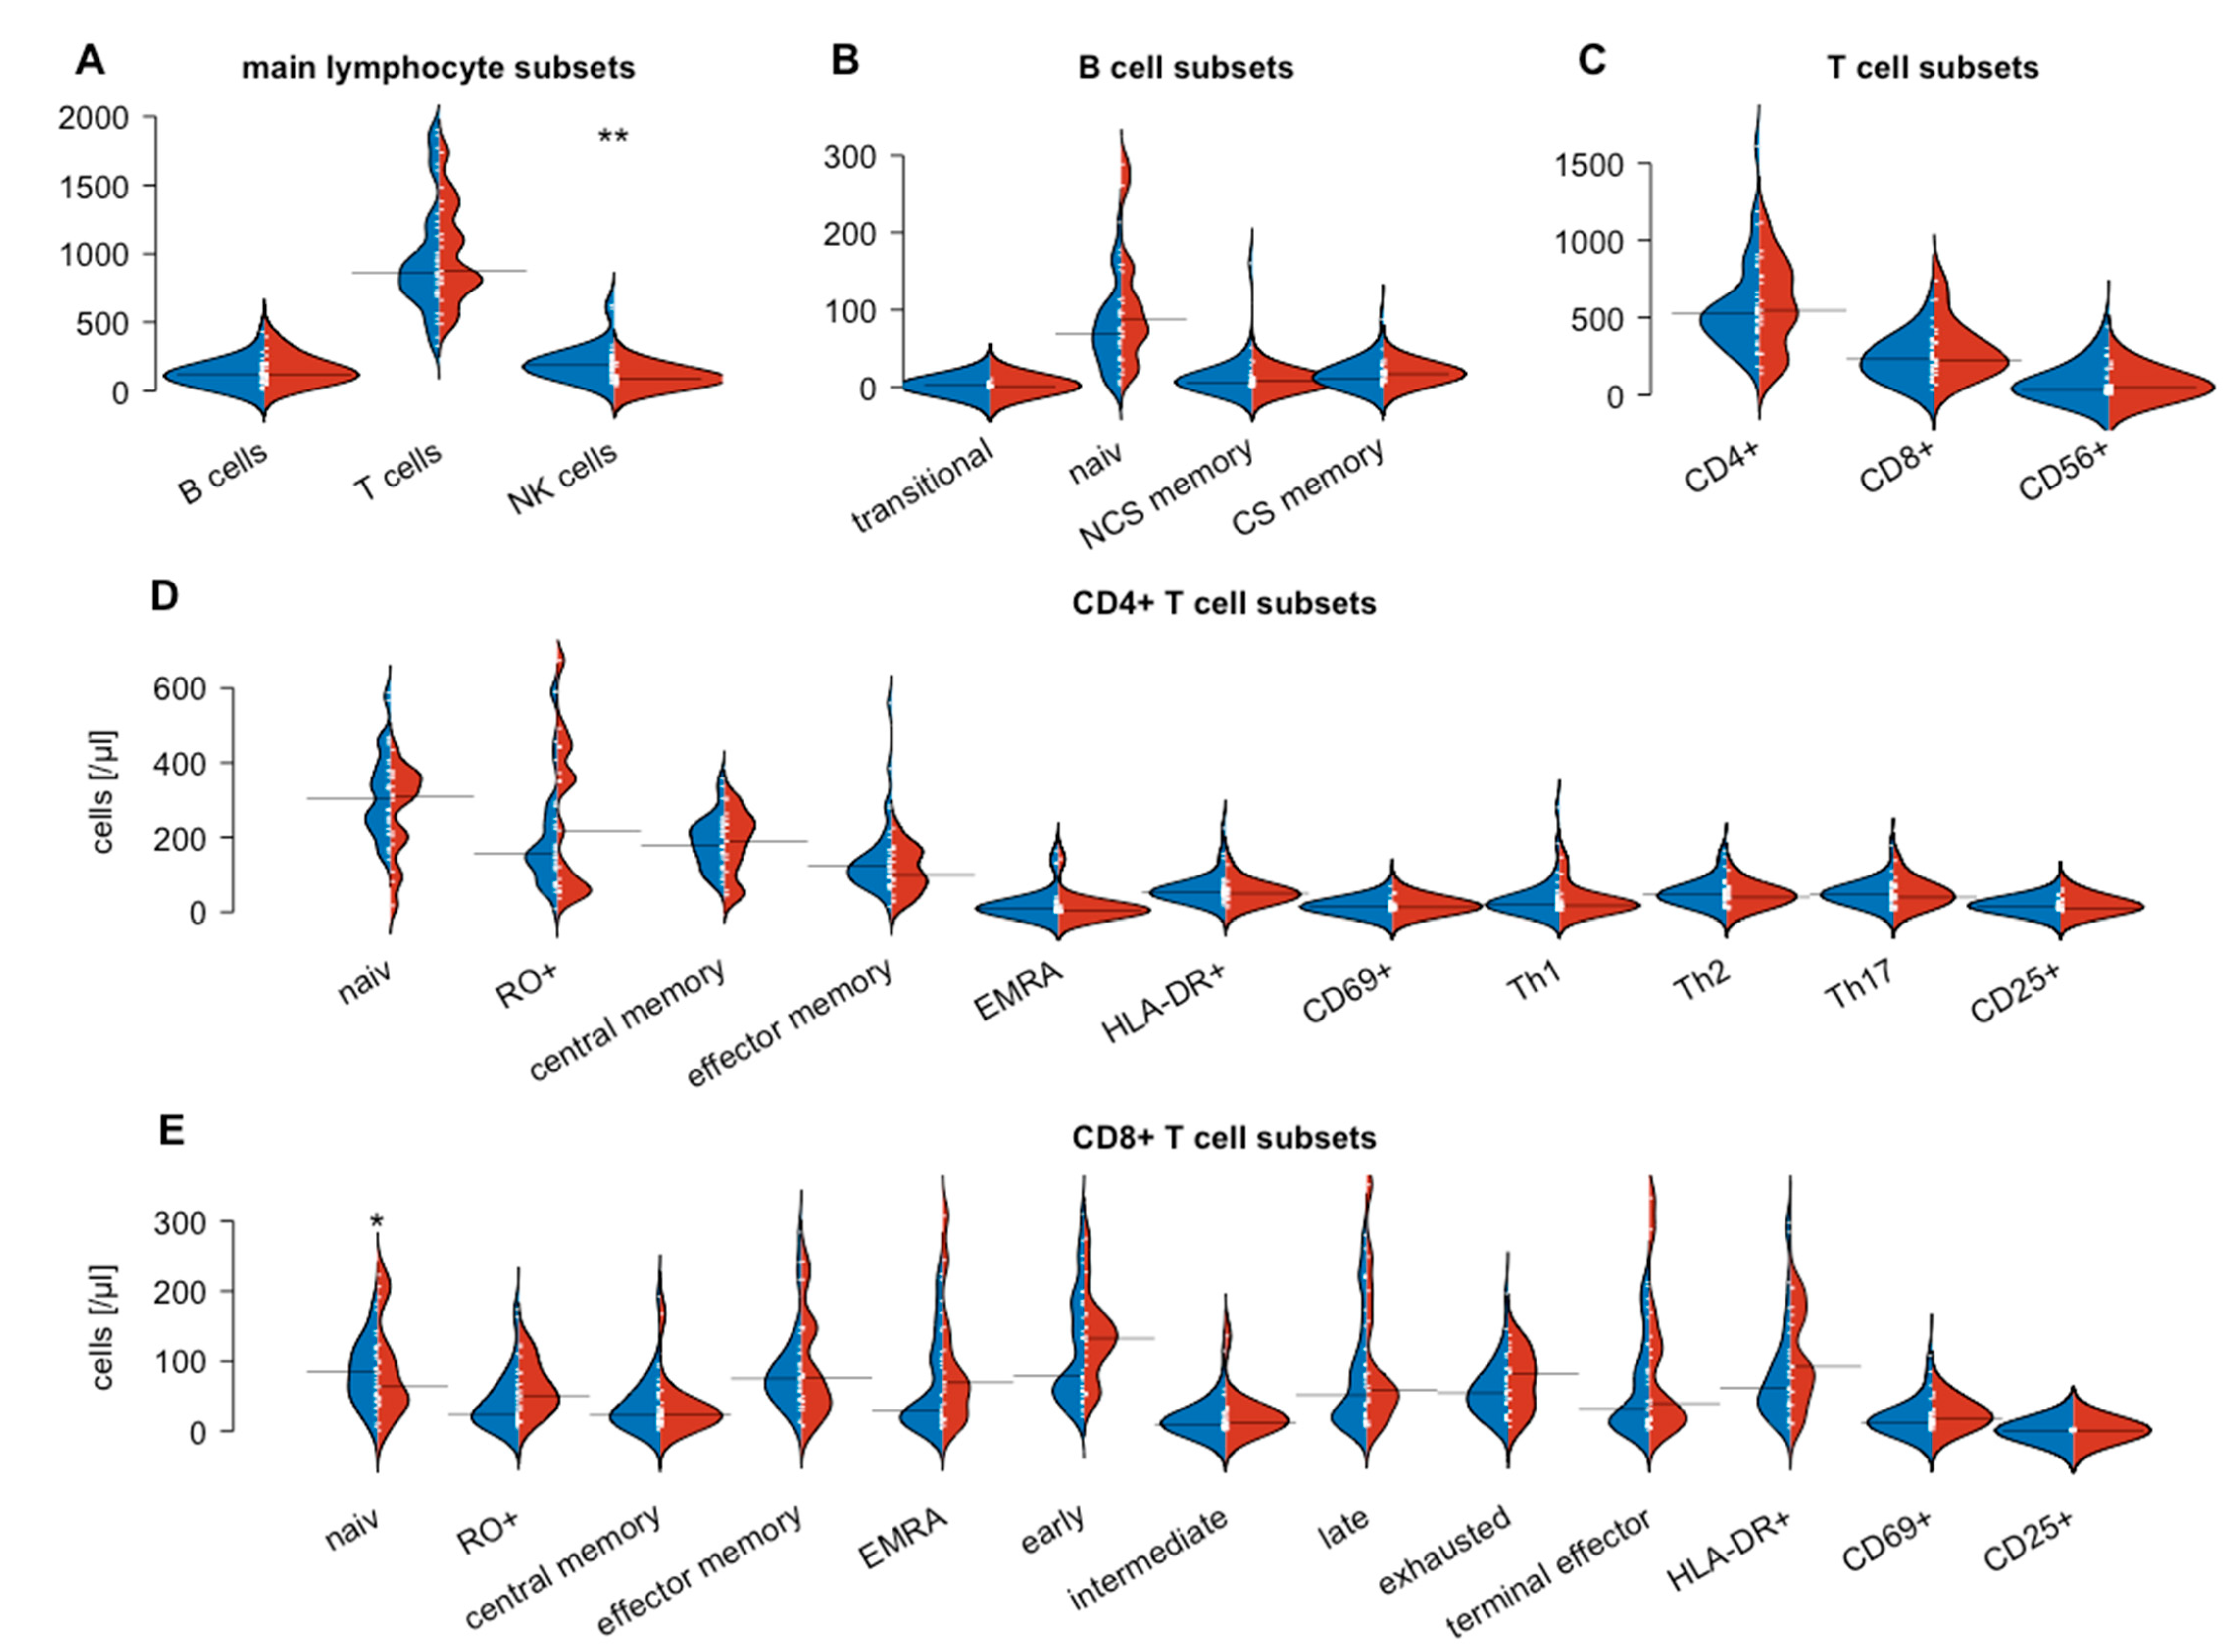
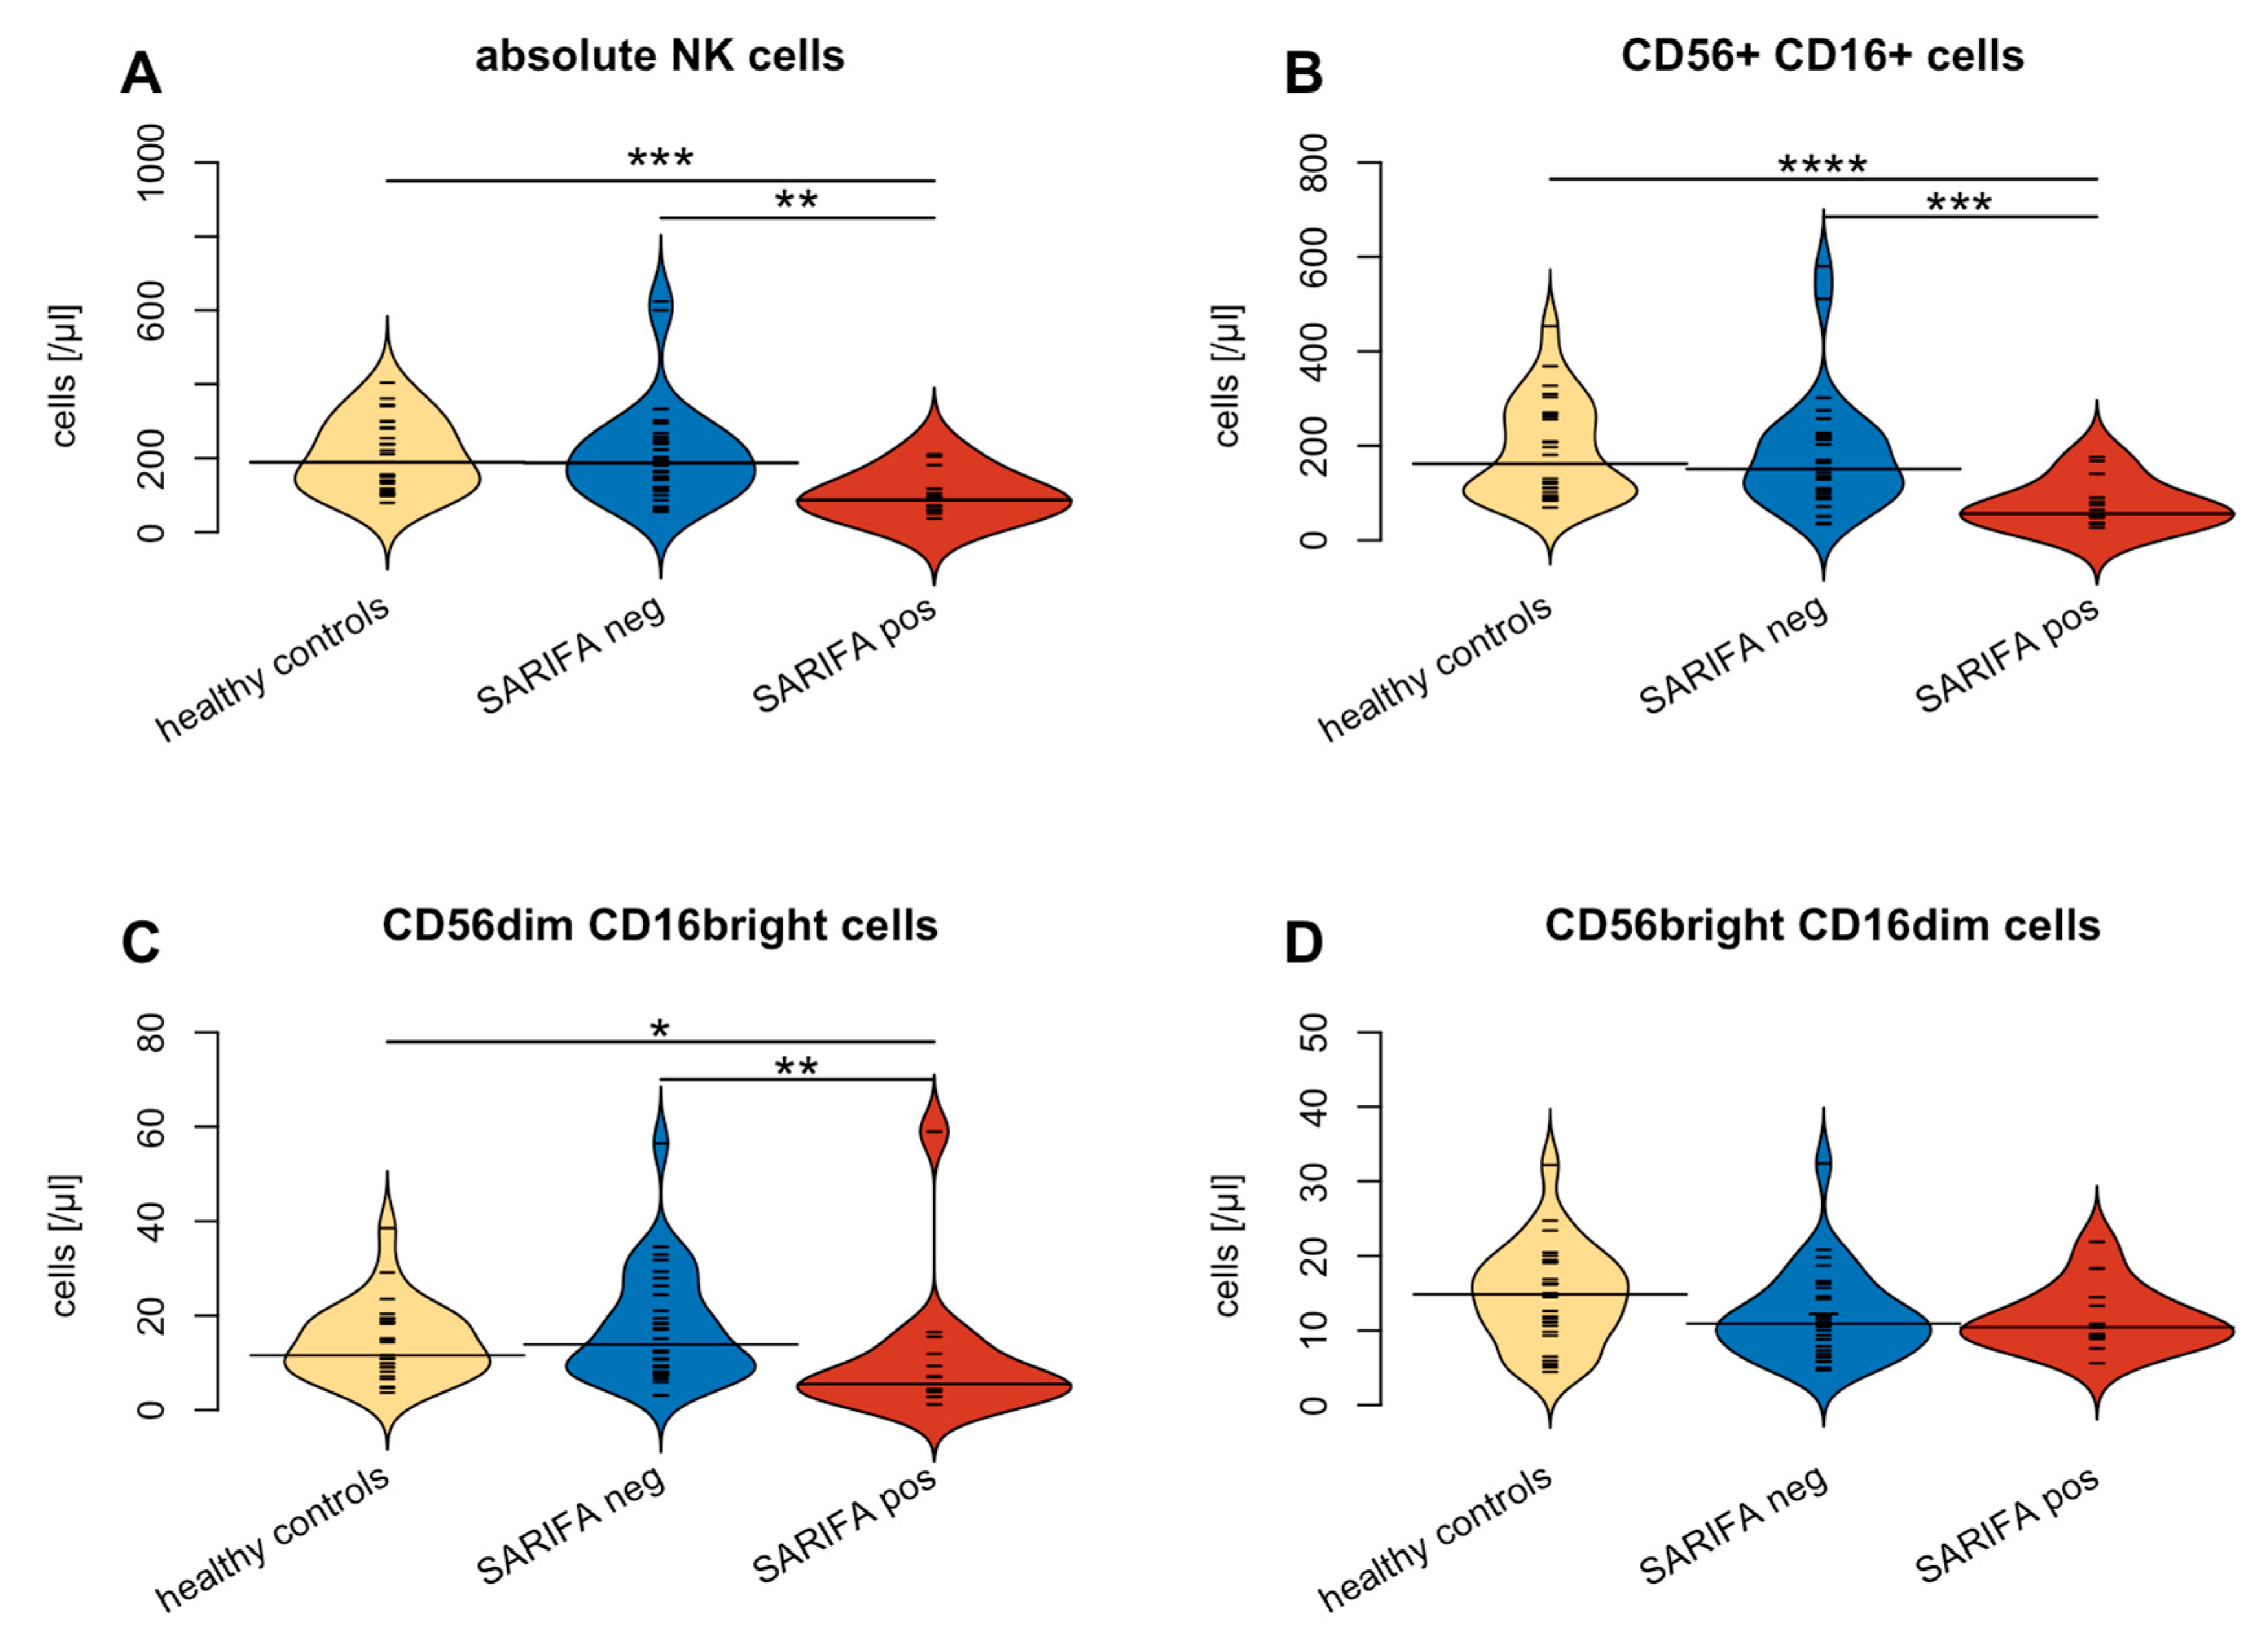
3.2. Flow Cytometry-Based Analysis of Peripheral Blood Lymphocytes

Flow cytometry was performed to compare the numbers of peripheral blood lymphocytes and their subsets between SARIFA-negative and SARIFA-positive CRCs. To put our findings into context, a healthy control group was also examined. Flow cytometry revealed no differences between total lymphocytes, CD8+ and CD4+ T cells, and all their subsets, in addition to B cells and B cell subsets in SARIFA-positive versus SARIFA-negative patients. In contrast, NK cells were significantly reduced in SARIFA-positive patients (total numbers: 87/µL vs. 187/µL; p = 0.002). NK cell subsets also showed lower values in SARIFA-positive patients for CD56dim CD16bright NK cell subsets (6/µL vs. 14/µL; p = 0.004) and for CD56+ CD16+ NK cells (56/µL vs. 151/µL; p < 0.001) compared to SARIFA-negative CRC patients and healthy controls. Moreover, SARIFA-negative and SARIFA-positive CRC patients both showed significantly increased levels of HLA-DR+ CD4+ and CD8+ cells. The results of the flow cytometric analysis on the circulating lymphocytes are displayed in Figure 2 and Table 3. The differences between NK cells and NK cell subsets dependent on SARIFA status are specifically illustrated in Figure 3.

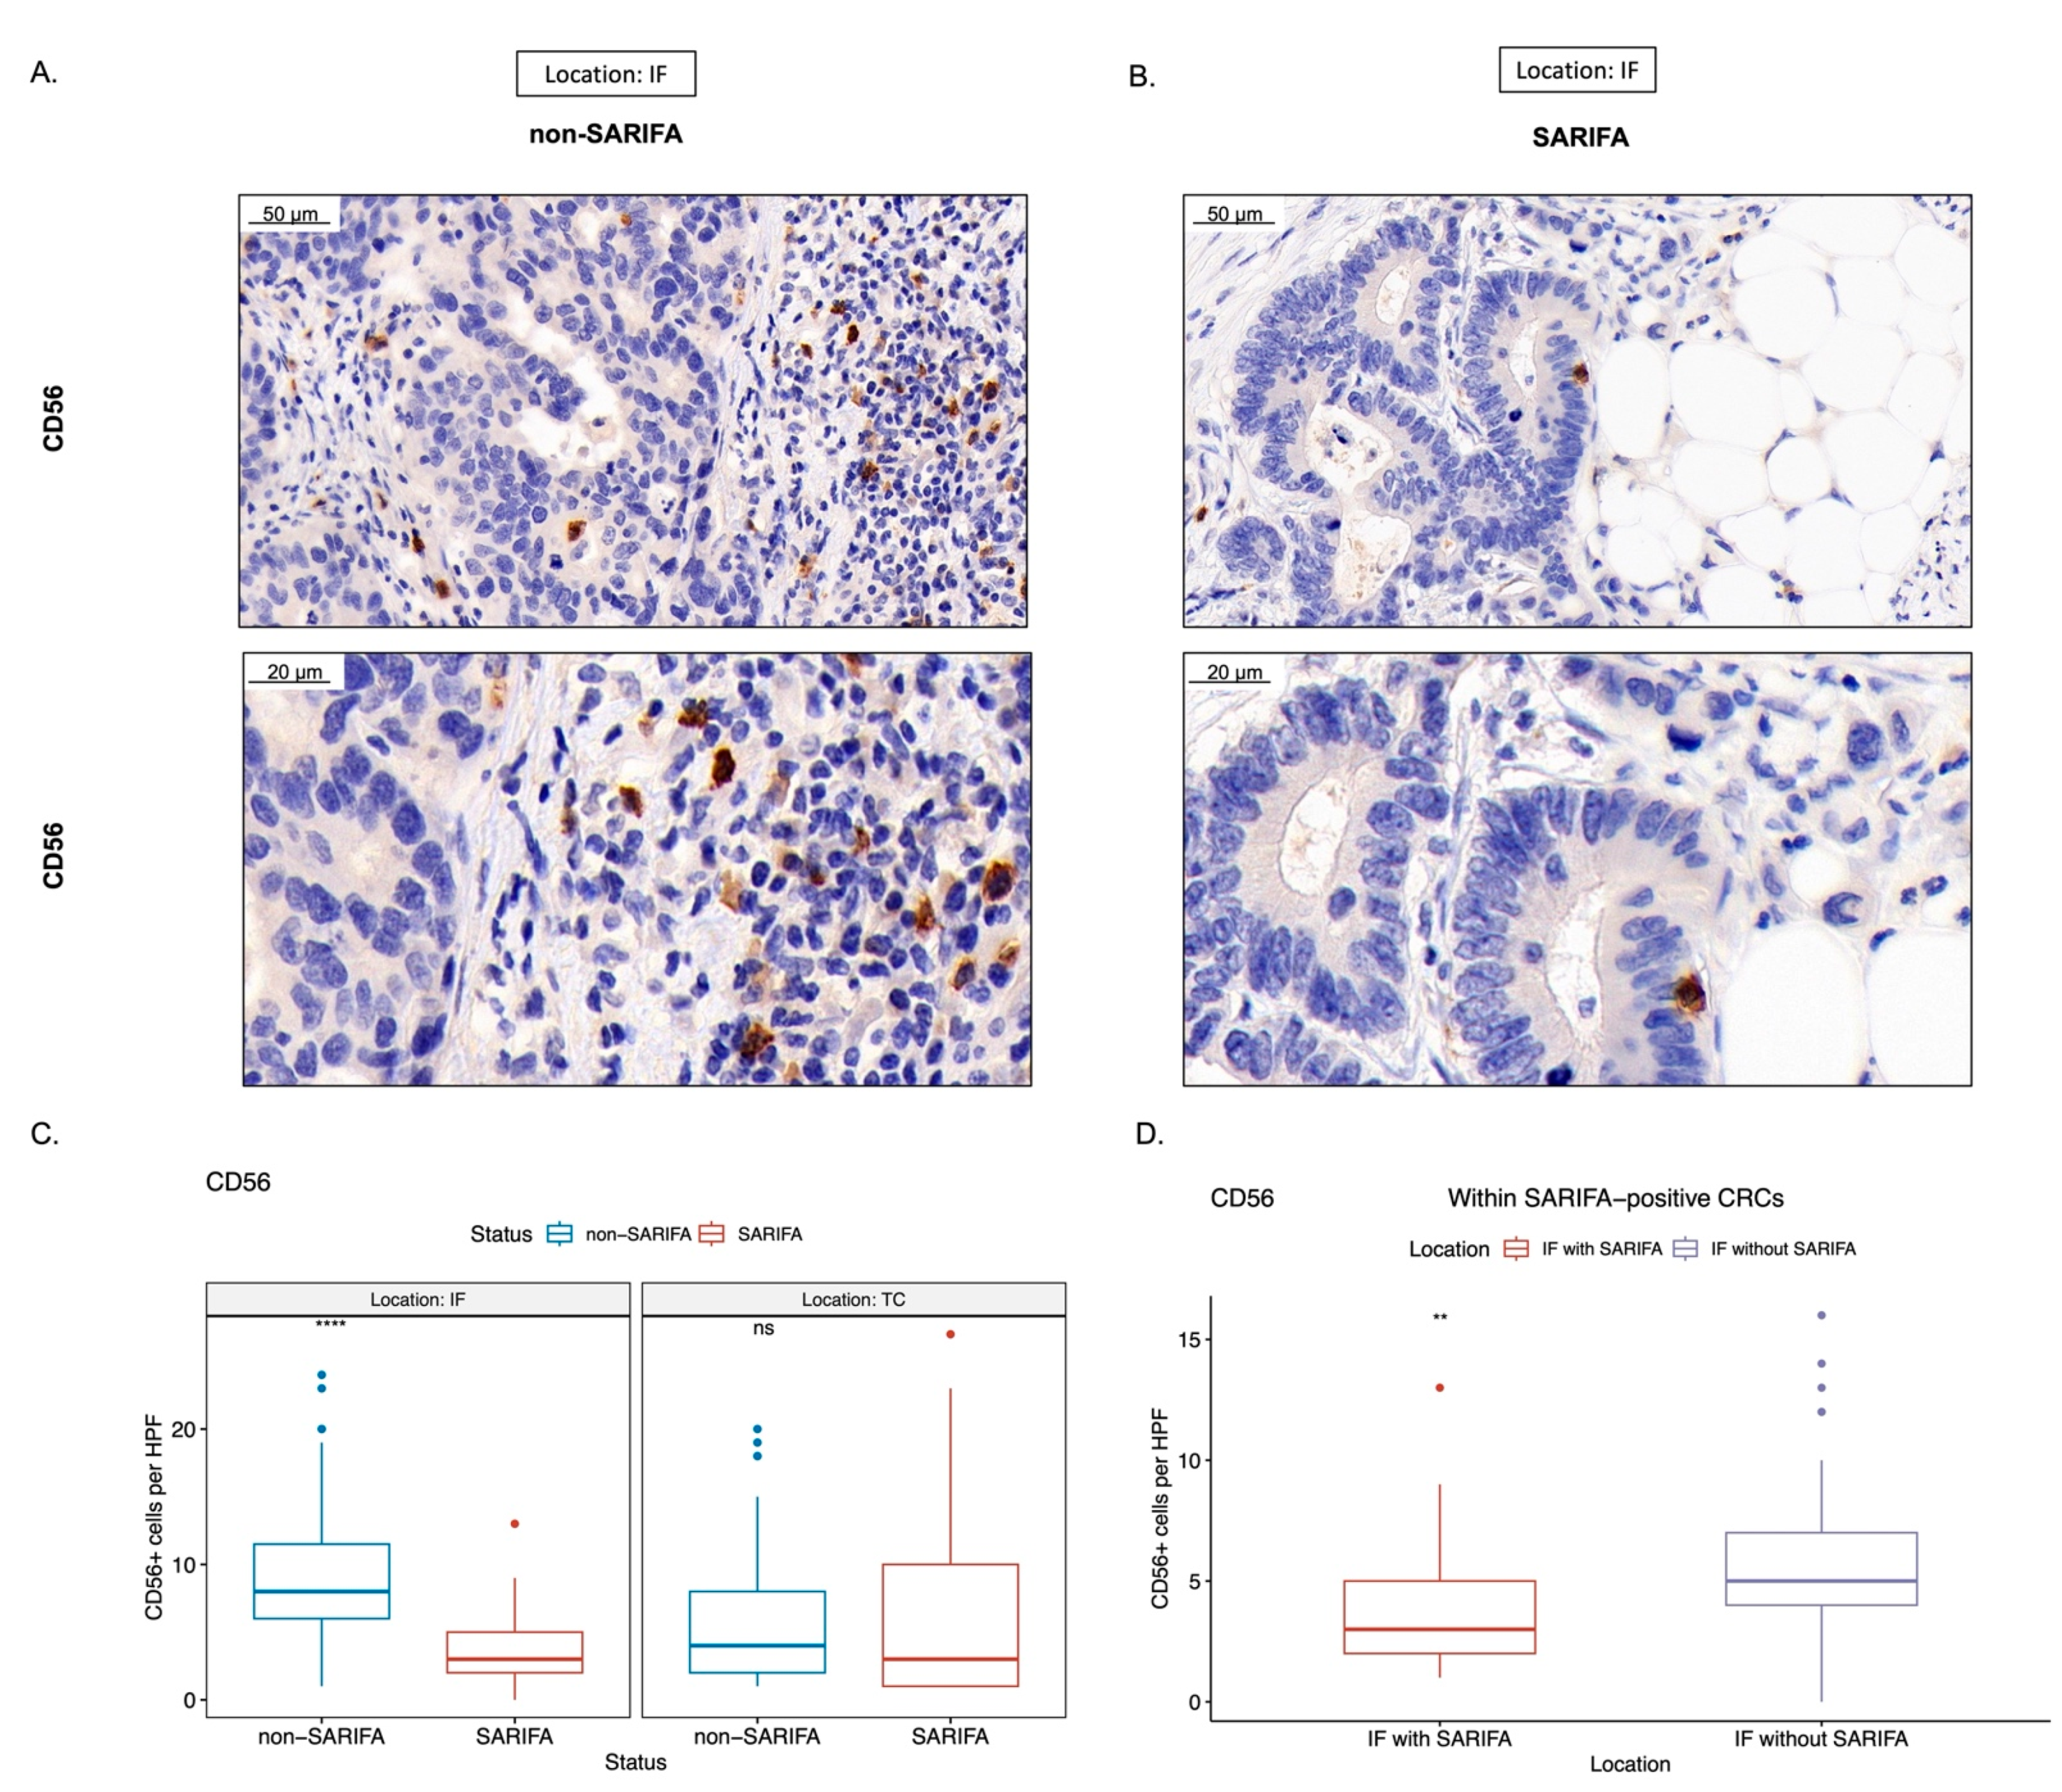
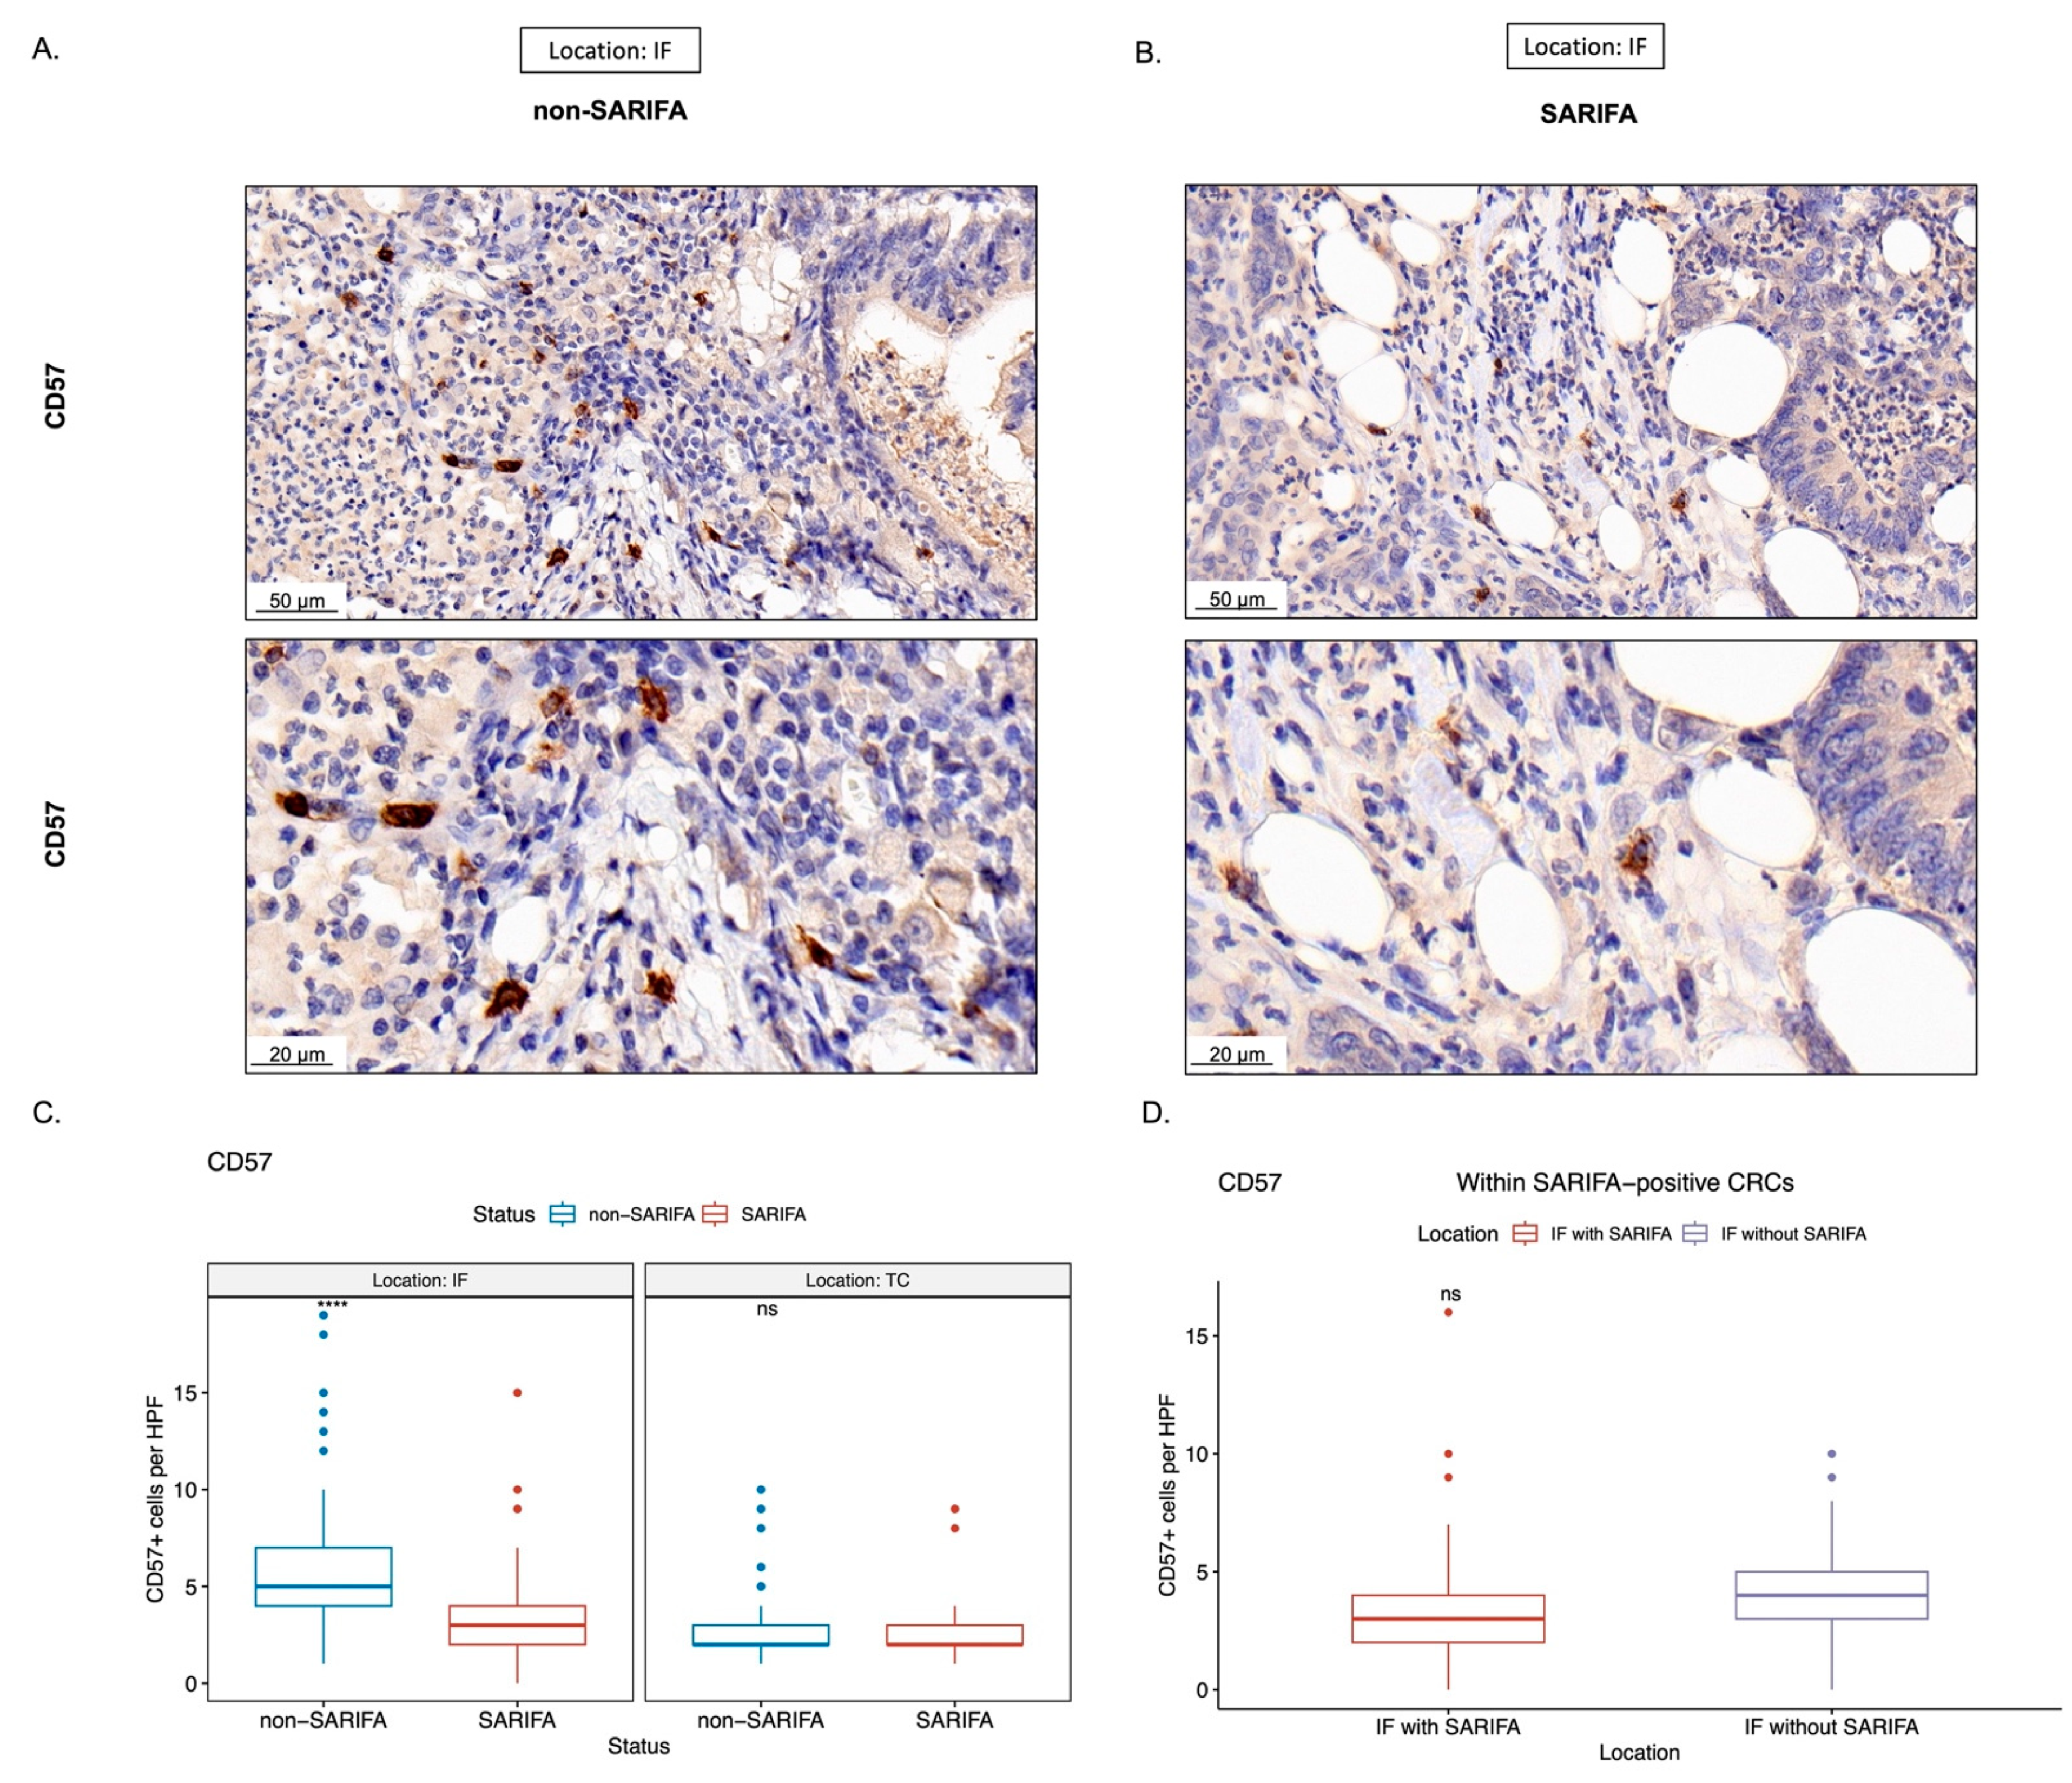
3.3. Immunohistochemical Analysis of Tumor-Infiltrating as well as CD56+ and CD57+ Lymphocytes

To correlate our findings in the peripheral blood with the immune cell infiltrate in the tumor center (TC) and specifically at the tumor invasion front (IF), we performed conventional immunohistochemistry. By counting the TILs automatically using CD3 and CD8 IHC, we did not observe differences regarding TILs between SARIFA-positive and SARIFA-negative CRCs (IF (not necessarily SARIFAs, see Section 2.4) CD3: p = 0.75, CD8: p = 0.23; TC CD3: p = 0.58, CD8: p = 0.26, Supplementary Figure S2).
Considering our flow cytometry results indicated that there was a reduction in NK cells in the peripheral blood of SARIFA-positive CRC patients, we immunostained for CD56 as a surrogate marker for NK cells/NK-like lymphocytes and CD57 as a marker for a terminally differentiated, cytotoxic NK cell subpopulation. Here, we assessed the amount of CD56+ and CD57+ lymphocytes in the TC and at IF. In SARIFAs, we observed a statistically significant decrease of CD56+ as well as CD57+ lymphocytes (CD56 in Figure 4 and CD57 in Figure 5: CD56: p < 0.0001, CD57: p < 0.0001). CD56+ lymphocytes were decreased at SARIFAs even within SARIFA-positive CRCs, when comparing IFs (SARIFAs and non-SARIFAs) within SARIFA-positive cases (see Figure 1E, CD56: p < 0.01, CD57: p = 0.081, not significant at p < 0.05). As the invasive margin is, itself, heterogenous, there are non-SARIFAs even in CRCs that are classified as SARIFA-positive. This is depicted in Figure 1E and also described in detail in Section 2.4 (Methods: Immunohistochemistry). The results of the comparison of IFs, with and without SARIFA, in SARIFA-positive CRCs are displayed in Figure 4D and Figure 5D. In the TC, there was no difference between SARIFA-positive and SARIFA-negative CRCs (CD56: p = 0.15, CD57: p = 0.85).

4. Discussion

This is the first study to specifically focus on the immunologic abnormalities of SARIFA-positive CRCs. By comparing the peripheral lymphocyte status of SARIFA-positive and SARIFA-negative CRC cases via flow cytometric analysis, we could see that NK cells are heavily reduced in the peripheral blood of SARIFA-positive patients compared to healthy controls and SARIFA-negative patients. In line with our previous findings [12], both CRC subgroups presented with increased numbers of HLA-DR+ CD4+ and CD8+ peripheral blood lymphocytes compared to healthy controls, which points to an unspecific activation in the context of malignancy. Based on our findings regarding NK cells, we immunostained primary CRCs for CD56 and CD57. Our immunohistochemical studies suggest a significant reduction of NK cells and NK-like lymphocytes at SARIFAs. Interestingly, CD57+ lymphocytes, which are terminally differentiated senescent cells with a cytotoxic effector and memory-like functions [32], seem to be generally decreased at the IF of SARIFA-positive CRCs, and not solely at SARIFAs. Contrastingly, the number of CD56+ lymphocytes is pronouncedly decreased at SARIFAs. Hence, our study shows that circulating NK cells reflect, at least to a certain degree, the local antitumor response at SARIFAs. Using a different automatic counting approach, we could not detect any differences between SARIFA-positive and SARIFA-negative CRCs regarding CD3+/CD8+ TILs. As we have already demonstrated that macrophages—likely of M2 polarization—are upregulated at SARIFAs in GC [17], our data hint at another aspect of the immunosuppressive microenvironment at SARIFAs, which even reflects to some part in the peripheral blood. Our data suggest a pivotal role of NK cells in the context of SARIFA. There is already a considerable amount of data proving that low peripheral blood NK cell counts [39] as well as reduced levels of CD56+ [40,41], and CD57+ [42,43,44,45] tumor-infiltrating lymphocytes are associated with a poorer prognosis in CRC [46], which correlates with our results in SARIFA-positive cases. However, the data regarding tumor-infiltrating NK cells are not completely unequivocal, showing a clear trend toward an association between the reduction in the number of cells and adverse outcomes [46,47]. In this context, seminal work performed by Väyrynen et al. shows that NK cells and NK-like lymphocytes are spatially more closely related to tumor cells and that higher densities of these comparably rarer immune cell types in the CRC microenvironment are associated with lower cancer-specific mortality [48]. As NK cells are a crucial part of the innate antitumor immune response by performing cytotoxic functions, it seems biologically reasonable that low NK cell counts are associated with reduced antitumor activity. NK cells do not solely rely on MHC presentation and can even kill tumor cells that downregulate MHC as an immune evasive mechanism (in the absence of other inhibitory signals or soluble factors inhibiting NK-cell cytotoxicity) [49]. NK cells can be divided into functional subgroups with different antitumor activities [50,51]. Interestingly, our data point to a general reduction of NK cells, indicating a widespread involvement of NK cells in SARIFA-positive CRCs, as we found decreased levels of NK cells in general alongside the CD56dim CD16bright and CD56+ CD16+ subtypes. As CD56dim NK cells express higher levels of CD16, the FCgamma receptor III, as well as Ig-like NK receptors, CD56dim CD16bright NK cells are more cytotoxic [52]. Lower numbers of cytotoxic NK cells could causally explain the reduced antitumor activity in SARIFA-positive CRC patients, which could eventually contribute to a poorer prognosis.
Having already shown that peripheral blood lymphocytes reflect the local tumor immune response [15], we checked if this is also true for NK cells. Here, we observed that the downregulation of CD56+ lymphocytes in SARFA-positive CRCs is restricted to SARIFAs: areas at the invasion front, which are characterized by tumor-associated fat cells without desmoplastic or inflammatory reactions. It is already known that cancer-associated fat cells can contribute to an immunosuppressive tumor microenvironment [18,53,54] and that lipid accumulation can cause NK-cell dysfunction [55]. The same is also known for the abovementioned M2 macrophages [10,56]. Furthermore, two independent deep learning models highlighted the importance of tumor cell/adipocyte co-localization [19,20] and another the relevance of inflamed fat as a risk factor for lymph node metastasis in early CRCs [57]—both confirming the important role of adipose tissue in CRC.
As we did not observe any differences between SARIFA-positive and SARIFA-negative CRCs regarding the number of NK cells in the tumor center, our results further strengthen the outstanding relevance of the invasive border in CRC [58], where immune cell density is known to be higher than in the tumor center [59,60] and where our SARIFA-phenomenon is, by definition, located.
Using NGS-based multigene testing, this is the first study ever that provides a molecular characterization of CRCs, with regard to their SARIFA status; thus, we could show for our cohort that both SARIFA-positive and SARIFA-negative CRCs are molecularly heterogeneous and are seemingly not defined by certain specific driver mutations, or a predominant microsatellite status that could cause the immunologic differences, which is, for example, known for KRAS mutations [61,62,63]. However, to prove this, both a larger cohort and a larger NGS panel will be necessary for future studies. Even though we used two different panels, due to logistical reasons, it is well known that different NGS panels show a high concordance [64,65]. Logically, we only took the mutational status of the genes into account, which are well covered by both panels. Moreover, both panels are produced by the same manufacturer (Illumina) and used in our routine diagnostic workflow. Additionally, variant calling and interpretation were performed identically.
Our study provides further evidence that other parts of the immune system, beyond the extensively studied CD3+ and CD8+ cells, can be dysregulated in CRC subgroups. Furthermore, our study reinforces the already existing view that the spatial distribution of immune cells (tumor center vs. invasion front (SARIFA vs. non-SARIFA)) and the composition are highly relevant, which has already been shown by numerous studies [59,66,67,68,69,70]. To really understand the immunologic background of SARIFAs and the specific tumor-adipocyte interaction, further studies that use advanced and more spatially resolved techniques, such as digital spatial profiling (DSP) [71,72], or multiplex immunohistochemistry in combination with computational pathology methods, could further illuminate this tumor-adipocyte-immune cell crosstalk.
As SARIFA-positive carcinomas make up a special subgroup with a poorer prognosis [16,17], there is a particular need for novel therapeutic approaches. Besides potentially targeting the metabolic changes induced by tumor-promoting adipocytes, our results put immunotherapeutic approaches on the map of potential therapeutic strategies for SARIFA-positive CRCs. Whereas the composition and the predictive value of adaptive immune cells in the TME in CRC have been comprehensively analyzed by Galon et al. almost two decades ago [66] and considered a potential therapeutic target since then, immunotherapy approaches targeting innate immune cells such as macrophages, neutrophils, and specifically, NK cells have only recently become the focus of increased attention [73,74,75]. Therefore, the combination of better stratification of patients (e.g., into SARIFA-positive/negative or by using the Immunoscore or similar approaches, potentially even in combination) and an improved understanding of the therapeutic potential of NK cells could lead to new, personalized therapeutic targets in CRC. Considering that anti-PDL1-therapy is already known to unleash an NK cell antitumoral response [76,77,78,79,80,81], it would be highly instructional to observe whether classifying the SARIFA status could serve as a predictive biomarker for immune-oncological (IO) therapeutic approaches [82]. The latter would be especially beneficial because the SARIFA status can be determined reliably, quickly, and inexpensively on H&E stains, thereby making it very different from all the previous IO therapeutic biomarkers and a protocol that could be very quickly integrated into the clinical workflow. Further unraveling the mutational landscape of SARIFA-positive CRCs, for example, regarding HRR mutations, could lead to even more precise combination therapies [38,83,84,85], especially in the case of refractory disease or relapse. Based on our findings, SARIFA status could also be of potential predictive value when using cetuximab, a monoclonal antibody that targets the epidermal growth factor receptor (EGFR), as it is known that cetuximab functions via NK-cell mediated antibody-dependent cell-mediated cytotoxicity (ADCC) [40,86]. Interestingly, besides KRAS/NRAS wildtype status (40%/93.3% of SARIFA-positive patients in our cohort), which is already an approved biomarker for cetuximab therapy, CD56+ cell infiltration has already been linked to response to cetuximab therapy in CRC patients [40].
As one of the limitations of this study, it should be noted that the number of patients included (n = 45) is still relatively small. However, despite this, the differences regarding NK cell numbers were highly significant. Furthermore, besides just the number of NK cells, their functional state is also important for antitumoral immunity, which this study did partially investigate, albeit only with regard to NK cell subtypes. It is well known that different NK cell subtypes exert different functions [32,50,52]. To characterize NK cells even more functionally, we are planning primary NK cell cultures derived from peripheral blood mononuclear cells (PBMCs) and in vitro stimulation experiments comparing functional differences between NK cells from patients with SARIFA-positive and SARIFA-negative CRCs. In this context, analyzing the degranulation potential, lytic mediator content, IFγ secretion, expression of activating/inhibiting receptors, including checkpoint receptors, and killing activity (e.g., via performing killing assays using PMBC-derived NK cells and targeting colon cancer cell lines) of NK cells with regards to SARIFA in further studies would be extremely beneficial. In this study, we immunostained only CD56 and CD57, which served as surrogate markers for NK cells (CD56) and a highly cytotoxic NK cell subpopulation (CD57) [32], respectively. Although CD56 is not solely specific to NK cells and is also expressed in NK-like T cells [29,30], dendritic cells, and monocytes, CD56 is considered the archetypical NK cell marker [31] and has been repeatedly used as an immunohistochemical surrogate marker for NK cells in different cancer entities including CRCs [40,41,46,87,88,89]. To characterize the functional relevance/activity of NK cells at SARIFAs in more depth, further investigations such as DSP, multiplexing, single-cell RNA sequencing, or studying the protein expression of proteins related to the NK cell-mediated cytotoxicity pathway [90] could add further insights. To better understand the role of CD3+ and CD8+ lymphocytes and possibly also of tertiary lymphoid structures in relation to SARIFA, further studies, deploying computational pathology approaches [91], are required. In addition, our molecular characterization of the majority of included cases gives an initial, yet not fully conclusive insight into the tumor genetics of SARIFA-positive CRCs.

5. Conclusions

In conclusion, our study proves that our newly introduced biomarker SARIFA is associated with distinct immunologic alterations: (i) a dramatic reduction in NK cells in the peripheral blood of SARIFA-positive CRC patients and (ii) a (potential) reduction of NK cells and NK-like lymphocytes at SARIFAs in CRC. Even though we believe the interplay between tumor cells, adipocytes, and immune cells at SARIFAs is a highly complex process and NK cells in the peripheral blood or locally represent only one aspect, our study reveals NK cells as potentially key players in the context of SARIFA that could be, at least to some extent, causally relevant to a poorer prognosis for SARIFA-positive CRC patients, and additionally, could be potentially exploited by the use of IO therapy. In summary, this study can be regarded as a potential starting point for further studies to investigate the complex interplay between tumor cells, immune cells, and tumor-associated adipocytes at SARIFAs.

Supplementary Materials

The following supporting information can be downloaded at: www.mdpi.com/article/10.3390/cancers15030994/s1, Figure S1: Gating strategy of peripheral blood lymphocytes [12,15,26,27,28]. Figure S2: Showing representative images as well as results of CD3 and CD8 IHC. Table S1: Fluorochrome antibody conjugates. The authors confirm that all Tables and Figures are original and that they own the copyright.

Author Contributions

J.W., A.R., P.L., B.M. and N.G.R. contributed to the study conception and design. S.D., E.S., P.G., B.G., F.S., S.E., P.N., F.J., P.L., J.W., B.M., A.R. and N.G.R. contributed to the data acquisition. J.W., B.G., S.D., P.L. and N.G.R. performed data analysis, interpretation, and visualization. J.W., A.R., P.L., B.M. and N.G.R. wrote the manuscript. All authors have read and agreed to the published version of the manuscript.

Funding

This research received no external funding.

Institutional Review Board Statement

The study was approved by the ethical committee of Ludwig Maximilian University of Munich (reference: Project number 18-726) and was performed in accordance with the Declaration of Helsinki.

Informed Consent Statement

Written informed consent was obtained from all patients prior to their inclusion in the study.

Data Availability Statement

The datasets generated during and/or analyzed during the current study are available from the corresponding author on reasonable request—and to some parts only in restricted form for privacy reasons.

Acknowledgments

The authors are grateful for Tatjana Lenskaja, Christian Beul, Andrea Seuser, Jenny Kleffel, and the whole section Molecular Pathology (Pathology & Molecular Diagnostics, University Hospital Augsburg). Of course, the authors are also extremely grateful to all the patients who agreed to participate in the study.

Conflicts of Interest

The authors declare no conflict of interest.

References

  1. Sung, H.; Ferlay, J.; Siegel, R.L.; Laversanne, M.; Soerjomataram, I.; Jemal, A.; Bray, F. Global Cancer Statistics 2020: GLOBOCAN Estimates of Incidence and Mortality Worldwide for 36 Cancers in 185 Countries. CA Cancer. J. Clin. 2021, 71, 209–249. [Google Scholar] [CrossRef] [PubMed]
  2. Sawicki, T.; Ruszkowska, M.; Danielewicz, A.; Niedzwiedzka, E.; Arlukowicz, T.; Przybylowicz, K.E. A Review of Colorectal Cancer in Terms of Epidemiology, Risk Factors, Development, Symptoms and Diagnosis. Cancers 2021, 13, 2025. [Google Scholar] [CrossRef] [PubMed]
  3. Bruni, D.; Angell, H.K.; Galon, J. The Immune Contexture and Immunoscore in Cancer Prognosis and Therapeutic Efficacy. Nat. Rev. Cancer 2020, 20, 662–680. [Google Scholar] [CrossRef]
  4. Pages, F.; Mlecnik, B.; Marliot, F.; Bindea, G.; Ou, F.; Bifulco, C.; Lugli, A.; Zlobec, I.; Rau, T.T.; Berger, M.D.; et al. International Validation of the Consensus Immunoscore for the Classification of Colon Cancer: A Prognostic and Accuracy Study. Lancet 2018, 391, 2128–2139. [Google Scholar] [CrossRef] [PubMed]
  5. Fridman, W.H.; Zitvogel, L.; Sautes-Fridman, C.; Kroemer, G. The Immune Contexture in Cancer Prognosis and Treatment. Nat. Rev. Clin. Oncol. 2017, 14, 717–734. [Google Scholar] [CrossRef] [PubMed]
  6. Bergsland, C.H.; Jeanmougin, M.; Moosavi, S.H.; Svindland, A.; Bruun, J.; Nesbakken, A.; Sveen, A.; Lothe, R.A. Spatial Analysis and CD25-Expression Identify Regulatory T Cells as Predictors of a Poor Prognosis in Colorectal Cancer. Mod. Pathol. 2022, 35, 1236–1246. [Google Scholar] [CrossRef]
  7. Shibutani, M.; Maeda, K.; Nagahara, H.; Fukuoka, T.; Nakao, S.; Matsutani, S.; Hirakawa, K.; Ohira, M. The Peripheral Monocyte Count is Associated with the Density of Tumor-Associated Macrophages in the Tumor Microenvironment of Colorectal Cancer: A Retrospective Study. BMC Cancer 2017, 17, 404. [Google Scholar] [CrossRef]
  8. Hamm, A.; Prenen, H.; Van Delm, W.; Di Matteo, M.; Wenes, M.; Delamarre, E.; Schmidt, T.; Weitz, J.; Sarmiento, R.; Dezi, A.; et al. Tumour-Educated Circulating Monocytes are Powerful Candidate Biomarkers for Diagnosis and Disease Follow-Up of Colorectal Cancer. Gut 2016, 65, 990–1000. [Google Scholar] [CrossRef]
  9. Cavalleri, T.; Greco, L.; Rubbino, F.; Hamada, T.; Quaranta, M.; Grizzi, F.; Sauta, E.; Craviotto, V.; Bossi, P.; Vetrano, S.; et al. Tumor-Associated Macrophages and Risk of Recurrence in Stage III Colorectal Cancer. J. Pathol. Clin. Res. 2022, 8, 307–312. [Google Scholar] [CrossRef]
  10. Wang, H.; Tian, T.; Zhang, J. Tumor-Associated Macrophages (TAMs) in Colorectal Cancer (CRC): From Mechanism to Therapy and Prognosis. Int. J. Mol. Sci. 2021, 22, 8470. [Google Scholar] [CrossRef]
  11. Xu, G.; Jiang, L.; Ye, C.; Qin, G.; Luo, Z.; Mo, Y.; Chen, J. The Ratio of CD86+/CD163+ Macrophages Predicts Postoperative Recurrence in Stage II-III Colorectal Cancer. Front. Immunol. 2021, 12, 724429. [Google Scholar] [CrossRef]
  12. Waidhauser, J.; Nerlinger, P.; Arndt, T.T.; Schiele, S.; Sommer, F.; Wolf, S.; Lohr, P.; Eser, S.; Muller, G.; Claus, R.; et al. Alterations of Circulating Lymphocyte Subsets in Patients with Colorectal Carcinoma. Cancer Immunol. Immunother. 2022, 71, 1937–1947. [Google Scholar] [CrossRef] [PubMed]
  13. Spacek, J.; Vocka, M.; Netikova, I.; Skalova, H.; Dundr, P.; Konopasek, B.; Zavadova, E.; Lubos, P. Immunological Examination of Peripheral Blood in Patients with Colorectal Cancer Compared to Healthy Controls. Immunol. Investig. 2018, 47, 643–653. [Google Scholar] [CrossRef]
  14. Jakubowska, K.; Koda, M.; Grudzinska, M.; Kanczuga-Koda, L.; Famulski, W. Monocyte-to-Lymphocyte Ratio as a Prognostic Factor in Peripheral Whole Blood Samples of Colorectal Cancer Patients. World J. Gastroenterol. 2020, 26, 4639–4655. [Google Scholar] [CrossRef] [PubMed]
  15. Waidhauser, J.; Nerlinger, P.; Sommer, F.; Wolf, S.; Eser, S.; Lohr, P.; Rank, A.; Markl, B. Circulating Lymphocytes Reflect the Local Immune Response in Patients with Colorectal Carcinoma. Diagnostics 2022, 12, 1408. [Google Scholar] [CrossRef]
  16. Martin, B.; Grosser, B.; Kempkens, L.; Miller, S.; Bauer, S.; Dhillon, C.; Banner, B.M.; Brendel, E.M.; Sipos, E.; Vlasenko, D.; et al. Stroma AReactive Invasion Front Areas (SARIFA)-A New Easily to Determine Biomarker in Colon Cancer-Results of a Retrospective Study. Cancers 2021, 13, 4880. [Google Scholar] [CrossRef]
  17. Grosser, B.; Gluckstein, M.I.; Dhillon, C.; Schiele, S.; Dintner, S.; VanSchoiack, A.; Kroeppler, D.; Martin, B.; Probst, A.; Vlasenko, D.; et al. Stroma AReactive Invasion Front Areas (SARIFA)-a New Prognostic Biomarker in Gastric Cancer Related to Tumor-Promoting Adipocytes. J. Pathol. 2022, 256, 71–82. [Google Scholar] [CrossRef] [PubMed]
  18. Vasseur, S.; Guillaumond, F. Lipids in Cancer: A Global View of the Contribution of Lipid Pathways to Metastatic Formation and Treatment Resistance. Oncogenesis 2022, 11, 46–48. [Google Scholar] [CrossRef]
  19. Wulczyn, E.; Steiner, D.F.; Moran, M.; Plass, M.; Reihs, R.; Tan, F.; Flament-Auvigne, I.; Brown, T.; Regitnig, P.; Chen, P.C.; et al. Interpretable Survival Prediction for Colorectal Cancer using Deep Learning. NPJ Digit. Med. 2021, 4, 71–72. [Google Scholar] [CrossRef]
  20. Foersch, S.; Glasner, C.; Woerl, A.; Eckstein, M.; Wagner, D.; Schulz, S.; Kellers, F.; Fernandez, A.; Tserea, K.; Kloth, M.; et al. Multistain Deep Learning for Prediction of Prognosis and Therapy Response in Colorectal Cancer. Nat. Med. 2023. [Google Scholar] [CrossRef]
  21. Lugli, A.; Kirsch, R.; Ajioka, Y.; Bosman, F.; Cathomas, G.; Dawson, H.; El Zimaity, H.; Flejou, J.; Hansen, T.P.; Hartmann, A.; et al. Recommendations for Reporting Tumor Budding in Colorectal Cancer Based on the International Tumor Budding Consensus Conference (ITBCC) 2016. Mod. Pathol. 2017, 30, 1299–1311. [Google Scholar] [CrossRef] [PubMed]
  22. Lord, A.; Brown, G.; Abulafi, M.; Bateman, A.; Frankel, W.; Goldin, R.; Gopal, P.; Kirsch, R.; Loughrey, M.B.; Markl, B.; et al. Histopathological Diagnosis of Tumour Deposits in Colorectal Cancer: A Delphi Consensus Study. Histopathology 2021, 79, 168–175. [Google Scholar] [CrossRef]
  23. Guinney, J.; Dienstmann, R.; Wang, X.; de Reynies, A.; Schlicker, A.; Soneson, C.; Marisa, L.; Roepman, P.; Nyamundanda, G.; Angelino, P.; et al. The Consensus Molecular Subtypes of Colorectal Cancer. Nat. Med. 2015, 21, 1350–1356. [Google Scholar] [CrossRef]
  24. Andre, T.; Shiu, K.; Kim, T.W.; Jensen, B.V.; Jensen, L.H.; Punt, C.; Smith, D.; Garcia-Carbonero, R.; Benavides, M.; Gibbs, P.; et al. Pembrolizumab in Microsatellite-Instability-High Advanced Colorectal Cancer. N. Engl. J. Med. 2020, 383, 2207–2218. [Google Scholar] [CrossRef] [PubMed]
  25. Wen, Y.; Xing, X.; Harris, J.W.; Zaytseva, Y.Y.; Mitov, M.I.; Napier, D.L.; Weiss, H.L.; Evers, B.M.; Gao, T. Adipocytes Activate Mitochondrial Fatty Acid Oxidation and Autophagy to Promote Tumor Growth in Colon Cancer. Cell. Death Dis. 2017, 8, e2593. [Google Scholar] [CrossRef]
  26. Rank, A.; Lohr, P.; Hoffmann, R.; Ebigbo, A.; Grutzner, S.; Schmid, C.; Claus, R. Sustained Cellular Immunity in Adults Recovered from Mild COVID-19. Cytom. A 2021, 99, 429–434. [Google Scholar] [CrossRef] [PubMed]
  27. Waidhauser, J.; Schuh, A.; Trepel, M.; Schmalter, A.; Rank, A. Chemotherapy Markedly Reduces B Cells but Not T Cells and NK Cells in Patients with Cancer. Cancer Immunol. Immunother. 2020, 69, 147–157. [Google Scholar] [CrossRef]
  28. Lohr, P.; Schiele, S.; Arndt, T.T.; Grutzner, S.; Claus, R.; Rommele, C.; Muller, G.; Schmid, C.; Dennehy, K.M.; Rank, A. Impact of Age and Gender on Lymphocyte Subset Counts in Patients with COVID-19. Cytom. A 2021, 1–9. [Google Scholar] [CrossRef]
  29. Bojarska-Junak, A.; Hus, I.; Sieklucka, M.; Wasik-Szczepanek, E.; Mazurkiewicz, T.; Polak, P.; Dmoszynska, A.; Rolinski, J. Natural Killer-Like T CD3+/CD16+CD56+ Cells in Chronic Lymphocytic Leukemia: Intracellular Cytokine Expression and Relationship with Clinical Outcome. Oncol. Rep. 2010, 24, 803–810. [Google Scholar] [CrossRef]
  30. Guilmot, A.; Carlier, Y.; Truyens, C. Differential IFN-Gamma Production by Adult and Neonatal Blood CD56+ Natural Killer (NK) and NK-Like-T Cells in Response to Trypanosoma Cruzi and IL-15. Parasite Immunol. 2014, 36, 43–52. [Google Scholar] [CrossRef] [Green Version]
  31. Van Acker, H.H.; Capsomidis, A.; Smits, E.L.; Van Tendeloo, V.F. CD56 in the Immune System: More than a Marker for Cytotoxicity? Front. Immunol. 2017, 8, 892. [Google Scholar] [CrossRef]
  32. Kared, H.; Martelli, S.; Ng, T.P.; Pender, S.L.F.; Larbi, A. CD57 in Human Natural Killer Cells and T-Lymphocytes. Cancer Immunol. Immunother. 2016, 65, 441–452. [Google Scholar] [CrossRef]
  33. Xu, H.; Cha, Y.J.; Clemenceau, J.R.; Choi, J.; Lee, S.H.; Kang, J.; Hwang, T.H. Spatial Analysis of Tumor-Infiltrating Lymphocytes in Histological Sections using Deep Learning Techniques Predicts Survival in Colorectal Carcinoma. J. Pathol. Clin. Res. 2022, 8, 327–339. [Google Scholar] [CrossRef]
  34. Vayrynen, J.P.; Vornanen, J.O.; Sajanti, S.; Bohm, J.P.; Tuomisto, A.; Makinen, M.J. An Improved Image Analysis Method for Cell Counting Lends Credibility to the Prognostic Significance of T Cells in Colorectal Cancer. Virchows Arch. 2012, 460, 455–465. [Google Scholar] [CrossRef]
  35. Cicek, M.S.; Lindor, N.M.; Gallinger, S.; Bapat, B.; Hopper, J.L.; Jenkins, M.A.; Young, J.; Buchanan, D.; Walsh, M.D.; Le Marchand, L.; et al. Quality Assessment and Correlation of Microsatellite Instability and Immunohistochemical Markers among Population- and Clinic-Based Colorectal Tumors Results from the Colon Cancer Family Registry. J. Mol. Diagn. 2011, 13, 271–281. [Google Scholar] [CrossRef]
  36. Mojtahed, A.; Schrijver, I.; Ford, J.M.; Longacre, T.A.; Pai, R.K. A Two-Antibody Mismatch Repair Protein Immunohistochemistry Screening Approach for Colorectal Carcinomas, Skin Sebaceous Tumors, and Gynecologic Tract Carcinomas. Mod. Pathol. 2011, 24, 1004–1014. [Google Scholar] [CrossRef]
  37. Hall, G.; Clarkson, A.; Shi, A.; Langford, E.; Leung, H.; Eckstein, R.P.; Gill, A.J. Immunohistochemistry for PMS2 and MSH6 Alone can Replace a Four Antibody Panel for Mismatch Repair Deficiency Screening in Colorectal Adenocarcinoma. Pathology 2010, 42, 409–413. [Google Scholar] [CrossRef]
  38. Reitsam, N.G.; Markl, B.; Dintner, S.; Waidhauser, J.; Vlasenko, D.; Grosser, B. Concurrent Loss of MLH1, PMS2 and MSH6 Immunoexpression in Digestive System Cancers Indicating a Widespread Dysregulation in DNA Repair Processes. Front. Oncol. 2022, 12, 1019798. [Google Scholar] [CrossRef] [PubMed]
  39. Tang, Y.; Xie, M.; Li, K.; Li, J.; Cai, Z.; Hu, B. Prognostic Value of Peripheral Blood Natural Killer Cells in Colorectal Cancer. BMC Gastroenterol. 2020, 20, 31–38. [Google Scholar] [CrossRef] [PubMed]
  40. Marechal, R.; De Schutter, J.; Nagy, N.; Demetter, P.; Lemmers, A.; Deviere, J.; Salmon, I.; Tejpar, S.; Van Laethem, J. Putative Contribution of CD56 Positive Cells in Cetuximab Treatment Efficacy in First-Line Metastatic Colorectal Cancer Patients. BMC Cancer 2010, 10, 340. [Google Scholar] [CrossRef] [PubMed]
  41. Alderdice, M.; Dunne, P.D.; Cole, A.J.; O’Reilly, P.G.; McArt, D.G.; Bingham, V.; Fuchs, M.; McQuaid, S.; Loughrey, M.B.; Murray, G.I.; et al. Natural Killer-Like Signature Observed Post Therapy in Locally Advanced Rectal Cancer is a Determinant of Pathological Response and Improved Survival. Mod. Pathol. 2017, 30, 1287–1298. [Google Scholar] [CrossRef]
  42. Chaput, N.; Svrcek, M.; Auperin, A.; Locher, C.; Drusch, F.; Malka, D.; Taieb, J.; Goere, D.; Ducreux, M.; Boige, V. Tumour-Infiltrating CD68+ and CD57+ Cells Predict Patient Outcome in Stage II-III Colorectal Cancer. Br. J. Cancer 2013, 109, 1013–1022. [Google Scholar] [CrossRef] [PubMed]
  43. Liska, V.; Vycital, O.; Daum, O.; Novak, P.; Treska, V.; Bruha, J.; Pitule, P.; Holubec, L. Infiltration of Colorectal Carcinoma by S100+ Dendritic Cells and CD57+ Lymphocytes as Independent Prognostic Factors After Radical Surgical Treatment. Anticancer Res. 2012, 32, 2129–2132. [Google Scholar] [PubMed]
  44. Coca, S.; Perez-Piqueras, J.; Martinez, D.; Colmenarejo, A.; Saez, M.A.; Vallejo, C.; Martos, J.A.; Moreno, M. The Prognostic Significance of Intratumoral Natural Killer Cells in Patients with Colorectal Carcinoma. Cancer 1997, 79, 2320–2328. [Google Scholar] [CrossRef]
  45. Papanikolaou, I.S.; Lazaris, A.C.; Apostolopoulos, P.; Kavantzas, N.; Papas, M.G.; Mavrogiannis, C.; Patsouris, E.S.; Archimandritis, A. Tissue Detection of Natural Killer Cells in Colorectal Adenocarcinoma. BMC Gastroenterol. 2004, 4, 20. [Google Scholar] [CrossRef] [PubMed]
  46. Zhang, S.; Liu, W.; Hu, B.; Wang, P.; Lv, X.; Chen, S.; Shao, Z. Prognostic Significance of Tumor-Infiltrating Natural Killer Cells in Solid Tumors: A Systematic Review and Meta-Analysis. Front. Immunol. 2020, 11, 1242. [Google Scholar] [CrossRef]
  47. Hu, G.; Wang, S. Prognostic Role of Tumor-Infiltrating CD57-Positive Lymphocytes in Solid Tumors: A Meta-Analysis. Oncotarget 2017, 9, 8111–8119. [Google Scholar] [CrossRef]
  48. Vayrynen, J.P.; Haruki, K.; Lau, M.C.; Vayrynen, S.A.; Ugai, T.; Akimoto, N.; Zhong, R.; Zhao, M.; Dias Costa, A.; Borowsky, J.; et al. Spatial Organization and Prognostic Significance of NK and NKT-Like Cells Via Multimarker Analysis of the Colorectal Cancer Microenvironment. Cancer. Immunol. Res. 2022, 10, 215–227. [Google Scholar] [CrossRef]
  49. Garrido, F.; Ruiz-Cabello, F.; Cabrera, T.; Perez-Villar, J.J.; Lopez-Botet, M.; Duggan-Keen, M.; Stern, P.L. Implications for Immunosurveillance of Altered HLA Class I Phenotypes in Human Tumours. Immunol. Today 1997, 18, 89–95. [Google Scholar] [CrossRef]
  50. Stabile, H.; Fionda, C.; Gismondi, A.; Santoni, A. Role of Distinct Natural Killer Cell Subsets in Anticancer Response. Front. Immunol. 2017, 8, 293. [Google Scholar] [CrossRef] [Green Version]
  51. Corvino, D.; Kumar, A.; Bald, T. Plasticity of NK Cells in Cancer. Front. Immunol. 2022, 13, 888313. [Google Scholar] [CrossRef]
  52. Cooper, M.A.; Fehniger, T.A.; Caligiuri, M.A. The Biology of Human Natural Killer-Cell Subsets. Trends Immunol. 2001, 22, 633–640. [Google Scholar] [CrossRef] [PubMed]
  53. Mukherjee, A.; Bilecz, A.J.; Lengyel, E. The Adipocyte Microenvironment and Cancer. Cancer Metastasis Rev. 2022, 41, 575–587. [Google Scholar] [CrossRef]
  54. Wu, Q.; Li, B.; Li, J.; Sun, S.; Yuan, J.; Sun, S. Cancer-Associated Adipocytes as Immunomodulators in Cancer. Biomark Res. 2021, 9, 2–6. [Google Scholar] [CrossRef] [PubMed]
  55. Niavarani, S.R.; Lawson, C.; Bakos, O.; Boudaud, M.; Batenchuk, C.; Rouleau, S.; Tai, L. Lipid Accumulation Impairs Natural Killer Cell Cytotoxicity and Tumor Control in the Postoperative Period. BMC Cancer 2019, 19, 823-y. [Google Scholar] [CrossRef]
  56. Sica, A.; Schioppa, T.; Mantovani, A.; Allavena, P. Tumour-Associated Macrophages are a Distinct M2 Polarised Population Promoting Tumour Progression: Potential Targets of Anti-Cancer Therapy. Eur. J. Cancer 2006, 42, 717–727. [Google Scholar] [CrossRef]
  57. Brockmoeller, S.; Echle, A.; Ghaffari Laleh, N.; Eiholm, S.; Malmstrom, M.L.; Plato Kuhlmann, T.; Levic, K.; Grabsch, H.I.; West, N.P.; Saldanha, O.L.; et al. Deep Learning Identifies Inflamed Fat as a Risk Factor for Lymph Node Metastasis in Early Colorectal Cancer. J. Pathol. 2022, 256, 269–281. [Google Scholar] [CrossRef]
  58. Koelzer, V.H.; Lugli, A. The Tumor Border Configuration of Colorectal Cancer as a Histomorphological Prognostic Indicator. Front. Oncol. 2014, 4, 29. [Google Scholar] [CrossRef] [PubMed]
  59. Bindea, G.; Mlecnik, B.; Tosolini, M.; Kirilovsky, A.; Waldner, M.; Obenauf, A.C.; Angell, H.; Fredriksen, T.; Lafontaine, L.; Berger, A.; et al. Spatiotemporal Dynamics of Intratumoral Immune Cells Reveal the Immune Landscape in Human Cancer. Immunity 2013, 39, 782–795. [Google Scholar] [CrossRef] [PubMed]
  60. Mlecnik, B.; Bindea, G.; Angell, H.K.; Maby, P.; Angelova, M.; Tougeron, D.; Church, S.E.; Lafontaine, L.; Fischer, M.; Fredriksen, T.; et al. Integrative Analyses of Colorectal Cancer show Immunoscore is a Stronger Predictor of Patient Survival than Microsatellite Instability. Immunity 2016, 44, 698–711. [Google Scholar] [CrossRef] [Green Version]
  61. Liu, J.; Huang, X.; Liu, H.; Wei, C.; Ru, H.; Qin, H.; Lai, H.; Meng, Y.; Wu, G.; Xie, W.; et al. Immune Landscape and Prognostic Immune-Related Genes in KRAS-Mutant Colorectal Cancer Patients. J. Transl. Med. 2021, 19, 27–29. [Google Scholar] [CrossRef] [PubMed]
  62. Fu, X.; Wang, X.; Duanmu, J.; Li, T.; Jiang, Q. KRAS Mutations are Negatively Correlated with Immunity in Colon Cancer. Aging (Albany NY) 2020, 13, 750–768. [Google Scholar] [CrossRef] [PubMed]
  63. Kocian, P.; Sedivcova, M.; Drgac, J.; Cerna, K.; Hoch, J.; Kodet, R.; Bartunkova, J.; Spisek, R.; Fialova, A. Tumor-Infiltrating Lymphocytes and Dendritic Cells in Human Colorectal Cancer: Their Relationship to KRAS Mutational Status and Disease Recurrence. Hum. Immunol. 2011, 72, 1022–1028. [Google Scholar] [CrossRef]
  64. Vail, E.; Song, J.; Xu, J.; Frye, J.S.; Kim, J.T.; Pao, A.; Schreck, R.; Aguiluz, A.S.; Zhang, W.; Alkan, S.; et al. Comparison of Large, Medium, and Small Solid Tumor Gene Panels for Detection of Clinically Actionable Mutations in Cancer. Target Oncol. 2020, 15, 523–530. [Google Scholar] [CrossRef]
  65. Misyura, M.; Zhang, T.; Sukhai, M.A.; Thomas, M.; Garg, S.; Kamel-Reid, S.; Stockley, T.L. Comparison of Next-Generation Sequencing Panels and Platforms for Detection and Verification of Somatic Tumor Variants for Clinical Diagnostics. J. Mol. Diagn. 2016, 18, 842–850. [Google Scholar] [CrossRef] [PubMed]
  66. Galon, J.; Costes, A.; Sanchez-Cabo, F.; Kirilovsky, A.; Mlecnik, B.; Lagorce-Pages, C.; Tosolini, M.; Camus, M.; Berger, A.; Wind, P.; et al. Type, Density, and Location of Immune Cells within Human Colorectal Tumors Predict Clinical Outcome. Science 2006, 313, 1960–1964. [Google Scholar] [CrossRef]
  67. Kather, J.N.; Suarez-Carmona, M.; Charoentong, P.; Weis, C.; Hirsch, D.; Bankhead, P.; Horning, M.; Ferber, D.; Kel, I.; Herpel, E.; et al. Topography of Cancer-Associated Immune Cells in Human Solid Tumors. Elife 2018, 7, 36967. [Google Scholar] [CrossRef]
  68. Schurch, C.M.; Bhate, S.S.; Barlow, G.L.; Phillips, D.J.; Noti, L.; Zlobec, I.; Chu, P.; Black, S.; Demeter, J.; McIlwain, D.R.; et al. Coordinated Cellular Neighborhoods Orchestrate Antitumoral Immunity at the Colorectal Cancer Invasive Front. Cell 2020, 182, 1341–1359.e19. [Google Scholar] [CrossRef] [PubMed]
  69. Nearchou, I.P.; Lillard, K.; Gavriel, C.G.; Ueno, H.; Harrison, D.J.; Caie, P.D. Automated Analysis of Lymphocytic Infiltration, Tumor Budding, and their Spatial Relationship Improves Prognostic Accuracy in Colorectal Cancer. Cancer. Immunol. Res. 2019, 7, 609–620. [Google Scholar] [CrossRef] [PubMed]
  70. Pelka, K.; Hofree, M.; Chen, J.H.; Sarkizova, S.; Pirl, J.D.; Jorgji, V.; Bejnood, A.; Dionne, D.; Ge, W.H.; Xu, K.H.; et al. Spatially Organized Multicellular Immune Hubs in Human Colorectal Cancer. Cell 2021, 184, 4734–4752.e20. [Google Scholar] [CrossRef]
  71. Beechem, J.M. High-Plex Spatially Resolved RNA and Protein Detection using Digital Spatial Profiling: A Technology Designed for Immuno-Oncology Biomarker Discovery and Translational Research. Methods Mol. Biol. 2020, 2055, 563–583. [Google Scholar] [PubMed]
  72. Merritt, C.R.; Ong, G.T.; Church, S.E.; Barker, K.; Danaher, P.; Geiss, G.; Hoang, M.; Jung, J.; Liang, Y.; McKay-Fleisch, J.; et al. Multiplex Digital Spatial Profiling of Proteins and RNA in Fixed Tissue. Nat. Biotechnol. 2020, 38, 586–599. [Google Scholar] [CrossRef] [PubMed]
  73. Kather, J.N.; Halama, N. Harnessing the Innate Immune System and Local Immunological Microenvironment to Treat Colorectal Cancer. Br. J. Cancer 2019, 120, 871–882. [Google Scholar] [CrossRef]
  74. Liu, S.; Galat, V.; Galat, Y.; Lee, Y.K.A.; Wainwright, D.; Wu, J. NK Cell-Based Cancer Immunotherapy: From Basic Biology to Clinical Development. J. Hematol. Oncol. 2021, 14, 7-w. [Google Scholar] [CrossRef]
  75. Della Chiesa, M.; Setti, C.; Giordano, C.; Obino, V.; Greppi, M.; Pesce, S.; Marcenaro, E.; Rutigliani, M.; Provinciali, N.; Paleari, L.; et al. NK Cell-Based Immunotherapy in Colorectal Cancer. Vaccines 2022, 10, 1033. [Google Scholar] [CrossRef] [PubMed]
  76. Makowska, A.; Meier, S.; Shen, L.; Busson, P.; Baloche, V.; Kontny, U. Anti-PD-1 Antibody Increases NK Cell Cytotoxicity Towards Nasopharyngeal Carcinoma Cells in the Context of Chemotherapy-Induced Upregulation of PD-1 and PD-L1. Cancer Immunol. Immunother. 2021, 70, 323–336. [Google Scholar] [CrossRef]
  77. Hsu, J.; Hodgins, J.J.; Marathe, M.; Nicolai, C.J.; Bourgeois-Daigneault, M.; Trevino, T.N.; Azimi, C.S.; Scheer, A.K.; Randolph, H.E.; Thompson, T.W.; et al. Contribution of NK Cells to Immunotherapy Mediated by PD-1/PD-L1 Blockade. J. Clin. Invest. 2018, 128, 4654–4668. [Google Scholar] [CrossRef]
  78. Quatrini, L.; Mariotti, F.R.; Munari, E.; Tumino, N.; Vacca, P.; Moretta, L. The Immune Checkpoint PD-1 in Natural Killer Cells: Expression, Function and Targeting in Tumour Immunotherapy. Cancers 2020, 12, 3285. [Google Scholar] [CrossRef]
  79. Munari, E.; Quatrini, L.; Ciancaglini, C.; Eccher, A.; Bogina, G.; Moretta, L.; Mariotti, F.R. Immunotherapy Targeting Inhibitory Checkpoints: The Role of NK and Other Innate Lymphoid Cells. Semin. Immunol. 2022, 61–64, 101660. [Google Scholar] [CrossRef]
  80. Pesce, S.; Greppi, M.; Grossi, F.; Del Zotto, G.; Moretta, L.; Sivori, S.; Genova, C.; Marcenaro, E. PD/1-PD-Ls Checkpoint: Insight on the Potential Role of NK Cells. Front. Immunol. 2019, 10, 1242. [Google Scholar] [CrossRef]
  81. Grottoli, M.; Carrega, P.; Zullo, L.; Dellepiane, C.; Rossi, G.; Parisi, F.; Barletta, G.; Zinoli, L.; Coco, S.; Alama, A.; et al. Immune Checkpoint Blockade: A Strategy to Unleash the Potential of Natural Killer Cells in the Anti-Cancer Therapy. Cancers 2022, 14, 5046. [Google Scholar] [CrossRef]
  82. Chalabi, M.; Fanchi, L.F.; Dijkstra, K.K.; Van den Berg, J.G.; Aalbers, A.G.; Sikorska, K.; Lopez-Yurda, M.; Grootscholten, C.; Beets, G.L.; Snaebjornsson, P.; et al. Neoadjuvant Immunotherapy Leads to Pathological Responses in MMR-Proficient and MMR-Deficient Early-Stage Colon Cancers. Nat. Med. 2020, 26, 566–576. [Google Scholar] [CrossRef] [PubMed]
  83. Papageorgiou, G.I.; Fergadis, E.; Skouteris, N.; Christakos, E.; Tsakatikas, S.A.; Lianos, E.; Kosmas, C. Case Report: Combination of Olaparib with Chemotherapy in a Patient with ATM-Deficient Colorectal Cancer. Front. Oncol. 2021, 11, 788809. [Google Scholar] [CrossRef] [PubMed]
  84. Zhou, P.; Wu, X.; Chen, H.; Hu, Y.; Zhang, H.; Wu, L.; Yang, Y.; Mao, B.; Wang, H. The Mutational Pattern of Homologous Recombination-Related (HRR) Genes in Chinese Colon Cancer and its Relevance to Immunotherapy Responses. Aging (Albany NY) 2020, 13, 2365–2378. [Google Scholar] [CrossRef] [PubMed]
  85. Vikas, P.; Borcherding, N.; Chennamadhavuni, A.; Garje, R. Therapeutic Potential of Combining PARP Inhibitor and Immunotherapy in Solid Tumors. Front. Oncol. 2020, 10, 570. [Google Scholar] [CrossRef]
  86. Kimura, H.; Sakai, K.; Arao, T.; Shimoyama, T.; Tamura, T.; Nishio, K. Antibody-Dependent Cellular Cytotoxicity of Cetuximab Against Tumor Cells with Wild-Type Or Mutant Epidermal Growth Factor Receptor. Cancer Sci. 2007, 98, 1275–1280. [Google Scholar] [CrossRef] [PubMed]
  87. Wulff, S.; Pries, R.; Borngen, K.; Trenkle, T.; Wollenberg, B. Decreased Levels of Circulating Regulatory NK Cells in Patients with Head and Neck Cancer Throughout all Tumor Stages. Anticancer Res. 2009, 29, 3053–3057. [Google Scholar]
  88. Bouzidi, L.; Triki, H.; Charfi, S.; Kridis, W.B.; Derbel, M.; Ayadi, L.; Sellami-Boudawara, T.; Cherif, B. Prognostic Value of Natural Killer Cells Besides Tumor-Infiltrating Lymphocytes in Breast Cancer Tissues. Clin. Breast Cancer 2021, 21, e738–e747. [Google Scholar] [CrossRef]
  89. Levi, I.; Amsalem, H.; Nissan, A.; Darash-Yahana, M.; Peretz, T.; Mandelboim, O.; Rachmilewitz, J. Characterization of Tumor Infiltrating Natural Killer Cell Subset. Oncotarget 2015, 6, 13835–13843. [Google Scholar] [CrossRef]
  90. Hinterseher, I.; Schworer, C.M.; Lillvis, J.H.; Stahl, E.; Erdman, R.; Gatalica, Z.; Tromp, G.; Kuivaniemi, H. Immunohistochemical Analysis of the Natural Killer Cell Cytotoxicity Pathway in Human Abdominal Aortic Aneurysms. Int. J. Mol. Sci. 2015, 16, 11196–11212. [Google Scholar] [CrossRef]
  91. Bilal, M.; Nimir, M.; Snead, D.; Taylor, G.S.; Rajpoot, N. Role of AI and Digital Pathology for Colorectal Immuno-Oncology. Br. J. Cancer 2022, 128, 3–11. [Google Scholar] [CrossRef] [PubMed]
Figure 1. Representative H&E stains of SARIFAs as well as non-SARIFAs ((A,C); scale bar = 200 µm; (B,D); scale bar = 50 µm). Even in SARIFA-positive CRCs (SARIFA marked by *) some parts of the invasive margin are non-SARIFA (marked by an arrow; (E), scale bar = 400 µm). Additionally, rarer subtypes of CRC, such as mucinous adenocarcinoma with signet-ring cells, can show SARIFA ((F,) scale bar = 100 µm).
Cancers 15 00994 g001
Figure 2. Comparison of lymphocyte subsets between SARIFA-positive (red) and SARIFA-negative (blue) CRC patients: Main lymphocyte subsets (A), B cell subsets (B), T cell subsets (C), CD4+ T cell subsets (D), CD8+ T cell subsets (E). Small white lines indicate individual data points; large black lines show the overall subset average of SARIFA-positive and SARIFA-negative CRC patients, respectively. * p < 0.05, ** p < 0.01.
Cancers 15 00994 g002
Figure 3. Comparison of NK cells in general (A) and CD56+ CD16+ subtype (B) as well as between CD56dim CD16bright (C) and CD56bright CD16dim (D) NK cell subtypes between healthy controls (yellow), SARIFA-pos(itive) (red) and SARIFA-neg(ative) (blue) CRC patients. Small white lines indicate individual data points; large black lines show the overall subset average of SARIFA-positive and SARIFA-negative CRC patients, respectively. * p < 0.05, ** p < 0.01, *** p < 0.001, **** p < 0.0001.
Cancers 15 00994 g003
Figure 4. Representative immunohistochemical stains for CD56 ((A,B); scale bar = 50 µm and 20 µm, respectively). Boxplots showing the amount of CD56+ lymphocytes per high-power field (HPF, 400×), comparing between SARIFA-positive (SARIFA) and SARIFA-negative CRCs (non-SARIFA) at IF and TC (C) and comparing SARIFAs vs. non-SARIFAs, only within SARIFA-positive CRCs (D) as SARIFA-positive CRCs also show non-SARIFAs at the invasive margin (see Figure 1E). ns = not significant (p < 0.05). ** for p < 0.01, **** for p < 0.0001.
Cancers 15 00994 g004
Figure 5. Representative immunohistochemical stains for CD57 ((A,B); scale bar = 50 µm and 20 µm, respectively). Boxplots showing the amount of CD57+ lymphocytes per high-power field (HPF, 400×), comparing between SARIFA-positive (SARIFA) and SARIFA-negative CRCs (non-SARIFA) at IF and TC (C), and comparing SARIFAs vs. non-SARIFAs, only within SARIFA-positive CRCs (D) as SARIFA-positive CRCs also show non-SARIFAs at the invasive margin (see Figure 1E). ns = not significant (at p < 0.05). **** for p < 0.0001.
Cancers 15 00994 g005
Table 1. Demographic and Disease Characteristics of CRC patients.
VariableSARIFA-PositiveSARIFA-Negativep-Value
n = 15 (33.3%)n = 30 (67.7%)
Age: median (range)61 (42–77)68 (48–84)0.043
Gender
male; n (%)10 (66.7)8 (26.7)0.012
female; n (%)5 (33.3)22 (73.3)
Stage
UICC I and II; n (%)7 (46.7)21 (70.0)ns
UICC III and IV; n (%)8 (53.3)9 (30.0)
Tumor sidedness
right n (%)11 (73.3)20 (66.7)ns
left n (%)4 (26.7)10 (33.3)
Microsatellite status
stable n (%)12 (80.0)22 (73.3)ns
unstable n (%)3 (20.0)7 (23.3)
information not available 1
ns = not significant (at p < 0.05). Significant p-values are highlighted in bold.
Table 2. NGS-based molecular characterization of SARIFA-positive/negative CRCs.
GeneMutational Status:
wt/mut
SARIFA-Positive
n = 15 *
SARIFA-Negative
n = 23 *
p-Value
KRASwt6 (40.0%)13 (56.5%)ns
mut9 (60.0%)10 (43.5%)
BRAFwt14 (93.3%)18 (78.3%)ns
mut1 (6.7%)5 (21.7%)
NRASwt14 (93.3%)22 (95.7%)ns
mut1 (6.7%)1 (4.3%)
PIK3CAwt11 (73.3%)18 (78.3%)ns
mut4 (26.7%)5 (21.7%)
CTNNB1wt15 (100%)22 (95.7%)ns
mut0 (0%)1 (4.3%)
FGFR1wt15 (100%)22 (95.7%)ns
mut0 (0%)1 (4.3%)
FGFR3wt15 (100%)22 (95.7%)ns
mut0 (0%)1 (4.3%)
ERBB2wt15 (100%)22 (95.7%)ns
mut0 (0%)1 (4.3%)
METwt15 (100%)22 (95.7%)ns
mut0 (0%)1 (4.3%)
AKT1wt15 (100%)22 (95.7%)ns
mut0 (0%)1 (4.3%)
ns = not significant (p < 0.05); mutational status: mut = mutant; wt = wildtype. * NGS-based multigene testing was possible in 38 of 45 (84.4%) cases of the entire cohort: in 15 of 15 (100%) SARIFA-positive CRCs, and in 23 of 30 (76.7%) SARIFA-positive CRCS.
Table 3. Lymphocyte subsets in healthy controls, SARIFA-positive and SARIFA-negative CRC patients.
Healthy Controls
n = 27
SARIFA-Positive
n = 15
SARIFA-Negative
n = 30
p1
SARIFApos-SARIFAneg
p2
Healthy-SARIFAneg
p3
Healthy-SARIFApos
Total lymphocytes1795 (1195–2216)1388 (1185–1687)1288 (965–1623)ns0.038ns
CD3+ cells1101 (671–1678)876 (783–1320)866 (714–1142)nsnsns
CD8+ cells228 (191–364)228 (184–397)233 (118–325)nsnsns
Naive48 (9–70)51 (33–83)25 (15–58)nsnsns
Memory102 (55–133)63 (39–124)84 (49–117)nsnsns
CM21 (4–40)24 (13–33)23 (13–55)nsnsns
EM79 (47–126)76 (35–148)72 (47–101)nsnsns
EMRA68 (23–134)69 (18–148)29 (16–110)nsnsns
Early160 (89–206)133 (94–165)78 (56–181)ns0.025ns
Intermediate20 (10–30)13 (6–30)10 (6–24)nsnsns
Late36 (22–87)58 (42–201)51 (18–126)nsnsns
Exhausted81 (51–133)82 (29–114)53 (23–79)ns0.019ns
Terminal effector21 (12–63)39 (15–135)31 (9–97)nsnsns
HLA-DR+31 (10–45)92 (56–177)60 (36–112)ns0.0110.002
CD69+21 (17–46)19 (12–32)13 (7–24)ns0.037ns
CD4+ cells634 (487–1042)547 (268–773)524 (406–640)nsnsns
Naive282 (143–371)218 (59–441)157 (117–239)nsnsns
Memory411 (255–552)311 (182–366)303 (234–386)nsns0.027
CM198 (91- 289)190 (109–250)190 (139–236)nsnsns
EM181 (98–268)99 (63–169)123 (82–163)nsns0.05
EMRA14 (1–44)4 (2–8)8 (1–26)nsnsns
Th128 (13–61)17 (14–33)19 (8–44)nsnsns
Th248 (34–81)40 (16–63)47 (33–60)nsnsns
Th1767 (36–83)40 (17–70)48 (33–60)nsnsns
CD25high11 (6–18)10 (7–32)15 (9–24)nsnsns
HLA-DR+39 (27–64)50 (34–62)51 (44–67)ns0.0110.002
CD69+12 (7–19)13 (11–21)14 (9–18)ns0.037ns
NK cells189 (125–281)87 (59–117)187 (118–252)0.002ns<0.001
CD56dim CD16bright12 (9–19)6 (4–12)14 (8–25)0.004ns0.004
CD56+ CD16+162 (98–264)56 (36–90)151 (103–220)<0.001ns<0.001
CD56bright CD16dim15 (10–19)10 (9–14)11 (8–15)nsnsns
NK-like T cells47 (18–83)47 (21–67)34 (17–134)nsnsns
B cells208 (146–236)122 (85–205)123 (62–165)ns<0.001ns
Naive116 (88–164)88 (58–152)69 (37–99)ns0.006ns
Memory7 (5–9)8 (4–12)6 (2–15)nsnsns
Class switch25 (16–41)18 (12–21)11 (6–28)ns0.002ns
Transitory7 (5–14)1 (1–2)2 (1–4)ns<0.001<0.001
CD4/CD8 Ratio3 (2–4)2 (1–3)3 (2–4)nsnsns
ns = not signficant (at p < 0.05). Significant p-values are highlighted in bold. Cell counts are given as median value/µL (interquartile range). p-values (adjusted) are given for pairwise comparisons using Wilcoxon test with Benjamini-Hochberg correction for following comparisons: p1) SARIFA-positive vs SARIFA-negative, p2) healthy controls vs SARIFA-negative, p3) healthy controls vs SARIFA-positive.
Disclaimer/Publisher’s Note: The statements, opinions and data contained in all publications are solely those of the individual author(s) and contributor(s) and not of MDPI and/or the editor(s). MDPI and/or the editor(s) disclaim responsibility for any injury to people or property resulting from any ideas, methods, instructions or products referred to in the content.

