
Functionally and Metabolically Divergent Melanoma-Associated Macrophages Originate from Common Bone-Marrow Precursors
 , , and
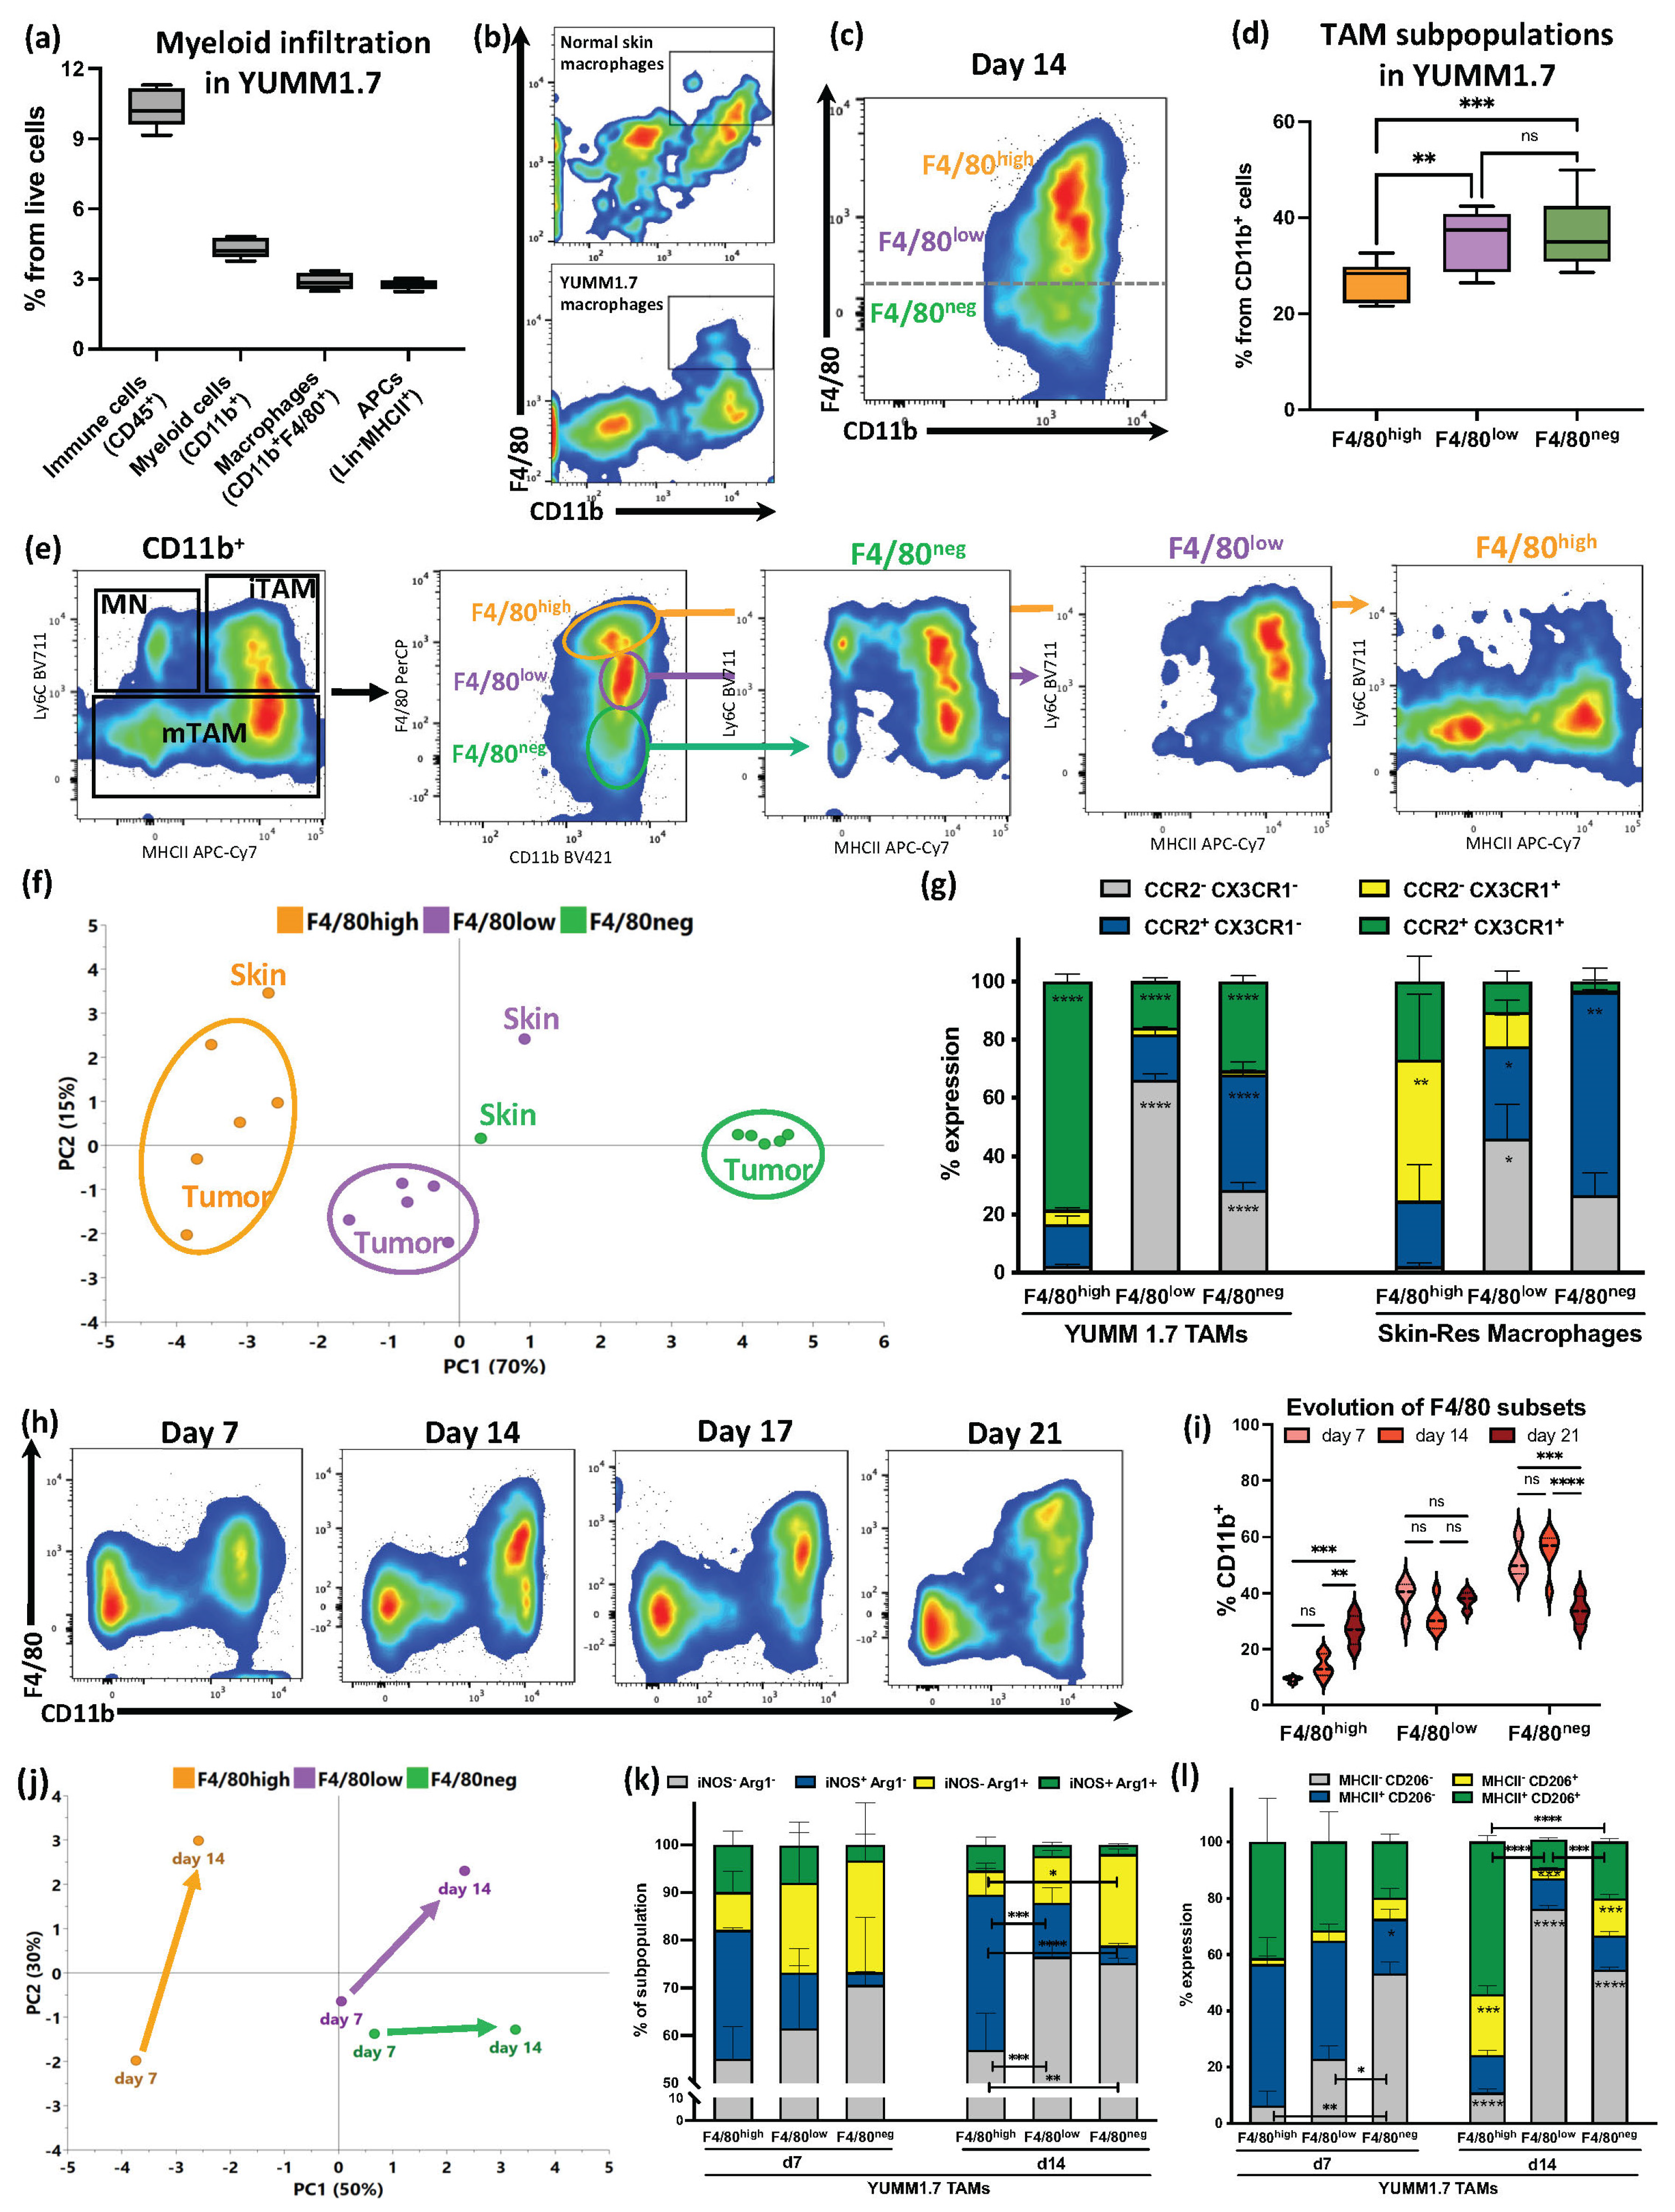
Abstract
:Simple Summary
Abstract
1. Introduction
2. Materials and Methods
2.1. Animals
2.2. Cell Culture
2.3. Tumor Studies and Sample Processing
2.4. Histology and Immunofluorescence
2.5. Flow Cytometry
2.6. Bone Marrow (BM) Transplant
2.7. Bulk RNA Sequencing (RNA-Seq) Analysis
2.8. Fluorescent Bead-Based Multiplex Protein Secretion Profiling
2.9. Statistical Analysis
3. Results
3.1. F4/80 Expression Defined YUMM1.7 Melanoma TAM Subsets with Partial Similarities with Skin-Resident Macrophages That Evolved during Tumor Progression
3.2. Despite Exhibiting Some Skin-Resident-like Features, Melanoma TAMs Originated Almost Exclusively from Circulating Monocytes
3.3. Melanoma F4/80+ TAM Subsets Have Distinct Immunosuppressive Profiles with Specific Active Metabolic and Functional Pathways
4. Discussion
5. Conclusions
Supplementary Materials
Author Contributions
Funding
Institutional Review Board Statement
Informed Consent Statement
Data Availability Statement
Acknowledgments
Conflicts of Interest
References
- Siegel, R.L.; Miller, K.D.; Wagle, N.S.; Jemal, A. Cancer statistics, 2023. CA Cancer J. Clin. 2023, 73, 17–48. [Google Scholar] [CrossRef]
- Mantovani, A.; Allavena, P.; Marchesi, F.; Garlanda, C. Macrophages as tools and targets in cancer therapy. Nat. Rev. Drug. Discov. 2022, 21, 799–820. [Google Scholar] [CrossRef] [PubMed]
- Perry, C.J.; Munoz-Rojas, A.R.; Meeth, K.M.; Kellman, L.N.; Amezquita, R.A.; Thakral, D.; Du, V.Y.; Wang, J.X.; Damsky, W.; Kuhlmann, A.L.; et al. Myeloid-targeted immunotherapies act in synergy to induce inflammation and antitumor immunity. J. Exp. Med. 2018, 215, 877–893. [Google Scholar] [CrossRef] [PubMed] [Green Version]
- Hu, Q.; Wu, G.; Wang, R.; Ma, H.; Zhang, Z.; Xue, Q. Cutting edges and therapeutic opportunities on tumor-associated macrophages in lung cancer. Front. Immunol. 2022, 13, 1007812. [Google Scholar] [CrossRef] [PubMed]
- Sica, A.; Mantovani, A. Macrophage plasticity and polarization: In vivo veritas. J. Clin. Invest. 2012, 122, 787–795. [Google Scholar] [CrossRef] [PubMed]
- Hoves, S.; Ooi, C.H.; Wolter, C.; Sade, H.; Bissinger, S.; Schmittnaegel, M.; Ast, O.; Giusti, A.M.; Wartha, K.; Runza, V.; et al. Rapid activation of tumor-associated macrophages boosts preexisting tumor immunity. J. Exp. Med. 2018, 215, 859–876. [Google Scholar] [CrossRef]
- Murray, P.J.; Allen, J.E.; Biswas, S.K.; Fisher, E.A.; Gilroy, D.W.; Goerdt, S.; Gordon, S.; Hamilton, J.A.; Ivashkiv, L.B.; Lawrence, T.; et al. Macrophage activation and polarization: Nomenclature and experimental guidelines. Immunity 2014, 41, 14–20. [Google Scholar] [CrossRef] [Green Version]
- Pizzurro, G.A.; Liu, C.; Bridges, K.; Alexander, A.F.; Huang, A.; Baskaran, J.P.; Ramseier, J.; Bosenberg, M.W.; Mak, M.; Miller-Jensen, K. 3D Model of the Early Melanoma Microenvironment Captures Macrophage Transition into a Tumor-Promoting Phenotype. Cancers 2021, 13, 4579. [Google Scholar] [CrossRef]
- Guilliams, M.; Dutertre, C.A.; Scott, C.L.; McGovern, N.; Sichien, D.; Chakarov, S.; Van Gassen, S.; Chen, J.; Poidinger, M.; De Prijck, S.; et al. Unsupervised High-Dimensional Analysis Aligns Dendritic Cells across Tissues and Species. Immunity 2016, 45, 669–684. [Google Scholar] [CrossRef] [Green Version]
- Schulz, C.; Gomez Perdiguero, E.; Chorro, L.; Szabo-Rogers, H.; Cagnard, N.; Kierdorf, K.; Prinz, M.; Wu, B.; Jacobsen, S.E.; Pollard, J.W.; et al. A lineage of myeloid cells independent of Myb and hematopoietic stem cells. Science 2012, 336, 86–90. [Google Scholar] [CrossRef] [Green Version]
- Gomez Perdiguero, E.; Klapproth, K.; Schulz, C.; Busch, K.; Azzoni, E.; Crozet, L.; Garner, H.; Trouillet, C.; de Bruijn, M.F.; Geissmann, F.; et al. Tissue-resident macrophages originate from yolk-sac-derived erythro-myeloid progenitors. Nature 2015, 518, 547–551. [Google Scholar] [CrossRef]
- Hashimoto, D.; Chow, A.; Noizat, C.; Teo, P.; Beasley, M.B.; Leboeuf, M.; Becker, C.D.; See, P.; Price, J.; Lucas, D.; et al. Tissue-resident macrophages self-maintain locally throughout adult life with minimal contribution from circulating monocytes. Immunity 2013, 38, 792–804. [Google Scholar] [CrossRef] [Green Version]
- Franklin, R.A.; Liao, W.; Sarkar, A.; Kim, M.V.; Bivona, M.R.; Liu, K.; Pamer, E.G.; Li, M.O. The cellular and molecular origin of tumor-associated macrophages. Science 2014, 344, 921–925. [Google Scholar] [CrossRef] [Green Version]
- Gautier, E.L.; Shay, T.; Miller, J.; Greter, M.; Jakubzick, C.; Ivanov, S.; Helft, J.; Chow, A.; Elpek, K.G.; Gordonov, S.; et al. Gene-expression profiles and transcriptional regulatory pathways that underlie the identity and diversity of mouse tissue macrophages. Nat. Immunol. 2012, 13, 1118–1128. [Google Scholar] [CrossRef] [Green Version]
- Baranska, A.; Shawket, A.; Jouve, M.; Baratin, M.; Malosse, C.; Voluzan, O.; Vu Manh, T.P.; Fiore, F.; Bajenoff, M.; Benaroch, P.; et al. Unveiling skin macrophage dynamics explains both tattoo persistence and strenuous removal. J. Exp. Med. 2018, 215, 1115–1133. [Google Scholar] [CrossRef] [Green Version]
- Soncin, I.; Sheng, J.; Chen, Q.; Foo, S.; Duan, K.; Lum, J.; Poidinger, M.; Zolezzi, F.; Karjalainen, K.; Ruedl, C. The tumour microenvironment creates a niche for the self-renewal of tumour-promoting macrophages in colon adenoma. Nat. Commun. 2018, 9, 582. [Google Scholar] [CrossRef] [Green Version]
- Zhu, Y.; Herndon, J.M.; Sojka, D.K.; Kim, K.W.; Knolhoff, B.L.; Zuo, C.; Cullinan, D.R.; Luo, J.; Bearden, A.R.; Lavine, K.J.; et al. Tissue-Resident Macrophages in Pancreatic Ductal Adenocarcinoma Originate from Embryonic Hematopoiesis and Promote Tumor Progression. Immunity 2017, 47, 323–338 e326. [Google Scholar] [CrossRef]
- Franklin, R.A.; Li, M.O. Ontogeny of Tumor-associated Macrophages and Its Implication in Cancer Regulation. Trends Cancer 2016, 2, 20–34. [Google Scholar] [CrossRef] [Green Version]
- Adams, R.; Osborn, G.; Mukhia, B.; Laddach, R.; Willsmore, Z.; Chenoweth, A.; Geh, J.L.C.; MacKenzie Ross, A.D.; Healy, C.; Barber, L.; et al. Influencing tumor-associated macrophages in malignant melanoma with monoclonal antibodies. Oncoimmunology 2022, 11, 2127284. [Google Scholar] [CrossRef]
- Zhang, X.M.; Chen, D.G.; Li, S.C.; Zhu, B.; Li, Z.J. Embryonic Origin and Subclonal Evolution of Tumor-Associated Macrophages Imply Preventive Care for Cancer. Cells 2021, 10, 903. [Google Scholar] [CrossRef]
- Hong, H.S.; Mbah, N.E.; Shan, M.; Loesel, K.; Lin, L.; Sajjakulnukit, P.; Correa, L.O.; Andren, A.; Lin, J.; Hayashi, A.; et al. OXPHOS promotes apoptotic resistance and cellular persistence in T(H)17 cells in the periphery and tumor microenvironment. Sci. Immunol. 2022, 7, eabm8182. [Google Scholar] [CrossRef] [PubMed]
- Li, J.; Bolyard, C.; Xin, G.; Li, Z. Targeting Metabolic Pathways of Myeloid Cells Improves Cancer Immunotherapy. Front. Cell. Dev. Biol. 2021, 9, 747863. [Google Scholar] [CrossRef] [PubMed]
- Reinfeld, B.I.; Madden, M.Z.; Wolf, M.M.; Chytil, A.; Bader, J.E.; Patterson, A.R.; Sugiura, A.; Cohen, A.S.; Ali, A.; Do, B.T.; et al. Cell-programmed nutrient partitioning in the tumour microenvironment. Nature 2021, 593, 282–288. [Google Scholar] [CrossRef] [PubMed]
- Kshitiz; Afzal, J.; Suhail, Y.; Chang, H.; Hubbi, M.E.; Hamidzadeh, A.; Goyal, R.; Liu, Y.; Sun, P.; Nicoli, S.; et al. Lactate-dependent chaperone-mediated autophagy induces oscillatory HIF-1alpha activity promoting proliferation of hypoxic cells. Cell. Syst. 2022, 3, 1048–1064.e7. [Google Scholar] [CrossRef]
- Colegio, O.R.; Chu, N.Q.; Szabo, A.L.; Chu, T.; Rhebergen, A.M.; Jairam, V.; Cyrus, N.; Brokowski, C.E.; Eisenbarth, S.C.; Phillips, G.M.; et al. Functional polarization of tumour-associated macrophages by tumour-derived lactic acid. Nature 2014, 513, 559–563. [Google Scholar] [CrossRef] [Green Version]
- Zhang, L.; Li, Z.; Skrzypczynska, K.M.; Fang, Q.; Zhang, W.; O’Brien, S.A.; He, Y.; Wang, L.; Zhang, Q.; Kim, A.; et al. Single-Cell Analyses Inform Mechanisms of Myeloid-Targeted Therapies in Colon Cancer. Cell. 2020, 181, 442–459 e429. [Google Scholar] [CrossRef]
- Meeth, K.; Wang, J.X.; Micevic, G.; Damsky, W.; Bosenberg, M.W. The YUMM lines: A series of congenic mouse melanoma cell lines with defined genetic alterations. Pigment. Cell. Melanoma Res. 2016, 29, 590–597. [Google Scholar] [CrossRef]
- Trouplin, V.; Boucherit, N.; Gorvel, L.; Conti, F.; Mottola, G.; Ghigo, E. Bone marrow-derived macrophage production. J. Vis. Exp. 2013, 81, e50966. [Google Scholar] [CrossRef] [Green Version]
- Love, M.I.; Huber, W.; Anders, S. Moderated estimation of fold change and dispersion for RNA-seq data with DESeq2. Genome Biol. 2014, 15, 550. [Google Scholar] [CrossRef] [Green Version]
- Wickham, H. Ggplot2 Elegant Graphics for Data Analysis Introduction; Use R.; Springer: New York, NY, USA, 2009; pp. 1–7. [Google Scholar] [CrossRef]
- Luo, W.; Friedman, M.S.; Shedden, K.; Hankenson, K.D.; Woolf, P.J. GAGE: Generally applicable gene set enrichment for pathway analysis. BMC Bioinform. 2009, 10, 161. [Google Scholar] [CrossRef] [Green Version]
- Subramanian, A.; Tamayo, P.; Mootha, V.K.; Mukherjee, S.; Ebert, B.L.; Gillette, M.A.; Paulovich, A.; Pomeroy, S.L.; Golub, T.R.; Lander, E.S.; et al. Gene set enrichment analysis: A knowledge-based approach for interpreting genome-wide expression profiles. Proc. Natl. Acad. Sci. USA 2005, 102, 15545–15550. [Google Scholar] [CrossRef] [Green Version]
- Wang, J.; Perry, C.J.; Meeth, K.; Thakral, D.; Damsky, W.; Micevic, G.; Kaech, S.; Blenman, K.; Bosenberg, M. UV-induced somatic mutations elicit a functional T cell response in the YUMMER1.7 mouse melanoma model. Pigment. Cell. Melanoma Res. 2017, 30, 428–435. [Google Scholar] [CrossRef] [Green Version]
- Malosse, C.; Henri, S. Isolation of Mouse Dendritic Cell Subsets and Macrophages from the Skin. Methods Mol. Biol. 2016, 1423, 129–137. [Google Scholar] [CrossRef]
- Etzerodt, A.; Tsalkitzi, K.; Maniecki, M.; Damsky, W.; Delfini, M.; Baudoin, E.; Moulin, M.; Bosenberg, M.; Graversen, J.H.; Auphan-Anezin, N.; et al. Specific targeting of CD163(+) TAMs mobilizes inflammatory monocytes and promotes T cell-mediated tumor regression. J. Exp. Med. 2019, 216, 2394–2411. [Google Scholar] [CrossRef]
- Muller, S.; Kohanbash, G.; Liu, S.J.; Alvarado, B.; Carrera, D.; Bhaduri, A.; Watchmaker, P.B.; Yagnik, G.; Di Lullo, E.; Malatesta, M.; et al. Single-cell profiling of human gliomas reveals macrophage ontogeny as a basis for regional differences in macrophage activation in the tumor microenvironment. Genome Biol. 2017, 18, 234. [Google Scholar] [CrossRef] [Green Version]
- Casanova, M.L.; Larcher, F.; Casanova, B.; Murillas, R.; Fernandez-Acenero, M.J.; Villanueva, C.; Martinez-Palacio, J.; Ullrich, A.; Conti, C.J.; Jorcano, J.L. A critical role for ras-mediated, epidermal growth factor receptor-dependent angiogenesis in mouse skin carcinogenesis. Cancer Res. 2002, 62, 3402–3407. [Google Scholar]
- Opzoomer, J.W.; Anstee, J.E.; Dean, I.; Hill, E.J.; Bouybayoune, I.; Caron, J.; Muliaditan, T.; Gordon, P.; Sosnowska, D.; Nuamah, R.; et al. Macrophages orchestrate the expansion of a proangiogenic perivascular niche during cancer progression. Sci. Adv. 2021, 7, eabg9518. [Google Scholar] [CrossRef]
- Summers, K.M.; Bush, S.J.; Hume, D.A. Network analysis of transcriptomic diversity amongst resident tissue macrophages and dendritic cells in the mouse mononuclear phagocyte system. PLoS Biol. 2020, 18, e3000859. [Google Scholar] [CrossRef]
- Casanova-Acebes, M.; Dalla, E.; Leader, A.M.; LeBerichel, J.; Nikolic, J.; Morales, B.M.; Brown, M.; Chang, C.; Troncoso, L.; Chen, S.T.; et al. Tissue-resident macrophages provide a pro-tumorigenic niche to early NSCLC cells. Nature 2021, 595, 578–584. [Google Scholar] [CrossRef]
- Lin, J.D.; Nishi, H.; Poles, J.; Niu, X.; McCauley, C.; Rahman, K.; Brown, E.J.; Yeung, S.T.; Vozhilla, N.; Weinstock, A.; et al. Single-cell analysis of fate-mapped macrophages reveals heterogeneity, including stem-like properties, during atherosclerosis progression and regression. JCI Insight 2019, 4, e124574. [Google Scholar] [CrossRef] [Green Version]
- Chakarov, S.; Lim, H.Y.; Tan, L.; Lim, S.Y.; See, P.; Lum, J.; Zhang, X.M.; Foo, S.; Nakamizo, S.; Duan, K.; et al. Two distinct interstitial macrophage populations coexist across tissues in specific subtissular niches. Science 2019, 363, eaau0964. [Google Scholar] [CrossRef]
- Wang, P.L.; Yim, A.K.Y.; Kim, K.W.; Avey, D.; Czepielewski, R.S.; Colonna, M.; Milbrandt, J.; Randolph, G.J. Peripheral nerve resident macrophages share tissue-specific programming and features of activated microglia. Nat. Commun. 2020, 11, 2552. [Google Scholar] [CrossRef] [PubMed]
- Nirmal, A.J.; Maliga, Z.; Vallius, T.; Quattrochi, B.; Chen, A.A.; Jacobson, C.A.; Pelletier, R.J.; Yapp, C.; Arias-Camison, R.; Chen, Y.A.; et al. The Spatial Landscape of Progression and Immunoediting in Primary Melanoma at Single-Cell Resolution. Cancer Discov. 2022, 12, 1518–1541. [Google Scholar] [CrossRef] [PubMed]
- Martinek, J.; Lin, J.; Kim, K.I.; Wang, V.G.; Wu, T.C.; Chiorazzi, M.; Boruchov, H.; Gulati, A.; Seeniraj, S.; Sun, L.; et al. Transcriptional profiling of macrophages in situ in metastatic melanoma reveals localization-dependent phenotypes and function. Cell. Rep. Med. 2022, 3, 100621. [Google Scholar] [CrossRef] [PubMed]
- Schoenfeld, D.A.; Merkin, R.D.; Moutafi, M.; Martinez, S.; Adeniran, A.; Kumar, D.; Jilaveanu, L.; Hurwitz, M.; Rimm, D.L.; Kluger, H.M. Location matters: LAG3 levels are lower in renal cell carcinoma metastatic sites compared to primary tumors, and expression at metastatic sites only may have prognostic importance. Front. Oncol. 2022, 12, 990367. [Google Scholar] [CrossRef] [PubMed]
- Kielbassa, K.; Vegna, S.; Ramirez, C.; Akkari, L. Understanding the Origin and Diversity of Macrophages to Tailor Their Targeting in Solid Cancers. Front. Immunol. 2019, 10, 2215. [Google Scholar] [CrossRef]
- Eisinger, S.; Sarhan, D.; Boura, V.F.; Ibarlucea-Benitez, I.; Tyystjarvi, S.; Oliynyk, G.; Arsenian-Henriksson, M.; Lane, D.; Wikstrom, S.L.; Kiessling, R.; et al. Targeting a scavenger receptor on tumor-associated macrophages activates tumor cell killing by natural killer cells. Proc. Natl. Acad. Sci. USA 2020, 117, 32005–32016. [Google Scholar] [CrossRef]
- Furman, S.A.; Stern, A.M.; Uttam, S.; Taylor, D.L.; Pullara, F.; Chennubhotla, S.C. In situ functional cell phenotyping reveals microdomain networks in colorectal cancer recurrence. Cell. Rep. Methods 2021, 1, 100072. [Google Scholar] [CrossRef]
- Wang, S.; Liu, G.; Li, Y.; Pan, Y. Metabolic Reprogramming Induces Macrophage Polarization in the Tumor Microenvironment. Front. Immunol. 2022, 13, 840029. [Google Scholar] [CrossRef]
- Su, P.; Wang, Q.; Bi, E.; Ma, X.; Liu, L.; Yang, M.; Qian, J.; Yi, Q. Enhanced Lipid Accumulation and Metabolism Are Required for the Differentiation and Activation of Tumor-Associated Macrophages. Cancer Res. 2020, 80, 1438–1450. [Google Scholar] [CrossRef]
- De-Brito, N.M.; Duncan-Moretti, J.; Da-Costa, H.C.; Saldanha-Gama, R.; Paula-Neto, H.A.; Dorighello, G.; Simões, R.L.; Barja-Fidalgo, C. Aerobic glycolysis is a metabolic requirement to maintain the M2-like polarization of tumor-associated macrophages. Biochim. Biophys. Acta Mol. Cell. Res. 2020, 1867, 118604. [Google Scholar] [CrossRef]
- Liu, P.S.; Wang, H.; Li, X.; Chao, T.; Teav, T.; Christen, S.; Di Conza, G.; Cheng, W.C.; Chou, C.H.; Vavakova, M.; et al. alpha-ketoglutarate orchestrates macrophage activation through metabolic and epigenetic reprogramming. Nat. Immunol. 2017, 18, 985–994. [Google Scholar] [CrossRef]
- Kelly, B.; O’Neill, L.A. Metabolic reprogramming in macrophages and dendritic cells in innate immunity. Cell. Res. 2015, 25, 771–784. [Google Scholar] [CrossRef] [Green Version]
- Hasan, M.N.; Capuk, O.; Patel, S.M.; Sun, D. The Role of Metabolic Plasticity of Tumor-Associated Macrophages in Shaping the Tumor Microenvironment Immunity. Cancers 2022, 14, 3331. [Google Scholar] [CrossRef]
- Wu, L.; Hollinshead, K.E.R.; Hao, Y.; Au, C.; Kroehling, L.; Ng, C.; Lin, W.Y.; Li, D.; Silva, H.M.; Shin, J.; et al. Niche-Selective Inhibition of Pathogenic Th17 Cells by Targeting Metabolic Redundancy. Cell. 2020, 182, 641–654 e620. [Google Scholar] [CrossRef]
- Mittal, A.; Wang, M.; Vidyarthi, A.; Yanez, D.; Pizzurro, G.; Thakral, D.; Tracy, E.; Colegio, O.R. Topical arginase inhibition decreases growth of cutaneous squamous cell carcinoma. Sci. Rep. 2021, 11, 10731. [Google Scholar] [CrossRef]


Disclaimer/Publisher’s Note: The statements, opinions and data contained in all publications are solely those of the individual author(s) and contributor(s) and not of MDPI and/or the editor(s). MDPI and/or the editor(s) disclaim responsibility for any injury to people or property resulting from any ideas, methods, instructions or products referred to in the content. |
© 2023 by the authors. Licensee MDPI, Basel, Switzerland. This article is an open access article distributed under the terms and conditions of the Creative Commons Attribution (CC BY) license (https://creativecommons.org/licenses/by/4.0/).
Share and Cite
Pizzurro, G.A.; Bridges, K.; Jiang, X.; Vidyarthi, A.; Miller-Jensen, K.; Colegio, O.R. Functionally and Metabolically Divergent Melanoma-Associated Macrophages Originate from Common Bone-Marrow Precursors. Cancers 2023, 15, 3330. https://doi.org/10.3390/cancers15133330
Pizzurro GA, Bridges K, Jiang X, Vidyarthi A, Miller-Jensen K, Colegio OR. Functionally and Metabolically Divergent Melanoma-Associated Macrophages Originate from Common Bone-Marrow Precursors. Cancers. 2023; 15(13):3330. https://doi.org/10.3390/cancers15133330
Chicago/Turabian StylePizzurro, Gabriela A., Kate Bridges, Xiaodong Jiang, Aurobind Vidyarthi, Kathryn Miller-Jensen, and Oscar R. Colegio. 2023. "Functionally and Metabolically Divergent Melanoma-Associated Macrophages Originate from Common Bone-Marrow Precursors" Cancers 15, no. 13: 3330. https://doi.org/10.3390/cancers15133330