Appendix A
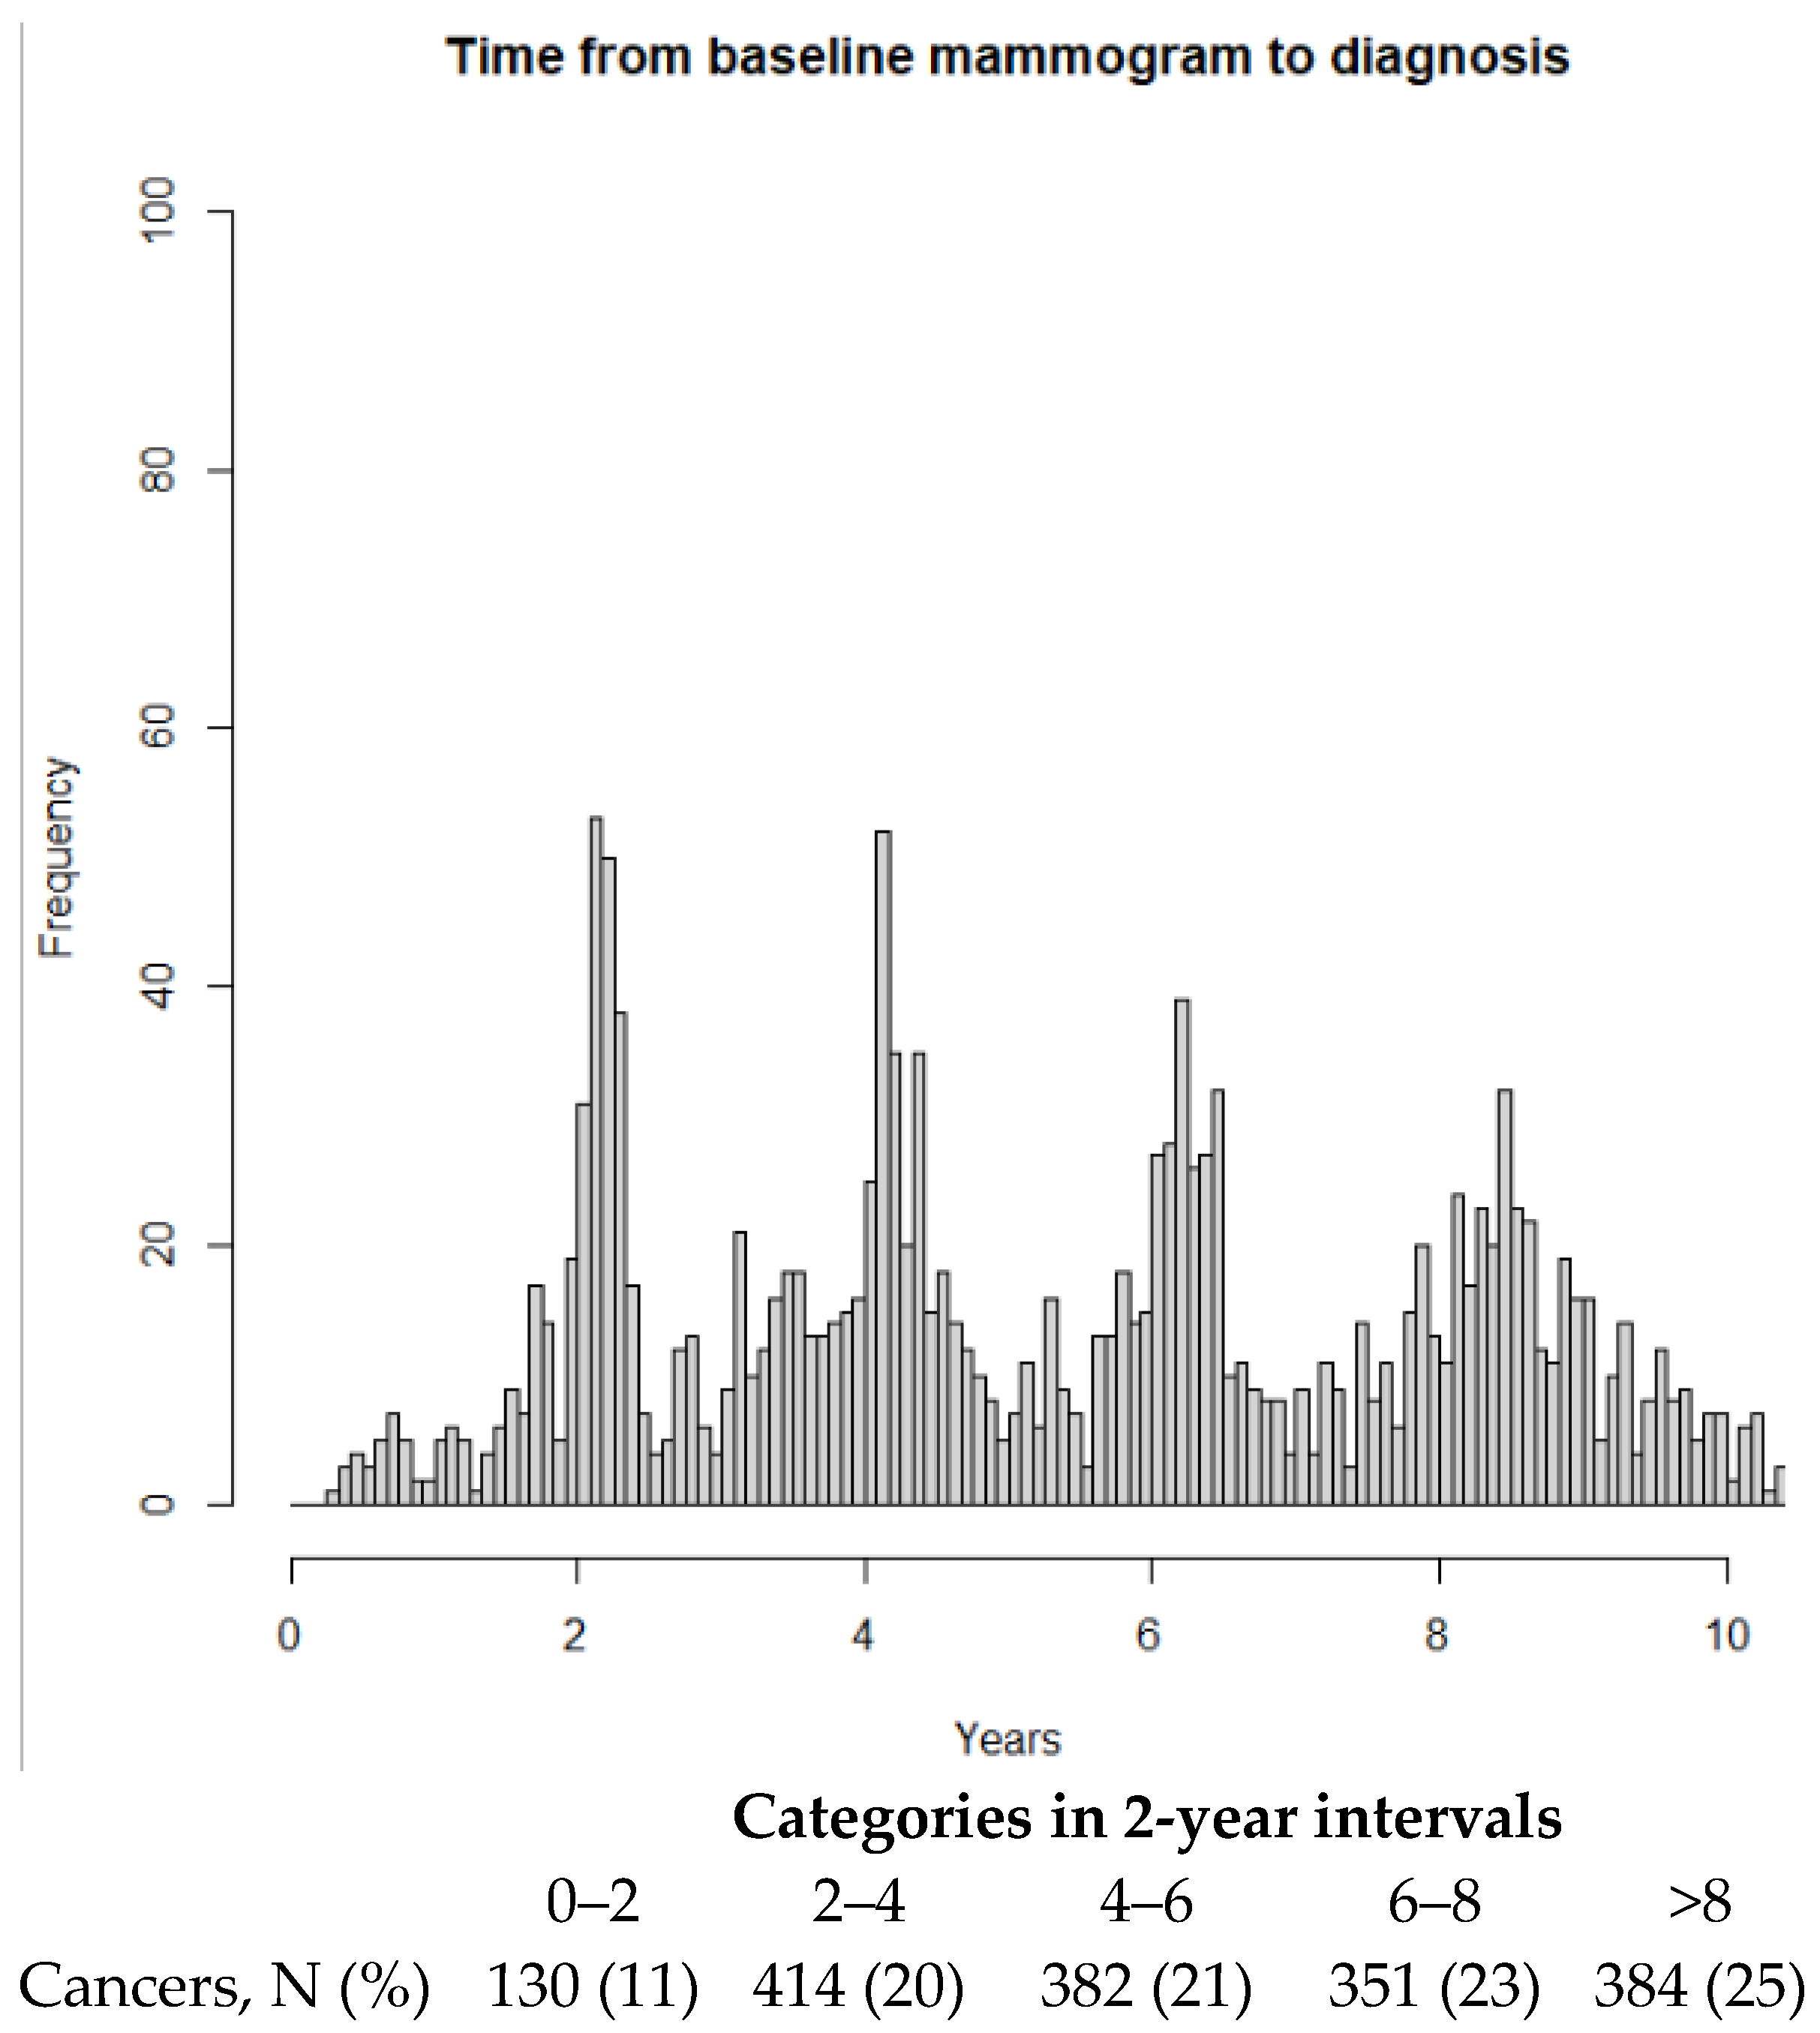
Figure A1.
Time from mammogram at enrollment to breast cancer diagnosis. N = 1661 breast cancer cases were assessed for risk of breast cancer at enrollment. Min: 0.3 years, median: 4.8, mean: 5.2, max: 11.2 years.
Figure A1.
Time from mammogram at enrollment to breast cancer diagnosis. N = 1661 breast cancer cases were assessed for risk of breast cancer at enrollment. Min: 0.3 years, median: 4.8, mean: 5.2, max: 11.2 years.
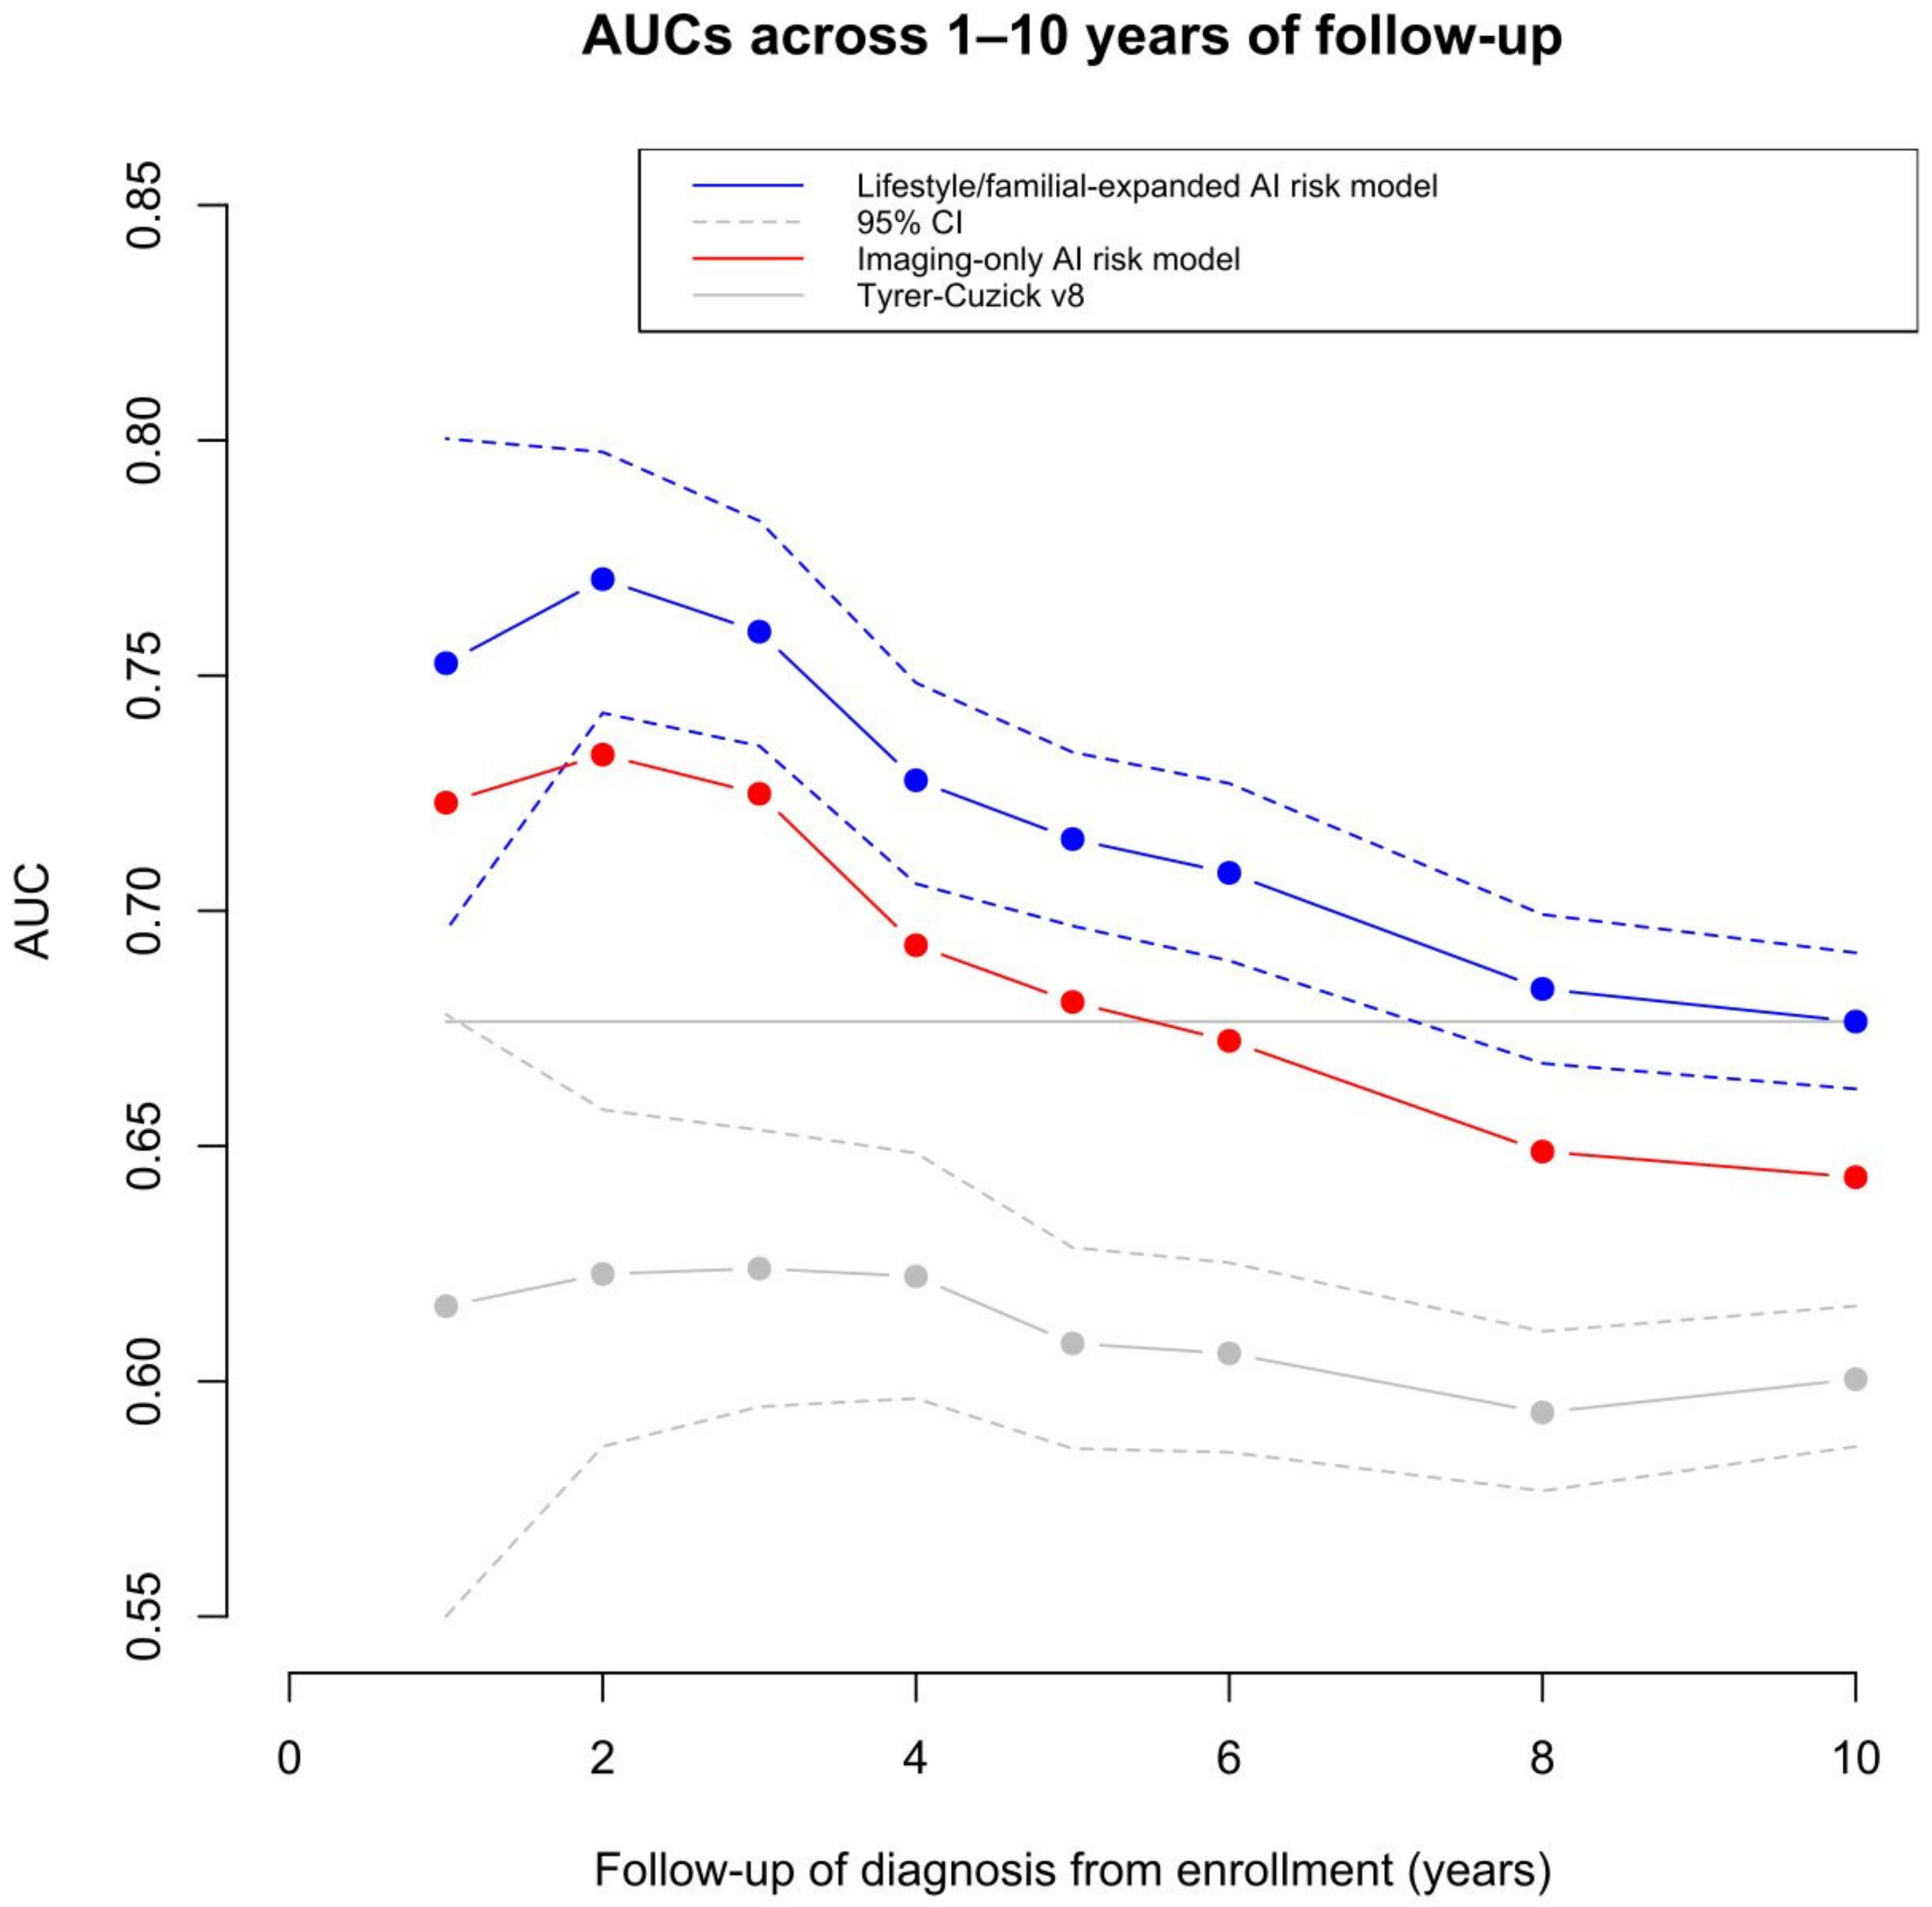
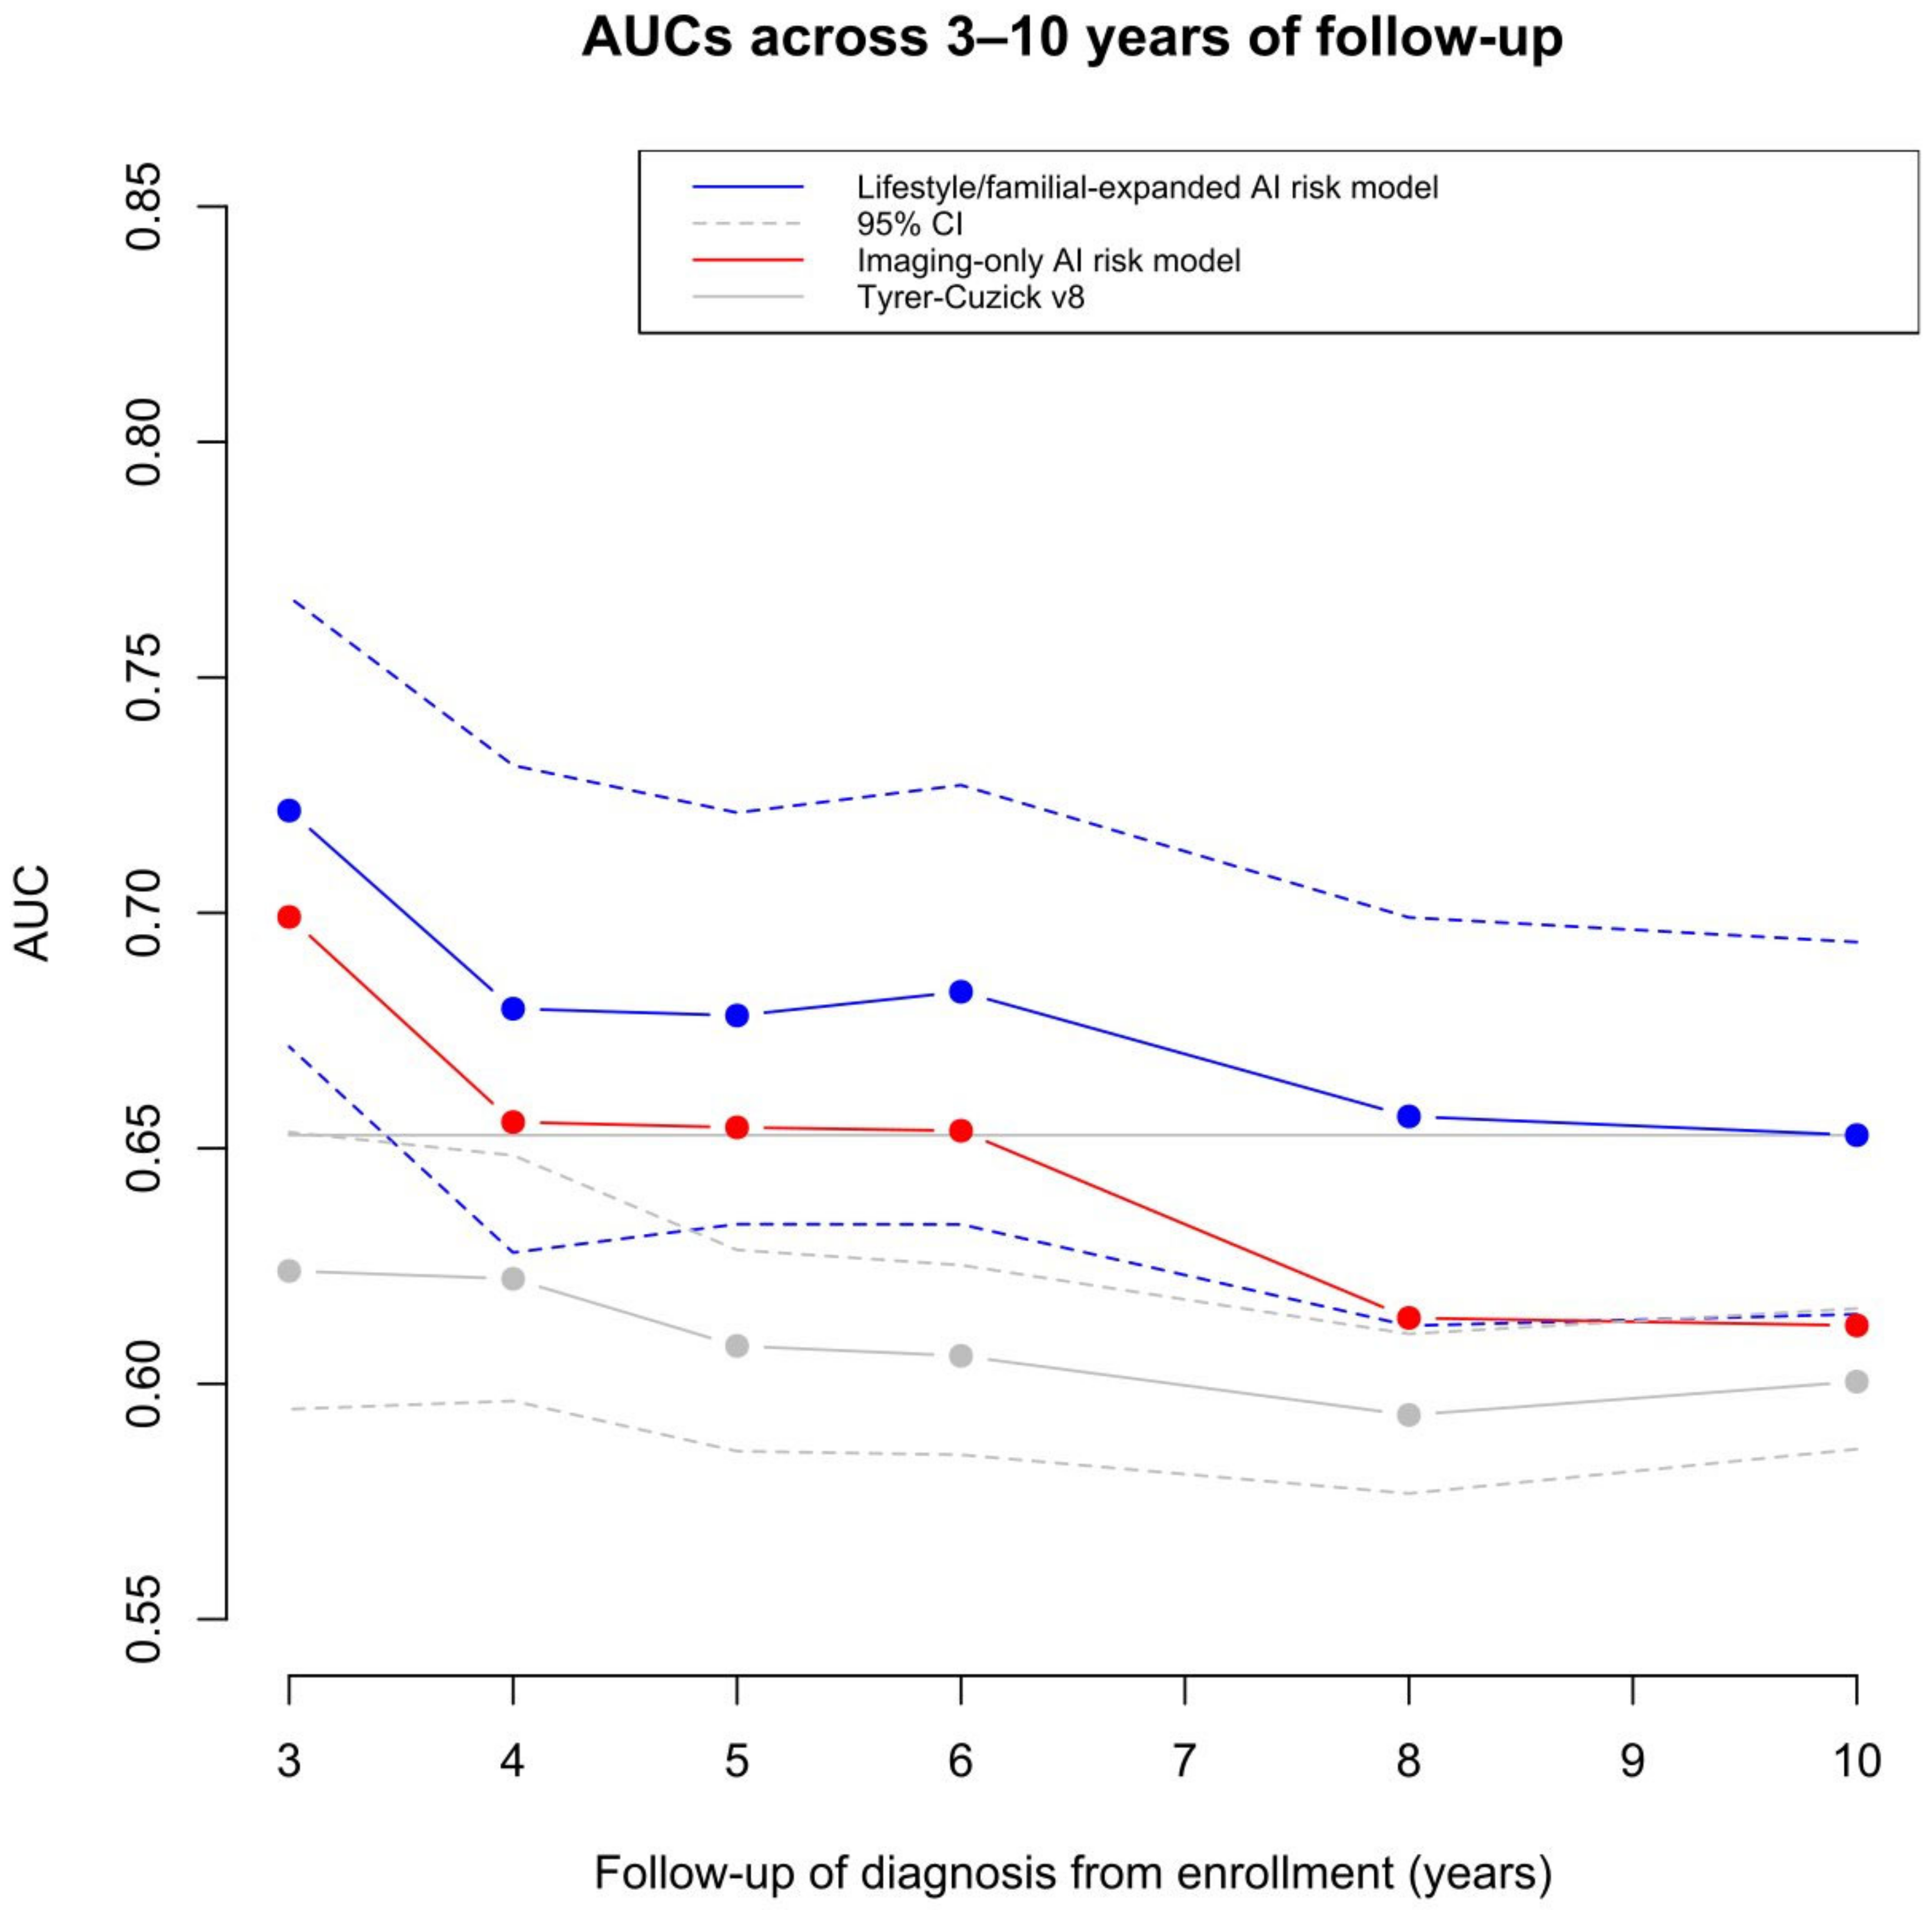
Figure A2.
Age adjusted discriminatory performance of the imaging-only AI risk model, the lifestyle/familial-expanded AI risk model, and the Tyrer–Cuzick v8 risk model 3–10 years after enrollment. The 95% confidence intervals are presented for the lifestyle/familial-expanded AI risk model and Tyrer–Cuzick v8 model.
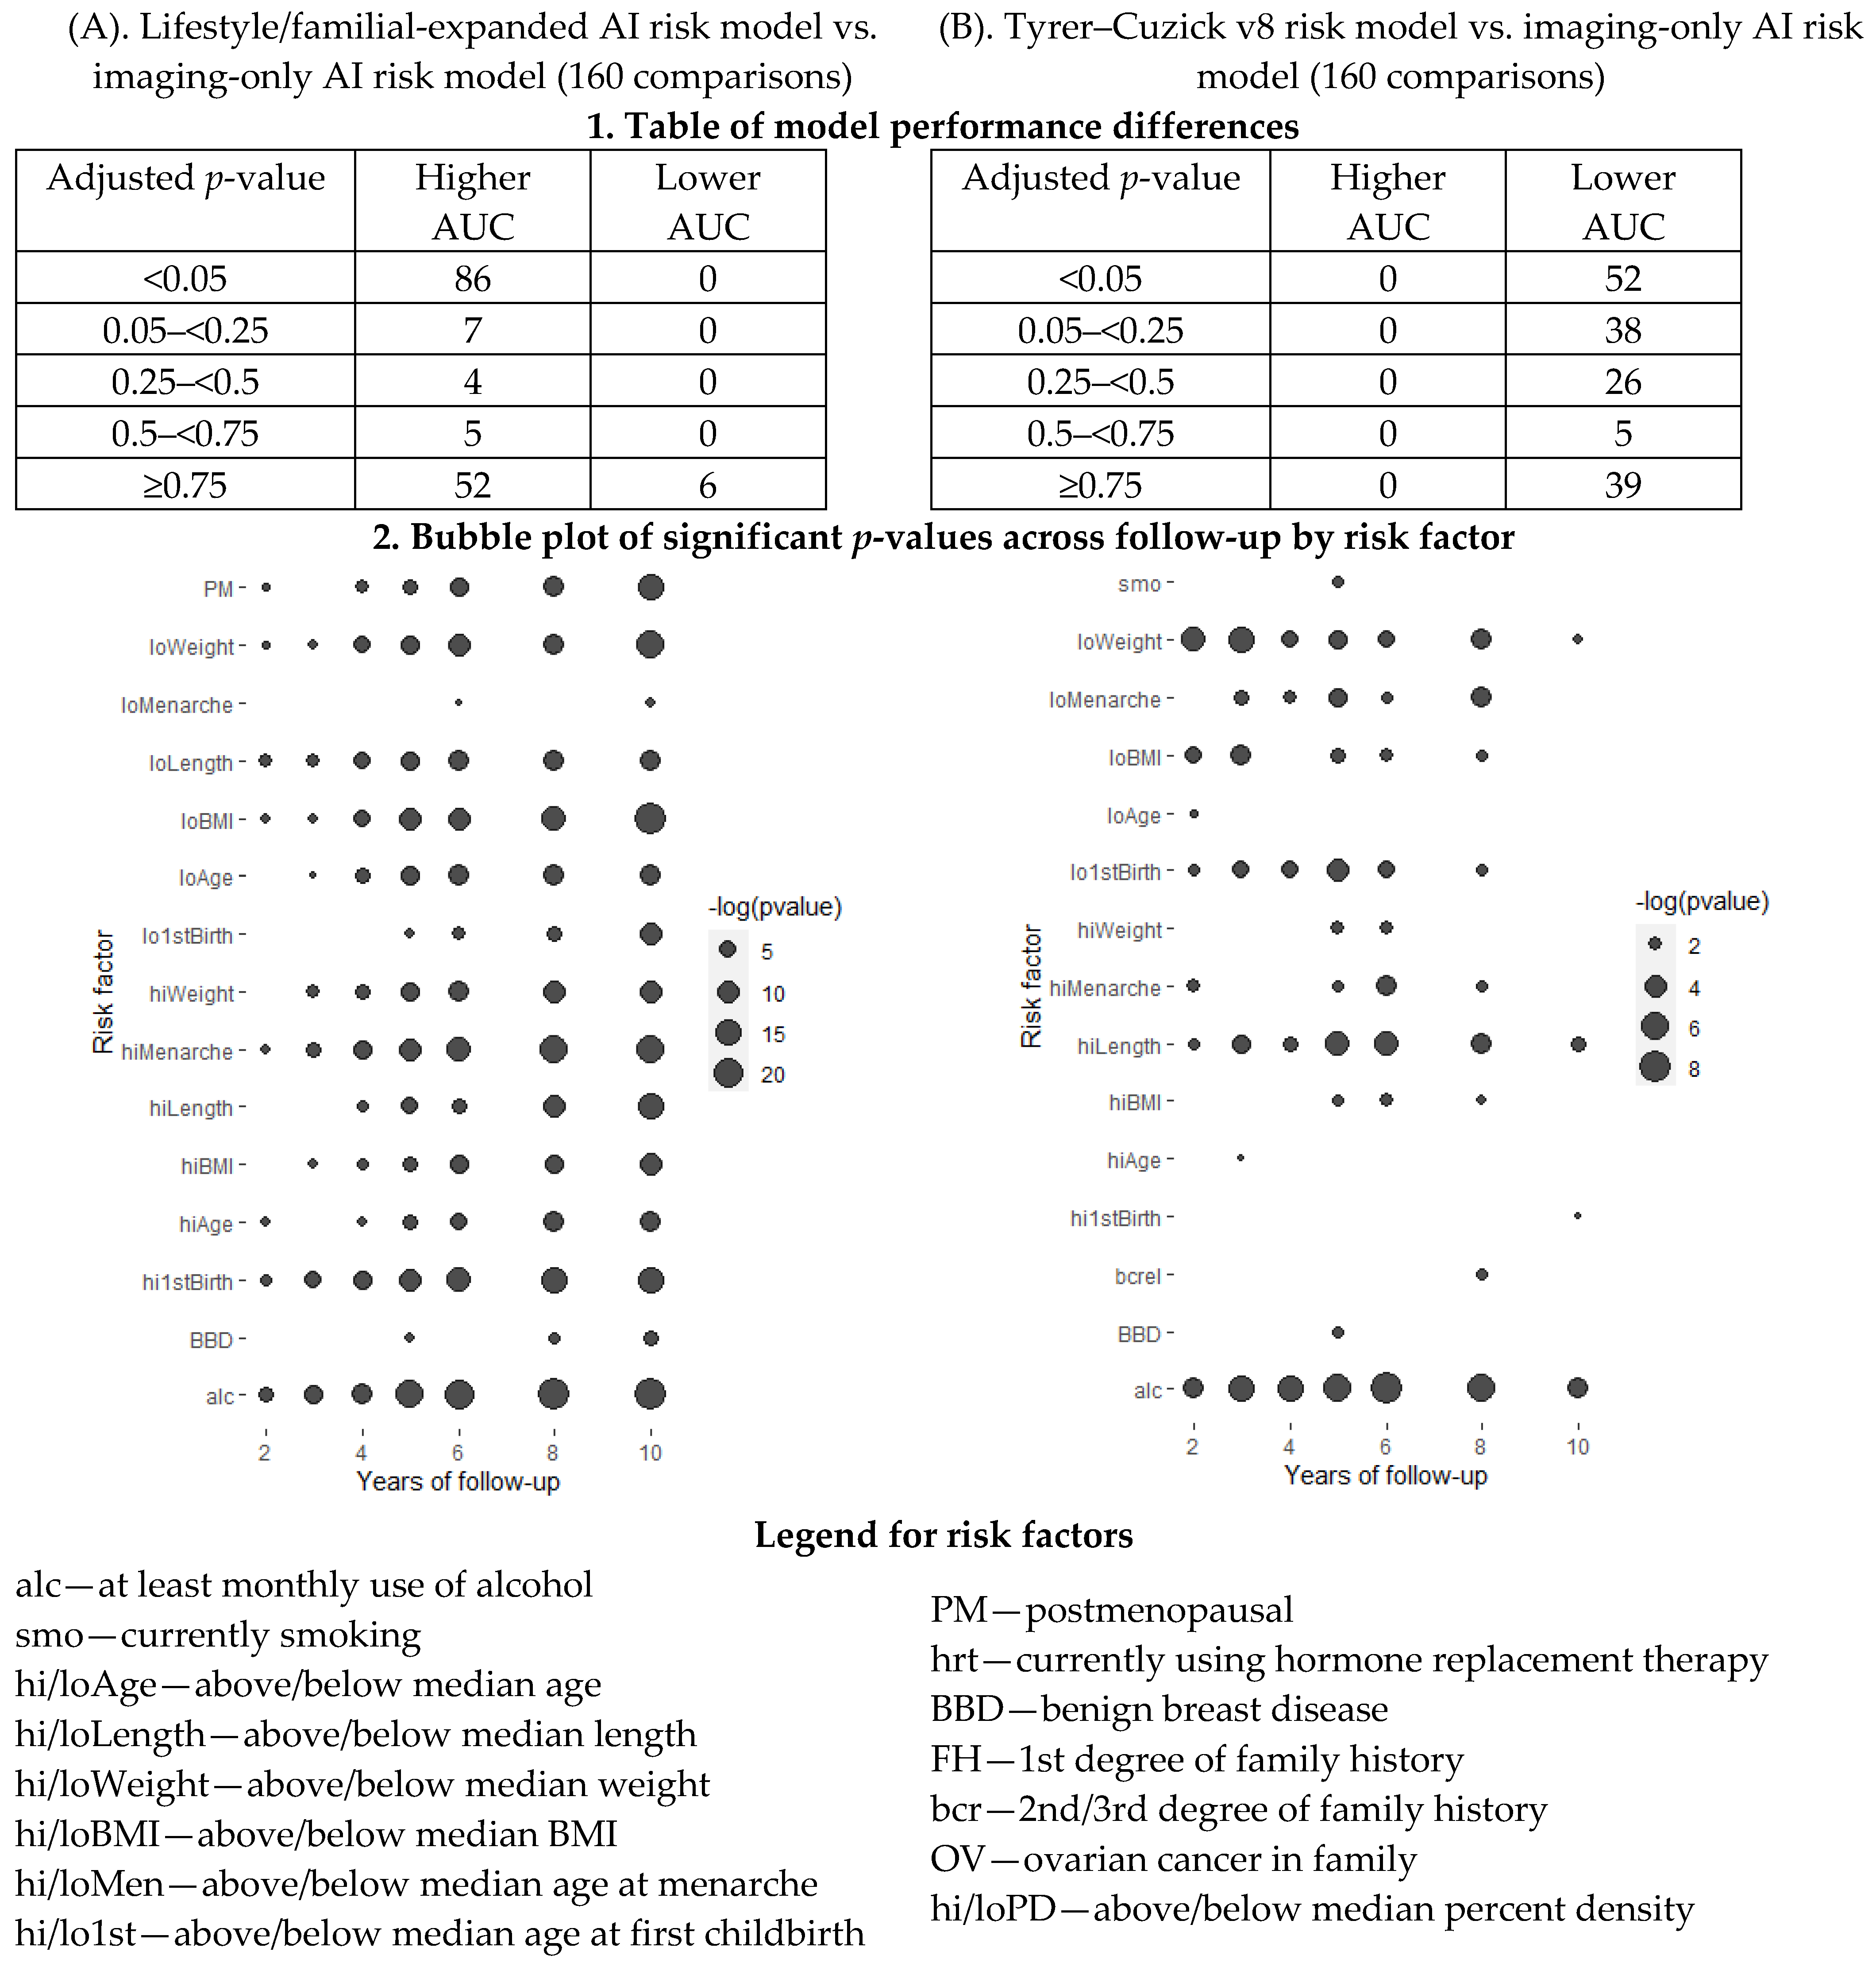
Figure A3.
Significance of risk model age adjusted AUC differences by risk factor subgroups. Comparisons of risk model AUC differences across 1–10 years of follow-up and risk factors. The lifestyle/familial-expanded AI risk model and Tyrer–Cuzick v8 were compared with the imaging-only AI risk model, respectively. The examined risk factors were above or below the median: age, length, weight, BMI; at least monthly intake of alcohol, current regular smoker; above/below median age at menarche, age at first childbirth, mammographic density; menopause, current use of HRT, benign breast disease, family history of breast cancer, 2nd/3rd-degree relative with breast cancer, and ovarian cancer in the family. The table presents the number of tests at different p-value thresholds after adjusting for multiple testing using the Holm–Bonferroni method. The bubble plot presents the minus-log-transformed p-value significance across the follow-up period for each significant risk factor.
When comparing the lifestyle/familial-expanded risk model with the imaging-only risk model, there were no significant AUC differences after any years of follow-up for current regular smokers, above and below median percentage area of mammographic density, premenopausal women, current users of HRT, family history of breast cancer, second/third-degree relative with breast cancer, and ovarian cancer in the family.
When comparing the Tyrer–Cuzick v8 risk model with the imaging-only risk model, there were no significant AUC differences after any years of follow-up for menopause status, above and below median percentage area of mammographic density, premenopausal women, current users of HRT, family history of breast cancer, and ovarian cancer in the family.
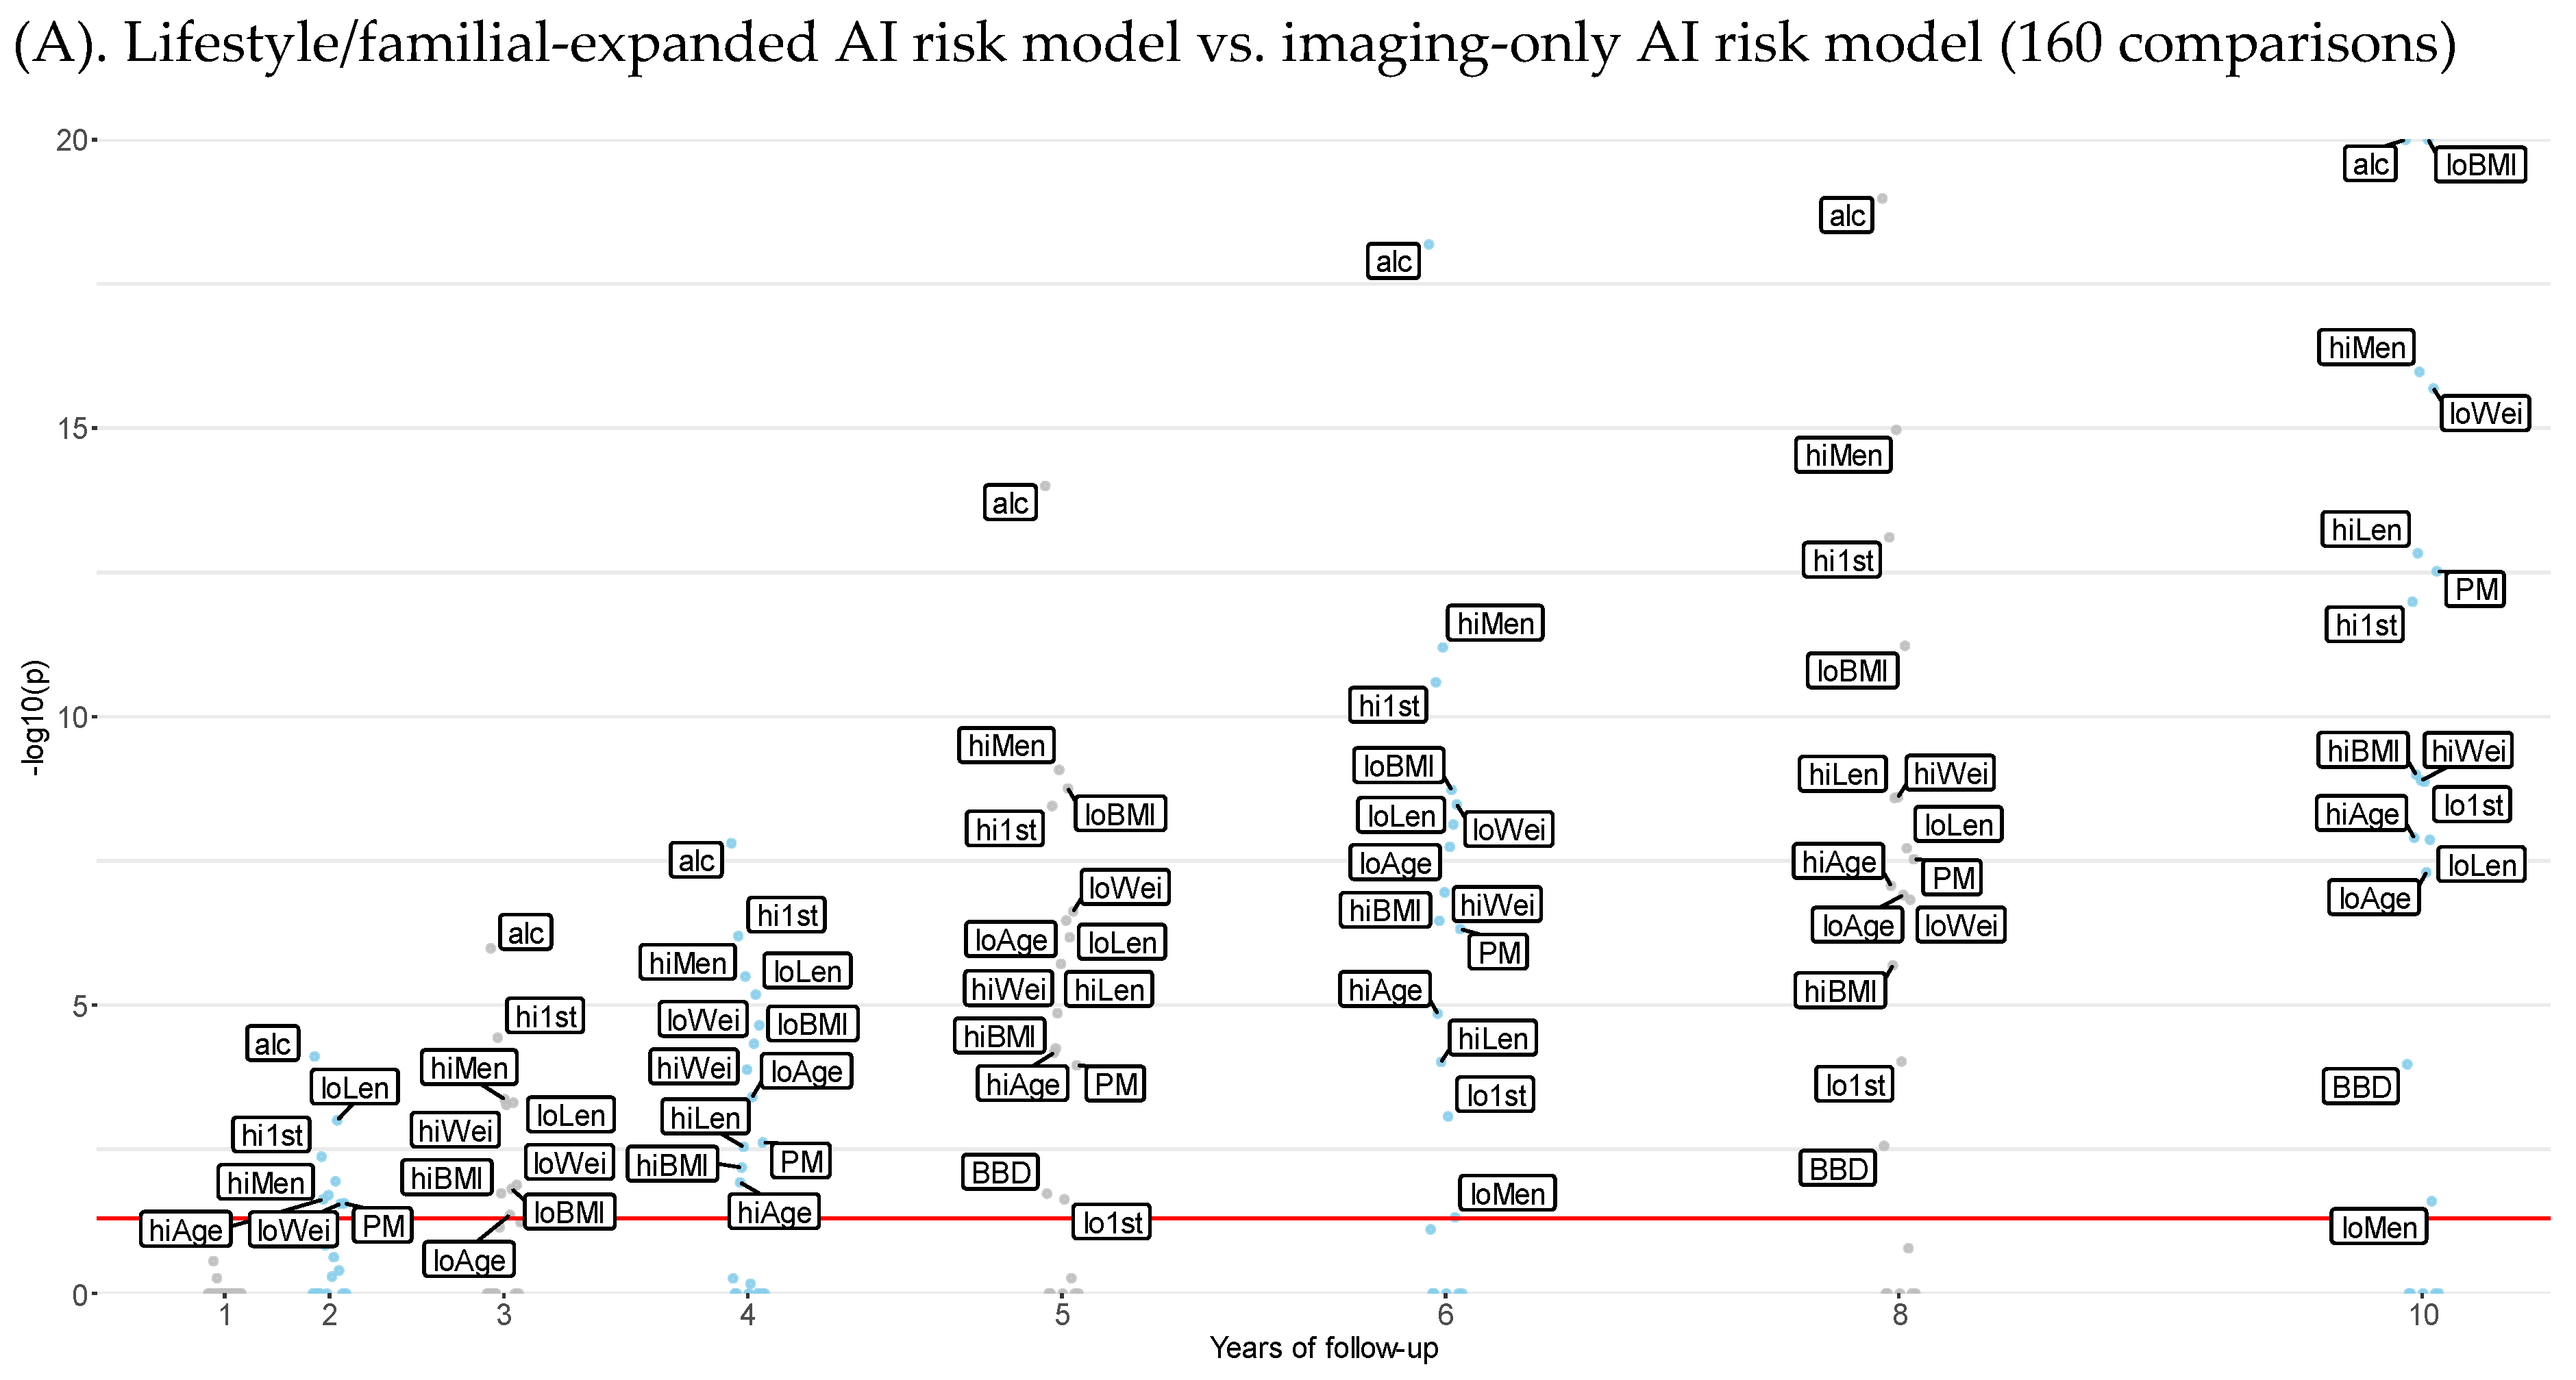
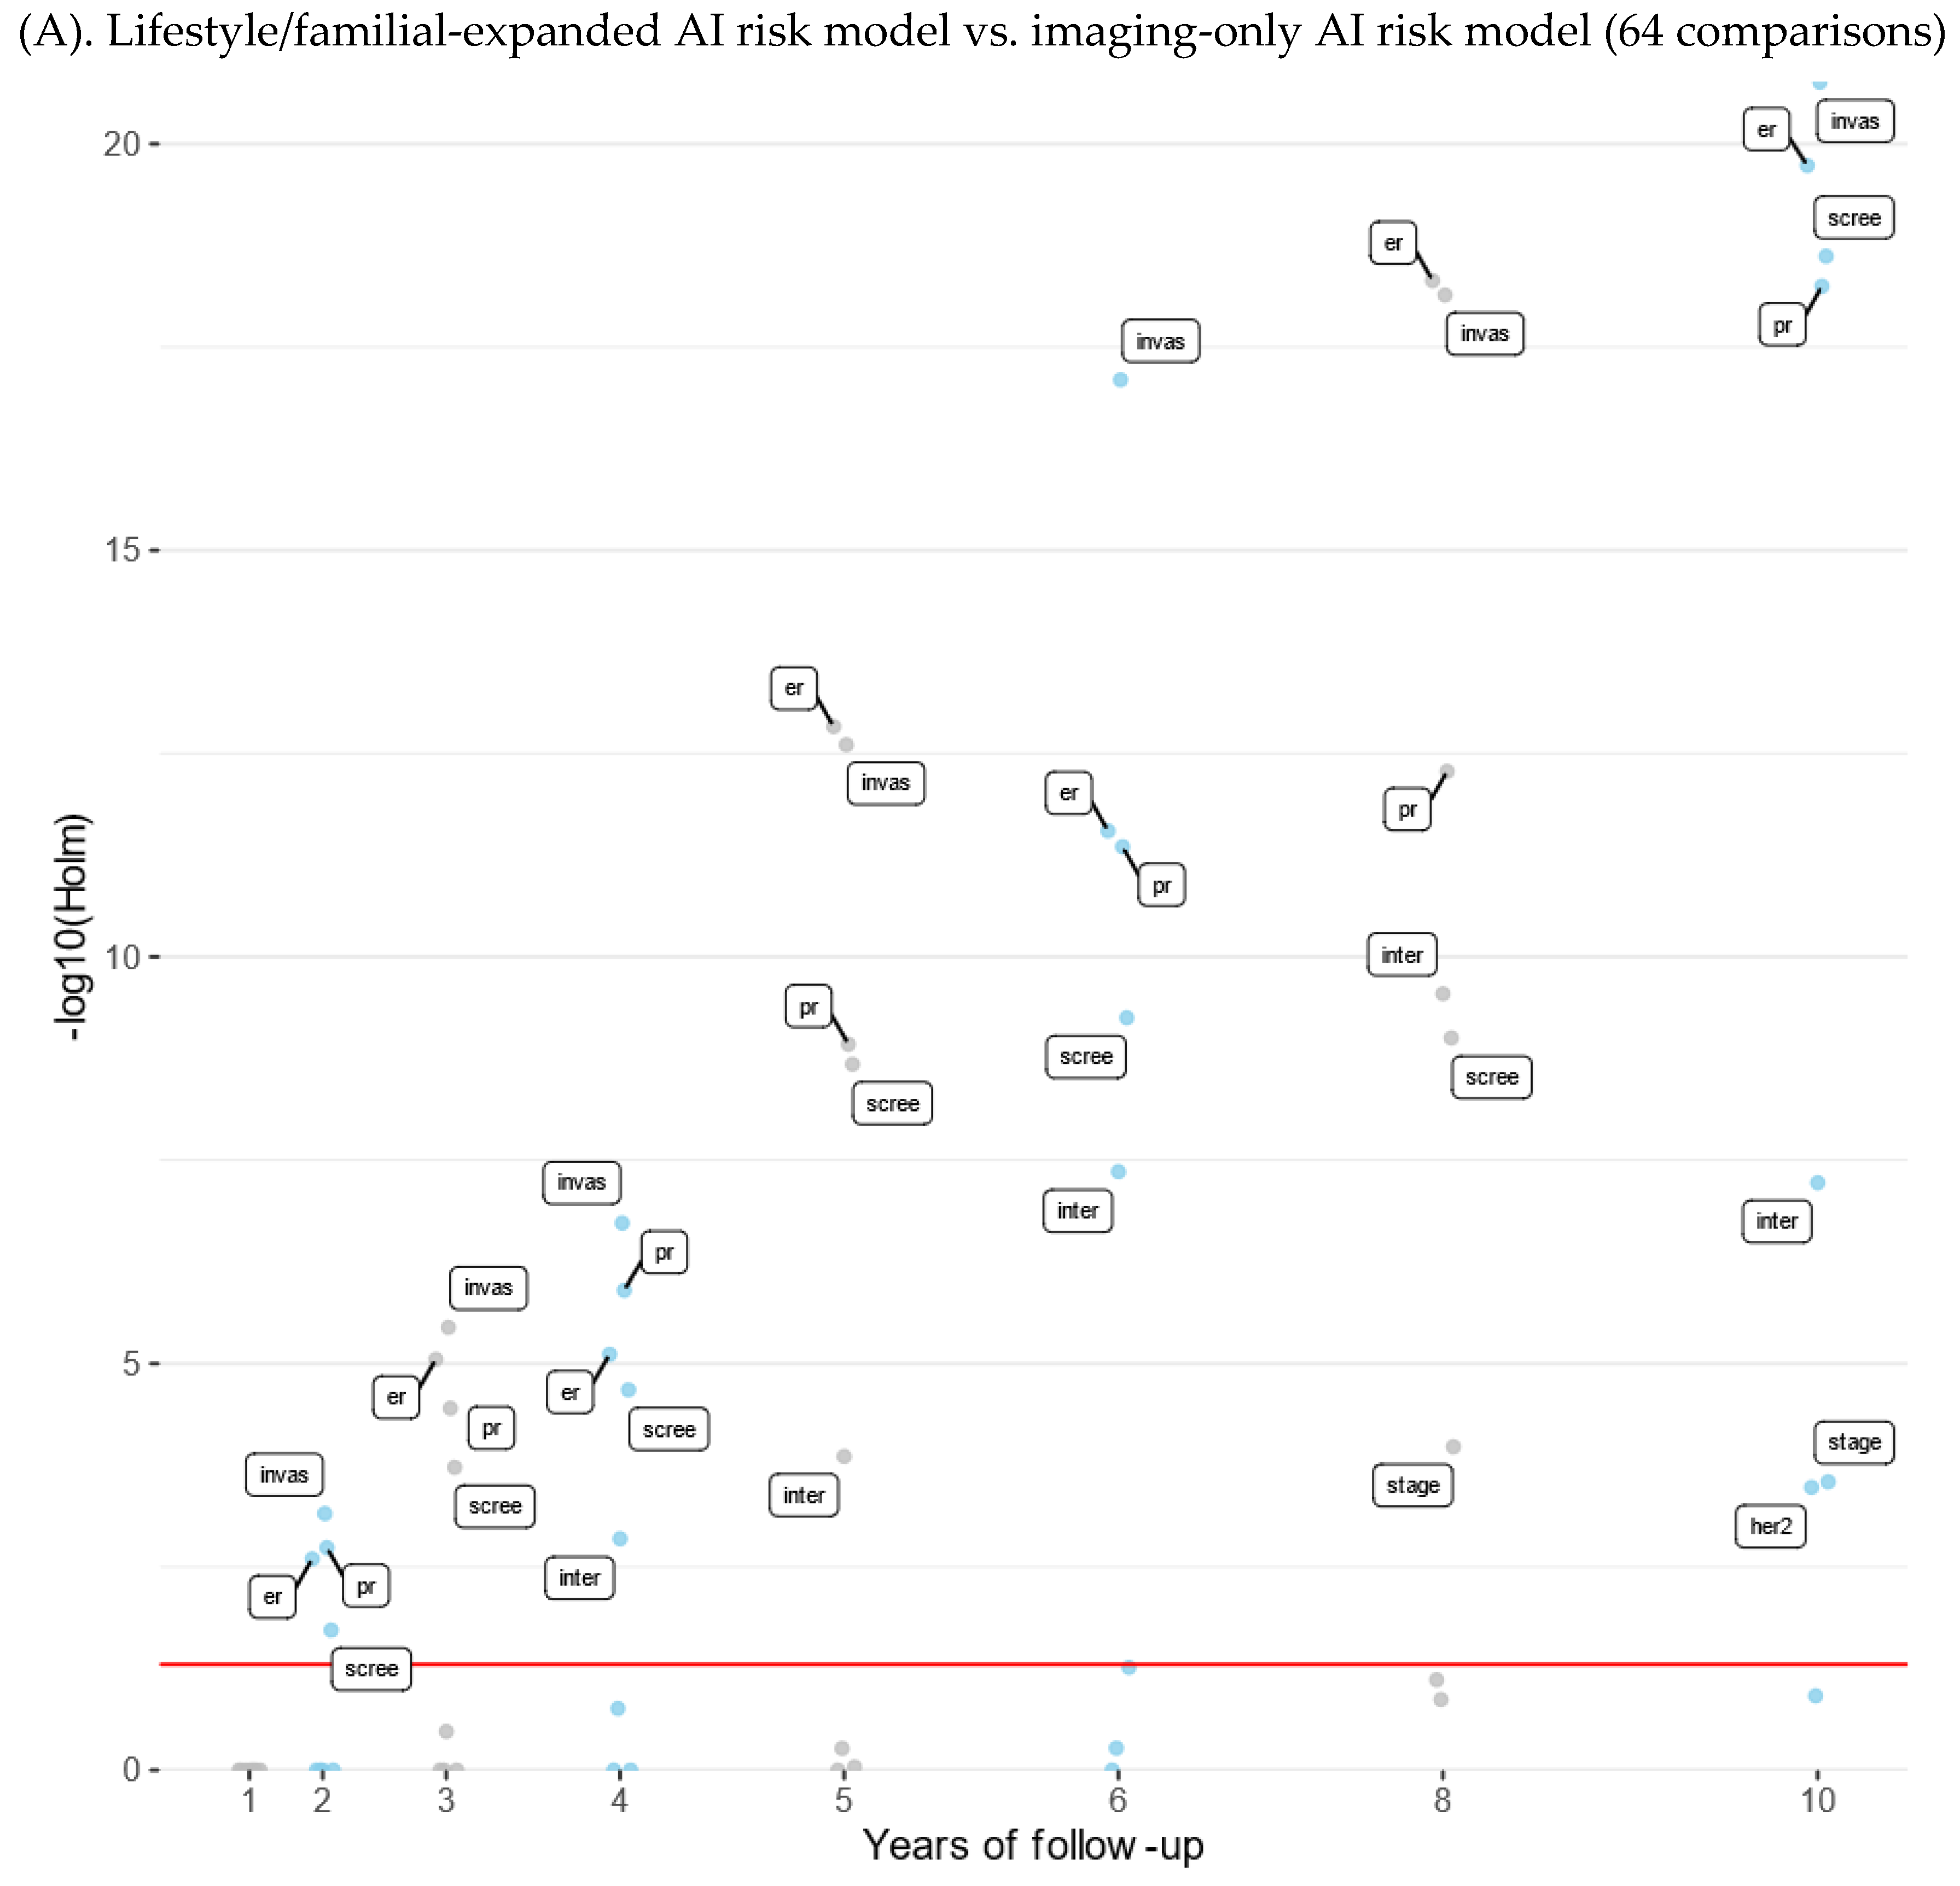
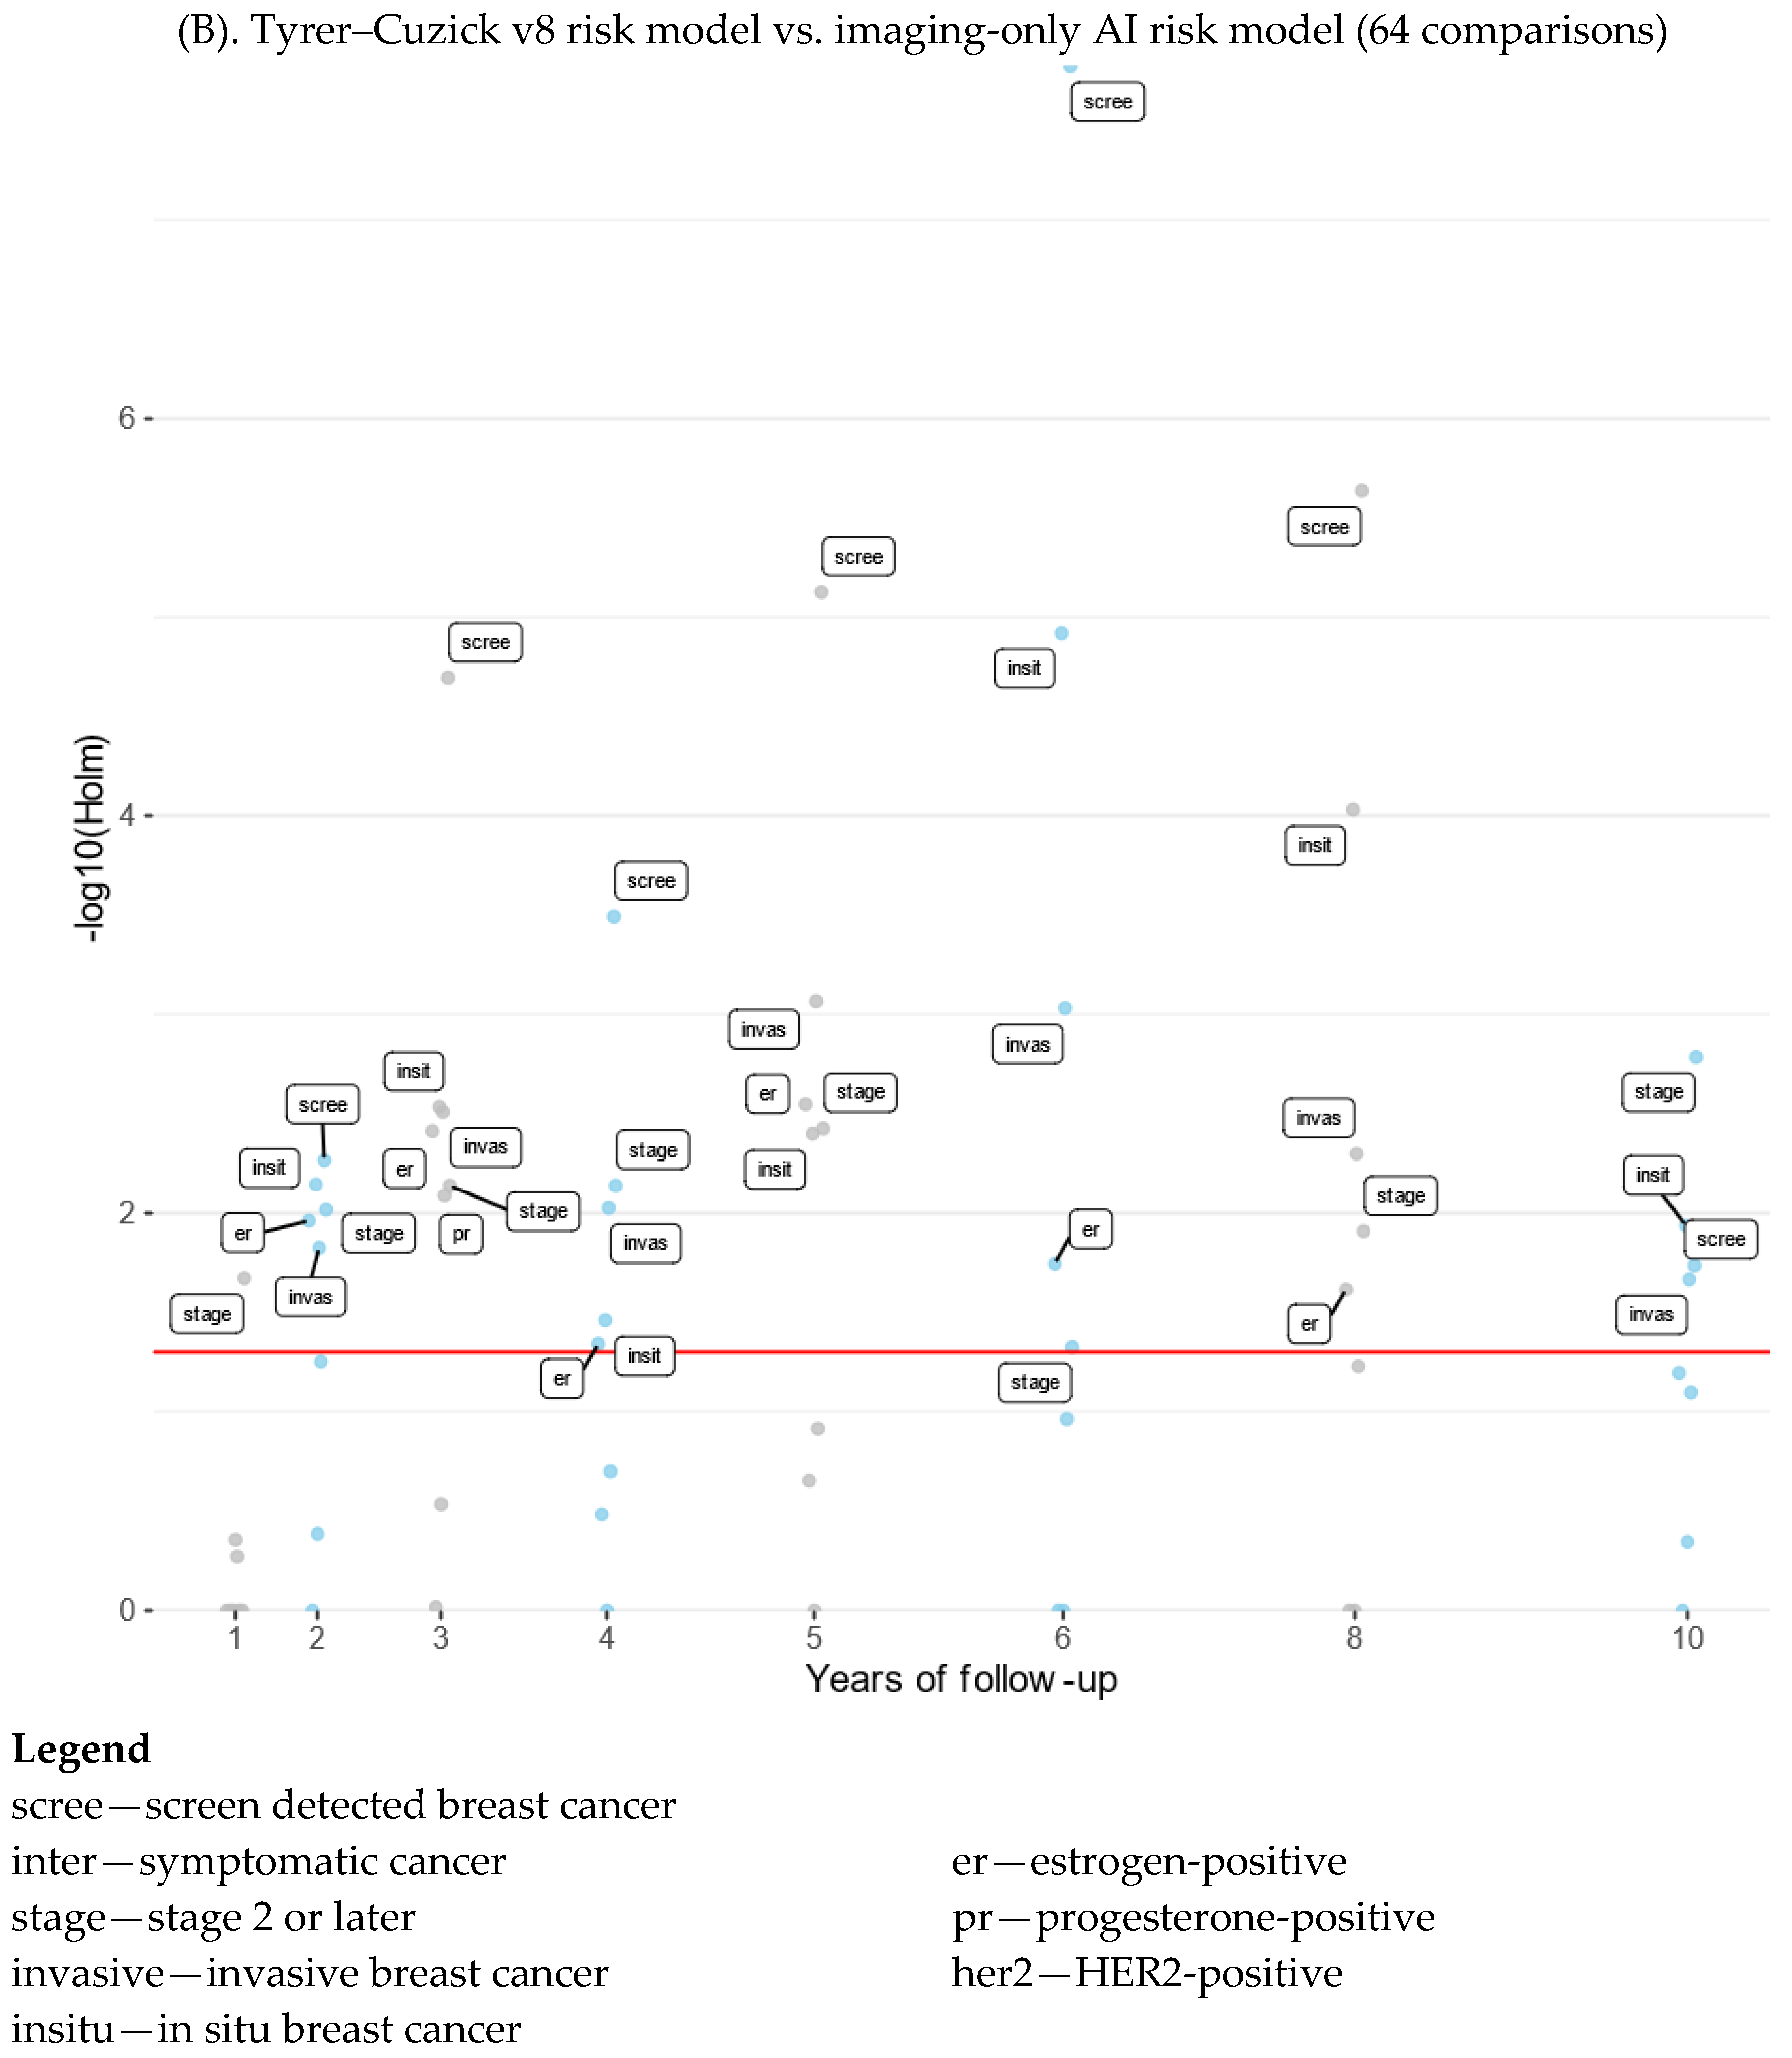
Figure A4.
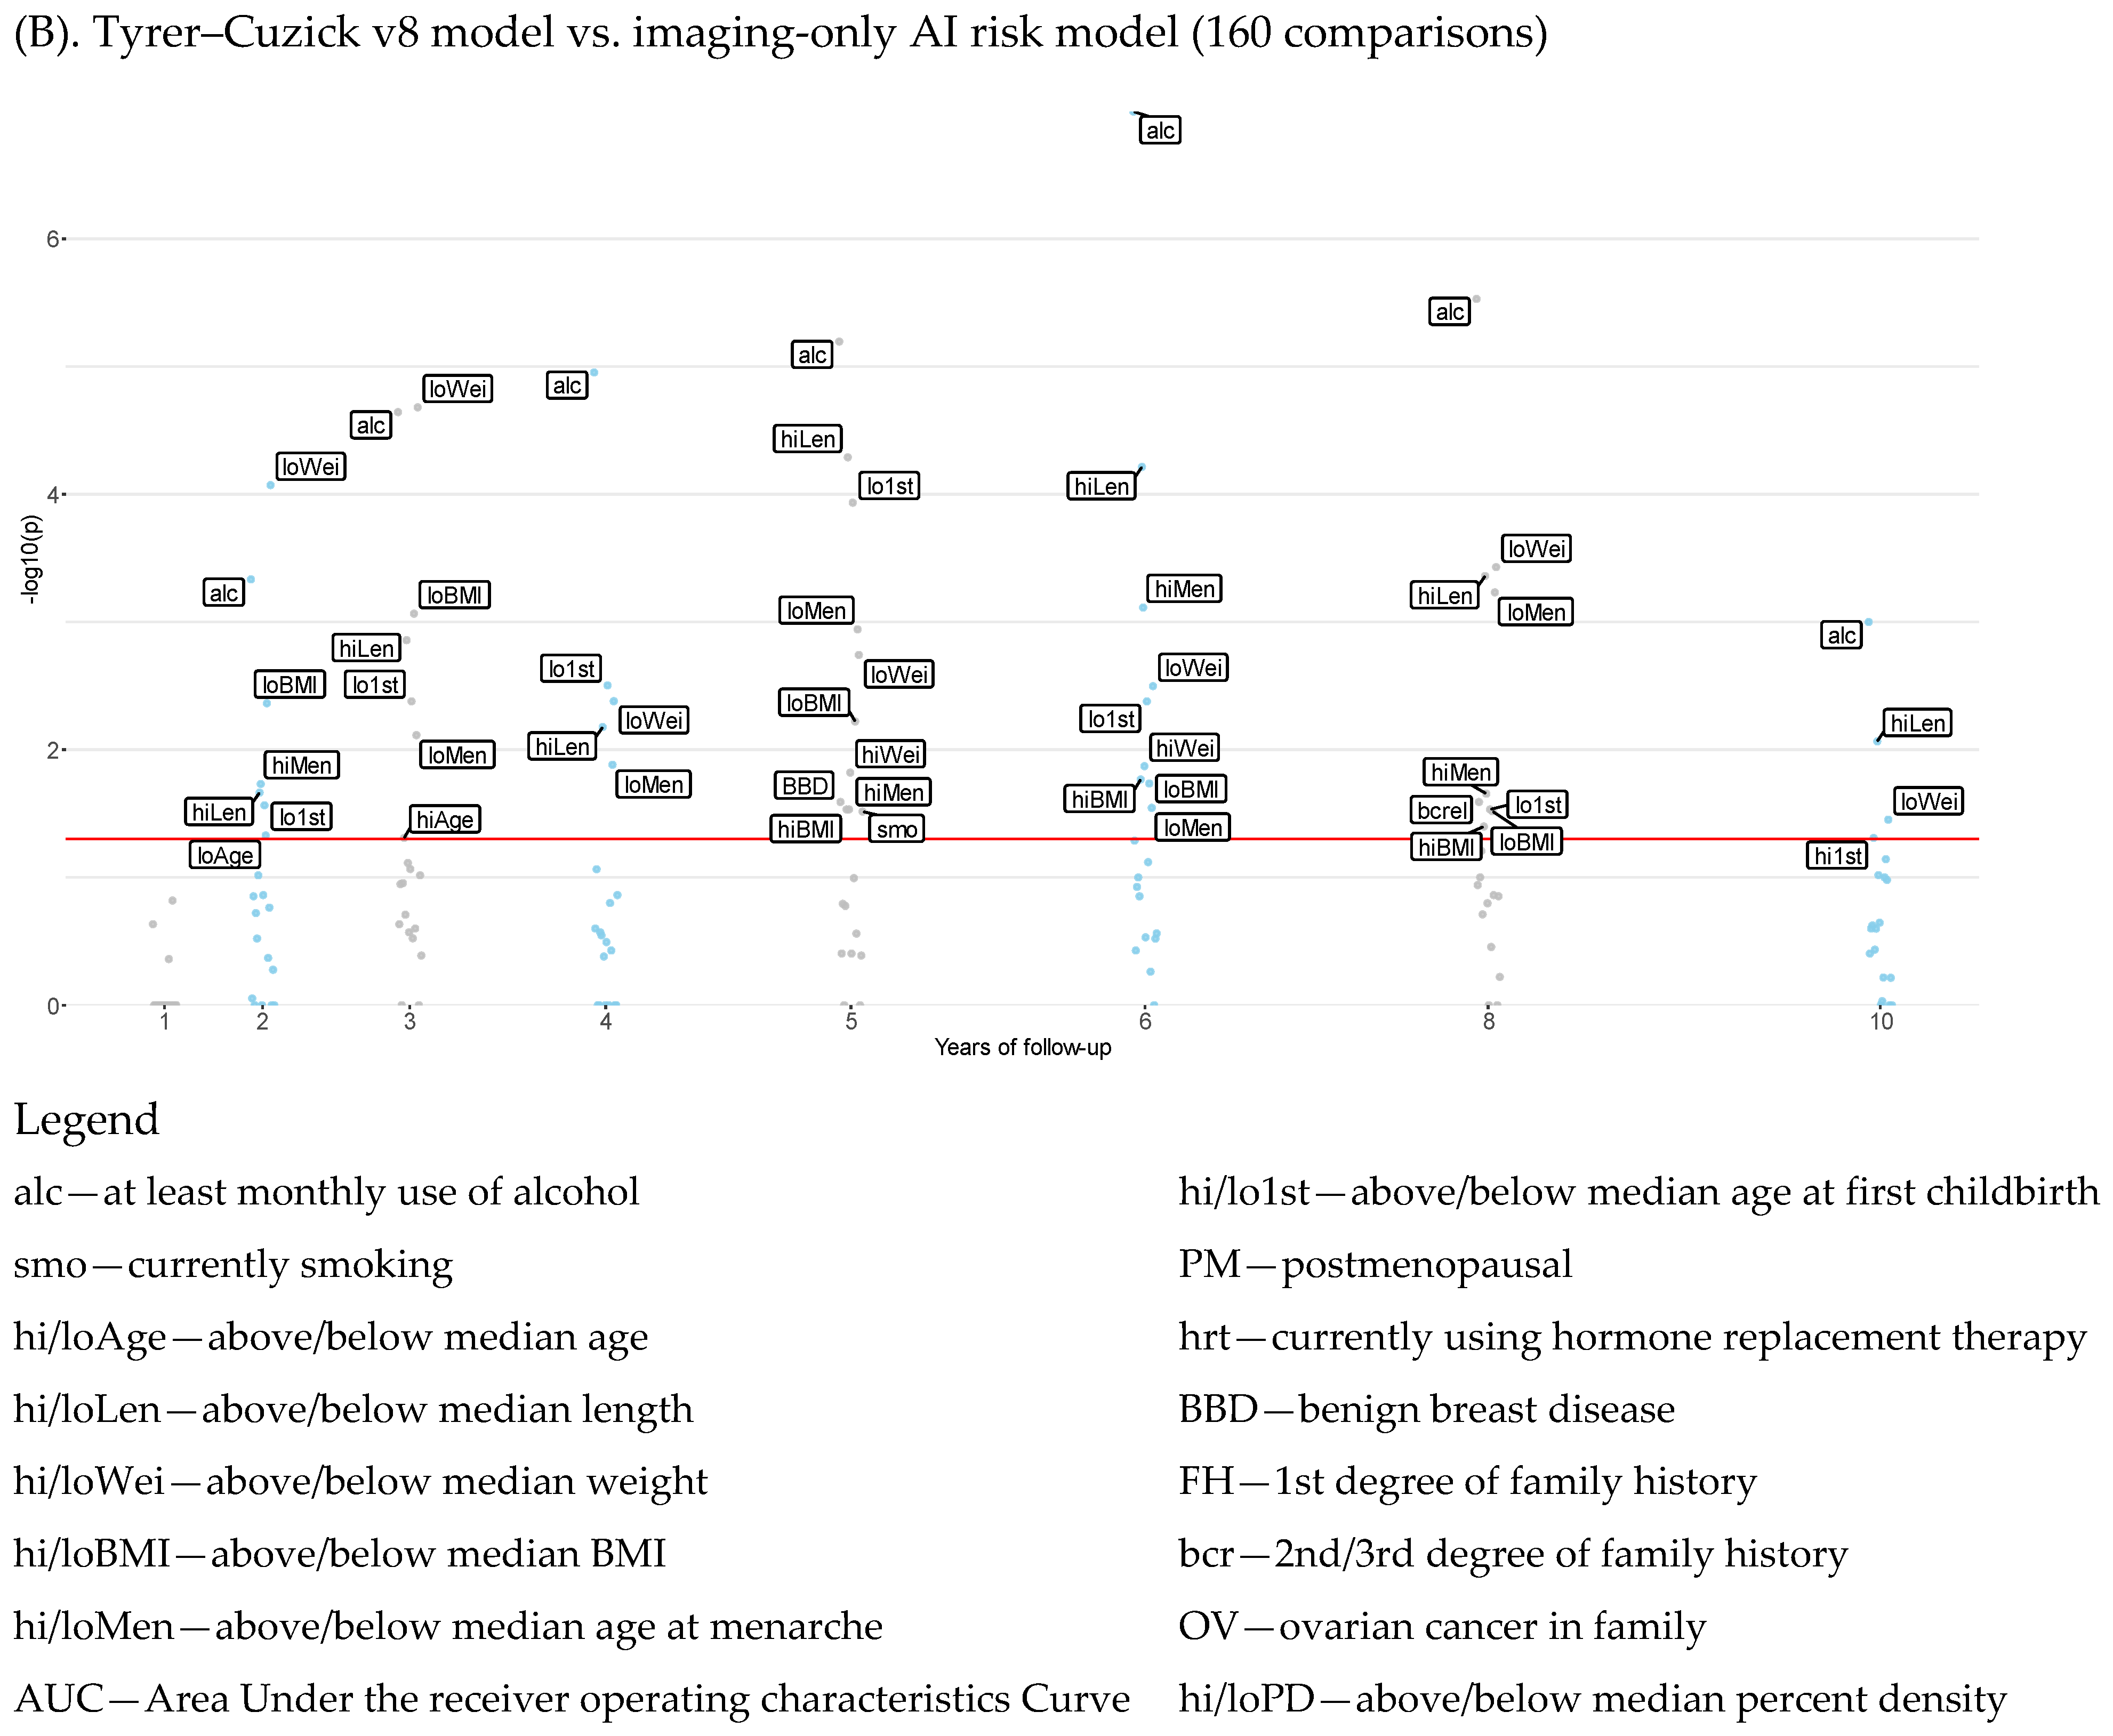
Manhattan plot of risk model differences by breast cancer subtypes and years of follow-up. Manhattan plot of the significance of age adjusted AUC differences across 1–10 years of follow-up for subgroups of women defined by risk factors comparing the lifestyle/familial-expanded AI risk model and Tyrer–Cuzick v8 with the imaging-only AI risk model. The plotted labels were limited to AUC comparisons with a p-value below 0.01 after adjustment for multiple comparisons using the Holm–Bonferroni method.
Figure A4.
Manhattan plot of risk model differences by breast cancer subtypes and years of follow-up. Manhattan plot of the significance of age adjusted AUC differences across 1–10 years of follow-up for subgroups of women defined by risk factors comparing the lifestyle/familial-expanded AI risk model and Tyrer–Cuzick v8 with the imaging-only AI risk model. The plotted labels were limited to AUC comparisons with a p-value below 0.01 after adjustment for multiple comparisons using the Holm–Bonferroni method.
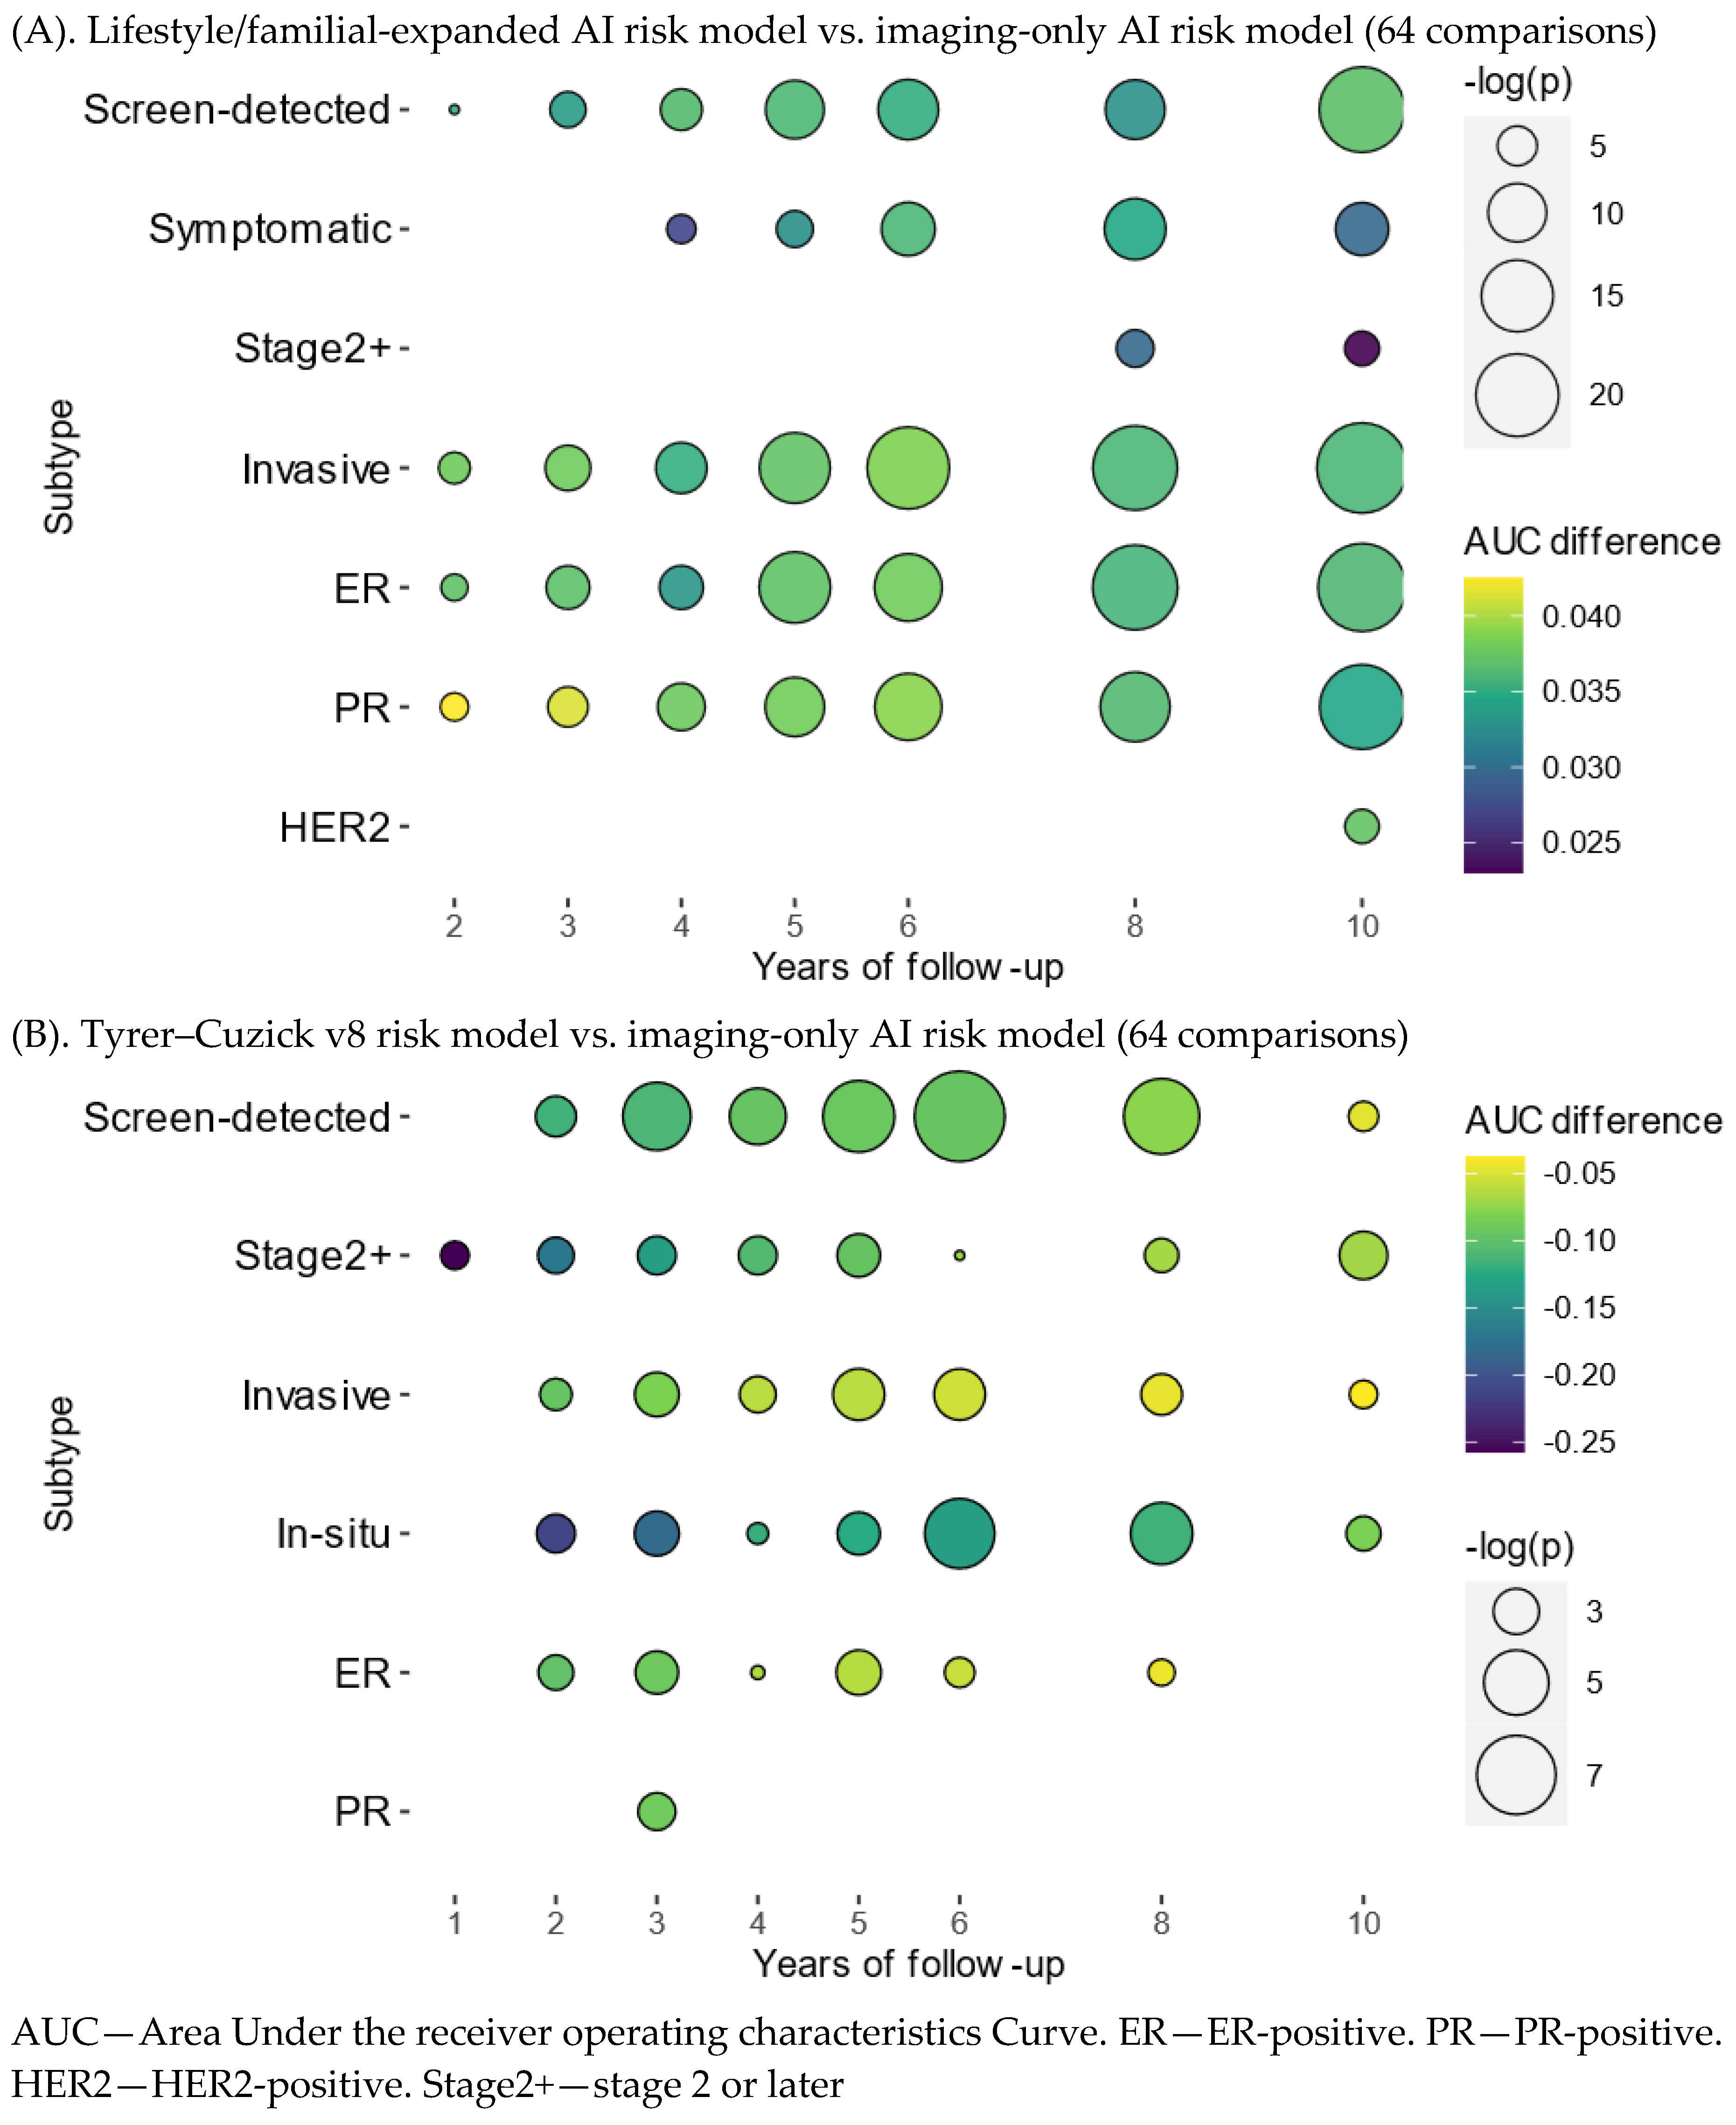
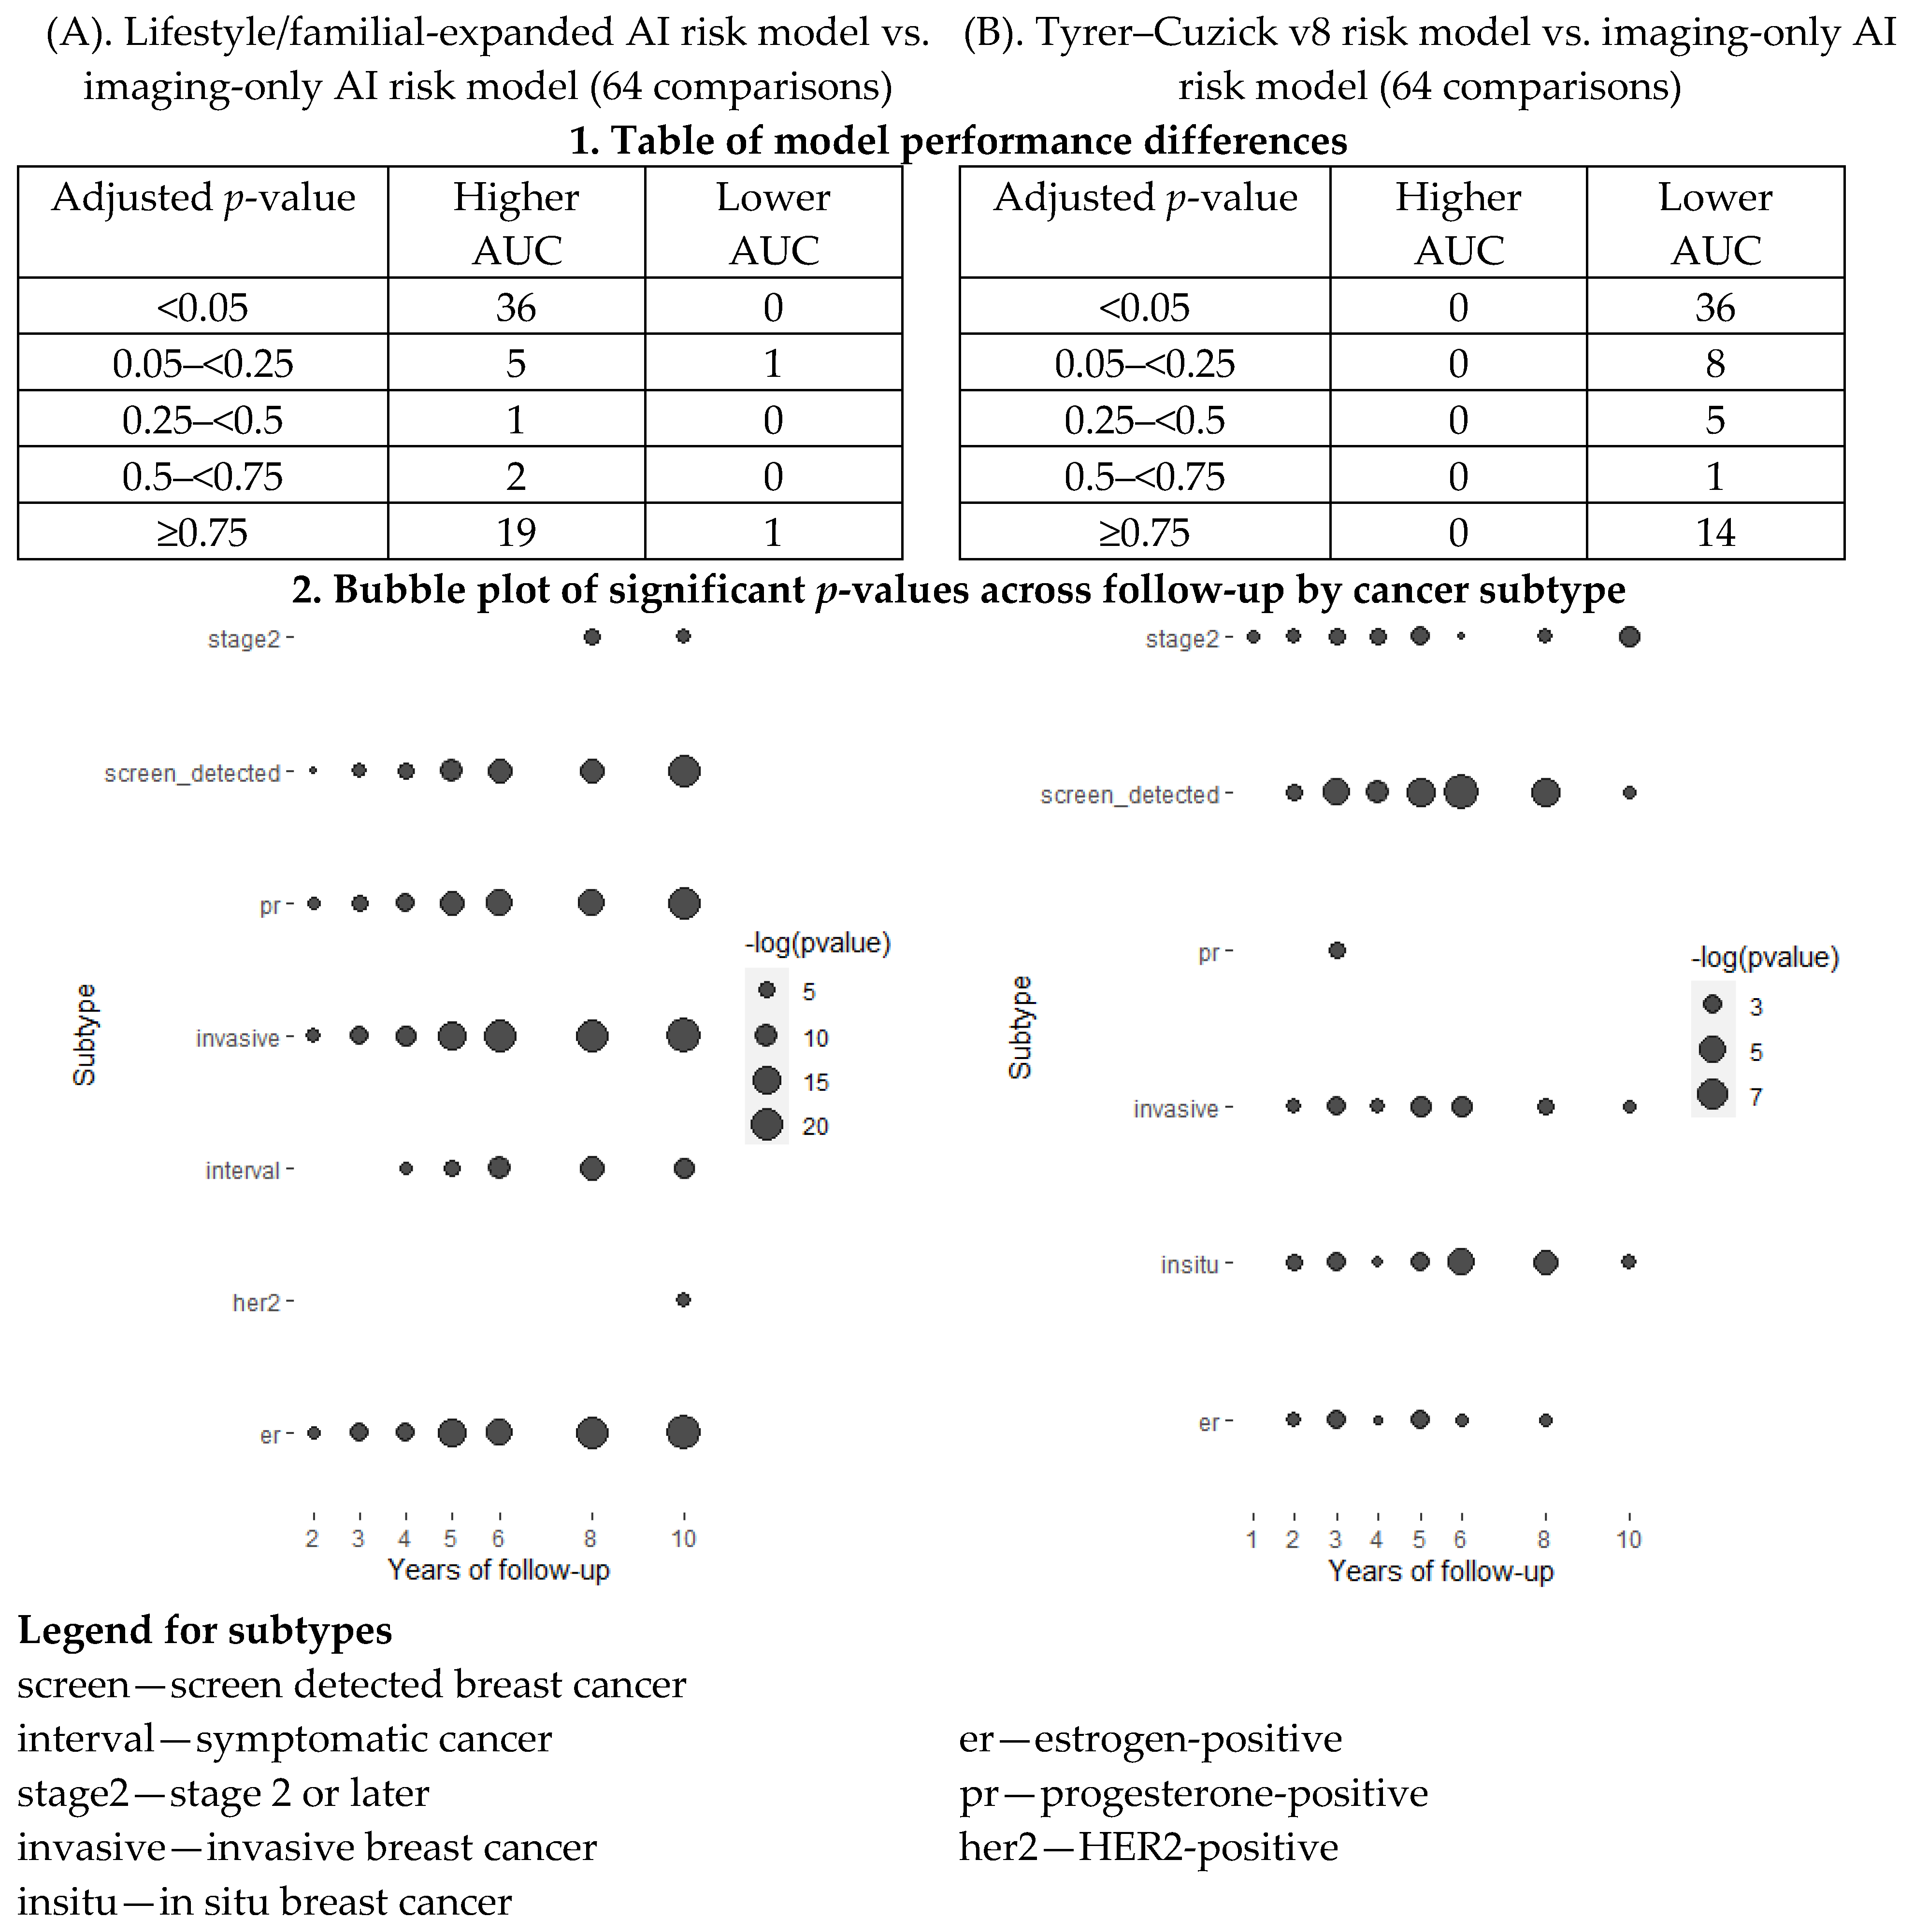
Figure A5.
Significance of risk model age adjusted AUC differences by cancer subtype. Comparisons of risk model AUC differences across 1–10 years of follow-up and cancer subtypes. The lifestyle/familial-expanded AI risk model and Tyrer–Cuzick v8 were compared with the imaging-only AI risk model, respectively. The examined subtypes were mode of detection (screen-detected, symptomatic), stage (stage 1 or earlier, stage 2 or later), invasiveness (invasive, in situ), and receptor status (ER, PR, HER2). The table presents the number of tests at different p-values thresholds after adjusting for multiple testing using the Holm–Bonferroni method. The bubble plot presents the minus-log-transformed p-value significance across the follow-up period for each significant breast cancer subtype.
When comparing the lifestyle/familial-expanded AI risk model with the imaging-only risk model, there were no significant AUC differences after any years of follow-up for in situ breast cancers.
When comparing the Tyrer–Cuzick v8 risk model with the imaging-only risk model, there were no significant AUC differences after any years of follow-up for symptomatic and HER2 breast cancers.
Appendix B
Table A1.
Mode of detection, invasiveness, stage, and receptor status in breast cancer cases. Frequencies and percentages of breast cancers diagnosed during the 10-year follow-up.
Table A1.
Mode of detection, invasiveness, stage, and receptor status in breast cancer cases. Frequencies and percentages of breast cancers diagnosed during the 10-year follow-up.
| Characteristic | n/N (%) |
|---|
| Mode of detection | |
| Screen detected | 978/1635 (60%) |
| Symptomatic cancers | 657/1635 (40%) |
| (Missing) | 26 |
| Tumor invasiveness | |
| Invasive | 1391/1620 (86%) |
| In situ | 229/1620 (14%) |
| (Missing) | 41 |
| Stage | |
| Stage 2 or later | 504/1633 (31%) |
| Stage 0 or 1 | 1129/1633 (69%) |
| (Missing) | 28 |
| ER status | |
| ER-positive | 1217/1414 (86%) |
| ER-negative | 197/1414 (14%) |
| (Missing) | 247 |
| PR status | |
| PR-positive | 1019/1412 (72%) |
| PR-negative | 393/1412 (18%) |
| (Missing) | 249 |
| HER2 status | |
| HER2-positive | 200/1391 (14%) |
| HER2-negative | 1191/1391 (86%) |
| (Missing) | 270 |
Table A2.
Age adjusted discriminatory performances of three risk models stratified by risk factor subgroups. Discriminatory performance AUC of the lifestyle/familial-expanded AI risk model, the imaging-only AI risk model, and Tyrer–Cuzick v8 in subgroups of women by use of alcohol, smoking, BMI, age at menarche, age at first birth, menopause, use of HRT, benign breast disease, and family histories. Multiple estimations were performed for breast cancers diagnosed 1–10 years after study entry. Risk groups with high and low risk exposures represent above and below median risk exposures, respectively.
| Group of Women | 1 Year | 2 Years | 3 Years | 4 Years | 5 Years | 6 Years | 8 Years | 10 Years |
|---|
| Expanded AI risk model 2 | | | | | | | | |
| All women | 0.75 | 0.77 | 0.76 | 0.73 | 0.72 | 0.71 | 0.68 | 0.68 |
| Use of alcohol 1 | 0.76 | 0.77 | 0.76 | 0.73 | 0.72 | 0.71 | 0.69 | 0.68 |
| Benign breast disease | 0.66 | 0.77 | 0.76 | 0.74 | 0.72 | 0.71 | 0.68 | 0.68 |
| 2nd/3rd-degree breast cancer | 0.68 | 0.77 | 0.77 | 0.75 | 0.72 | 0.70 | 0.67 | 0.66 |
| Family history of breast cancer | 0.67 | 0.68 | 0.68 | 0.66 | 0.66 | 0.65 | 0.63 | 0.63 |
| High age at first childbirth | 0.72 | 0.78 | 0.75 | 0.73 | 0.72 | 0.71 | 0.68 | 0.68 |
| High age | 0.70 | 0.75 | 0.75 | 0.73 | 0.71 | 0.71 | 0.69 | 0.69 |
| High BMI | 0.73 | 0.77 | 0.77 | 0.75 | 0.74 | 0.73 | 0.70 | 0.69 |
| High length | 0.71 | 0.79 | 0.77 | 0.73 | 0.71 | 0.71 | 0.68 | 0.68 |
| High menarche | 0.74 | 0.76 | 0.76 | 0.72 | 0.72 | 0.71 | 0.69 | 0.68 |
| High weight | 0.74 | 0.77 | 0.77 | 0.74 | 0.73 | 0.73 | 0.70 | 0.69 |
| Use of HRT | 0.51 | 0.70 | 0.73 | 0.72 | 0.70 | 0.69 | 0.65 | 0.63 |
| Low age at first childbirth | 0.76 | 0.76 | 0.76 | 0.72 | 0.70 | 0.70 | 0.67 | 0.67 |
| Low age | 0.76 | 0.79 | 0.76 | 0.72 | 0.72 | 0.70 | 0.66 | 0.65 |
| Low BMI | 0.77 | 0.77 | 0.75 | 0.70 | 0.69 | 0.68 | 0.67 | 0.67 |
| Low length | 0.76 | 0.75 | 0.75 | 0.73 | 0.72 | 0.71 | 0.68 | 0.68 |
| Low menarche | 0.70 | 0.77 | 0.76 | 0.73 | 0.71 | 0.70 | 0.67 | 0.67 |
| Low weight | 0.74 | 0.77 | 0.75 | 0.71 | 0.70 | 0.68 | 0.66 | 0.66 |
| Ovarian cancer in family | 0.60 | 0.77 | 0.73 | 0.66 | 0.68 | 0.67 | 0.69 | 0.68 |
| Postmenopausal | 0.74 | 0.75 | 0.75 | 0.72 | 0.71 | 0.71 | 0.69 | 0.68 |
| Current smoker | 0.64 | 0.79 | 0.72 | 0.72 | 0.71 | 0.69 | 0.68 | 0.67 |
| Imaging-only AI risk model | | | | | | | | |
| All women | 0.72 | 0.73 | 0.73 | 0.69 | 0.68 | 0.67 | 0.65 | 0.64 |
| Use of alcohol 1 | 0.71 | 0.73 | 0.72 | 0.69 | 0.68 | 0.67 | 0.65 | 0.64 |
| Benign breast disease | 0.68 | 0.75 | 0.74 | 0.72 | 0.70 | 0.69 | 0.66 | 0.65 |
| 2nd/3rd-degree breast cancer | 0.70 | 0.73 | 0.75 | 0.73 | 0.69 | 0.68 | 0.67 | 0.65 |
| Family history of breast cancer | 0.64 | 0.68 | 0.68 | 0.64 | 0.65 | 0.64 | 0.62 | 0.62 |
| High age at first childbirth | 0.66 | 0.73 | 0.70 | 0.68 | 0.67 | 0.66 | 0.64 | 0.64 |
| High age | 0.69 | 0.72 | 0.72 | 0.70 | 0.68 | 0.68 | 0.66 | 0.66 |
| High BMI | 0.71 | 0.74 | 0.73 | 0.72 | 0.71 | 0.70 | 0.67 | 0.66 |
| High length | 0.71 | 0.77 | 0.75 | 0.70 | 0.68 | 0.68 | 0.65 | 0.64 |
| High menarche | 0.71 | 0.73 | 0.72 | 0.68 | 0.68 | 0.67 | 0.65 | 0.64 |
| High weight | 0.70 | 0.73 | 0.73 | 0.71 | 0.70 | 0.70 | 0.67 | 0.66 |
| Use of HRT | 0.54 | 0.73 | 0.75 | 0.70 | 0.69 | 0.67 | 0.63 | 0.61 |
| Low age at first childbirth | 0.74 | 0.73 | 0.73 | 0.70 | 0.67 | 0.67 | 0.64 | 0.63 |
| Low age | 0.71 | 0.74 | 0.71 | 0.67 | 0.67 | 0.65 | 0.62 | 0.62 |
| Low BMI | 0.73 | 0.72 | 0.72 | 0.66 | 0.65 | 0.65 | 0.63 | 0.63 |
| Low length | 0.71 | 0.69 | 0.70 | 0.69 | 0.68 | 0.67 | 0.65 | 0.64 |
| Low menarche | 0.67 | 0.74 | 0.74 | 0.72 | 0.69 | 0.68 | 0.66 | 0.65 |
| Low weight | 0.71 | 0.73 | 0.72 | 0.68 | 0.66 | 0.64 | 0.63 | 0.62 |
| Ovarian cancer in family | 0.56 | 0.71 | 0.69 | 0.62 | 0.64 | 0.65 | 0.67 | 0.67 |
| Postmenopausal | 0.72 | 0.72 | 0.72 | 0.70 | 0.68 | 0.68 | 0.66 | 0.65 |
| Current smoker | 0.61 | 0.75 | 0.72 | 0.72 | 0.71 | 0.69 | 0.67 | 0.66 |
| Tyrer–Cuzick v8 | | | | | | | | |
| All women | 0.62 | 0.62 | 0.62 | 0.62 | 0.61 | 0.61 | 0.59 | 0.60 |
| Use of alcohol 1 | 0.59 | 0.61 | 0.61 | 0.61 | 0.60 | 0.60 | 0.59 | 0.60 |
| Benign breast disease | 0.61 | 0.65 | 0.64 | 0.63 | 0.61 | 0.61 | 0.59 | 0.60 |
| 2nd/3rd-degree breast cancer | 0.63 | 0.53 | 0.57 | 0.57 | 0.58 | 0.57 | 0.55 | 0.57 |
| Family history of breast cancer | 0.52 | 0.60 | 0.61 | 0.58 | 0.56 | 0.55 | 0.55 | 0.56 |
| High age at first childbirth | 0.60 | 0.64 | 0.62 | 0.63 | 0.62 | 0.61 | 0.59 | 0.59 |
| High age | 0.63 | 0.64 | 0.63 | 0.64 | 0.62 | 0.63 | 0.61 | 0.62 |
| High BMI | 0.64 | 0.65 | 0.65 | 0.66 | 0.64 | 0.64 | 0.62 | 0.62 |
| High length | 0.64 | 0.65 | 0.63 | 0.62 | 0.60 | 0.60 | 0.59 | 0.59 |
| High menarche | 0.61 | 0.63 | 0.63 | 0.63 | 0.61 | 0.60 | 0.60 | 0.60 |
| High weight | 0.69 | 0.66 | 0.66 | 0.66 | 0.64 | 0.64 | 0.62 | 0.62 |
| Use of HRT | 0.46 | 0.48 | 0.54 | 0.52 | 0.55 | 0.54 | 0.57 | 0.58 |
| Low age at first childbirth | 0.63 | 0.61 | 0.61 | 0.60 | 0.58 | 0.59 | 0.58 | 0.6 |
| Low age | 0.60 | 0.61 | 0.62 | 0.61 | 0.60 | 0.59 | 0.57 | 0.58 |
| Low BMI | 0.59 | 0.59 | 0.59 | 0.59 | 0.57 | 0.57 | 0.57 | 0.58 |
| Low length | 0.59 | 0.60 | 0.62 | 0.62 | 0.61 | 0.61 | 0.59 | 0.60 |
| Low menarche | 0.60 | 0.62 | 0.62 | 0.62 | 0.60 | 0.61 | 0.58 | 0.59 |
| Low weight | 0.54 | 0.57 | 0.57 | 0.58 | 0.57 | 0.56 | 0.56 | 0.57 |
| Ovarian cancer in family | 0.37 | 0.52 | 0.48 | 0.57 | 0.61 | 0.61 | 0.57 | 0.59 |
| Postmenopausal | 0.66 | 0.64 | 0.64 | 0.64 | 0.63 | 0.63 | 0.61 | 0.62 |
| Current smoker | 0.59 | 0.63 | 0.61 | 0.60 | 0.60 | 0.59 | 0.59 | 0.60 |
Table A3.
Age adjusted discriminatory performance of the lifestyle/familial-expanded AI risk model compared with the imaging-only AI risk model by cancer subtype. Table of 36 significant risk model prediction performance differences when comparing the lifestyle/familial-expanded AI risk model with the imaging-only AI risk model. The examined subtypes were mode of detection (screen-detected, symptomatic), stage (stage 1 or earlier, stage 2 or later), invasiveness (invasive, in situ), and receptor status (ER, PR, HER2). The significant differences are presented by years of follow-up and subtype. A p-value below 0.05 was considered a significant difference between the two risk model AUCs after adjusting the Holm–Bonferroni method to account for multiple comparisons.
| Year | Cancer Subtype | Comparison AUC | Reference AUC | AUC Difference | Holm p-Value | Raw p-Value |
|---|
| 2 | ER | 0.748 | 0.711 | 0.037 | 0.003 | <0.001 |
| 2 | Invasive | 0.752 | 0.714 | 0.038 | 0.001 | <0.001 |
| 2 | PR | 0.761 | 0.718 | 0.043 | 0.002 | <0.001 |
| 2 | Screen-detected | 0.757 | 0.721 | 0.035 | 0.019 | <0.001 |
| 3 | ER | 0.745 | 0.708 | 0.037 | <0.001 | <0.001 |
| 3 | Invasive | 0.745 | 0.707 | 0.038 | <0.001 | <0.001 |
| 3 | PR | 0.757 | 0.716 | 0.041 | <0.001 | <0.001 |
| 3 | Screen-detected | 0.753 | 0.719 | 0.034 | <0.001 | <0.001 |
| 4 | ER | 0.719 | 0.686 | 0.033 | <0.001 | <0.001 |
| 4 | Symptomatic | 0.706 | 0.679 | 0.027 | 0.001 | <0.001 |
| 4 | Invasive | 0.713 | 0.677 | 0.035 | <0.001 | <0.001 |
| 4 | PR | 0.721 | 0.684 | 0.038 | <0.001 | <0.001 |
| 4 | Screen-detected | 0.736 | 0.700 | 0.036 | <0.001 | <0.001 |
| 5 | ER | 0.712 | 0.675 | 0.037 | <0.001 | <0.001 |
| 5 | Symptomatic | 0.705 | 0.673 | 0.033 | <0.001 | <0.001 |
| 5 | Invasive | 0.707 | 0.669 | 0.037 | <0.001 | <0.001 |
| 5 | PR | 0.713 | 0.675 | 0.038 | <0.001 | <0.001 |
| 5 | Screen-detected | 0.718 | 0.682 | 0.036 | <0.001 | <0.001 |
| 6 | ER | 0.705 | 0.667 | 0.038 | <0.001 | <0.001 |
| 6 | Symptomatic | 0.698 | 0.662 | 0.036 | <0.001 | <0.001 |
| 6 | Invasive | 0.700 | 0.662 | 0.039 | <0.001 | <0.001 |
| 6 | PR | 0.705 | 0.666 | 0.039 | <0.001 | <0.001 |
| 6 | Screen-detected | 0.714 | 0.679 | 0.035 | <0.001 | <0.001 |
| 8 | ER | 0.679 | 0.643 | 0.036 | <0.001 | <0.001 |
| 8 | Symptomatic | 0.679 | 0.644 | 0.035 | <0.001 | <0.001 |
| 8 | Invasive | 0.676 | 0.640 | 0.036 | <0.001 | <0.001 |
| 8 | PR | 0.680 | 0.644 | 0.036 | <0.001 | <0.001 |
| 8 | Screen-detected | 0.684 | 0.651 | 0.033 | <0.001 | <0.001 |
| 8 | Stage 2 or later | 0.707 | 0.677 | 0.030 | <0.001 | <0.001 |
| 10 | ER | 0.678 | 0.642 | 0.036 | <0.001 | <0.001 |
| 10 | HER2 | 0.660 | 0.622 | 0.037 | <0.001 | <0.001 |
| 10 | Symptomatic | 0.678 | 0.649 | 0.030 | <0.001 | <0.001 |
| 10 | Invasive | 0.673 | 0.637 | 0.036 | <0.001 | <0.001 |
| 10 | PR | 0.678 | 0.643 | 0.034 | <0.001 | <0.001 |
| 10 | Screen-detected | 0.674 | 0.637 | 0.037 | <0.001 | <0.001 |
| 10 | Stage 2 or later | 0.706 | 0.683 | 0.023 | <0.001 | <0.001 |
Table A4.
Age adjusted discriminatory performance of Tyrer–Cuzick v8 compared with the imaging-only AI risk model by cancer subtype. Table of 36 significant risk model prediction performance differences when comparing the Tyrer–Cuzick v8 risk model with the imaging-only AI risk model. The examined subtypes were mode of detection (screen-detected, symptomatic), stage (stage 1 or earlier, stage 2 or later), invasiveness (invasive, in situ), and receptor status (ER, PR, HER2). The significant differences are presented by years of follow-up and subtype. A p-value below 0.05 was considered a significant difference between the two risk model AUCs after adjusting the Holm–Bonferroni method to account for multiple comparison.
| Year | Cancer Subtype | Comparison AUC | Reference AUC | AUC Difference | Holm p-Value | Raw p-Value |
|---|
| 1 | Stage 2 or later | 0.528 | 0.785 | −0.258 | 0.021 | <0.001 |
| 2 | ER | 0.613 | 0.711 | −0.098 | 0.011 | <0.001 |
| 2 | In situ | 0.631 | 0.801 | −0.171 | 0.007 | <0.001 |
| 2 | Invasive | 0.620 | 0.714 | −0.095 | 0.015 | <0.001 |
| 2 | Screen-detected | 0.606 | 0.721 | −0.115 | 0.005 | <0.001 |
| 2 | Stage 2 or later | 0.620 | 0.791 | −0.171 | 0.01 | <0.001 |
| 3 | ER | 0.618 | 0.708 | −0.09 | 0.004 | <0.001 |
| 3 | In situ | 0.622 | 0.772 | −0.15 | 0.003 | <0.001 |
| 3 | Invasive | 0.626 | 0.707 | −0.081 | 0.003 | <0.001 |
| 3 | PR | 0.628 | 0.716 | −0.088 | 0.008 | <0.001 |
| 3 | Screen-detected | 0.609 | 0.719 | −0.11 | <0.001 | <0.001 |
| 3 | Stage 2 or later | 0.640 | 0.774 | −0.134 | 0.007 | <0.001 |
| 4 | ER | 0.621 | 0.686 | −0.065 | 0.046 | <0.001 |
| 4 | In situ | 0.642 | 0.761 | −0.119 | 0.035 | <0.001 |
| 4 | Invasive | 0.617 | 0.677 | −0.061 | 0.009 | <0.001 |
| 4 | Screen-detected | 0.605 | 0.700 | −0.095 | <0.001 | <0.001 |
| 4 | Stage 2 or later | 0.629 | 0.735 | −0.106 | 0.007 | <0.001 |
| 5 | ER | 0.612 | 0.675 | −0.063 | 0.003 | <0.001 |
| 5 | In situ | 0.603 | 0.726 | −0.124 | 0.004 | <0.001 |
| 5 | Invasive | 0.608 | 0.669 | −0.061 | 0.001 | <0.001 |
| 5 | Screen-detected | 0.590 | 0.682 | −0.092 | <0.001 | <0.001 |
| 5 | Stage 2 or later | 0.631 | 0.726 | −0.095 | 0.004 | <0.001 |
| 6 | ER | 0.611 | 0.667 | −0.056 | 0.018 | <0.001 |
| 6 | In situ | 0.597 | 0.730 | −0.133 | <0.001 | <0.001 |
| 6 | Invasive | 0.608 | 0.662 | −0.054 | 0.001 | <0.001 |
| 6 | Screen-detected | 0.586 | 0.679 | −0.094 | <0.001 | <0.001 |
| 6 | Stage 2 or later | 0.631 | 0.701 | −0.07 | 0.047 | <0.001 |
| 8 | ER | 0.599 | 0.643 | −0.043 | 0.024 | <0.001 |
| 8 | In situ | 0.584 | 0.700 | −0.116 | <0.001 | <0.001 |
| 8 | Invasive | 0.595 | 0.640 | −0.045 | 0.005 | <0.001 |
| 8 | Screen-detected | 0.575 | 0.651 | −0.076 | <0.001 | <0.001 |
| 8 | Stage 2 or later | 0.609 | 0.677 | −0.069 | 0.012 | <0.001 |
| 10 | In situ | 0.591 | 0.673 | −0.082 | 0.012 | <0.001 |
| 10 | invasive | 0.600 | 0.637 | −0.037 | 0.021 | <0.001 |
| 10 | Screen-detected | 0.590 | 0.637 | −0.047 | 0.018 | <0.001 |
| 10 | Stage 2 or later | 0.613 | 0.683 | −0.069 | 0.002 | <0.001 |
Table A5.
Risk classification and stratification following the NICE guidelines of absolute risks at study entry for cases and the subcohort in the 10-year follow-up study population using the lifestyle/familial-expanded AI risk model, the imaging-only AI risk model, and the Tyrer–Cuzick v8 risk model.
| Risk Group 1 | Cases, N (%) | Subcohort, N (%) | Absolute Risk, % 2 | Risk Ratio 3 |
|---|
| Expanded AI risk 4 | | | | |
| Low | 72/1661 (4.3%) | 920/8110 (11%) | 0.11 | 0.31 |
| General | 934/1661 (56%) | 5748/8110 (71%) | 0.36 | 1.0 (ref.) |
| Moderate | 284/1661 (17%) | 844/8110 (10%) | 1.12 | 3.1 |
| High | 371/1661 (22%) | 590/8110 (7.3%) | 2.40 | 6.7 |
| Imaging-only AI risk | | | | |
| Low | 74/1661 (4.5%) | 743/8110 (9.2%) | 0.12 | 0.32 |
| General | 1012/1661 (61%) | 6047/8110 (75%) | 0.37 | 1.0 (ref.) |
| Moderate | 261/1661 (16%) | 800/8110 (9.9%) | 1.12 | 3.0 |
| High | 314/1661 (19%) | 512/8110 (6.3%) | 2.36 | 6.4 |
| Tyrer–Cuzick v8 | | | | |
| Low | 1/1661 (<0.1%) | 20/8110 (0.2%) | 0.68 | 0.29 |
| General | 1145/1661 (69%) | 6500/8110 (80%) | 2.30 | 1.0 (ref.) |
| Moderate | 395/1661 (24%) | 1381/8110 (17%) | 5.05 | 2.2 |
| High | 120/1661 (7.2%) | 209/8110 (2.6%) | 9.76 | 4.2 |
Table A6.
Risk classification per USPSTF guidelines of absolute risks at enrollment for breast cancers and women in the subcohort using three risk models. Risk classification and stratification following the USPSTF guidelines of absolute risks at study entry for cases and the subcohort in the 10-year follow-up study population using the lifestyle/familial-expanded AI risk model, the imaging-only AI risk model, and Tyrer–Cuzick v8.
| Risk Group 1 | Cases, N (%) | Subcohort, N (%) | Absolute Risk, % 2 | Risk Ratio 3 |
|---|
| Expanded AI risk 4 | | | | |
| General | 189/1661 (11%) | 2180/8110 (27%) | 0.16 | 1.0 (ref.) |
| Moderate | 960/1661 (58%) | 5025/8110 (62%) | 0.46 | 2.8 |
| High | 512/1661 (31%) | 905/8110 (11%) | 1.90 | 11.7 |
| Imaging-only risk | | | | |
| General | 208/1661 (13%) | 1948/8110 (24%) | 0.17 | 1.0 (ref.) |
| Moderate | 1025/1661 (62%) | 5334/8110 (66%) | 0.45 | 2.6 |
| High | 428/1661 (26%) | 828/8110 (10%) | 1.83 | 10.7 |
| Tyre–Cuzick v8 | | | | |
| General | 25/1661 (1.5%) | 300/8110 (3.7%) | 1.05 | 1.0 (ref.) |
| Moderate | 1365/1661 (82%) | 7248/8110 (89%) | 2.53 | 2.4 |
| High | 271/1661 (16%) | 562/8110 (6.9%) | 7.51 | 7.2 |


