
Spatial Transcriptomics Identifies Expression Signatures Specific to Lacrimal Gland Adenoid Cystic Carcinoma Cells

 , , ,
, , ,  ,
, 
Abstract
:Simple Summary
Abstract
1. Introduction
2. Materials and Methods
2.1. Bulk RNA-Seq and Analysis
2.2. Spatial Transcriptomics
2.3. Pathology Annotations
2.4. Spatial Transcriptomic Analysis
2.5. Gene Ontology (GO) and Pathway Analyses
2.6. Immunofluorescent Staining
3. Results
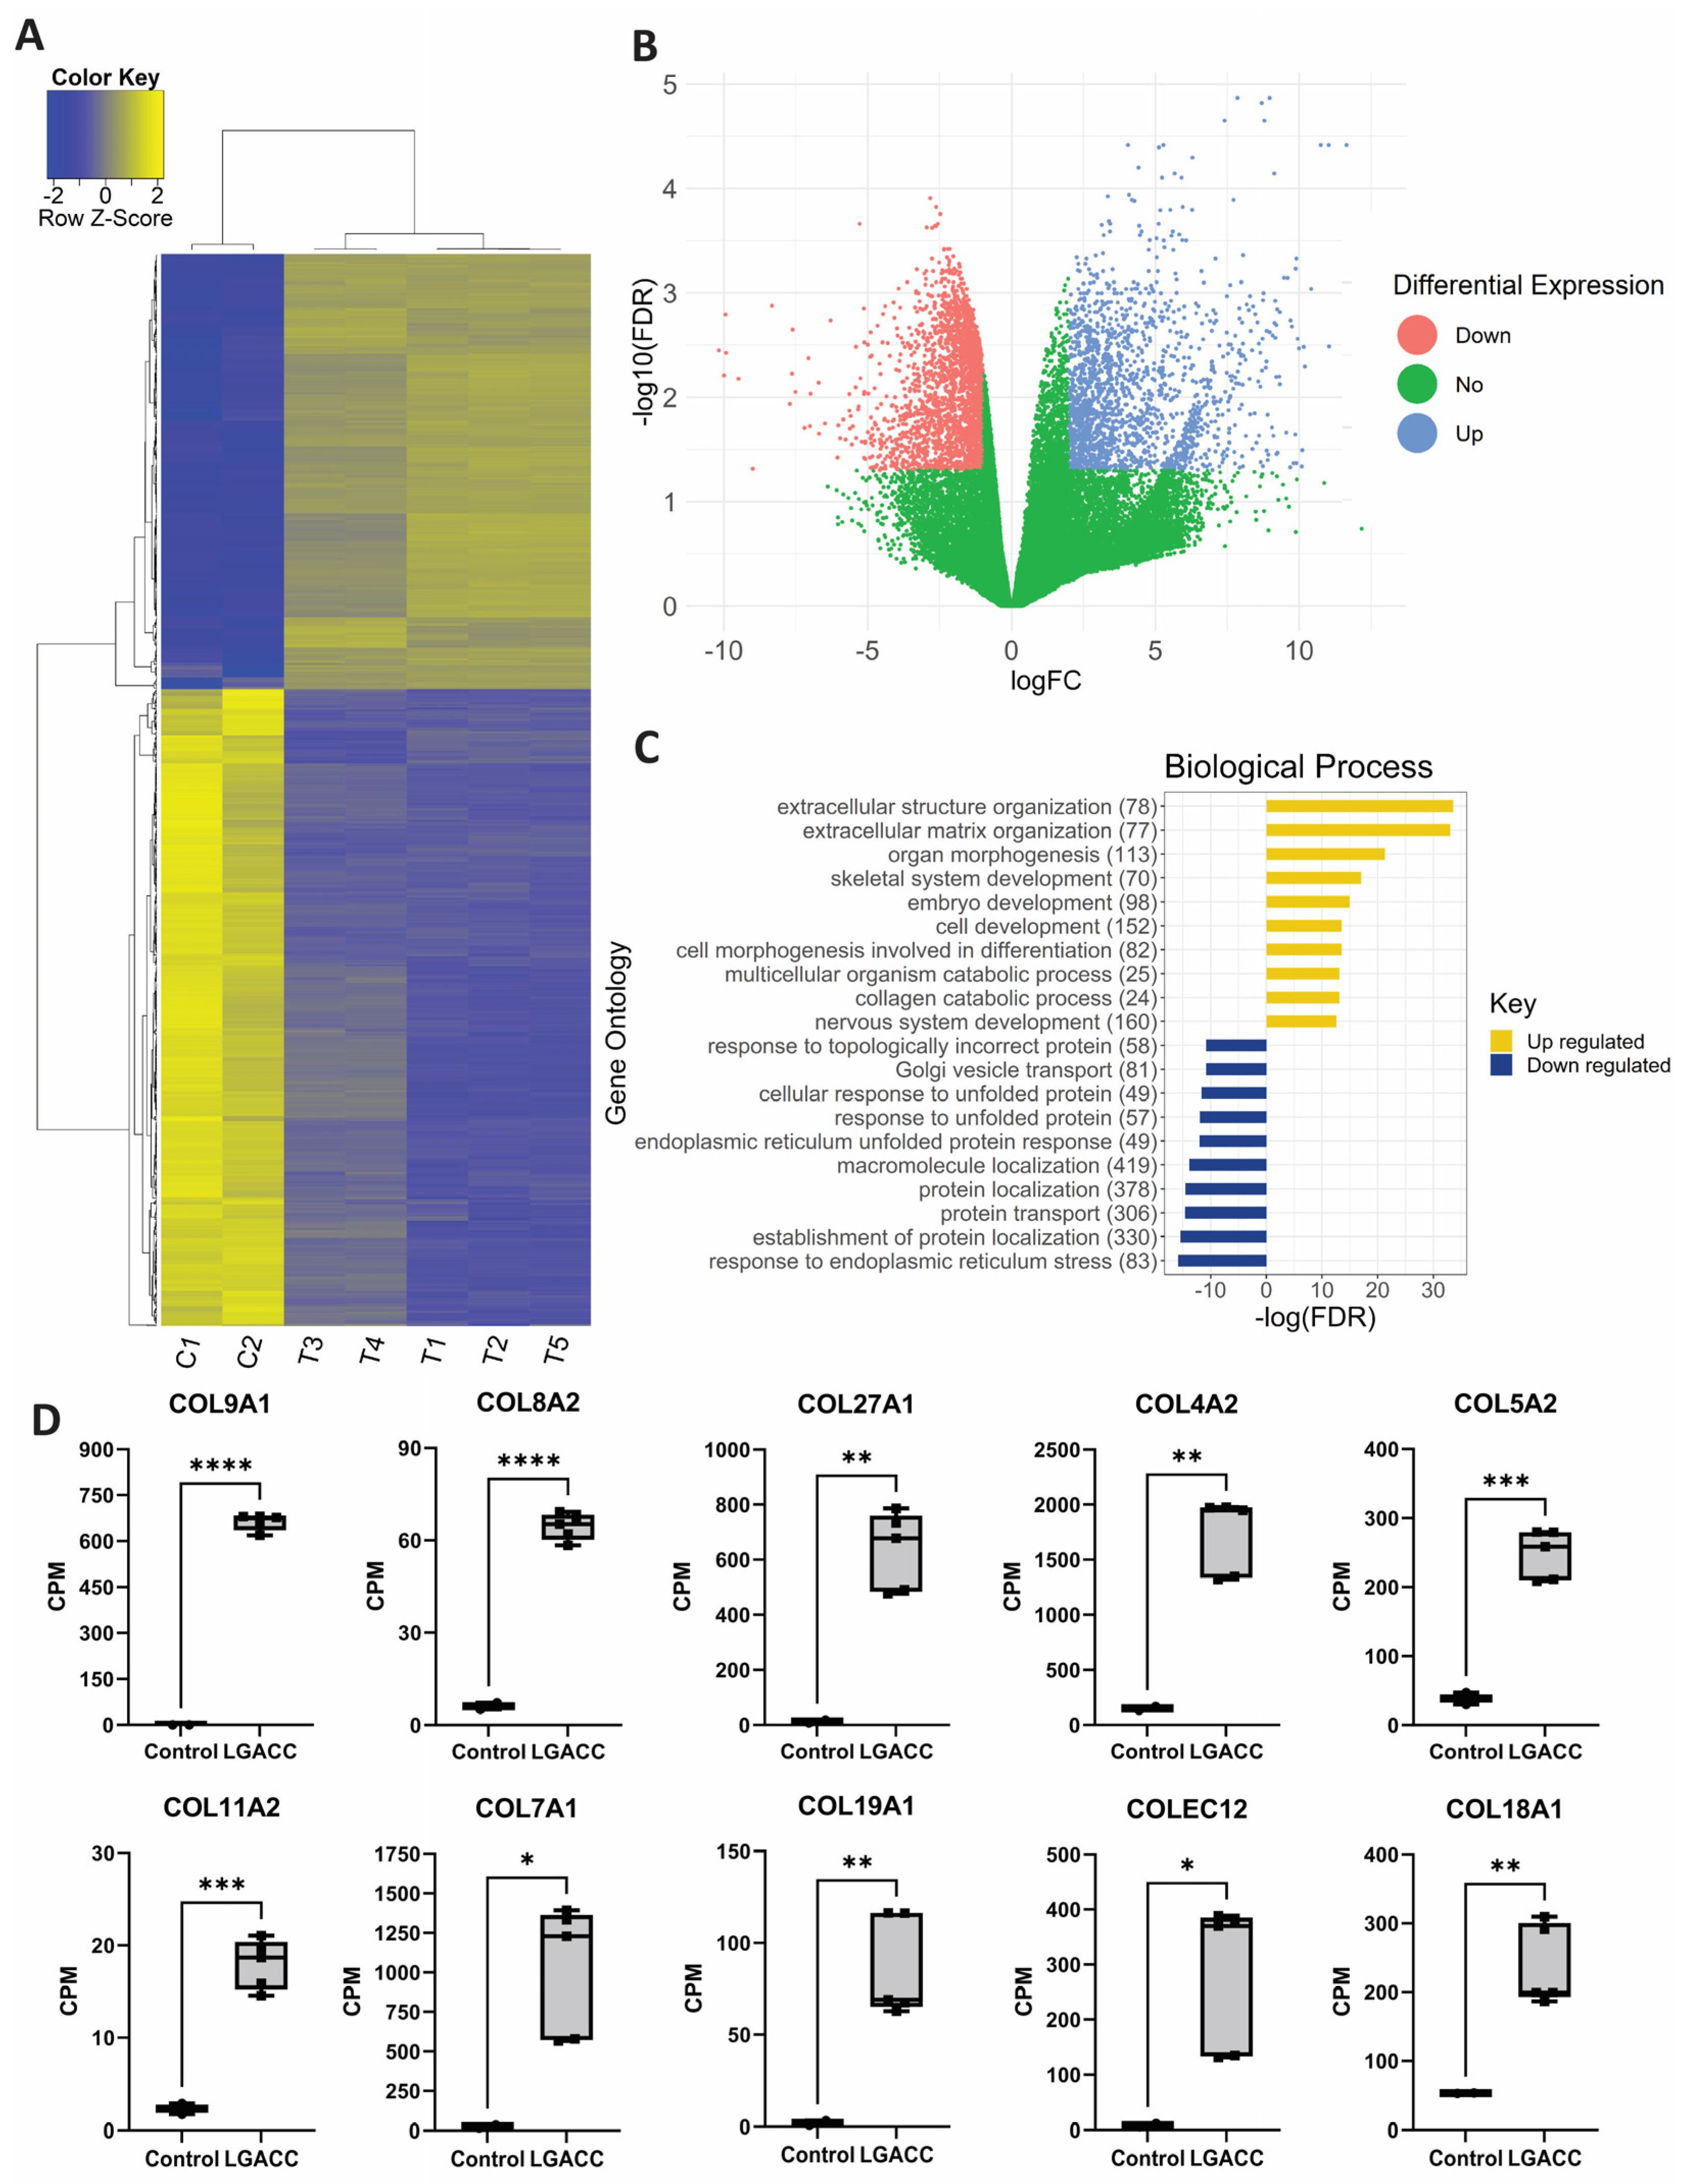
3.1. Bulk RNA-Seq
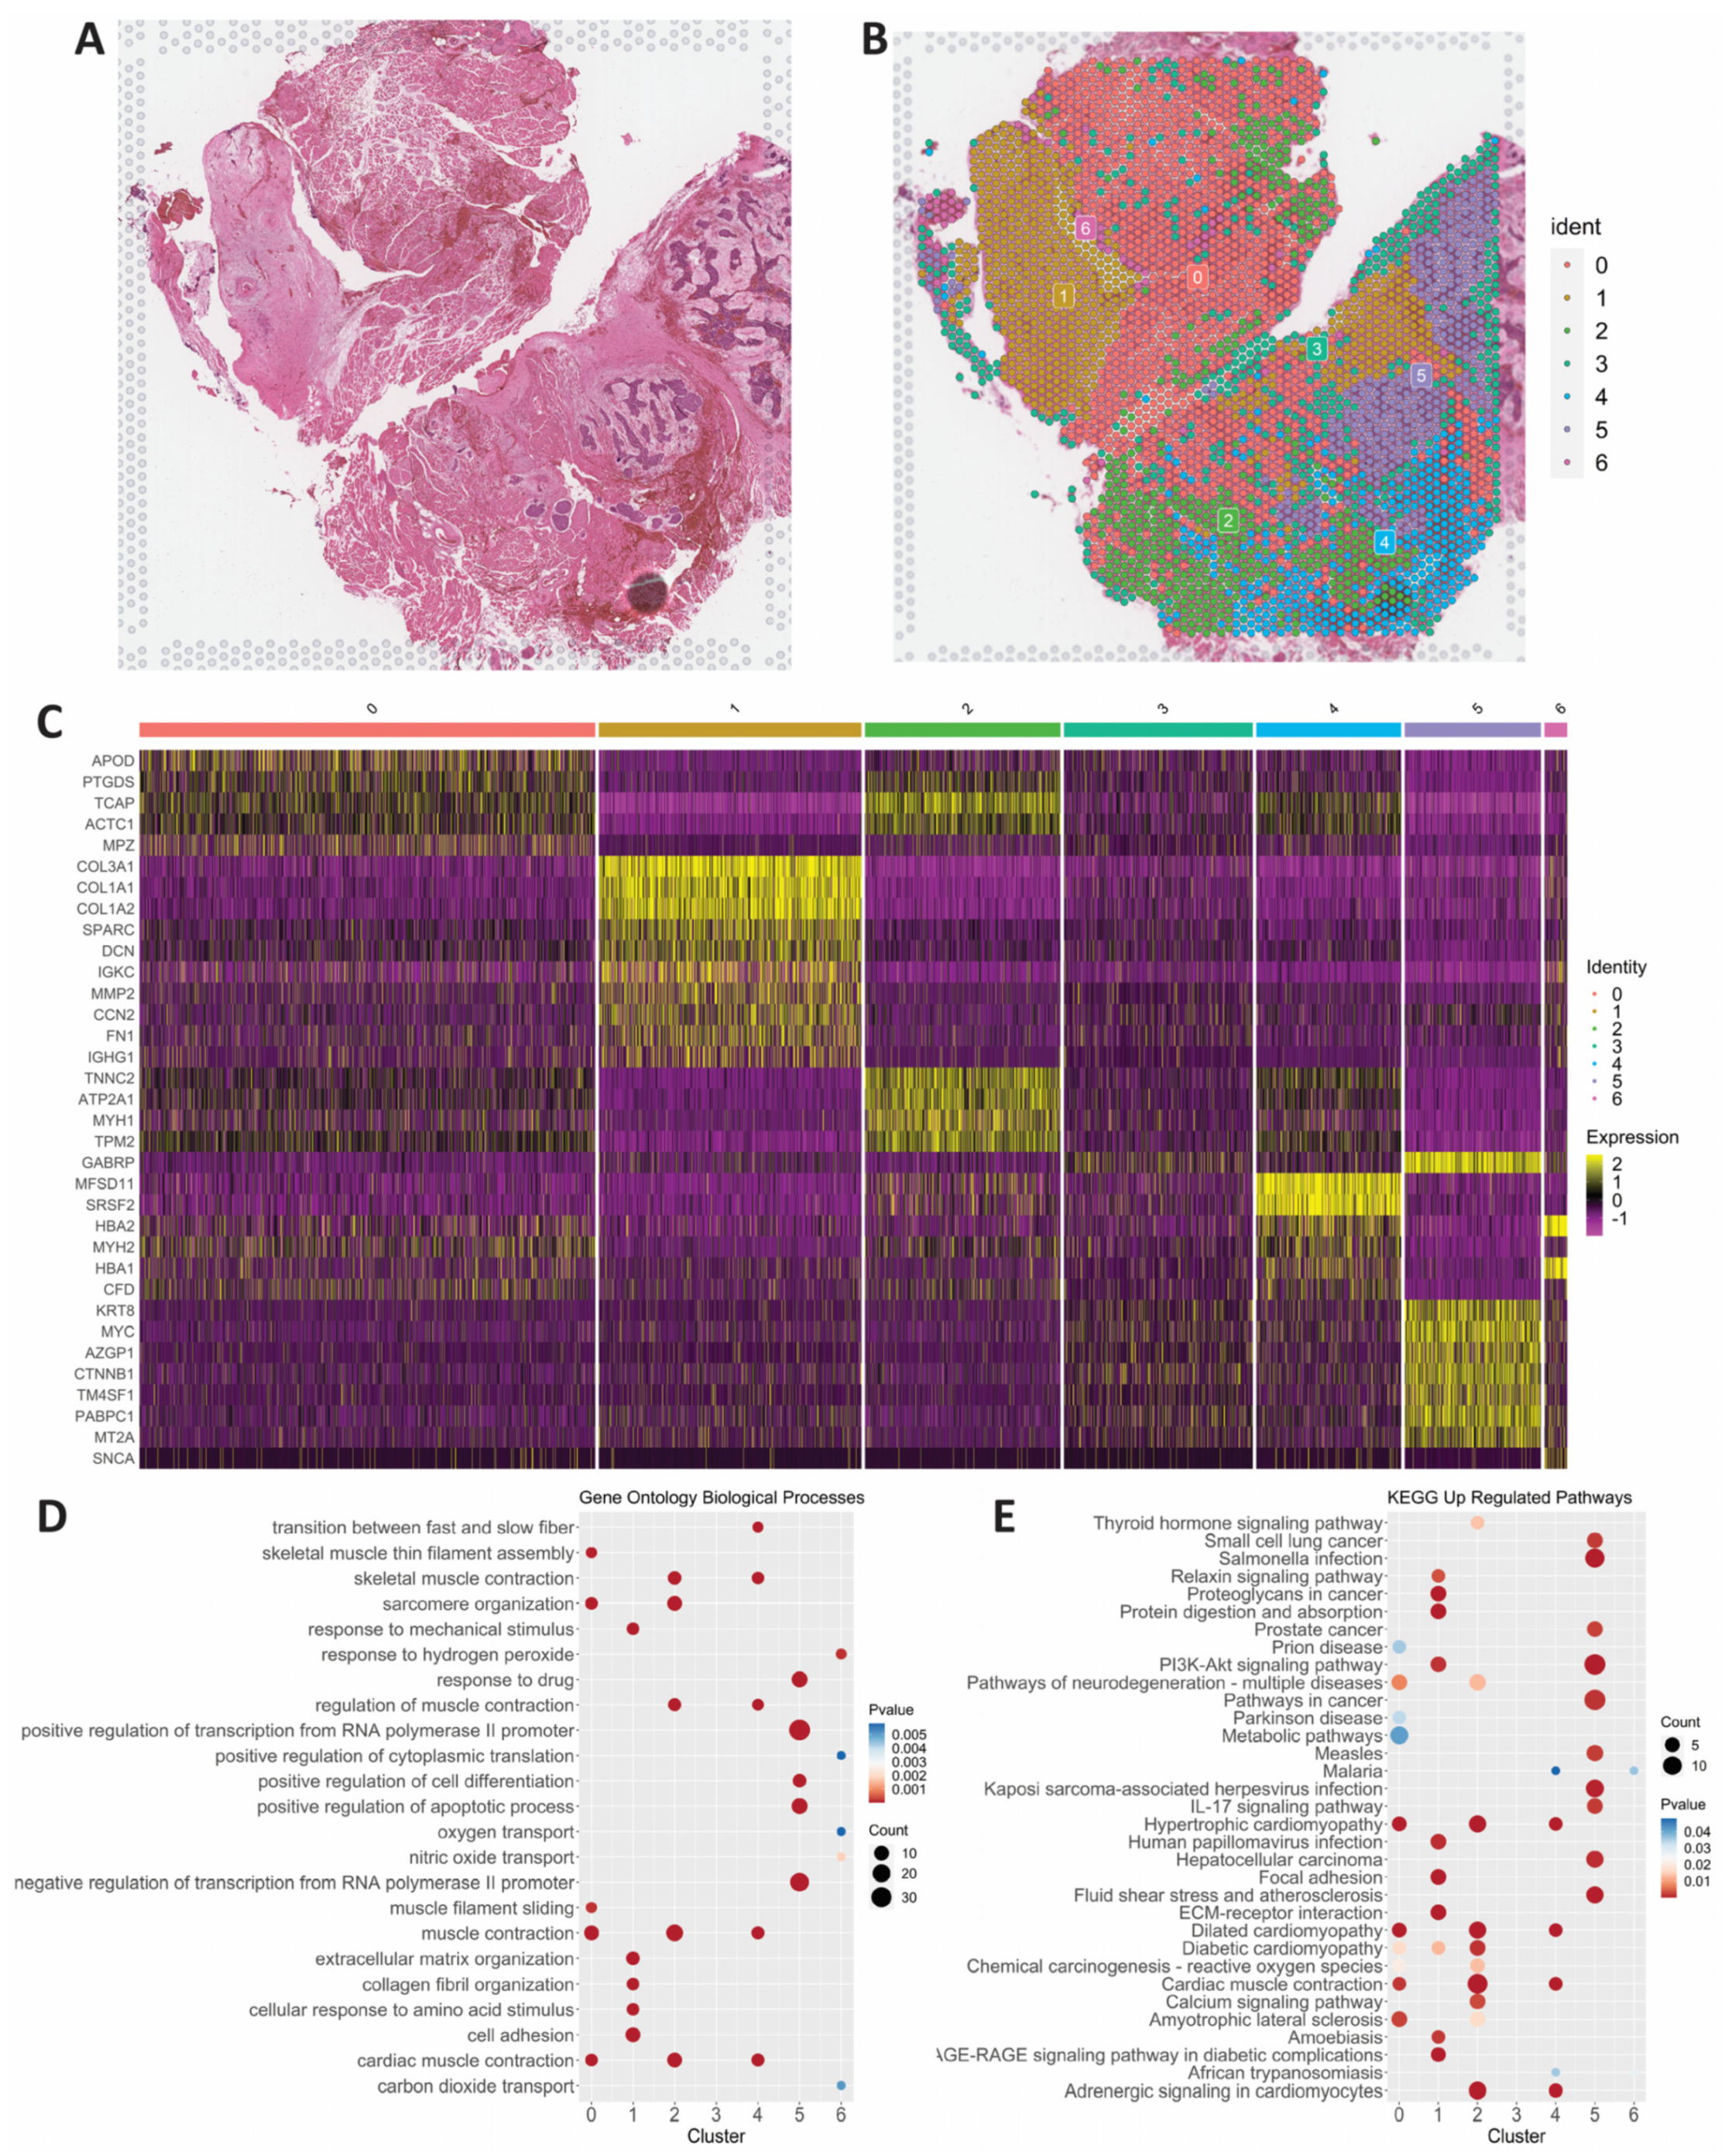
3.2. Spatial Transcriptomics
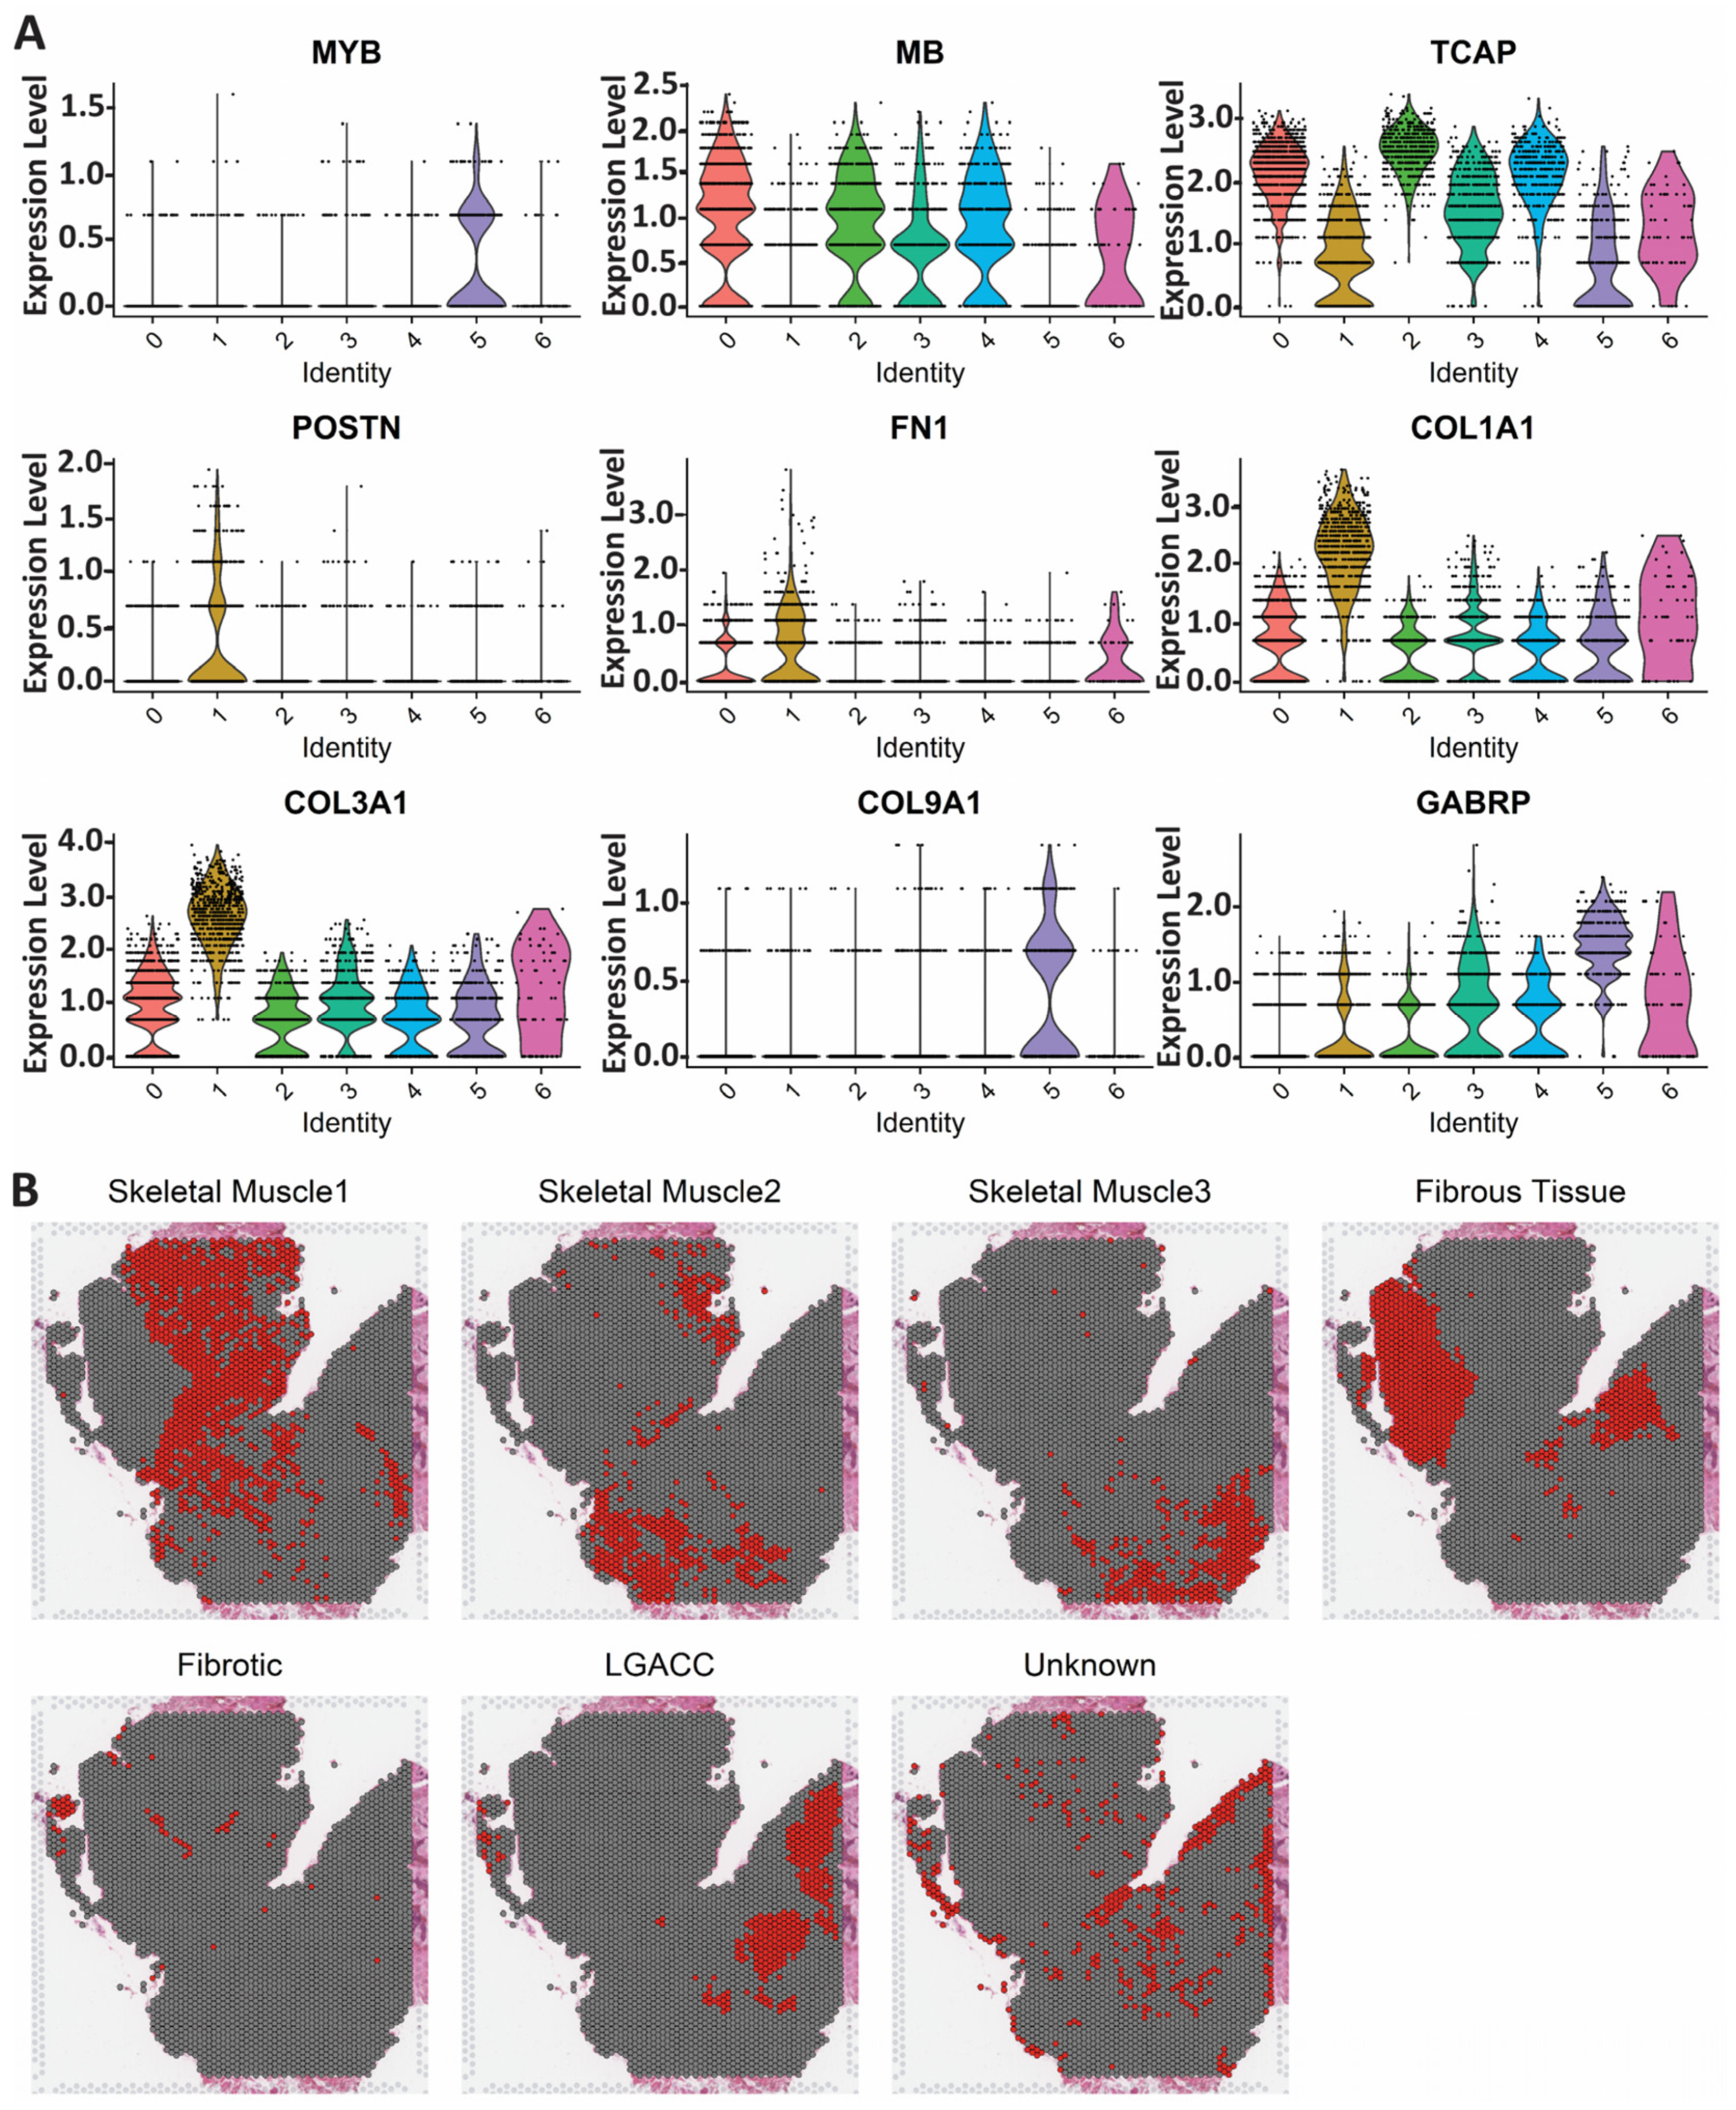
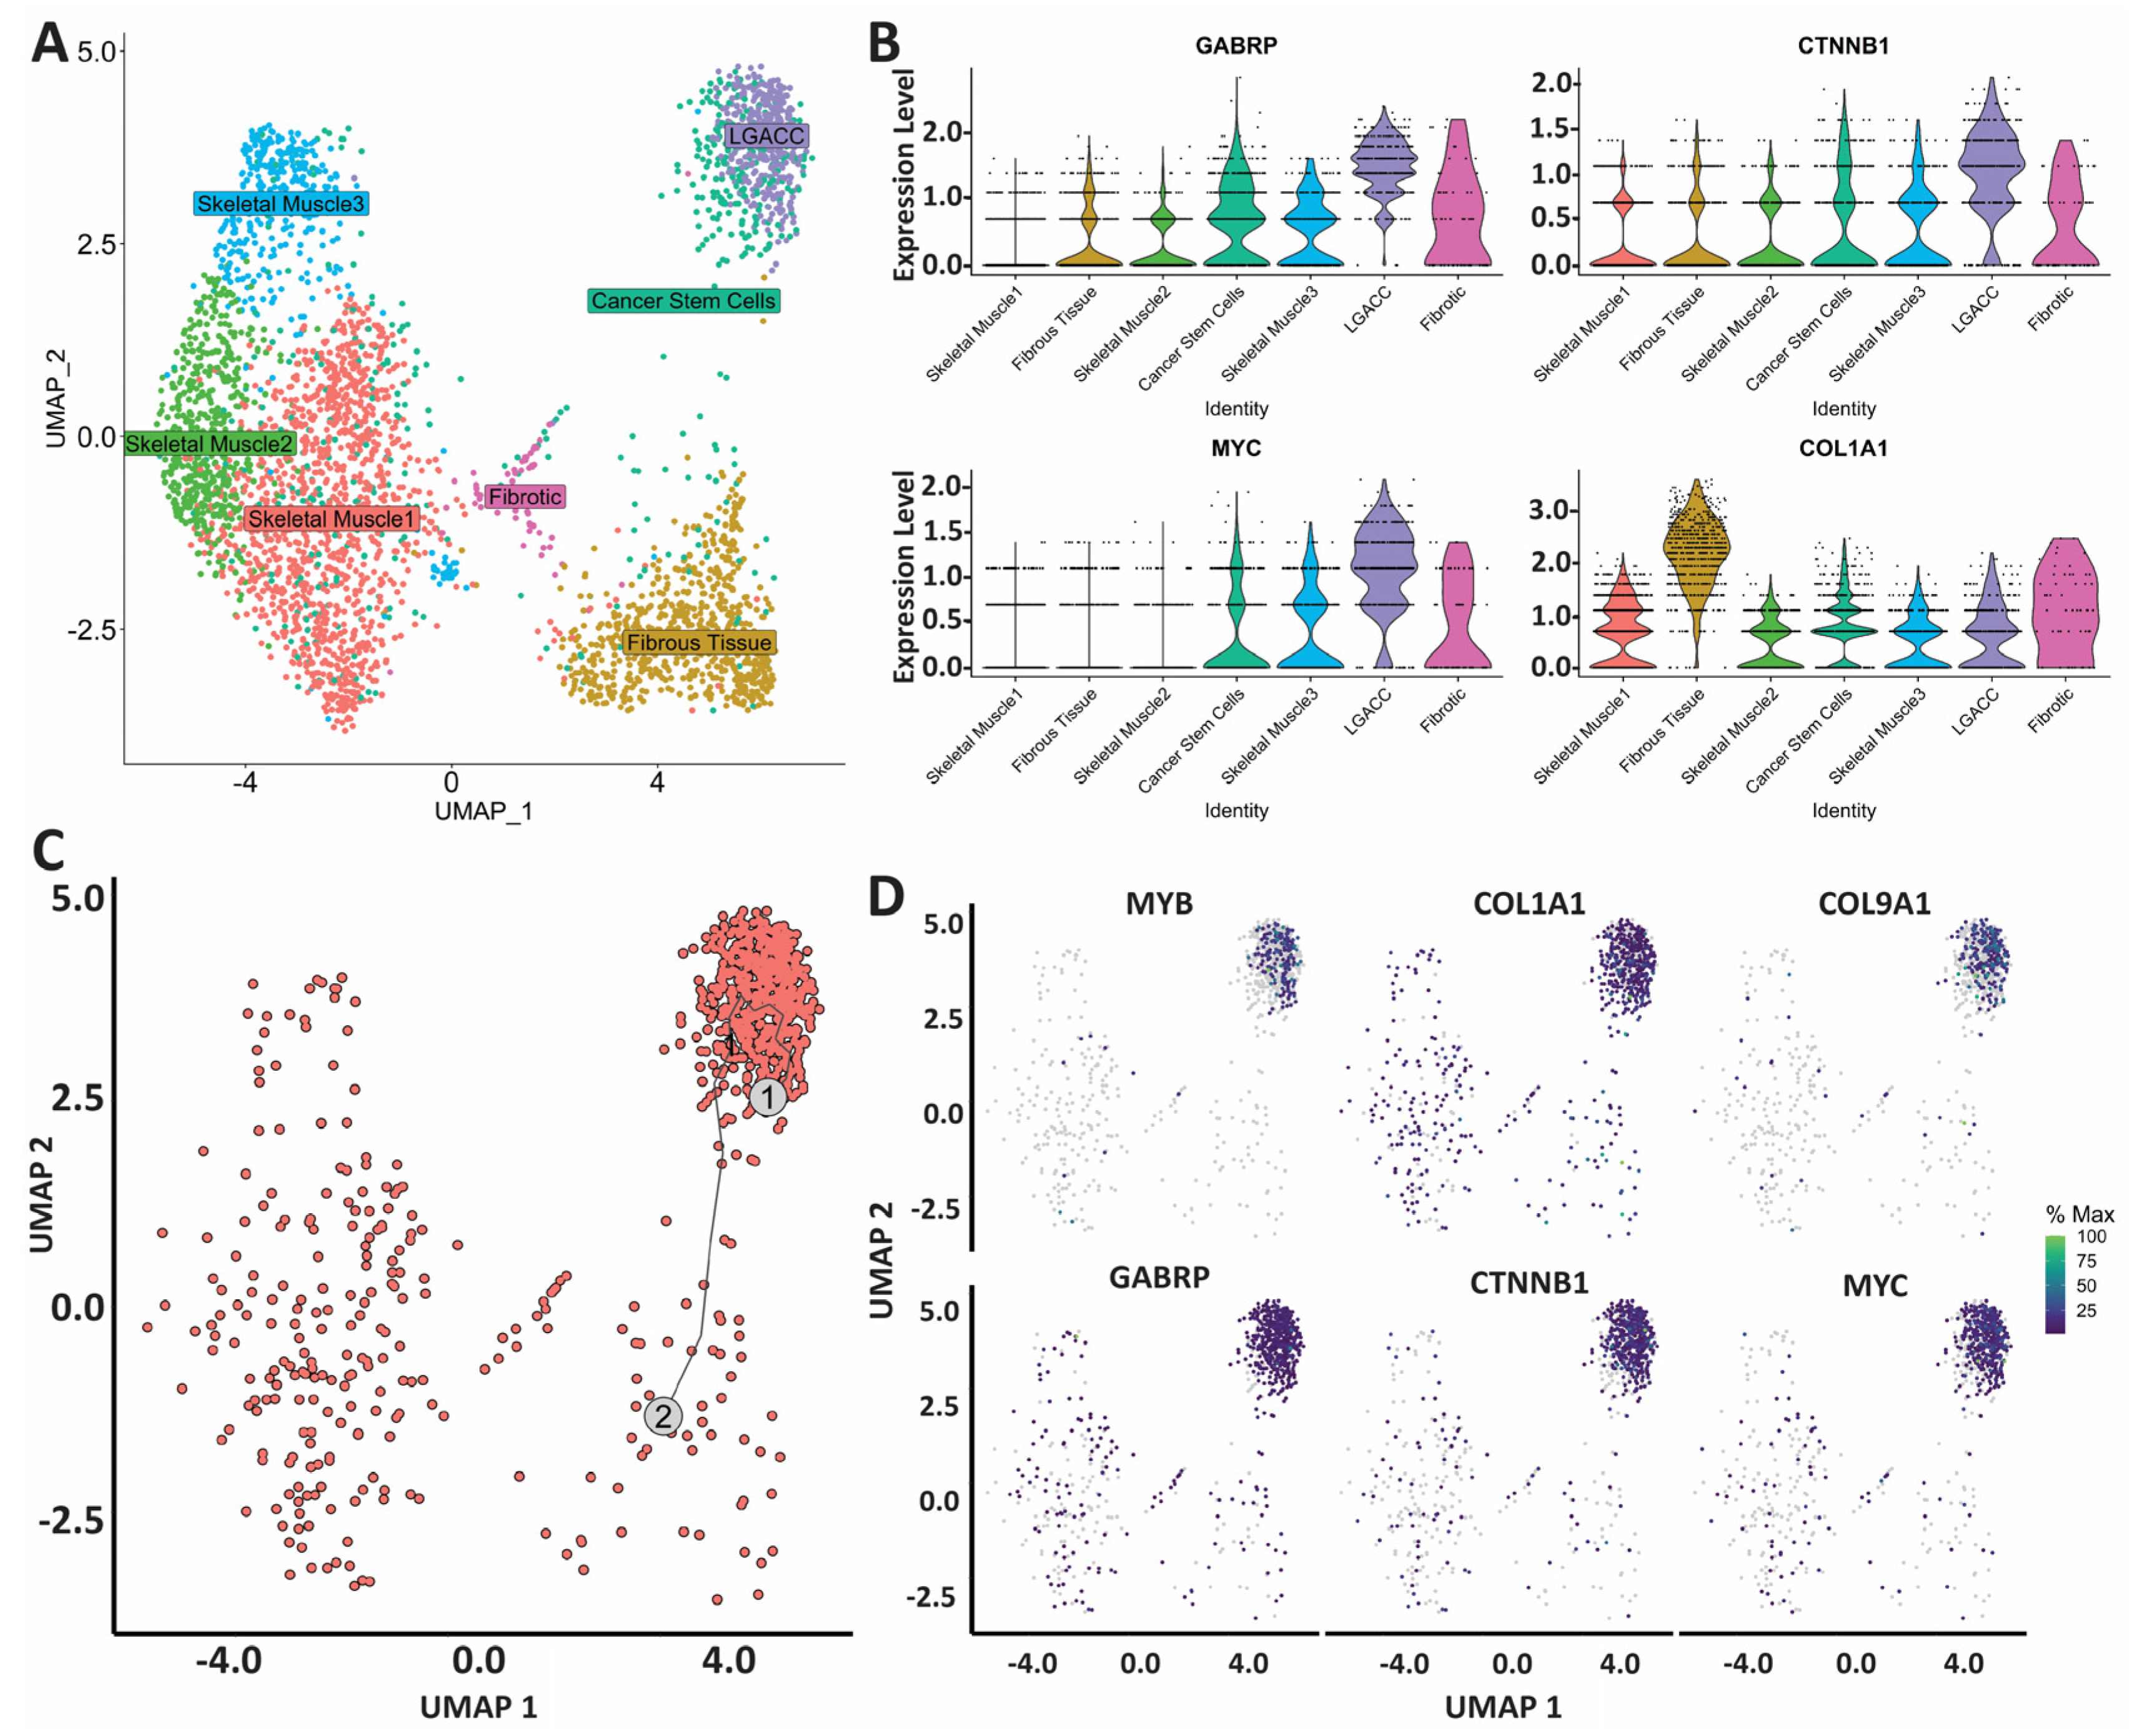
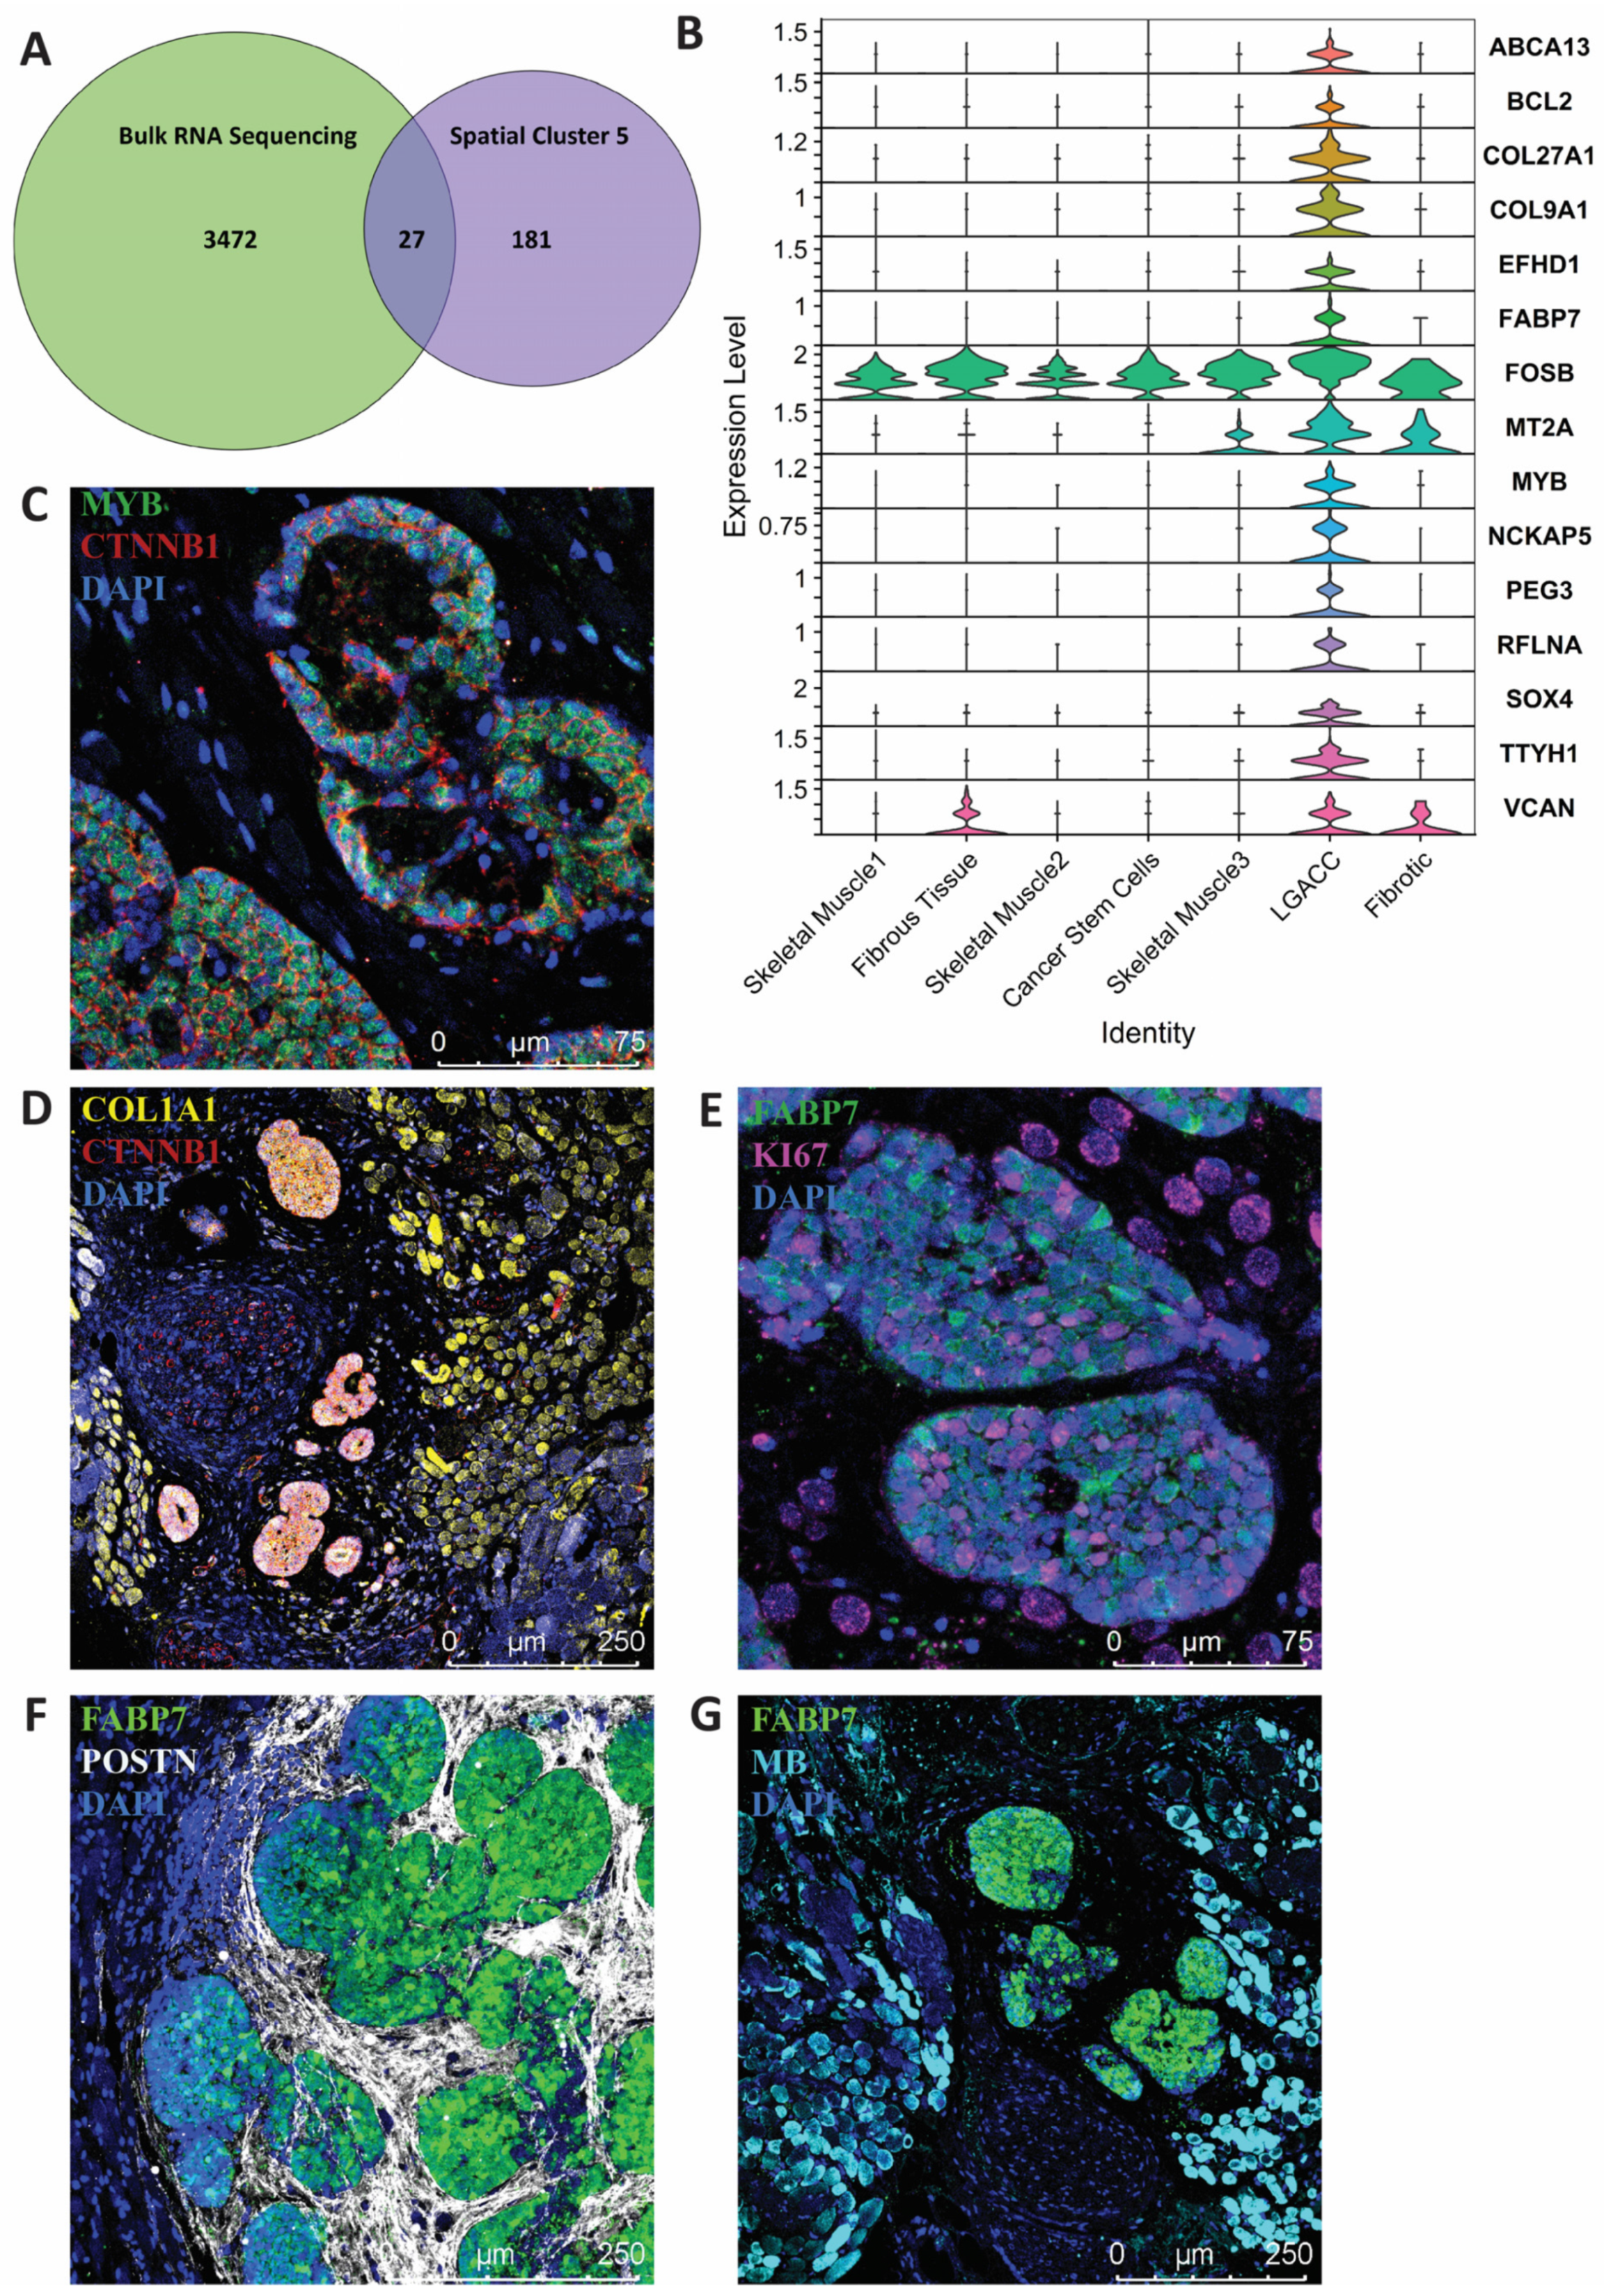
3.3. Combination of Bulk RNA-Seq and Spatial Transcriptomics Identifies Markers of LGACC and Surrounding Tissue
4. Discussion
5. Conclusions
Supplementary Materials
Author Contributions
Funding
Institutional Review Board Statement
Informed Consent Statement
Data Availability Statement
Acknowledgments
Conflicts of Interest
References
- Font, R.L.; Smith, S.L.; Bryan, R.G. Malignant epithelial tumors of the lacrimal gland: A clinicopathologic study of 21 cases. Arch. Ophthalmol. 1998, 116, 613–616. [Google Scholar] [CrossRef] [PubMed] [Green Version]
- Tse, D.T.; Benedetto, P.W.; Tse, B.C.; Feuer, W.J. Neoadjuvant Intra-Arterial Cytoreductive Chemotherapy for Lacrimal Gland Adenoid Cystic Carcinoma: A Long-Term Follow-up Study of a Trimodal Strategy. Am. J. Ophthalmol. 2022, 240, 239–251. [Google Scholar] [CrossRef] [PubMed]
- Tse, D.T.; Kossler, A.L.; Feuer, W.J.; Benedetto, P.W. Long-term outcomes of neoadjuvant intra-arterial cytoreductive chemotherapy for lacrimal gland adenoid cystic carcinoma. Ophthalmology 2013, 120, 1313–1323. [Google Scholar] [CrossRef] [PubMed] [Green Version]
- Lesueur, P.; Rapeaud, E.; De Marzi, L.; Goudjil, F.; Levy, C.; Galatoire, O.; Jacomet, P.V.; Dendale, R.; Calugaru, V. Adenoid Cystic Carcinoma of the Lacrimal Gland: High Dose Adjuvant Proton Therapy to Improve Patients Outcomes. Front. Oncol. 2020, 10, 135. [Google Scholar] [CrossRef] [Green Version]
- Doddapaneni, R.; Tao, W.; Naranjo, A.; Nikpoor, N.; Tse, D.T.; Pelaez, D. Fibroblast growth factor receptor 1 (FGFR1) as a therapeutic target in adenoid cystic carcinoma of the lacrimal gland. Oncotarget 2019, 10, 480–493. [Google Scholar] [CrossRef] [PubMed] [Green Version]
- Sant, D.W.; Tao, W.; Field, M.G.; Pelaez, D.; Jin, K.; Capobianco, A.; Dubovy, S.R.; Tse, D.T.; Wang, G. Whole Exome Sequencing of Lacrimal Gland Adenoid Cystic Carcinoma. Investig. Ophthalmol. Vis. Sci. 2017, 58, BIO240–BIO246. [Google Scholar] [CrossRef] [Green Version]
- Satija, R.; Farrell, J.A.; Gennert, D.; Schier, A.F.; Regev, A. Spatial reconstruction of single-cell gene expression data. Nat. Biotechnol. 2015, 33, 495–502. [Google Scholar] [CrossRef] [Green Version]
- Butler, A.; Hoffman, P.; Smibert, P.; Papalexi, E.; Satija, R. Integrating single-cell transcriptomic data across different conditions, technologies, and species. Nat. Biotechnol. 2018, 36, 411–420. [Google Scholar] [CrossRef]
- Stuart, T.; Butler, A.; Hoffman, P.; Hafemeister, C.; Papalexi, E.; Mauck, W.M., 3rd; Hao, Y.; Stoeckius, M.; Smibert, P.; Satija, R. Comprehensive Integration of Single-Cell Data. Cell 2019, 177, 1888–1902.e1821. [Google Scholar] [CrossRef]
- Hao, Y.; Hao, S.; Andersen-Nissen, E.; Mauck, W.M., 3rd; Zheng, S.; Butler, A.; Lee, M.J.; Wilk, A.J.; Darby, C.; Zager, M.; et al. Integrated analysis of multimodal single-cell data. Cell 2021, 184, 3573–3587.e3529. [Google Scholar] [CrossRef]
- Cao, J.; Spielmann, M.; Qiu, X.; Huang, X.; Ibrahim, D.M.; Hill, A.J.; Zhang, F.; Mundlos, S.; Christiansen, L.; Steemers, F.J.; et al. The single-cell transcriptional landscape of mammalian organogenesis. Nature 2019, 566, 496–502. [Google Scholar] [CrossRef] [PubMed]
- Qiu, X.; Mao, Q.; Tang, Y.; Wang, L.; Chawla, R.; Pliner, H.A.; Trapnell, C. Reversed graph embedding resolves complex single-cell trajectories. Nat. Methods 2017, 14, 979–982. [Google Scholar] [CrossRef] [PubMed] [Green Version]
- Trapnell, C.; Cacchiarelli, D.; Grimsby, J.; Pokharel, P.; Li, S.; Morse, M.; Lennon, N.J.; Livak, K.J.; Mikkelsen, T.S.; Rinn, J.L. The dynamics and regulators of cell fate decisions are revealed by pseudotemporal ordering of single cells. Nat. Biotechnol. 2014, 32, 381–386. [Google Scholar] [CrossRef] [Green Version]
- Huang, D.W.; Sherman, B.T.; Lempicki, R.A. Systematic and integrative analysis of large gene lists using DAVID bioinformatics resources. Nat. Protoc. 2009, 4, 44–57. [Google Scholar] [CrossRef]
- Wickham, H. Ggplot2: Elegant Graphics for Data Analysis; Springer: New York, NY, USA, 2016. [Google Scholar]
- Li, X.; Wang, H.; Yang, X.; Wang, X.; Zhao, L.; Zou, L.; Yang, Q.; Hou, Z.; Tan, J.; Zhang, H.; et al. GABRP sustains the stemness of triple-negative breast cancer cells through EGFR signaling. Cancer Lett. 2021, 514, 90–102. [Google Scholar] [CrossRef]
- Elbadawy, M.; Usui, T.; Yamawaki, H.; Sasaki, K. Emerging Roles of C-Myc in Cancer Stem Cell-Related Signaling and Resistance to Cancer Chemotherapy: A Potential Therapeutic Target Against Colorectal Cancer. Int. J. Mol. Sci. 2019, 20, 2340. [Google Scholar] [CrossRef] [Green Version]
- Teng, Y.; Wang, X.; Wang, Y.; Ma, D. Wnt/beta-catenin signaling regulates cancer stem cells in lung cancer A549 cells. Biochem. Biophys. Res. Commun. 2010, 392, 373–379. [Google Scholar] [CrossRef]
- Phi, L.T.H.; Sari, I.N.; Yang, Y.G.; Lee, S.H.; Jun, N.; Kim, K.S.; Lee, Y.K.; Kwon, H.Y. Cancer Stem Cells (CSCs) in Drug Resistance and their Therapeutic Implications in Cancer Treatment. Stem Cells Int. 2018, 2018, 5416923. [Google Scholar] [CrossRef] [Green Version]
- Yu, Z.; Pestell, T.G.; Lisanti, M.P.; Pestell, R.G. Cancer stem cells. Int. J. Biochem. Cell Biol. 2012, 44, 2144–2151. [Google Scholar] [CrossRef] [PubMed] [Green Version]
- Jordan, C.T.; Guzman, M.L.; Noble, M. Cancer stem cells. N. Engl. J. Med. 2006, 355, 1253–1261. [Google Scholar] [CrossRef] [PubMed]
- Tanabe, S.; Aoyagi, K.; Yokozaki, H.; Sasaki, H. Regulation of CTNNB1 signaling in gastric cancer and stem cells. World J. Gastrointest. Oncol. 2016, 8, 592–598. [Google Scholar] [CrossRef] [PubMed]
- Zhang, Y.; Wang, X. Targeting the Wnt/beta-catenin signaling pathway in cancer. J. Hematol. Oncol. 2020, 13, 165. [Google Scholar] [CrossRef] [PubMed]
- Koury, J.; Zhong, L.; Hao, J. Targeting Signaling Pathways in Cancer Stem Cells for Cancer Treatment. Stem Cells Int. 2017, 2017, 2925869. [Google Scholar] [CrossRef] [Green Version]
- Takahashi-Yanaga, F.; Kahn, M. Targeting Wnt signaling: Can we safely eradicate cancer stem cells? Clin. Cancer Res. 2010, 16, 3153–3162. [Google Scholar] [CrossRef] [PubMed] [Green Version]
- Xu, Y.; He, X.; Wang, S.; Sun, B.; Jia, R.; Chai, P.; Li, F.; Yang, Y.; Ge, S.; Jia, R.; et al. The m(6)A reading protein YTHDF3 potentiates tumorigenicity of cancer stem-like cells in ocular melanoma through facilitating CTNNB1 translation. Oncogene 2022, 41, 1281–1297. [Google Scholar] [CrossRef]
- Sizemore, G.M.; Sizemore, S.T.; Seachrist, D.D.; Keri, R.A. GABA(A) receptor pi (GABRP) stimulates basal-like breast cancer cell migration through activation of extracellular-regulated kinase 1/2 (ERK1/2). J. Biol. Chem. 2014, 289, 24102–24113. [Google Scholar] [CrossRef] [Green Version]
- Yoshida, G.J. Emerging roles of Myc in stem cell biology and novel tumor therapies. J. Exp. Clin. Cancer Res. 2018, 37, 173. [Google Scholar] [CrossRef] [Green Version]
- Kim, M.; Singh, M.; Lee, B.K.; Hibbs, M.; Richardson, K.; Ellies, L.; Wintle, L.; Stuart, L.M.; Wang, J.Y.; Voon, D.C.; et al. A MYC-ZNF148-ID1/3 regulatory axis modulating cancer stem cell traits in aggressive breast cancer. Oncogenesis 2022, 11, 60. [Google Scholar] [CrossRef]
- Dang, C.V. MYC on the path to cancer. Cell 2012, 149, 22–35. [Google Scholar] [CrossRef] [Green Version]
- Pickup, M.W.; Mouw, J.K.; Weaver, V.M. The extracellular matrix modulates the hallmarks of cancer. EMBO Rep. 2014, 15, 1243–1253. [Google Scholar] [CrossRef] [Green Version]
- Cox, T.R.; Erler, J.T. Remodeling and homeostasis of the extracellular matrix: Implications for fibrotic diseases and cancer. Dis. Model. Mech. 2011, 4, 165–178. [Google Scholar] [CrossRef] [PubMed] [Green Version]
- Senthebane, D.A.; Rowe, A.; Thomford, N.E.; Shipanga, H.; Munro, D.; Mazeedi, M.; Almazyadi, H.A.M.; Kallmeyer, K.; Dandara, C.; Pepper, M.S.; et al. The Role of Tumor Microenvironment in Chemoresistance: To Survive, Keep Your Enemies Closer. Int. J. Mol. Sci. 2017, 18, 1586. [Google Scholar] [CrossRef] [PubMed] [Green Version]
- Nagel, H.; Hotze, H.J.; Laskawi, R.; Chilla, R.; Droese, M. Cytologic diagnosis of adenoid cystic carcinoma of salivary glands. Diagn. Cytopathol. 1999, 20, 358–366. [Google Scholar] [CrossRef]
- Shirasuna, K.; Saka, M.; Hayashido, Y.; Yoshioka, H.; Sugiura, T.; Matsuya, T. Extracellular matrix production and degradation by adenoid cystic carcinoma cells: Participation of plasminogen activator and its inhibitor in matrix degradation. Cancer Res. 1993, 53, 147–152. [Google Scholar]
- Shintani, S.; Alcalde, R.E.; Matsumura, T.; Terakado, N. Extracellular matrices expression in invasion area of adenoid cystic carcinoma of salivary glands. Cancer Lett. 1997, 116, 9–14. [Google Scholar] [CrossRef] [PubMed]
- Moreno, C.S. SOX4: The unappreciated oncogene. Semin. Cancer Biol. 2020, 67, 57–64. [Google Scholar] [CrossRef]
- Drean, A.; Rosenberg, S.; Lejeune, F.X.; Goli, L.; Nadaradjane, A.A.; Guehennec, J.; Schmitt, C.; Verreault, M.; Bielle, F.; Mokhtari, K.; et al. Correction to: ATP binding cassette (ABC) transporters: Expression and clinical value in glioblastoma. J. Neurooncol. 2018, 138, 487. [Google Scholar] [CrossRef] [PubMed] [Green Version]
- Nymoen, D.A.; Holth, A.; Hetland Falkenthal, T.E.; Trope, C.G.; Davidson, B. CIAPIN1 and ABCA13 are markers of poor survival in metastatic ovarian serous carcinoma. Mol. Cancer 2015, 14, 44. [Google Scholar] [CrossRef] [Green Version]
- Zhou, T.; Lin, W.; Zhu, Q.; Renaud, H.; Liu, X.; Li, R.; Tang, C.; Ma, C.; Rao, T.; Tan, Z.; et al. The role of PEG3 in the occurrence and prognosis of colon cancer. OncoTargets Ther. 2019, 12, 6001–6012. [Google Scholar] [CrossRef] [Green Version]
- Cordero, A.; Kanojia, D.; Miska, J.; Panek, W.K.; Xiao, A.; Han, Y.; Bonamici, N.; Zhou, W.; Xiao, T.; Wu, M.; et al. FABP7 is a key metabolic regulator in HER2+ breast cancer brain metastasis. Oncogene 2019, 38, 6445–6460. [Google Scholar] [CrossRef]
- Slipicevic, A.; Jorgensen, K.; Skrede, M.; Rosnes, A.K.; Troen, G.; Davidson, B.; Florenes, V.A. The fatty acid binding protein 7 (FABP7) is involved in proliferation and invasion of melanoma cells. BMC Cancer 2008, 8, 276. [Google Scholar] [CrossRef] [PubMed] [Green Version]
- Glatz, J.F.; Storch, J. Unravelling the significance of cellular fatty acid-binding proteins. Curr. Opin. Lipidol. 2001, 12, 267–274. [Google Scholar] [CrossRef] [PubMed]
- Tang, Y.F.; An, P.G.; Gu, B.X.; Yi, S.; Hu, X.; Wu, W.J.; Zhang, J. Transcriptomic insights into adenoid cystic carcinoma via RNA sequencing. Front. Genet. 2023, 14, 1144945. [Google Scholar] [CrossRef] [PubMed]
- Ma, R.; Wang, L.; Yuan, F.; Wang, S.; Liu, Y.; Fan, T.; Wang, F. FABP7 promotes cell proliferation and survival in colon cancer through MEK/ERK signaling pathway. Biomed. Pharm. 2018, 108, 119–129. [Google Scholar] [CrossRef] [PubMed]
- Zhou, J.; Deng, Z.; Chen, Y.; Gao, Y.; Wu, D.; Zhu, G.; Li, L.; Song, W.; Wang, X.; Wu, K.; et al. Overexpression of FABP7 promotes cell growth and predicts poor prognosis of clear cell renal cell carcinoma. Urol. Oncol. 2015, 33, 113.e9-17. [Google Scholar] [CrossRef] [PubMed]
- Liu, R.Z.; Graham, K.; Glubrecht, D.D.; Lai, R.; Mackey, J.R.; Godbout, R. A fatty acid-binding protein 7/RXRbeta pathway enhances survival and proliferation in triple-negative breast cancer. J. Pathol. 2012, 228, 310–321. [Google Scholar] [CrossRef] [PubMed]
- Brayer, K.J.; Kang, H.; El-Naggar, A.K.; Andreasen, S.; Homoe, P.; Kiss, K.; Mikkelsen, L.; Heegaard, S.; Pelaez, D.; Moeyersoms, A.; et al. Dominant Gene Expression Profiles Define Adenoid Cystic Carcinoma (ACC) from Different Tissues: Validation of a Gene Signature Classifier for Poor Survival in Salivary Gland ACC. Cancers 2023, 15, 1390. [Google Scholar] [CrossRef] [PubMed]
- Radha, G.; Raghavan, S.C. BCL2: A promising cancer therapeutic target. Biochim. Biophys. Acta Rev. Cancer 2017, 1868, 309–314. [Google Scholar] [CrossRef]
- Vartak, S.V.; Hegde, M.; Iyer, D.; Gaikwad, S.; Gopalakrishnan, V.; Srivastava, M.; Karki, S.S.; Choudhary, B.; Ray, P.; Santhoshkumar, T.R.; et al. A novel inhibitor of BCL2, Disarib abrogates tumor growth while sparing platelets, by activating intrinsic pathway of apoptosis. Biochem. Pharm. 2016, 122, 10–22. [Google Scholar] [CrossRef]
- Vartak, S.V.; Iyer, D.; Santhoshkumar, T.R.; Sharma, S.; Mishra, A.; Goldsmith, G.; Srivastava, M.; Srivastava, S.; Karki, S.S.; Surolia, A.; et al. Novel BCL2 inhibitor, Disarib induces apoptosis by disruption of BCL2-BAK interaction. Biochem. Pharm. 2017, 131, 16–28. [Google Scholar] [CrossRef]
- Iyer, D.; Vartak, S.V.; Mishra, A.; Goldsmith, G.; Kumar, S.; Srivastava, M.; Hegde, M.; Gopalakrishnan, V.; Glenn, M.; Velusamy, M.; et al. Identification of a novel BCL2-specific inhibitor that binds predominantly to the BH1 domain. FEBS J. 2016, 283, 3408–3437. [Google Scholar] [CrossRef] [PubMed]
- Liu, Q.; Wang, H.G. Anti-cancer drug discovery and development: Bcl-2 family small molecule inhibitors. Commun. Integr. Biol. 2012, 5, 557–565. [Google Scholar] [CrossRef] [PubMed]


Disclaimer/Publisher’s Note: The statements, opinions and data contained in all publications are solely those of the individual author(s) and contributor(s) and not of MDPI and/or the editor(s). MDPI and/or the editor(s) disclaim responsibility for any injury to people or property resulting from any ideas, methods, instructions or products referred to in the content. |
© 2023 by the authors. Licensee MDPI, Basel, Switzerland. This article is an open access article distributed under the terms and conditions of the Creative Commons Attribution (CC BY) license (https://creativecommons.org/licenses/by/4.0/).
Share and Cite
Moeyersoms, A.H.M.; Gallo, R.A.; Zhang, M.G.; Stathias, V.; Maeng, M.M.; Owens, D.; Abou Khzam, R.; Sayegh, Y.; Maza, C.; Dubovy, S.R.; et al. Spatial Transcriptomics Identifies Expression Signatures Specific to Lacrimal Gland Adenoid Cystic Carcinoma Cells. Cancers 2023, 15, 3211. https://doi.org/10.3390/cancers15123211
Moeyersoms AHM, Gallo RA, Zhang MG, Stathias V, Maeng MM, Owens D, Abou Khzam R, Sayegh Y, Maza C, Dubovy SR, et al. Spatial Transcriptomics Identifies Expression Signatures Specific to Lacrimal Gland Adenoid Cystic Carcinoma Cells. Cancers. 2023; 15(12):3211. https://doi.org/10.3390/cancers15123211
Chicago/Turabian StyleMoeyersoms, Acadia H. M., Ryan A. Gallo, Michelle G. Zhang, Vasileios Stathias, Michelle M. Maeng, Dawn Owens, Rayan Abou Khzam, Yoseph Sayegh, Cynthia Maza, Sander R. Dubovy, and et al. 2023. "Spatial Transcriptomics Identifies Expression Signatures Specific to Lacrimal Gland Adenoid Cystic Carcinoma Cells" Cancers 15, no. 12: 3211. https://doi.org/10.3390/cancers15123211