
Cytogenetic Assessment and Risk Stratification in Myelofibrosis with Optical Genome Mapping
 , , , , and
Abstract
:Simple Summary
Abstract
1. Introduction
2. Materials and Methods
2.1. Sample Selection
2.2. Conventional Testing
2.3. Optical Genome Mapping
2.4. Data Analysis Strategy
2.5. Validation of the Results
3. Results
3.1. Baseline Characteristics
3.2. Optical Genome Mapping Results
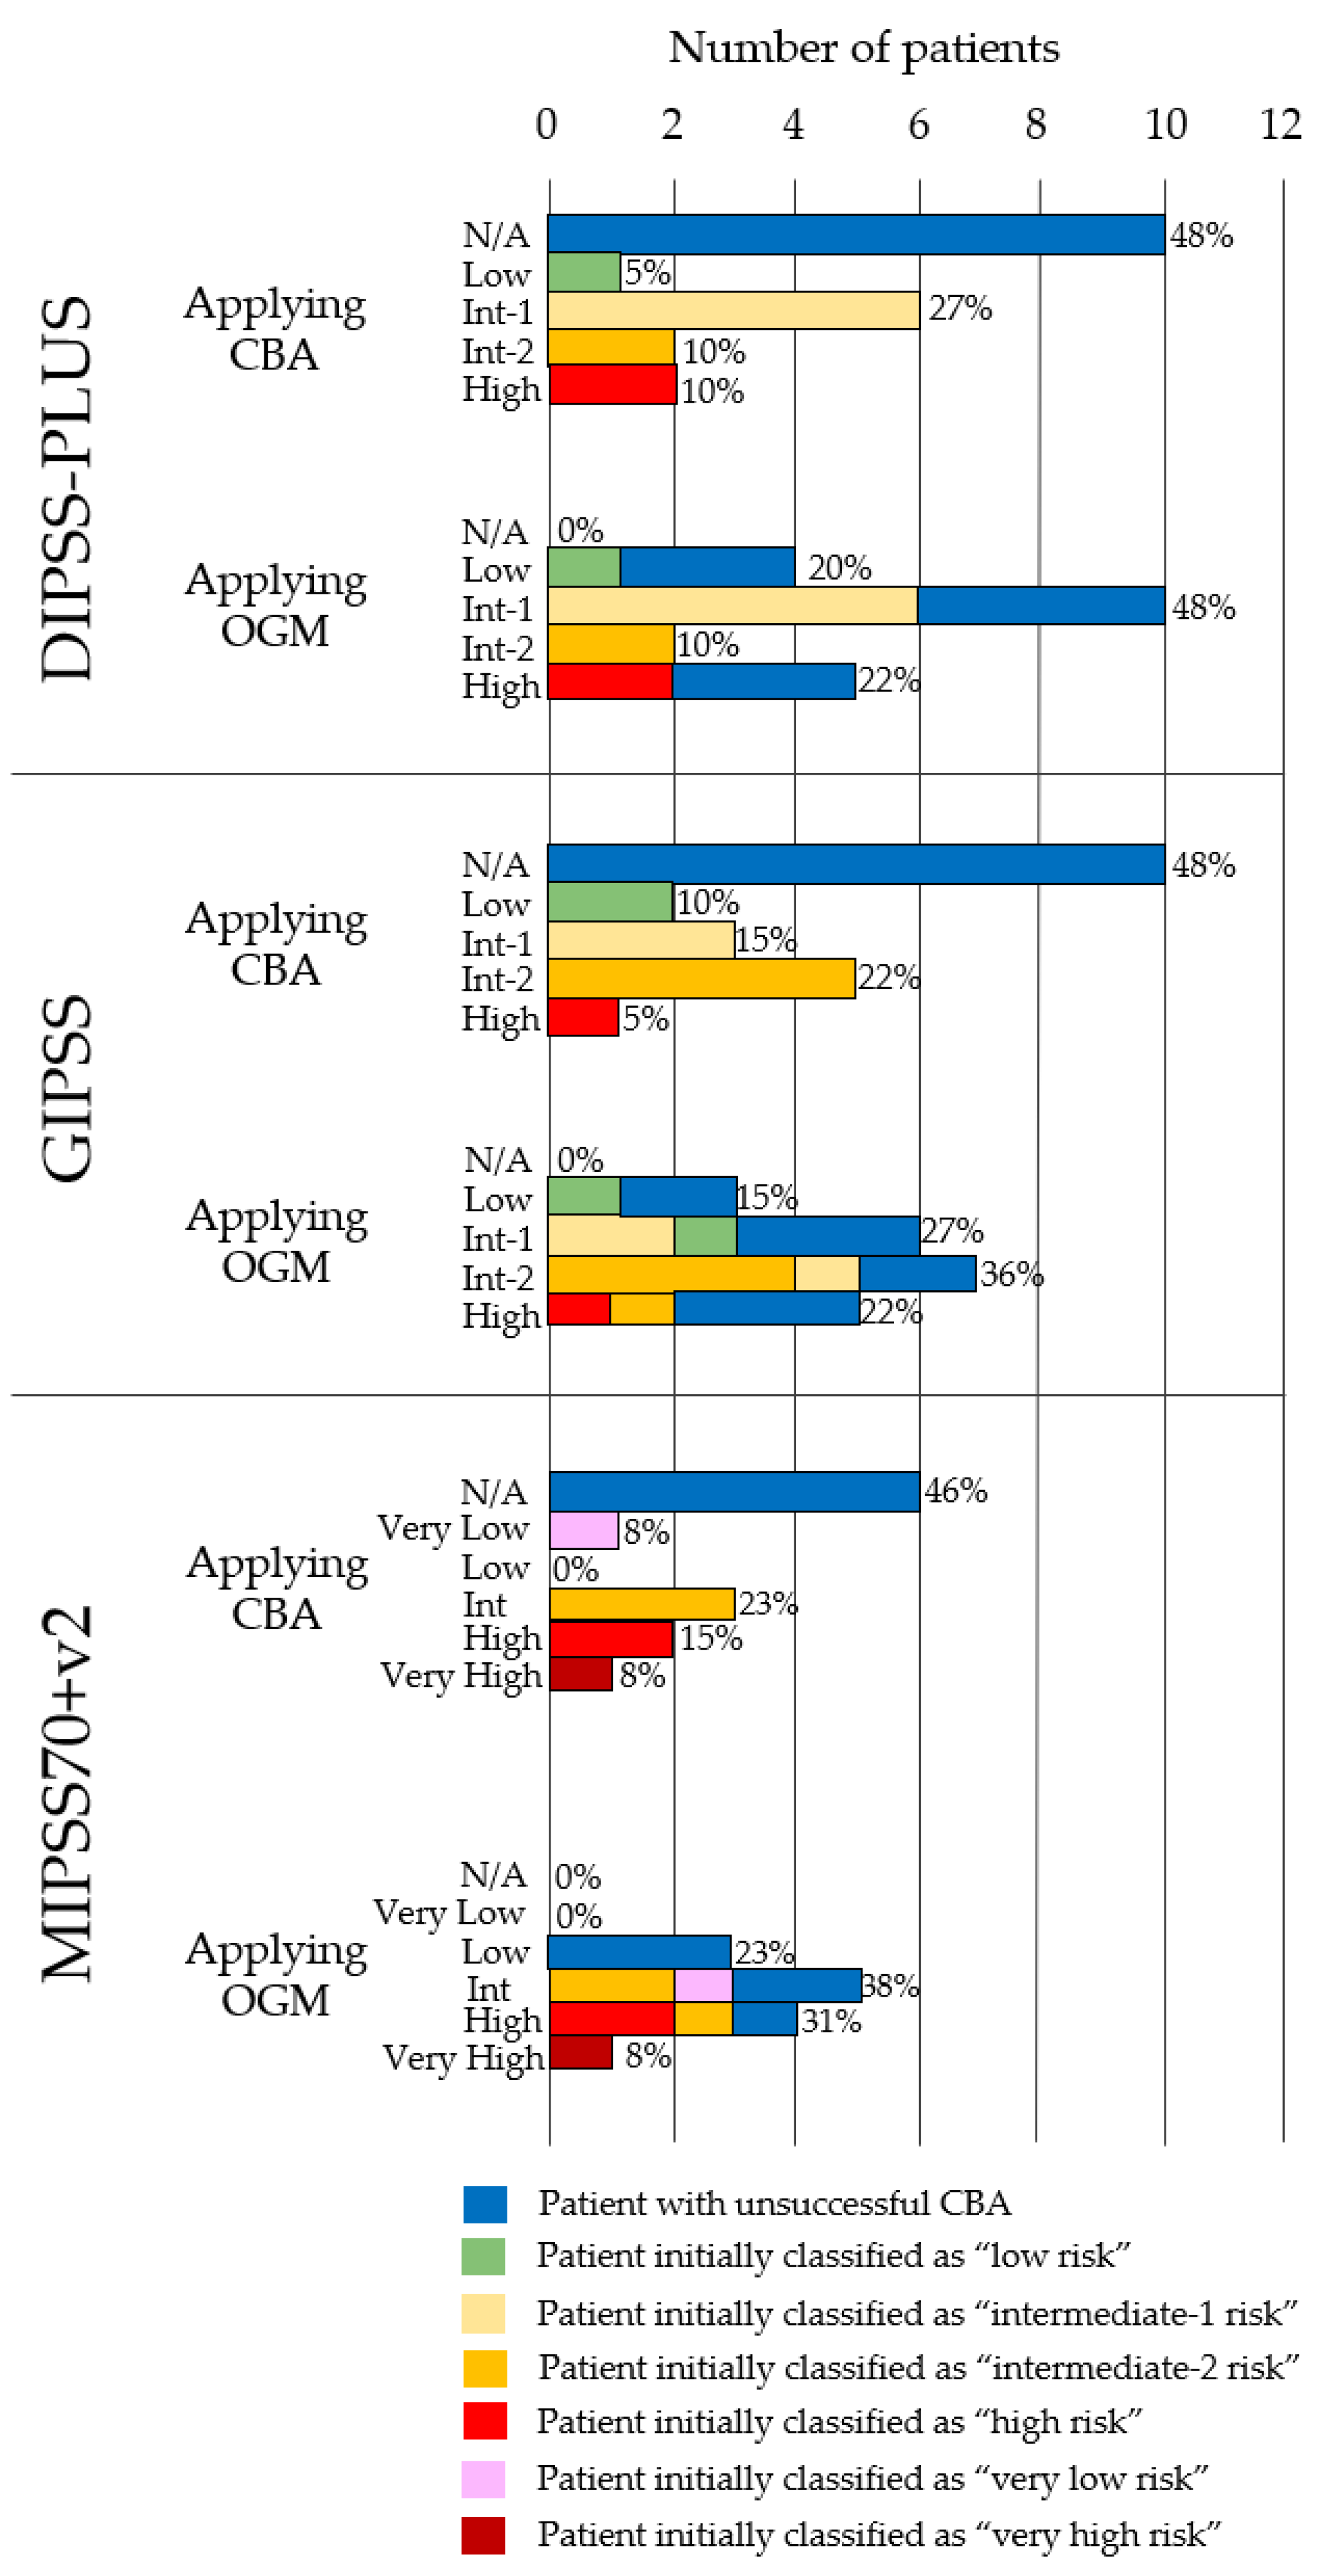
3.3. OGM Impact on Risk Stratification
4. Discussion
5. Conclusions
Supplementary Materials
Author Contributions
Funding
Institutional Review Board Statement
Informed Consent Statement
Data Availability Statement
Acknowledgments
Conflicts of Interest
References
- Tefferi, A.; Nicolosi, M.; Mudireddy, M.; Szuber, N.; Finke, C.M.; Lasho, T.L.; Hanson, C.A.; Ketterling, R.P.; Pardanani, A.; Gangat, N.; et al. Driver Mutations and Prognosis in Primary Myelofibrosis: Mayo-Careggi MPN Alliance Study of 1,095 Patients. Am. J. Hematol. 2018, 93, 348–355. [Google Scholar] [CrossRef] [Green Version]
- Khoury, J.D.; Solary, E.; Abla, O.; Akkari, Y.; Alaggio, R.; Apperley, J.F.; Bejar, R.; Berti, E.; Busque, L.; Chan, J.K.C.; et al. The 5th Edition of the World Health Organization Classification of Haematolymphoid Tumours: Myeloid and Histiocytic/Dendritic Neoplasms. Leukemia 2022, 36, 1703–1719. [Google Scholar] [CrossRef] [PubMed]
- Tefferi, A.; Saeed, L.; Hanson, C.A.; Ketterling, R.P.; Pardanani, A.; Gangat, N. Application of Current Prognostic Models for Primary Myelofibrosis in the Setting of Post-Polycythemia Vera or Post-Essential Thrombocythemia Myelofibrosis. Leukemia 2017, 31, 2851. [Google Scholar] [CrossRef] [PubMed] [Green Version]
- Tefferi, A.; Partain, D.K.; Palmer, J.M.; Slack, J.L.; Roy, V.; Hogan, W.J.; Litzow, M.L.; Ketterling, R.P.; Patnaik, M.M. Allogeneic Hematopoietic Stem Cell Transplant Overcomes the Adverse Survival Effect of Very High Risk and Unfavorable Karyotype in Myelofibrosis. Am. J. Hematol. 2018, 93, 649–654. [Google Scholar] [CrossRef] [PubMed] [Green Version]
- Gowin, K.; Ballen, K.; Ahn, K.W.; Hu, Z.H.; Ali, H.; Arcasoy, M.O.; Devlin, R.; Coakley, M.; Gerds, A.T.; Green, M.; et al. Survival Following Allogeneic Transplant in Patients with Myelofibrosis. Blood Adv. 2020, 4, 1965–1973. [Google Scholar] [CrossRef]
- Ali, H.; Aldoss, I.; Yang, D.; Mokhtari, S.; Khaled, S.; Aribi, A.; Afkhami, M.; Al Malki, M.M.; Cao, T.; Mei, M.; et al. MIPSS70+ v2.0 Predicts Long-Term Survival in Myelofibrosis after Allogeneic HCT with the Flu/Mel Conditioning Regimen. Blood Adv. 2019, 3, 83–95. [Google Scholar] [CrossRef]
- Tefferi, A. Primary Myelofibrosis: 2021 Update on Diagnosis, Risk-Stratification and Management. Am. J. Hematol. 2021, 96, 145–162. [Google Scholar] [CrossRef]
- Gangat, N.; Caramazza, D.; Vaidya, R.; George, G.; Begna, K.; Schwager, S.; Van Dyke, D.; Hanson, C.; Wu, W.; Pardanani, A.; et al. DIPSS plus: A Refined Dynamic International Prognostic Scoring System for Primary Myelofibrosis That Incorporates Prognostic Information from Karyotype, Platelet Count, and Transfusion Status. J. Clin. Oncol. 2011, 29, 392–397. [Google Scholar] [CrossRef]
- Tefferi, A.; Guglielmelli, P.; Nicolosi, M.; Mannelli, F.; Mudireddy, M.; Bartalucci, N.; Finke, C.M.; Lasho, T.L.; Hanson, C.A.; Ketterling, R.P.; et al. GIPSS: Genetically Inspired Prognostic Scoring System for Primary Myelofibrosis. Leukemia 2018, 32, 1631–1642. [Google Scholar] [CrossRef] [Green Version]
- Tefferi, A.; Guglielmelli, P.; Lasho, T.L.; Gangat, N.; Ketterling, R.P.; Pardanani, A.; Vannucchi, A.M. MIPSS701 Version 2.0: Mutation and Karyotype-Enhanced International Prognostic Scoring System for Primary Myelofibrosis. J. Clin. Oncol. 2018, 36, 1769–1770. [Google Scholar] [CrossRef]
- Cervantes, F.; Dupriez, B.; Pereira, A.; Passamonti, F.; Reilly, J.T.; Morra, E.; Vannucchi, A.M.; Mesa, R.A.; Demory, J.L.; Barosi, G.; et al. New Prognostic Scoring System for Primary Myelofibrosis Based on a Study of the International Working Group for Myelofibrosis Research and Treatment. Blood 2009, 113, 2895–2901. [Google Scholar] [CrossRef] [Green Version]
- Passamonti, F.; Giorgino, T.; Mora, B.; Guglielmelli, P.; Rumi, E.; Maffioli, M.; Rambaldi, A.; Caramella, M.; Komrokji, R.; Gotlib, J.; et al. A Clinical-Molecular Prognostic Model to Predict Survival in Patients with Post Polycythemia Vera and Post Essential Thrombocythemia Myelofibrosis. Leukemia 2017, 31, 2726–2731. [Google Scholar] [CrossRef]
- Pastor-Galán, I.; Hernández-Boluda, J.C.; Correa, J.-G.; Alvarez-Larrán, A.; Ferrer-Marín, F.; Raya, J.M.; Ayala, R.; Velez, P.; Pérez-Encinas, M.; Estrada, N.; et al. Clinico-Biological Characteristics of Patients with Myelofibrosis: An Analysis of 1,000 Cases from the Spanish Registry of Myelofibrosis. Med. Clínica 2020, 155, 152–158. [Google Scholar] [CrossRef] [PubMed]
- Rack, K.A.; van den Berg, E.; Haferlach, C.; Beverloo, H.B.; Costa, D.; Espinet, B.; Foot, N.; Jeffries, S.; Martin, K.; O’Connor, S.; et al. European Recommendations and Quality Assurance for Cytogenomic Analysis of Haematological Neoplasms. Leukemia 2019, 33, 1851–1867. [Google Scholar] [CrossRef]
- Schoumans, J.; Suela, J.; Hastings, R.; Muehlematter, D.; Rack, K.; van den Berg, E.; Berna Beverloo, H.; Stevens-Kroef, M. Guidelines for Genomic Array Analysis in Acquired Haematological Neoplastic Disorders. Genes Chromosom. Cancer 2016, 55, 480–491. [Google Scholar] [CrossRef] [PubMed]
- Bocklandt, S.; Hastie, A.; Cao, H. Bionano Genome Mapping: High-Throughput, Ultra-Long Molecule Genome Analysis System for Precision Genome Assembly and Haploid-Resolved Structural Variation Discovery. In Advances in Experimental Medicine and Biology; Springer: Berlin/Heidelberg, Germany, 2019; Volume 1129, pp. 97–118. [Google Scholar] [CrossRef]
- Lestringant, V.; Duployez, N.; Penther, D.; Luquet, I.; Derrieux, C.; Lutun, A.; Preudhomme, C.; West, M.; Ouled-Haddou, H.; Devoldere, C.; et al. Optical Genome Mapping, a Promising Alternative to Gold Standard Cytogenetic Approaches in a Series of Acute Lymphoblastic Leukemias. Genes Chromosom. Cancer 2021, 60, 657–667. [Google Scholar] [CrossRef] [PubMed]
- Lühmann, J.L.; Stelter, M.; Wolter, M.; Kater, J.; Lentes, J.; Bergmann, A.K.; Schieck, M.; Göhring, G.; Möricke, A.; Cario, G.; et al. The Clinical Utility of Optical Genome Mapping for the Assessment of Genomic Aberrations in Acute Lymphoblastic Leukemia. Cancers 2021, 13, 4388. [Google Scholar] [CrossRef]
- Suttorp, J.; Lühmann, J.L.; Behrens, Y.L.; Göhring, G.; Steinemann, D.; Reinhardt, D.; von Neuhoff, N.; Schneider, M.; von Neuhoff, N.; Schneider, M. Optical Genome Mapping as a Diagnostic Tool in Pediatric Acute Myeloid Leukemia. Cancers 2022, 14, 2058. [Google Scholar] [CrossRef]
- Rack, K.; De Bie, J.; Ameye, G.; Gielen, O.; Demeyer, S.; Cools, J.; De Keersmaecker, K.; Vermeesch, J.R.; Maertens, J.; Segers, H.; et al. Optimizing the Diagnostic Workflow for Acute Lymphoblastic Leukemia by Optical Genome Mapping. Am. J. Hematol. 2022, 97, 548–561. [Google Scholar] [CrossRef]
- Balducci, E.; Kaltenbach, S.; Villarese, P.; Duroyon, E.; Zalmai, L.; Friedrich, C.; Suarez, F.; Marcais, A.; Bouscary, D.; Decroocq, J.; et al. Optical Genome Mapping Refines Cytogenetic Diagnostics, Prognostic Stratification and Provides New Molecular Insights in Adult MDS/AML Patients. Blood Cancer J. 2022, 12, 126. [Google Scholar] [CrossRef]
- Puiggros, A.; Ramos-Campoy, S.; Kamaso, J.; de la Rosa, M.; Salido, M.; Melero, C.; Rodríguez-Rivera, M.; Bougeon, S.; Collado, R.; Gimeno, E.; et al. Optical Genome Mapping: A Promising New Tool to Assess Genomic Complexity in Chronic Lymphocytic Leukemia (CLL). Cancers 2022, 14, 3376. [Google Scholar] [CrossRef]
- Barosi, G.; Mesa, R.A.; Thiele, J.; Cervantes, F.; Campbell, P.J.; Verstovsek, S.; Dupriez, B.; Levine, R.L.; Passamonti, F.; Gotlib, J.; et al. Proposed Criteria for the Diagnosis of Post-Polycythemia Vera and Post-Essential Thrombocythemia Myelofibrosis: A Consensus Statement from the International Working Group for Myelofibrosis Research and Treatment. Leukemia 2008, 22, 437–438. [Google Scholar] [CrossRef] [Green Version]
- McGowan-Jordan, J.; Simons, A.; Schmid, M. ISCN 2020: An International System for Human Cytogenomic Nomenclature; Karger: Basel, Switzerland, 2020. [Google Scholar]
- Bionano Genomics. Saphyr Molecule Quality Report Guidelines; Bionano Genomics: San Diego, CA, USA, 2021. [Google Scholar]
- Tefferi, A.; Nicolosi, M.; Mudireddy, M.; Lasho, T.L.; Gangat, N.; Begna, K.H.; Hanson, C.A.; Ketterling, R.P.; Pardanani, A. Revised Cytogenetic Risk Stratification in Primary Myelofibrosis: Analysis Based on 1002 Informative Patients. Leukemia 2018, 32, 1189–1199. [Google Scholar] [CrossRef] [PubMed] [Green Version]
- Tefferi, A.; Meyer, R.G.; Wyatt, W.A.; Dewald, G.W. Comparison of Peripheral Blood Interphase Cytogenetics with Bone Marrow Karyotype Analysis in Myelofibrosis with Myeloid Metaplasia. Br. J. Haematol. 2001, 115, 316–319. [Google Scholar] [CrossRef] [PubMed]
- Yang, H.; Garcia-Manero, G.; Sasaki, K.; Montalban-Bravo, G.; Tang, Z.; Wei, Y.; Kadia, T.; Chien, K.; Rush, D.; Nguyen, H.; et al. High-Resolution Structural Variant Profiling of Myelodysplastic Syndromes by Optical Genome Mapping Uncovers Cryptic Aberrations of Prognostic and Therapeutic Significance. Leukemia 2022, 36, 2306–2316. [Google Scholar] [CrossRef] [PubMed]
- He, J.; Nguyen, A.T.; Zhang, Y. KDM2b/JHDM1b, an H3K36me2-Specific Demethylase, Is Required for Initiation and Maintenance of Acute Myeloid Leukemia. Blood 2011, 117, 3869–3880. [Google Scholar] [CrossRef] [Green Version]
- Stengel, A.; Kern, W.; Haferlach, T.; Meggendorfer, M.; Fasan, A.; Haferlach, C. The Impact of TP53 Mutations and TP53 Deletions on Survival Varies between AML, ALL, MDS and CLL: An Analysis of 3307 Cases. Leukemia 2017, 31, 705–711. [Google Scholar] [CrossRef]
- Tefferi, A.; Lasho, T.L.; Finke, C.M.; Elala, Y.; Hanson, C.A.; Ketterling, R.P.; Gangat, N.; Pardanani, A. Targeted Deep Sequencing in Primary Myelofibrosis. Blood Adv. 2016, 1, 105–111. [Google Scholar] [CrossRef] [Green Version]
- Grinfeld, J.; Nangalia, J.; Baxter, E.J.; Wedge, D.C.; Angelopoulos, N.; Cantrill, R.; Godfrey, A.L.; Papaemmanuil, E.; Gundem, G.; MacLean, C.; et al. Classification and Personalized Prognosis in Myeloproliferative Neoplasms. N. Engl. J. Med. 2018, 379, 1416–1430. [Google Scholar] [CrossRef]
- Khater, F.; Vairy, S.; Langlois, S.; Dumoucel, S.; Sontag, T.; St-Onge, P.; Bittencourt, H.; Dal Soglio, D.; Champagne, J.; Duval, M.; et al. Molecular Profiling of Hard-to-Treat Childhood and Adolescent Cancers. JAMA Netw. Open 2019, 2, e192906. [Google Scholar] [CrossRef]
- Bernard, E.; Tuechler, H.; Greenberg, P.L.; Hasserjian, R.P.; Arango Ossa, J.E.; Nannya, Y.; Devlin, S.M.; Creignou, M.; Pinel, P.; Monnier, L.; et al. Molecular International Prognostic Scoring System for Myelodysplastic Syndromes. NEJM Evid. 2022, 1, EVIDoa2200008. [Google Scholar] [CrossRef]


| Gender | n (%) |
|---|---|
| Men | 14 (66%) |
| Women | 7 (34%) |
| Median age (range) | 63 (50–85) |
| Diagnosis | n (%) |
| PMF | 12 (57%) |
| PPV-MF | 2 (10%) |
| PET-MF | 7 (33%) |
| Disease characteristics | Median (range) |
| Hemoglobin (g/dL) | 10.5 (7.3–14.7) |
| Leukocytes (×106/µL) | 8.17 (3.15–41.01) |
| Platelets (×103/µL) | 268 (17–777) |
| Circulating blasts (%) | 1 (0–8) |
| Bone marrow fibrosis grade | 3 (2–3) |
| Other characteristics | n (%) |
| Presence of constitutional symptoms | 7 (33%) |
| Transfusion dependency | 6 (28%) |
| Karyotype | n (%) |
| Unsuccessful | 8 (38%) |
| Normal | 9 (42%) |
| Abnormal | 4 (20%) |
| Driver mutation | n (%) |
| JAK2 | 12 (58%) |
| CALR | 7 (34%) |
| MPL | 1 (4%) |
| Triple-negative | 1 (4%) |
| Other mutations | n (%) |
| ASXL1 | 9 (43%) |
| U2AF1 | 3 (14%) |
| CBL | 2 (10%) |
| EZH2 | 2 (10%) |
| RUNX1 | 2 (10%) |
| SRSF2 | 2 (10%) |
| TET2 | 2 (10%) |
| TP53 | 2 (10%) |
| ETV6 | 1 (5%) |
| PTPN11 | 1 (5%) |
| SF3B1 | 1 (5%) |
| ZRSR2 | 1 (5%) |
| ID | NGS | CBA | OGM |
|---|---|---|---|
| 1 | JAK2 (p.Val617Phe; VAF 13%) | Unsuccessful | ogm[GRCh38] (1–22,X) × 2 |
| 2 | JAK2 (p.Val617Phe; VAF 41%), ASXL1 (c.1720-2A>A; VAF 45%), SRSF2 (p.Pro95His; VAF 42%) ETV6 (p.Arg105*; VAF 41%) | Unsuccessful | ogm[GRCh38] (1–22) × 2,(X,Y) × 1 |
| 3 | CALR (p.Leu367Thrfs*?; VAF 39%) | 46,XX [18] | ogm[GRCh38] (1–22,X) × 2 |
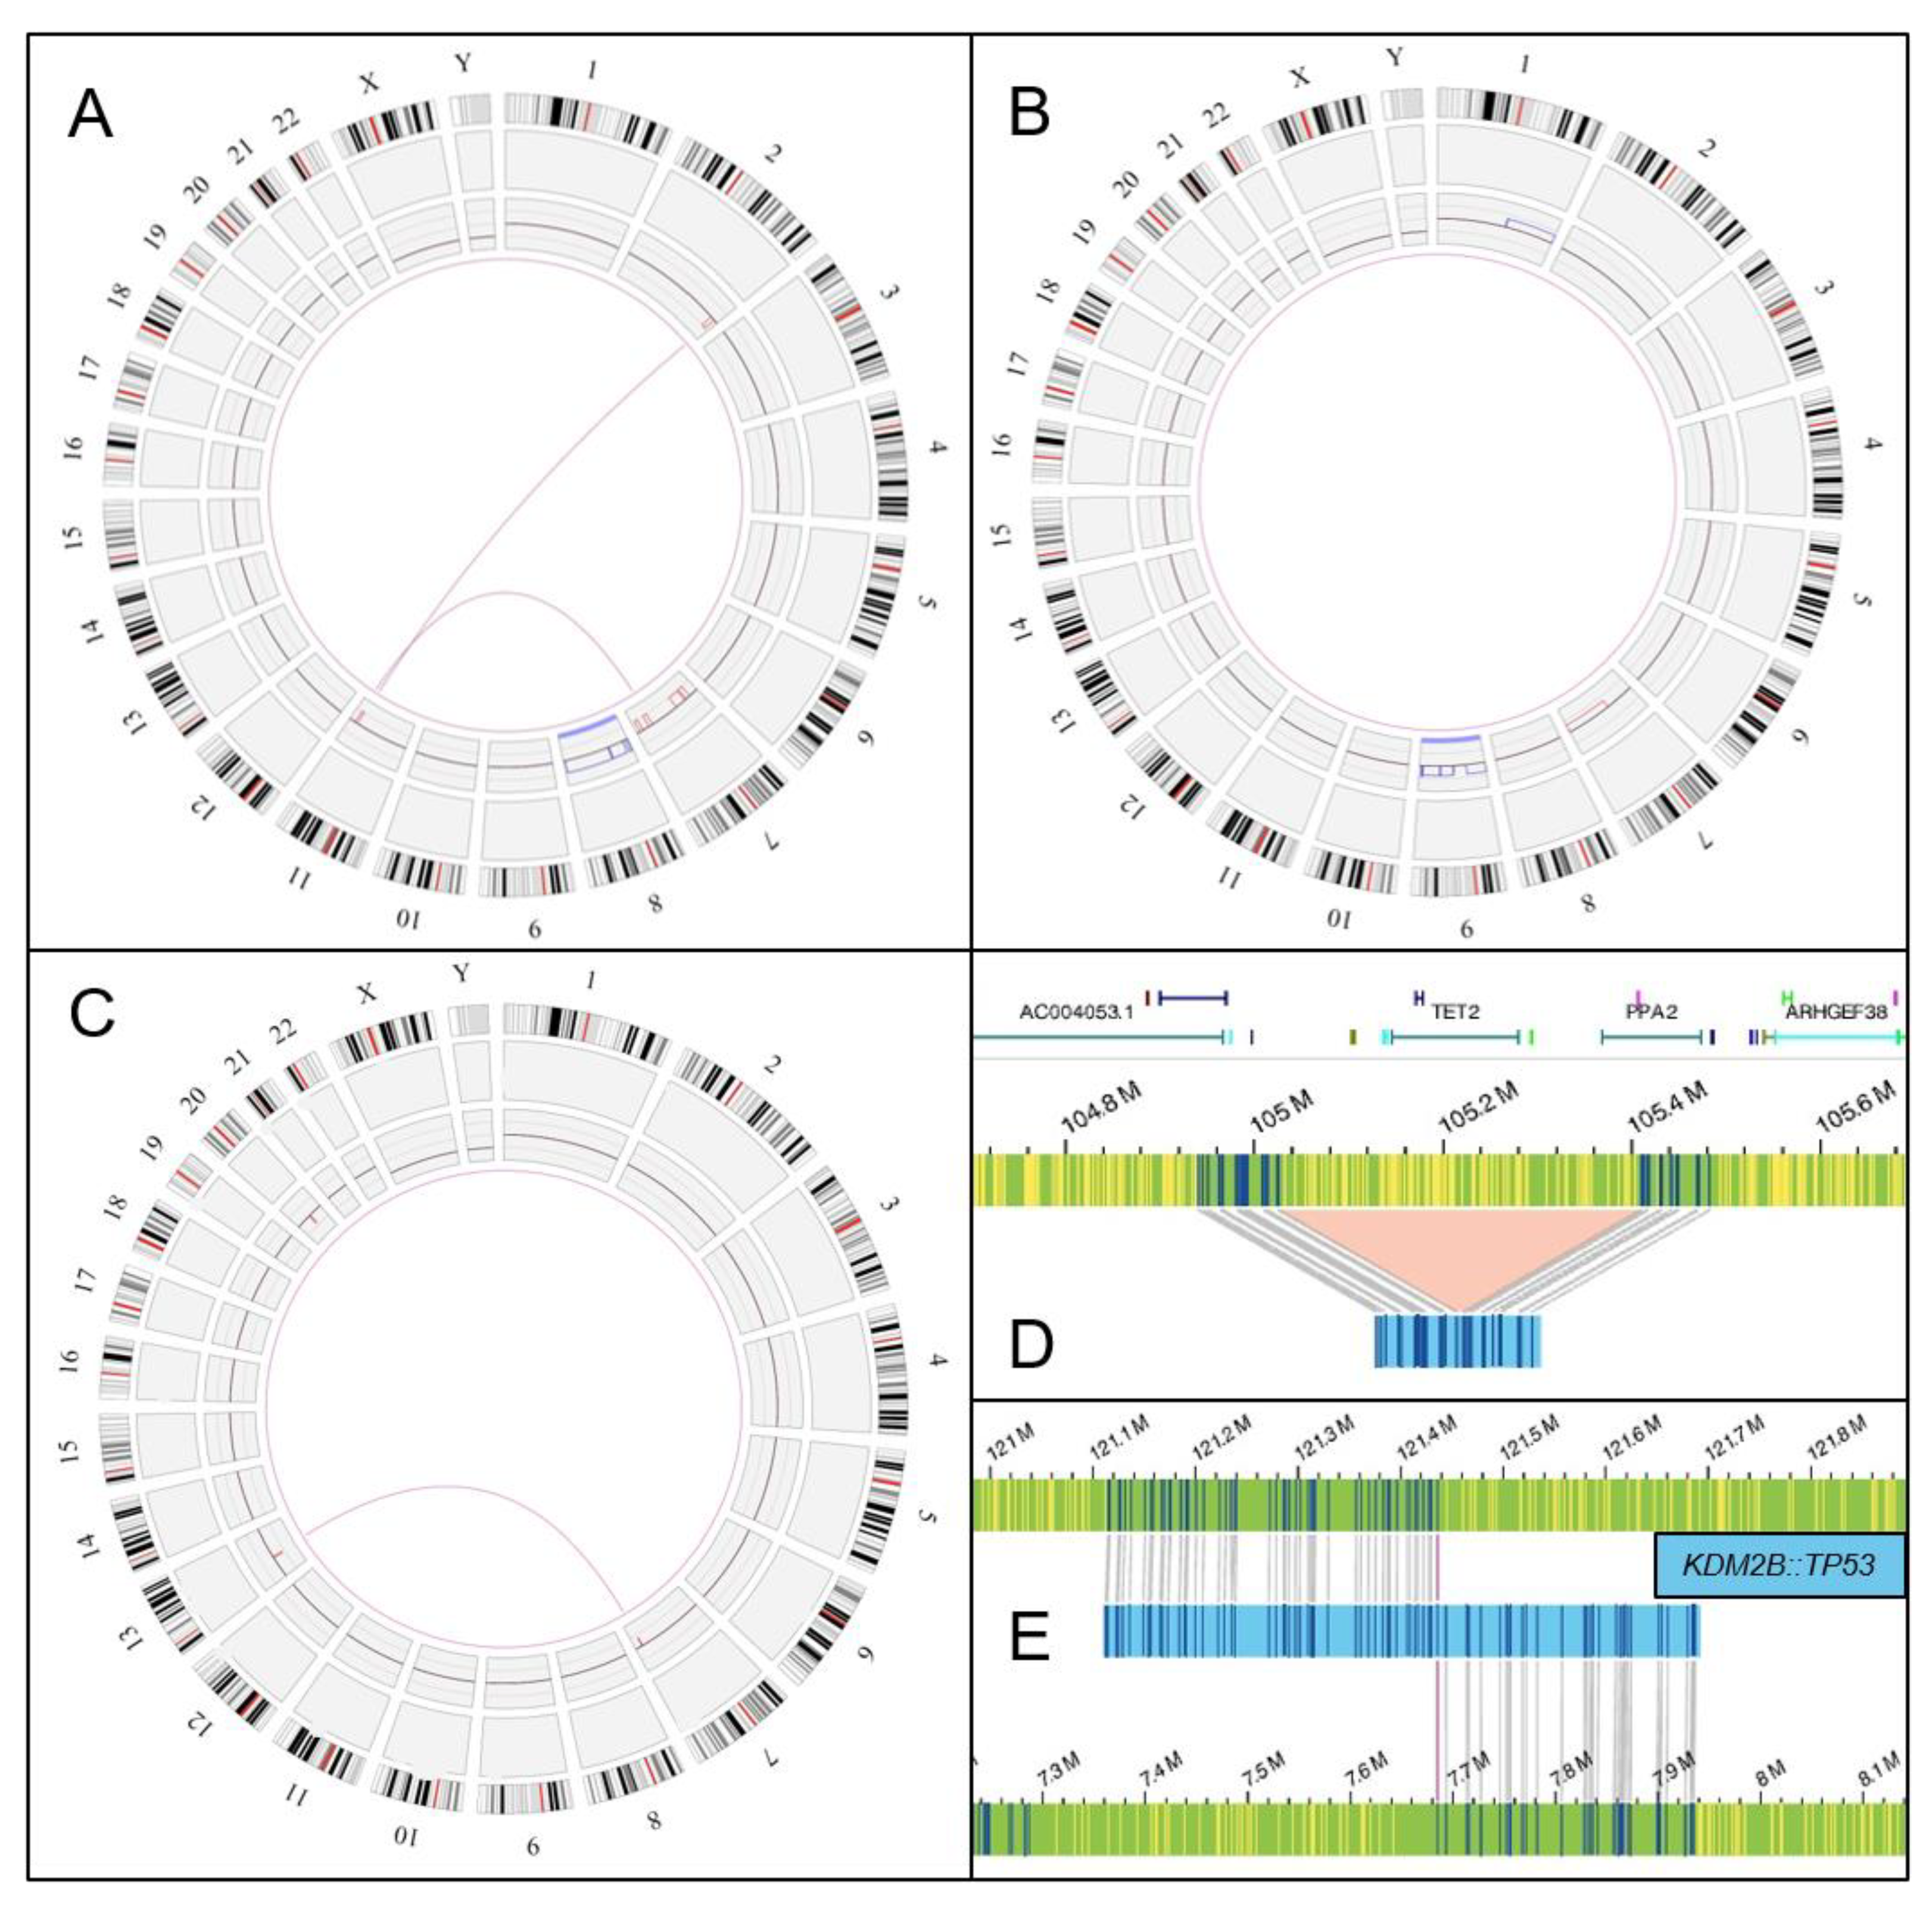
| 4 | CALR (p.Leu367Thrfs*?; VAF 44%); ASXL1 (p.Arg1068*;VAF 6.3%) | 46,XX,del(X)(q22) [12]/ 46,XX,der(6),t(1;6)(q10;p10) [2] /46,XX [1] | ogm[GRCh38]1q21.2q23.2x3, 6p25.3p22.1x1, t(12;17)(q24.31;p13.1) KMD2B::TP53 fusion gene Xq11.1q28x1 |
| 5 | JAK2 (p.Val617Phe; VAF 50%), U2AF1 (p.Ser34Tyr; VAF 6%) and RUNX1 (p.Ala187Thr; VAF 24%) | Unsuccessful | ogm[GRCh38]1q21.1q44x3, 7q11.21q36.3x1, (9)x3 |
| 6 | CALR (p.Leu367Thrfs*?;VAF 31%) and TET2 (p.Leu1322Pro; VAF 22%) | 46,XX [15] | ogm[GRCh38]4q24x1 |
| 7 | JAK2 (p.Val617Phe; VAF 17%), ASXL1 (p.Arg965*; VAF 8.8%), ASXL1 (p.Gly646Trpfs*12; VAF 30%), EZH2 (p.Cys565Alafs*110; VAF 33%), PTPN11 (p.Tyr63Cys; VAF 31%) and U2AF1 (p.Tyr158_Glu159dup; VAF 41%) | Unsuccessful | ogm[GRCh38] (1–22) × 2,(X,Y) × 1 |
| 8 | MPL (p.Trp515Leu; VAF 43%), RUNX1 (p.Leu112Val; VAF 39%), SRSF2 (p.Pro95.Arg102del; VAF 40%) and TP53 (p.His179Arg; VAF 23%) | 46,XY [15] | ogm[GRCh38] (1–22) × 2,(X,Y) × 1 |
| 9 | JAK2 (p.Val617Phe; VAF 86%), ASXL1 (p.(Gly646Trpfs*12; VAF 37%) and CBL (p.Lys382Glu; VAF 27%) | 46,XY [20] | ogm[GRCh38]9p24.2p13.3x2 hmz |
| 10 | EZH2 (p.R690H; VAF 91%) and ASXL1 (p.5665Lfs*3; VAF 46%) | 47,XY,del(7)(p10), +8 [10] | ogm[GRCh38]t(2;11)(q37.1;q23.2) 7p21.1p11.2x1, t(7;11)(q31.31;q24.1), 7q31.31q32.1x1, (8)x3, 11q23.2q24.1x1 |
| 11 | JAK2 (p. Val617Phe; VAF 37%) | 46,XY,t(7;13)(q35;q12) [20] | ogm[GRCh38]7q34q35x1, t(7;13)(q34;q14.2), 13q14.13q14.2x1, 20q11.21q11.22x1 |
| 12 | CALR (p.Leu367Thrfs*?; VAF 43%), CBL (p.Tyr371His; VAF 3%) | Unsuccessful | ogm[GRCh38] (1–22,X) × 2 |
| 13 | CALR (p.Leu367Thrfs*?; VAF 42%) | Unsuccessful | ogm[GRCh38] (1–22,X) × 2 |
| 14 | JAK2 (p.Val617Phe; VAF 80%), JAK2 (p.Cys618Tyr; VAF 80%), SF3B1 (p.Gly740Arg; VAF 45%), TP53 (p.Ala138Val; VAF 21%) and ZRSR2 (p.Glu133Glyfs*11, VAF 25%) | 46,XY [20] | ogm[GRCh38] (1–22) × 2,(X,Y) × 1 |
| 15 | JAK2 (p.Val617Phe; VAF 38%) and ASXL1 (p.Gly646Trpfs*12; VAF 34%) | Unsuccessful | ogm[GRCh38] (1–22) × 2,(X,Y) × 1 |
| 16 | JAK2 (p.V617F; VAF 45%) and ASXL1 (p.A654Rfs*9; VAF 22%) | 46,XY [20] | ogm[GRCh38]2p23.3p23.2x1, 14q32.12q32.31x1, t(2;14)(p23.2;q32.12) |
| 17 | JAK2 (p.Lys539Ile; VAF 48%) and TET2 (p.Arg1404*; VAF 2.8%) | Unsuccessful | ogm[GRCh38] (1–22,X) × 2 |
| 18 | JAK2 (p.Val617Phe; VAF 29%) and U2AF1 (p.Gln157Pro; VAF 38%) | 46,XY [20] | ogm[GRCh38] (1–22) × 2,(X,Y) × 1 |
| 19 | JAK2 (p.(Val617Phe; VAF 62%) | 47,XY,+9 [1]/46,XY [4] | ogm[GRCh38] (9)x3, 20q11.21q13.32x1 |
| 20 | CALR (p.Lys385Asnfs*?; VAF 40%) and ASXL1 (p.Gly646Trpfs*12; VAF 33%) | Unsuccessful | ogm[GRCh38] (1–22) × 2,(X,Y) × 1 |
| 21 | CALR (p.L367Tfs*?; VAF 42%) | Unsuccessful | ogm[GRCh38]t(1;12)(p35.2;q13.13), t(1;14)(p35.2;q32.31) |
| ID | Applying CBA | Applying OGM |
|---|---|---|
| Patient | DIPSS-PLUS | DIPSS-PLUS |
| GIPSS | GIPSS | |
| MIPSS70+v2 * | MIPSS70+v2 * | |
| 1 | N/A | High |
| N/A | Int-1 | |
| - | - | |
| 2 | N/A | Int-1 |
| N/A | High | |
| - | - | |
| 3 | Int-1 | Int-1 |
| Low | Low | |
| Int | Int | |
| 4 | High | High |
| Int-1 | Int-1 | |
| - | - | |
| 5 | N/A | High |
| N/A | High | |
| - | - | |
| 6 | Low | Low |
| Low | Int-1 | |
| Very low | Int | |
| 7 | N/A | High |
| N/A | High | |
| - | - | |
| 8 | Int-1 | Int-1 |
| Int-2 | Int-2 | |
| - | - | |
| 9 | Int-2 | Int-2 |
| Int-2 | Int-2 | |
| - | - | |
| 10 | High | High |
| High | High | |
| Very high | Very high | |
| 11 | Int-1 | Int-1 |
| Int-2 | Int-2 | |
| High | High | |
| 12 | N/A | Int-1 |
| N/A | Low | |
| N/A | Low | |
| 13 | N/A | Int-1 |
| N/A | Low | |
| N/A | Low | |
| 14 | Int-2 | Int-2 |
| Int-1 | Int-1 | |
| - | - | |
| 15 | N/A | Low |
| N/A | Int-2 | |
| N/A | Int | |
| 16 | Int-1 | Int-1 |
| Int-2 | High | |
| High | High | |
| 17 | N/A | Low |
| N/A | Int-1 | |
| N/A | Low | |
| 18 | Int-1 | Int-1 |
| Int-2 | Int-2 | |
| Int | Int | |
| 19 | Int-1 | Int-1 |
| Int-1 | Int-2 | |
| Int | High | |
| 20 | N/A | Int-1 |
| N/A | Int-2 | |
| N/A | High | |
| 21 | N/A | Low |
| N/A | Int-1 | |
| N/A | Int |
Disclaimer/Publisher’s Note: The statements, opinions and data contained in all publications are solely those of the individual author(s) and contributor(s) and not of MDPI and/or the editor(s). MDPI and/or the editor(s) disclaim responsibility for any injury to people or property resulting from any ideas, methods, instructions or products referred to in the content. |
© 2023 by the authors. Licensee MDPI, Basel, Switzerland. This article is an open access article distributed under the terms and conditions of the Creative Commons Attribution (CC BY) license (https://creativecommons.org/licenses/by/4.0/).
Share and Cite
Díaz-González, Á.; Mora, E.; Avetisyan, G.; Furió, S.; De la Puerta, R.; Gil, J.V.; Liquori, A.; Villamón, E.; García-Hernández, C.; Santiago, M.; et al. Cytogenetic Assessment and Risk Stratification in Myelofibrosis with Optical Genome Mapping. Cancers 2023, 15, 3039. https://doi.org/10.3390/cancers15113039
Díaz-González Á, Mora E, Avetisyan G, Furió S, De la Puerta R, Gil JV, Liquori A, Villamón E, García-Hernández C, Santiago M, et al. Cytogenetic Assessment and Risk Stratification in Myelofibrosis with Optical Genome Mapping. Cancers. 2023; 15(11):3039. https://doi.org/10.3390/cancers15113039
Chicago/Turabian StyleDíaz-González, Álvaro, Elvira Mora, Gayane Avetisyan, Santiago Furió, Rosalía De la Puerta, José Vicente Gil, Alessandro Liquori, Eva Villamón, Carmen García-Hernández, Marta Santiago, and et al. 2023. "Cytogenetic Assessment and Risk Stratification in Myelofibrosis with Optical Genome Mapping" Cancers 15, no. 11: 3039. https://doi.org/10.3390/cancers15113039