Article

Multi-Omic Analysis of CIC’s Functional Networks Reveals Novel Interaction Partners and a Potential Role in Mitotic Fidelity

by
Yuka Takemon
1,2,†,
Véronique G. LeBlanc
2,†,
Jungeun Song
2,
Susanna Y. Chan
2,
Stephen Dongsoo Lee
2,
Diane L. Trinh
2,
Shiekh Tanveer Ahmad
3,4,5,
William R. Brothers
2,
Richard D. Corbett
2,
Alessia Gagliardi
2,
Annie Moradian
2,
J. Gregory Cairncross
4,6,
Stephen Yip
7,8,
Samuel A. J. R. Aparicio
7,8,
Jennifer A. Chan
3,4,5,
Christopher S. Hughes
7,
Gregg B. Morin
2,9,
Sharon M. Gorski
2,10,
Suganthi Chittaranjan
2 and
Marco A. Marra
2,9,*
1
Genome Science and Technology Graduate Program, University of British Columbia, Vancouver, BC V5Z 4S6, Canada
2
Canada’s Michael Smith Genome Sciences Centre, BC Cancer Research Institute, Vancouver, BC V5Z 1L3, Canada
3
Department of Pathology & Laboratory Medicine, University of Calgary, Calgary, AB T2N 1N4, Canada
4
Arnie Charbonneau Cancer Institute, University of Calgary, Calgary, AB T2N 4Z6, Canada
5
Alberta Children’s Hospital Research Institute, University of Calgary, Calgary, AB T2N 4N1, Canada
6
Department of Clinical Neurosciences, University of Calgary, Calgary, AB T2N 1N4, Canada
7
Department of Molecular Oncology, BC Cancer Research Institute, Vancouver, BC V5Z 1L3, Canada
8
Department of Pathology and Laboratory Medicine, University of British Columbia, Vancouver, BC V6T 1Z7, Canada
9
Department of Medical Genetics, University of British Columbia, Vancouver, BC V6H 3N1, Canada
10
Department of Molecular Biology and Biochemistry, Simon Fraser University, Burnaby, BC V5A 1S6, Canada
*
Author to whom correspondence should be addressed.
These authors contributed equally to this work.
Cancers 2023, 15(10), 2805; https://doi.org/10.3390/cancers15102805
Submission received: 7 April 2023 / Revised: 11 May 2023 / Accepted: 15 May 2023 / Published: 17 May 2023
(This article belongs to the Special Issue Genomics and Bioinformatics Based Analysis of Cancer)

Abstract

:

Simple Summary

Capicua (CIC) is a gene that is frequently mutated in several cancer types, including stomach cancers and certain subtypes of brain tumours and sarcomas. CIC, the protein encoded by the CIC gene, has been shown to play a multitude of roles in both normal and cancer cell functions; however, most studies exploring these roles focus on a single aspect of CIC function and may therefore overlook complex interconnected activities in which CIC is involved. In this study, we have used multiple complementary approaches to obtain a broader view of CIC’s complex functional networks. We observed novel interactions (genetic or physical) between CIC and genes/proteins involved in various aspects of cellular function, including regulation of cell division and processing of RNA molecules. Altogether, our work characterises the complexity of CIC’s functional network and expands our understanding of its potential roles in cancer.

Abstract

CIC encodes a transcriptional repressor and MAPK signalling effector that is inactivated by loss-of-function mutations in several cancer types, consistent with a role as a tumour suppressor. Here, we used bioinformatic, genomic, and proteomic approaches to investigate CIC’s interaction networks. We observed both previously identified and novel candidate interactions between CIC and SWI/SNF complex members, as well as novel interactions between CIC and cell cycle regulators and RNA processing factors. We found that CIC loss is associated with an increased frequency of mitotic defects in human cell lines and an in vivo mouse model and with dysregulated expression of mitotic regulators. We also observed aberrant splicing in CIC-deficient cell lines, predominantly at 3′ and 5′ untranslated regions of genes, including genes involved in MAPK signalling, DNA repair, and cell cycle regulation. Our study thus characterises the complexity of CIC’s functional network and describes the effect of its loss on cell cycle regulation, mitotic integrity, and transcriptional splicing, thereby expanding our understanding of CIC’s potential roles in cancer. In addition, our work exemplifies how multi-omic, network-based analyses can be used to uncover novel insights into the interconnected functions of pleiotropic genes/proteins across cellular contexts.

1. Introduction

Capicua (CIC) is a transcriptional repressor that is impacted by somatic mutations or rearrangements in several cancer types, including undifferentiated small round cell sarcomas (~60% of cases) [1], oligodendrogliomas (~50–80%) [2,3], gastric adenocarcinomas (~9%) [4], endometrial carcinomas (~7%) [5], and melanomas (~8%) [6,7]. CIC loss has also been linked to prostate cancer [8], lung cancer [9], and T-cell lymphoblastic leukemia/lymphoma [10,11]. CIC alterations and/or loss of CIC activity have been associated with inferior survival outcomes in several cancer types [12,13,14,15] and with aggressive phenotypes, such as increased metastatic potential [9] and resistance to kinase inhibitors [16,17,18]. Together, these observations are compatible with the notion that CIC functions as a tumour suppressor in several cancer types.
CIC is a transducer of receptor tyrosine kinase (RTK) signalling and functions through a default repression mechanism in which RTK activation leads to reduced CIC activity and subsequent de-repression of its target genes [19]. Targets of CIC are also themselves enriched for genes involved in the mitogen-activated protein kinase (MAPK) signalling cascade, including effectors (e.g., PTPN9, SHC3/4) and members of regulatory feedback mechanisms (e.g., DUSP4/5/6, SPRY2/4, SPRED1/2/3) [13,20,21,22,23,24]. The cancer-promoting properties observed in cells with disrupted CIC activity have been explained, at least in part, by the de-repression of one or more of its known target genes that are effectors of MAPK signalling, especially the ETS transcription factors ETV1, ETV4, and ETV5 [8,9,10]. In Drosophila, where Cic function was originally described [25], Cic inhibits the expression of cell cycle genes (e.g., String/Cdc25, Cyclin E) and is a key mediator of Ras-driven proliferation [26,27]. Although the relationship between RAS/MAPK signalling, CIC function, and proliferation appears more complex in mammalian cells [19], loss of CIC has also been associated with proliferation in the absence of RTK signals in cancer cells and neural stem cells [16,17,22,28] and with dysregulated expression of cell cycle-related genes (e.g., AURKA, CDK4, BUB1) across multiple cancer types [29]. CIC has also been implicated in the development and physiology of multiple mammalian organ systems, including brain and lung development, liver homeostasis, and T-cell differentiation [30]. It has been shown that CIC can interact with proteins such as ATXN1 [31], ATXN1L [29], and SIN3A [22,32] to mediate the expression of its targets. Interestingly, a recent study by Hwang et al. [32] demonstrated that CIC interacts with chromatin remodelers, such as several members of the switch/sucrose non-fermenting (SWI/SNF) complex—namely ARID1A, ARID1B, SMARCC1, SMARCC2, SMARCA2, and SMARCA4—to regulate neuronal differentiation. These observations give rise to the notion that CIC functions are diverse and are mediated through an increasing number of interactors that are only partially identified.
The increasing frequency of CIC-related publications in recent years appears to indicate a heightened level of interest in this apparently pleiotropic protein that, to date, is understood to be involved in transcriptional regulation and signal transduction to mediate phenotypes across a wide array of developmental and oncogenic contexts. Many of these CIC-related studies focus on a singular aspect of its function (e.g., transcriptional repression) in a unique context (e.g., neuronal progenitor cells). The rapid development of genomic techniques and technologies in recent years (e.g., genome-wide CRISPR screens, whole-proteome quantification, single-cell sequencing, etc.), along with access to large public datasets generated by them, have enabled powerful investigations of complex biological relationships from different angles through layering of multiple -omic technologies (e.g., VanderSluis et al. [33], Takemon et al. [34], Shan et al. [35]). To obtain a broader view of CIC function and reveal interactions and relationships that may have remained obscured in more focused analyses, here we make use of large publicly available datasets and generate additional multi-omics data to map CIC’s genetic, proteomic, and transcriptional regulatory networks in human cell lines. We identify several SWI/SNF complex members as genetic and proteomic interaction partners of CIC, reproducing previously identified protein interactions and identifying novel interactions with additional members of the complex. We also identify several cell cycle regulators in CIC’s genetic and proteomic networks and, using single-cell RNA sequencing (scRNA-seq), show that several cell cycle regulators exhibit dysregulated gene expression in CIC-deficient cell lines. Furthermore, using human cell lines and a forebrain-specific Cic knockout (KO) mouse model, we demonstrate that loss of CIC is associated with an increased frequency of mitotic defects. Finally, motivated by the observation that CIC’s genetic and proteomic networks include several RNA processing and splicing factors, we perform a differential splicing analysis in which we compare CIC wild type (WT) and KO human cell lines and find differential exon usage patterns predominantly at 3′ untranslated regions (UTRs). Overall, our systematic characterization of CIC’s complex functional network reveals the effects of its loss on cell cycle regulation, mitotic integrity, and transcriptional splicing stability, thus providing new insights into CIC’s potential role(s) in different biological contexts, including cancer. We argue that, in addition to revealing novel CIC functions, our study provides a blueprint for multi-omic characterization of pleiotropic genes to uncover novel connections and functions at play across cellular and subcellular contexts.

2. Methods

2.1. Cell Culture

The IDH1-stable NHA cell line was obtained from Applied Biological Materials (ABM) Inc. (T3022; Richmond, BC, Canada). The HEK293A cell line was obtained from Dr. Gregg Morin (Canada’s Michael Smith Genome Sciences Centre, Vancouver, BC, Canada) and authenticated by Genetica DNA Laboratories (Cincinnati, OH, USA). The HOG cell line was obtained from Dr. G. Dawson (University of Chicago, Chicago, IL, USA). Cells were cultured in Dulbecco’s Modified Eagle Medium (DMEM) supplemented with 10% (v/v) heat-inactivated (HI) FBS (Thermo Fisher Scientific, Waltham, MA, USA). Stable cell lines expressing F-CIC-S, F-CIC-L, or F-vec were cultured in DMEM + 10% HI FBS with Zeocin (Thermo Fisher Scientific) selection. Cell culture was performed in a humidified, 37 °C, 5% CO2 incubator.

2.2. CIC Knockout Cell Line Generation and Expression Constructs

CRISPR-Cas9 sgRNA sequences were designed to target exon 2 of the CIC gene, and CICKO lines were established from NHA (NHA-CICKO-A2 and NHA-CICKO-H9) and HEK293A (HEK-CICKO-A9 and HEK-CICKO-D10) cells as described previously [21]. CIC knockout status was verified by Western blot and Sanger sequencing. N-terminal FLAG-CIC-short form (FLAG-CIC-S) and long-form (FLAG-CIC-L) plasmids were prepared as described previously [36].

2.3. scRNA-Seq

Single-cell 3′ RNA-seq libraries were generated using the Chromium Single Cell 3′ Library & Gel Bead Kit v1 (10x Genomics, Pleasanton, CA, USA) following the manufacturer’s protocol. Full details can be found in the Supplementary Methods.
The CellRanger software (v1.2.1 and 2.1.1) was used to create fastq files (cellranger mkfastq with default parameters; v1.2.1) and to perform alignment, filtering, barcode counting, and unique molecular identifier (UMI) counting (cellranger count with default parameters except --expect-cells set to 1000 for all samples; v2.1.1). The CellRanger hg19-3.0.0 reference was used for alignment. Data preprocessing was performed in the R statistical software (v3.5.0) [37], based on the filtered count matrices output by CellRanger. Counts for cells from all samples (7735 cells) were combined into a single count matrix, and genes detected (UMI > 0) in at least two cells were retained. Normalisation was then applied to all cells using the scran R package [38] (v1.10.1). The quickCluster function was used to cluster cells for normalisation (with min.mean = 0.1 as suggested for UMI data), and the resulting clusters were used as input to the computeSumFactors function (with min.mean = 0.1). These factors were then used in the normalise function of the scater R package (v1.10.0).
Cells were scored for cell cycle phases as described by Macosko et al. [39] and Schwabe et al. [40] using the phase-specific genes identified by Whitfield et al. [41] (Supplementary Table S12). Scores were obtained using the estimate_Schwabe_stage function implemented in the tricycle R package [42] (v1.2.1) with default parameters. Only cells that passed the default filtering criteria were used for the differential expression analysis: G1/S, 725 NHA-CICWT cells, 554 NHA-CICKO-A2 cells, and 532 NHA-CICKO-H9 cells; S, 478, 186, and 270; G2, 237, 66, and 94; G2/M, 200, 226, and 234; M/G1, 660, 111, and 155. For the differential expression analysis, differential expression was calculated using the DESeq2 R package [43] with default parameters comparing all NHA-CICWT vs. NHA-CICKO samples. Genes with a Benjamini Hochberg (BH)-corrected p-value < 0.05 and an absolute fold-change > 1.5 were considered to be significantly differentially expressed. To visualise these expression differences, DESeq2-normalised expression values were obtained using the counts function with normalised = TRUE. By default, DESeq2 performs independent filtering based on mean expression across samples in order to select a set of genes for multiple test correction that maximises the number of significantly differentially expressed genes found at the specified false discovery rate [43]. Therefore, for each differential expression analysis, genes that were detected below the mean cutoff for that comparison were not analysed (returning a corrected p-value of “NA”); these comparisons are indicated with “NC” (not calculated) in the relevant figures.

2.4. IP-MS

The IP-MS analyses of nuclear fractions from HEK293A cells using anti-endogenous CIC or anti-Myc (for N-Myc-CIC-S) antibodies (Supplementary Table S13) were performed as described previously [36], except using nuclear cell fractions (see Supplementary Methods for more detail). Three replicates were performed against endogenous CIC, and one experiment was performed against N-terminal MYC-fused CIC stably expressed in HEK293A cells. The IP-MS validation experiments performed in nuclear fractions of the NHA cell line were performed in triplicate, as were the matched IgG controls. See Supplementary Methods for methodological details.

2.5. Co-Essentiality Mapping and In Silico Genetic Screening Framework

Co-essentiality mapping and in silico genetic interaction screening were performed using the R statistical software (v4.0.2) package GRETTA (v0.5.0) [44], with DepMap public release version 20Q1 [45] data from the DepMap platform portal (https://depmap.org/portal/download/; accessed on 10 February 2020). Briefly, co-essentiality mapping uses fitness effect scores that were derived from normalised and copy number-corrected whole-genome CRISPR-Cas9 knockout screens targeting 18,333 genes performed in 739 cancer cell lines [46,47]. GRETTA calculated and ranked Pearson correlation coefficients between fitness scores of CIC and each screened gene, and a gene pair was considered co-essential if its BH-adjusted p-value was <0.05 and its coefficient was >0.178 (the inflection point). Given the BH adjustments, we expect a <5% false discovery rate in our analysis. For non-syntenic co-essential maps, genes on chromosome 19 were removed and the thresholds were recalculated (with an inflection point coefficient of 0.138).
Using GRETTA, CIC-mutant lines were identified using genomic data from the 739 DepMap cancer cell lines. We identified two lines (HCC366 and JHUEM1) with homozygous deleterious CIC alterations (CICHomDel), five lines (REH, CCK81, HEC6, GP4D, and SISO) with potentially trans-heterozygous CIC mutations (CICT-HetDel; multiple heterozygous deleterious CIC mutations or a combination of partial copy number loss with heterozygous deleterious CIC mutation[s]), 53 lines with a single heterozygous deleterious CIC mutation or partial copy number loss (CICHetDel), and 557 lines with no CIC alterations (CICWT; Supplementary Table S2). The normalised TPM gene and protein expression values for the selected cell lines were extracted using GRETTA.
Pairwise Mann-Whitney U tests between CIC mutant and CICWT cell lines for all 18,333 genes were performed using GRETTA to obtain p-values. These p-values were adjusted for multiple testing using a permutation approach, whereby the lethality probabilities were randomised and resampled 10,000 times. Candidate genetic interactors of CIC that were identified using CICHomDel mutant cell lines were defined as those with an adjusted Mann-Whitney U test p-value < 0.05 and a median lethality probability > 0.5 in at least one group. Known essential and non-essential genes, as defined by DepMap, were filtered out.

2.6. Co-Expression Analysis

Genes co-expressed with CIC were downloaded from COXPRESdb (v8.1) [48]. COXPRESdb is a database that was previously used by Pan et al. [49] and Wainberg et al. [50] to benchmark co-essential genes. The database contains co-expression z-scores between CIC and 17,067 genes from over 10,485 human samples assayed using RNA-seq (“hsa-r.6”), where a z-score of zero is a random level and a score of three is a false positive rate of 0.1% for any species or version. In this study, we used the top 50 genes co-expressed with CIC.

2.7. ChIP-Seq Analysis

CIC ChIP-seq peaks for NHA cells were obtained from Lee et al. [24] (Table S3 in that publication). ChIP-seq data from mouse embryonic stem cells (mESCs; fastq files) were downloaded from ArrayExpress (ERR2534130 [CIC ChIP] and ERR2534131 [IgG control], data from Weissmann et al. [22]) and SRA (SRR7643337 [ARID1A ChIP replicate 1], SRR7643339 [ARID1A input control replicate 1], SRR7643338 [ARID1A ChIP replicate 2], SRR7643340 [ARID1A input control replicate 2], SRR7643346 [BRD4 ChIP], SRR7643347 [BRD4 input control], SRR6792731 [BRD9 ChIP], SRR6792735 [BRD9 input control], SRR7724001 [SMARCA4 ChIP], and SRR7724002 [SMARCA4 input control]; data from Gatchalian et al. [51]). Alignments were performed using BWA (v0.7.17) [52], using the mm10 genome as a reference. Aligned read files were sorted and indexed using Samtools (v1.9) [53,54]. Peaks were called using MACS2 (v2.1.1) [55], using the input files as controls and default parameters. For ARID1A, peaks that were identified in both replicates (≥1 base overlap) were retained for downstream analyses. Peaks were annotated using the annotatePeak function from the ChIPseeker R package (v1.30.3) [56,57] using the TxDb.Mmusculus.UCSC.mm10.knownGene annotation from the R package of the same name (v3.10.0). The findOverlaps function from the GenomicRanges R package (v1.46.1) [58] was used to identify CIC peaks that overlapped with one or more SWI/SNF peaks. Hypergeometric tests were used to quantify the statistical significance of peak overlaps, as implemented in the makeVennDiagram function of the ChIPpeakAnno R package (v3.28.1) [59,60]. The totalTest argument was set to 250,000, as recommended by the authors for stem cell datasets.

2.8. Alternative Splicing Quantification

Alternative splicing events were analysed using Whippet v1.6.1 [61] and run on Julia v1.8.0. Bulk RNAseq fastq files were used as input to quantify splicing events using the whippet-quant.jl function with the options --stranded, --circ, and --biascorrect, and to generate sam files for visualisation using the --sam option. Differential splicing events were quantified using the whippet-delta.jl function with default options. Splicing events were visualised using IGV v2.8.13 [62] after sam files were converted to bam files using samtools v1.9 [53,54] and normalised using the bamCoverage function from deepTools v3.5.2 [63] with the following flags: --normaliseUsing CPM --exactScaling.

3. Results

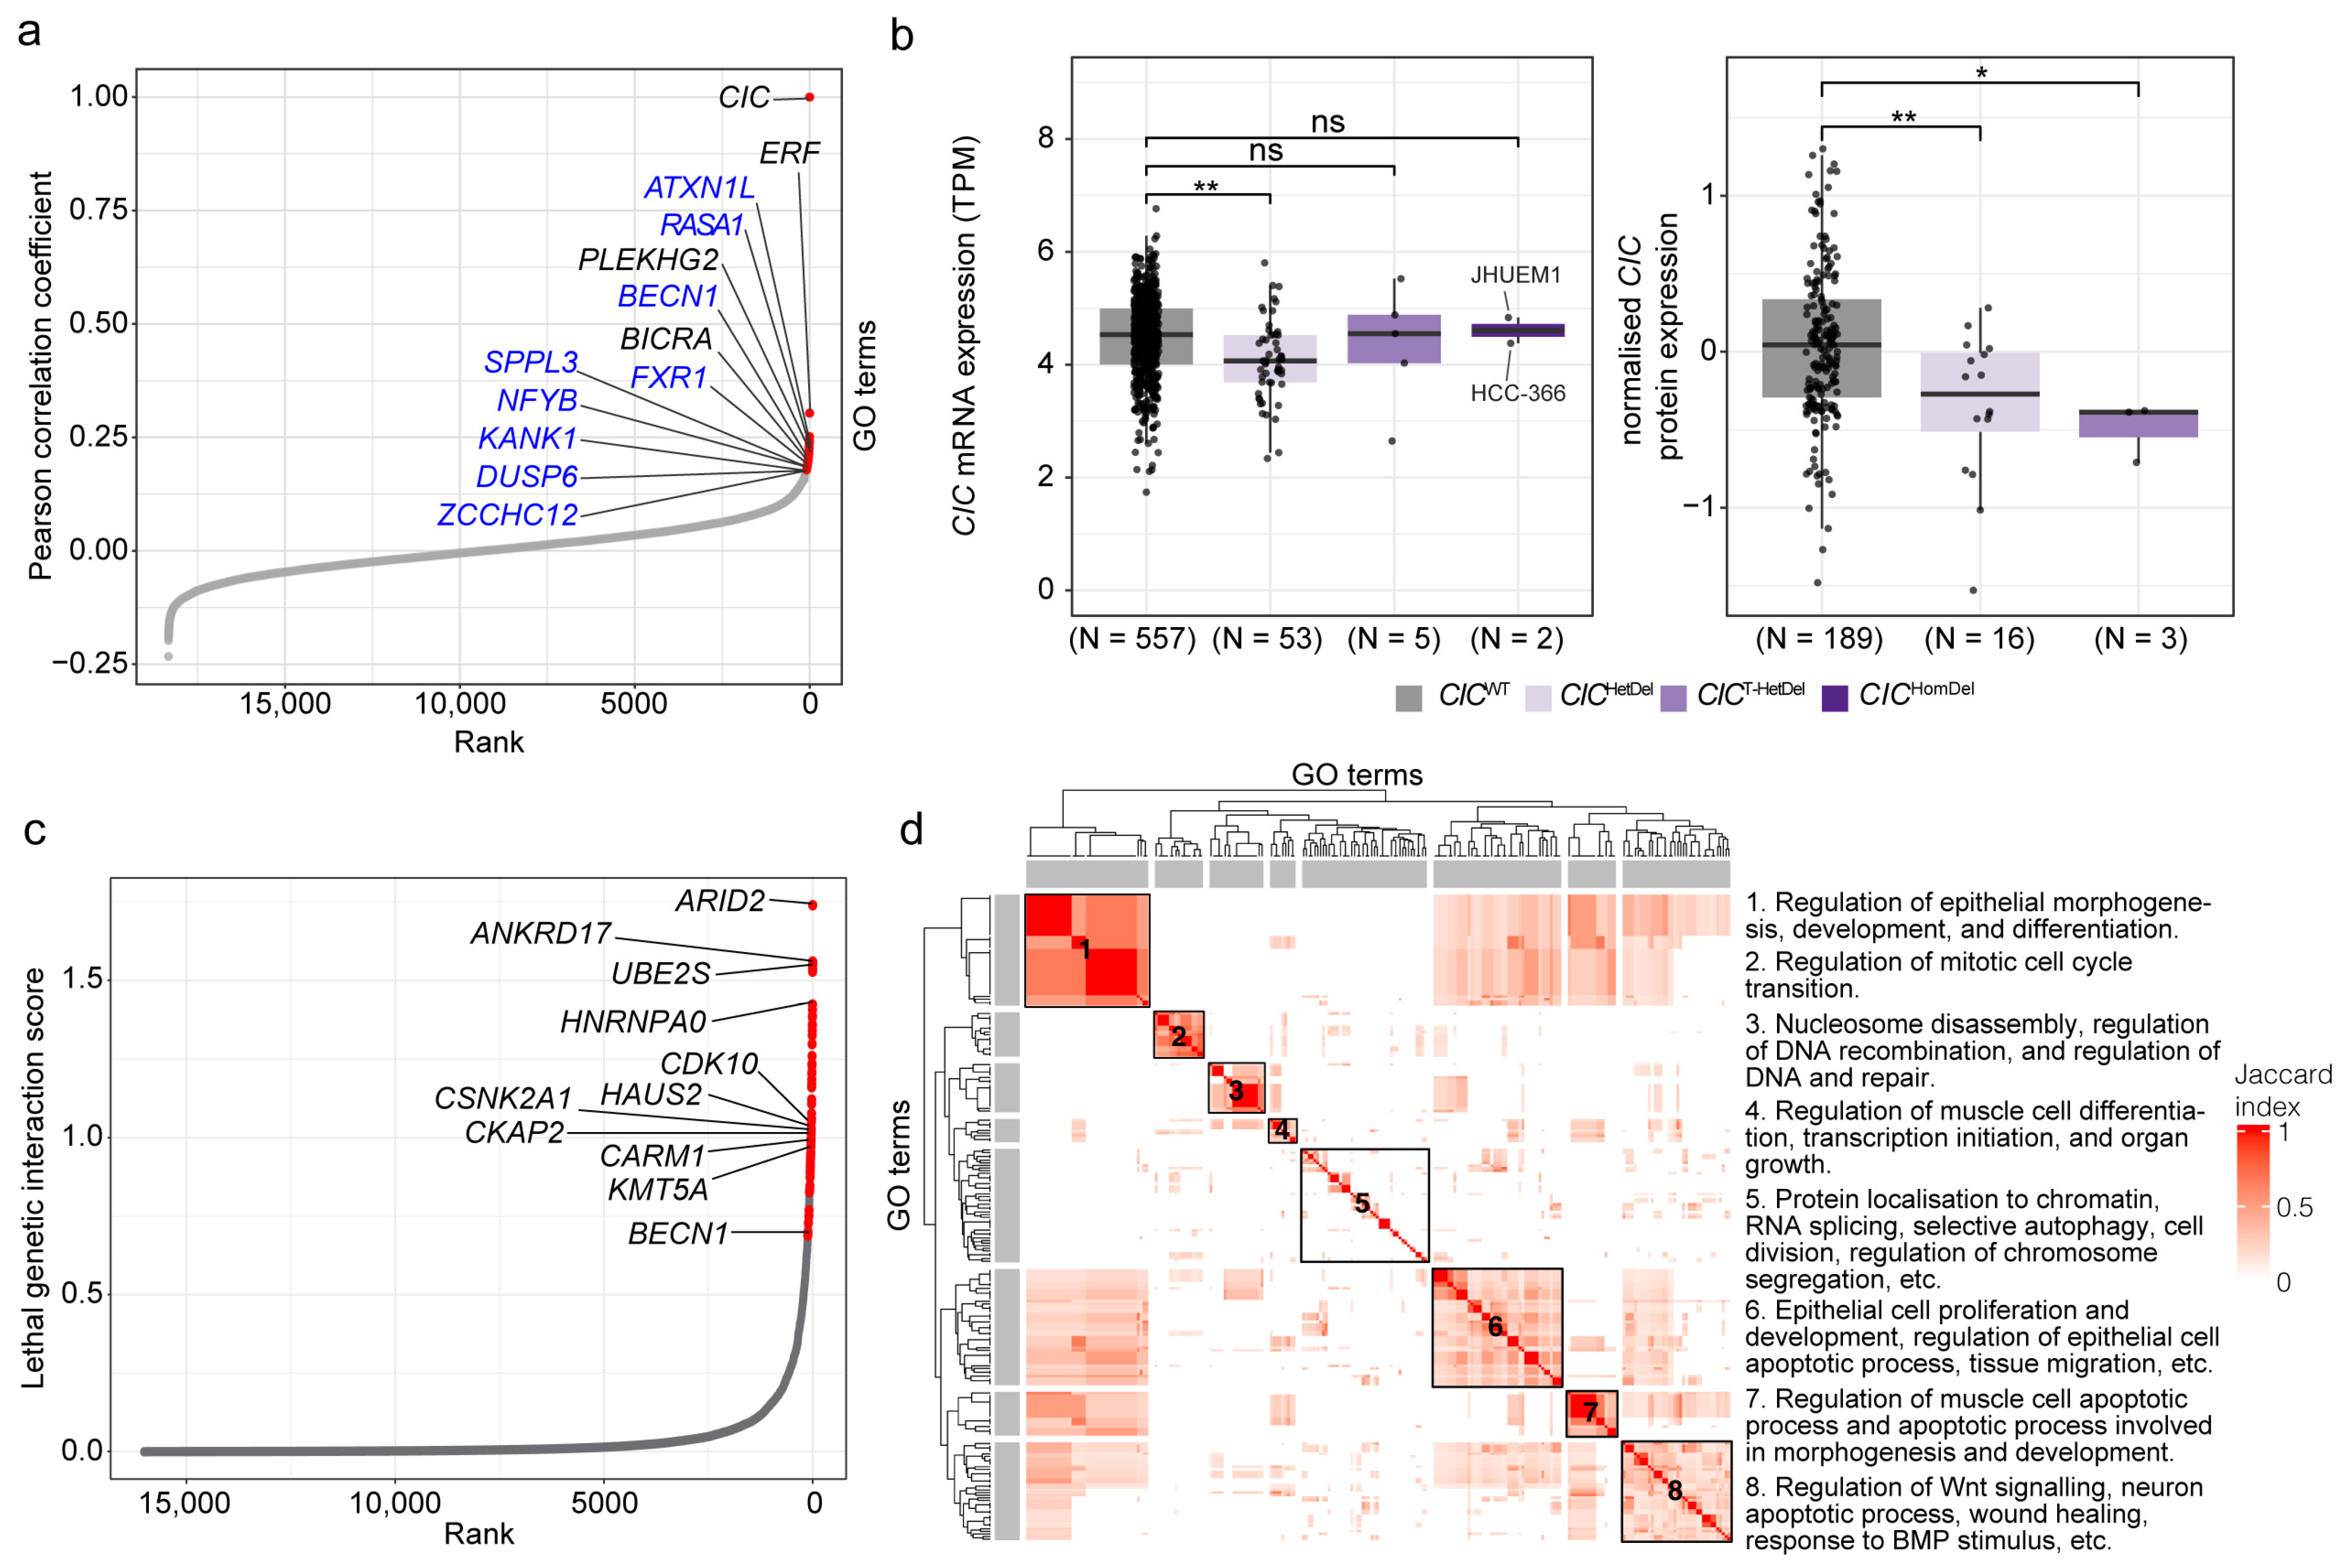
3.1. Co-Essential Network Analysis Reinforces CIC’s Role in MAPK Signalling and Identifies Candidate Additional Functions

Genome-wide genetic perturbation screens have been used to map genetic networks, including co-essential networks and genetic interaction networks, to interrogate the functional and protein complex memberships of genes [33]. Co-essential networks refer to genes that exhibit similar fitness patterns when perturbed in genetic screens, and mapping of these coordinated fitness effects (or “co-essentialities”) has been used to group genes into related pathways and to identify novel gene functions in human cell lines [49,64]. Such genetic networks are much larger than protein-protein interaction networks and can capture functional relationships that are complementary to those identified in the latter [33]. Thus, mapping genetic networks can provide an opportunity to decipher complex interactions and functions associated with genes such as CIC.
Given that CIC’s co-essentiality network has not yet been mapped, we hypothesised that its characterization may extend our insights into CIC function. To identify genes that exhibited co-essentiality with CIC across cancer types, we leveraged fitness effect scores—a measurement of the effect of a single gene loss on cell viability [46]—that were calculated from genome-wide KO screens performed by the cancer dependency map (DepMap) project [45,46,47]. We calculated Pearson coefficients between fitness effect scores of CIC and 18,333 genes that were perturbed in 739 cancer cell lines and found 88 genes that were co-essential with CIC (Pearson coefficient > 0.178 and BH-adjusted p-value < 0.05; Figure 1a; Supplementary Table S1a; Section 2). Given that two genes on the same chromosome (i.e., syntenic gene pairs) may have higher rates of false positives [50], we first focused our attention on the nine co-essential genes that were non-syntenic to CIC (i.e., not on chromosome 19; namely, ATXN1L, BECN1, DUSP6, FXR1, KANK1, NFYB, RASA1, SPPL3, and ZCCHC12). Interestingly, many of these genes have roles that have previously been linked to CIC, as described in Table 1. Furthermore, we calculated co-essential genes without syntenic genes and confirmed that these nine non-syntenic candidates indeed remained statistically significant (Supplementary Table S1a; Section 2).
To complement our efforts to identify genes with fitness effect scores similar to CIC, we next identified genes that were co-expressed with CIC [65]. To do this, we compared our list of co-essential genes to gene expression correlation profiles from COXPRESdb [48], as performed by Wainberg et al. [50]. The top 50 co-expressed genes (Supplementary Table S1b; Section 2) included three co-essential genes: ERF, BICRA, and PLEKHG2 (ranked 3, 42, and 24, respectively, in the co-essentiality analysis and ranked 3, 19, and 23, respectively, in the co-expression analysis; all located on chromosome 19; Figure 1a; Supplementary Table S1a). Although it is difficult to determine whether their appearance in both our co-essential screen and as top co-expressed genes is due to an artefact of their genomic proximity, the proteins encoded by these genes have been associated with functions similar to those of non-syntenic genes identified as co-essential with CIC, supporting the possibility that CIC does indeed share functionality with these proteins. For example, PLEKHG2 regulates the expression of CDC42, a regulator of cell cycle progression and chromosome segregation [66,67,68]. Notably, ERF perturbations had the highest correlation with CIC, besides CIC with itself, and its expression was also highly correlated with that of CIC (z-score = 9.6). ERF is located on the same chromosome band as CIC (chromosome 19q13.2) and is positioned directly adjacent to and transcribed in the opposite direction of CIC. Similar to CIC, ERF is an ETS domain transcriptional repressor and an ERK-dependent kinase that functions as an effector of the RTK signalling pathway [69,70]. Similar to CIC, loss of ERF has been linked to dysregulation of the cell cycle [69], developmental delays, and intellectual disability [71]. ERF and CIC were also recently shown to coordinate to regulate ETV1 expression in prostate cancer cells [72], further supporting the notion that the two proteins function similarly and, at least in one context, cooperatively. Interestingly given CIC having recently been shown to interact with the SWI/SNF complex to regulate neuronal maturation [32], the co-essential and co-expressed gene BICRA encodes the SWI/SNF complex member GLTSCR1 [73], further strengthening functional associations between CIC and the SWI/SNF complex. Given that several of the functions associated with CIC’s co-essential genes are also known to be regulated by MAPK signalling, such as regulation of apoptotic signalling [74], cell cycle progression [75], and cell differentiation [75], these results thus reinforce CIC’s role in the regulation of RTK/MAPK signalling and highlight its potential impact on additional downstream processes that are controlled by this pathway.
Table 1. Nine non-syntenic CIC co-essential gene candidates and their known functions, and corresponding related functions attributed to CIC.
Candidate
Co-Essential Gene
Candidate Gene Function(s)Related CIC Function(s)
ATXN1LInteracts with and stabilises CIC for DNA binding [29].Interacts with and is stabilised by ATXN1L [29].
BECN1Regulates apoptosis and cytoskeletal dynamics [76,77].
Mediator of autophagy [76].
No known related function.
DUSP6Negative regulator of MAPK signalling and known target of CIC-mediated repression [21].Represses DUSP6 expression [21].
FXR1RNA-binding protein, has been implicated in the stabilisation of multiple transcripts through binding to their 5′ or 3′ UTRs [78,79,80].No known related function.
KANK1Regulates apoptosis and cytoskeletal dynamics [81,82].No known related function.
NFYBRegulates cell cycle progression, differentiation, and apoptosis [83,84]. Regulates cell cycle progression and differentiation [30].
RASA1Regulates MAPK signalling through suppression of ERK1/2 expression [85].
Regulates cell cycle progression, differentiation, and apoptosis [85].
Regulates MAPK signalling through suppression of ERK1/2 expression [19].
Regulates cell cycle progression and differentiation [30].
SPPL3Protease that participates in the regulation of T-cell responses by interfering with human leukocyte antigen detection [86].Plays a role in T-cell development [10,87,88,89,90].
ZCCHC12Downstream effector of bone morphogenic protein signalling and has been shown to co-regulate cellular development with AP-1 and CREB [91].Implicated in cellular development in various contexts [30].
FOS and FOSL1, members of the AP-1 complex, are candidate targets of transcriptional regulation by CIC [22,24].

3.2. Lethal Genetic Interactors of CIC Are Associated with Regulation of Apoptotic Processes, Cell Division and Differentiation, and Chromatin Organisation

We further leveraged DepMap data [45,46,47,92,93] to perform in silico genome-wide genetic perturbation screens to identify genes that might genetically interact with CIC. Specifically, we screened for genetic perturbations that, in CIC mutant cells, resulted in decreases or increases in cell viability relative to CICWT control cell lines (schema shown in Supplementary Figure S1a). Similar to co-essential networks, such genetic interaction networks, including synthetic lethal (SL) and alleviating genetic interactions, can reveal interactions between genes that may indicate shared functions [94,95,96].
Using genome sequencing data from DepMap [92], we identified a non-small cell lung cancer (NSCLC) line (HCC-366) and an endometrial carcinoma line (JHUEM1) with homozygous deleterious alterations predicted to abrogate CIC function (CICHomDel; Supplementary Table S2a–c; Section 2). Notably, the mutation in JHUEM1 is exclusive to the long CIC isoform (CIC-L; Supplementary Figure S1b). This cell line may therefore retain at least some CIC activity encoded by the short CIC isoform (CIC-S). We also identified five additional cancer cell lines with deleterious and potentially trans-heterozygous CIC mutations (i.e., two or more mutations, all in regions common to the CIC-S and CIC-L isoforms; CICT-HetDel); 53 lines with heterozygous deleterious CIC mutations (six of which were exclusive to the CIC-L isoform; CICHetDel); and 557 CICWT lines (Supplementary Table S2a–c; Section 2). To infer the presence of functional CIC in these different cell lines, we used DepMap transcriptome and proteome data [92,93] to analyse CIC mRNA and protein abundance and the mRNA abundance of ETV4 and ETV5, which are known targets of CIC transcriptional repression. Compared to CICWT lines, we observed a statistically significant decrease in total CIC mRNA levels and in CIC-S and CIC-L transcript levels only in CICHetDel lines (analysis of variance [ANOVA] followed by Tukey’s Honest Significant Difference [HSD] test, p-value < 0.05; Figure 1b; Supplementary Figure S1c). In contrast, we observed a significant decrease in CIC protein levels in CICHetDel and CICT-HetDel lines compared to CICWT lines (ANOVA p-value = 0.0021, Tukey’s HSD test p-value < 0.01 and < 0.05, respectively; Figure 1b). Protein data were not available for the CICHomDel lines. CICHomDel and CICT-HetDel cell lines both displayed trends towards higher mRNA expression of ETV4 and ETV5 compared to CICWT lines (ANOVA p-value > 0.05; Supplementary Figure S1d). Given the reduced CIC protein expression observed in CICT-HetDel and CICHetDel lines and the moderate increases in ETV4 and ETV5 mRNA levels observed in CICT-HetDel and CICHomDel lines, we deduced that the CICHomDel cell lines likely have reduced or perhaps lack wild-type CIC activity and were therefore candidates for use in in silico genetic screening analyses.
We first conducted an in silico genome-wide screen by comparing the lethality outcomes of 18,322 gene KOs in CICHomDel vs. CICWT cell lines (Supplementary Figure S1a; Section 2). We used a measure called the “lethality probability”, which is provided with DepMap data and which normalises the fitness effect scores to account for variability in screen quality between cell lines [46,47]. This measure is scaled from 0 to 1, where a probability of 0 indicates a non-essential gene (i.e., the gene KO did not affect cell viability) and a probability of 1 indicates an essential gene that was necessary for the survival of that cell line [46,47]. Genes that had significantly different lethality probabilities between CICHomDel and CICWT cell lines (defined as having an adjusted Mann-Whitney U test p-value < 0.05 and a median lethality probability > 0.5 in at least one group; Methods) were defined as candidate genetic interactors of CIC. We identified 70 such genes, all of which were predicted to be SL interactors of CIC (i.e., perturbation of these genes resulted in significantly higher lethality probabilities in CICHomDel lines than in CICWT lines; Figure 1c, Supplementary Table S3a,b). We next annotated biological functions related to the predicted SL interactors and summarised these functions into eight distinct groups (Figure 1d; Table 2; Supplementary Table S3c; Supplementary Methods). Interestingly, some of the pathways associated with CIC’s co-essential network, such as the regulation of apoptotic processes, cell cycle, cell division, and cell differentiation, were also associated with the predicted SL interactors of CIC. Notably, we also identified BECN1 as being both co-essential with and a SL interactor of CIC (Supplementary Table S4), indicating that CIC likely plays a synergistic role either serially or in parallel with BECN1, and that the combined inactivation of these two genes, at least in the HCC-366 (NSCLC) and JHUEM1 (endometrial carcinoma) cell lines, may not be compatible with cell survival.
Our SL analysis identified ARID2, a SWI/SNF complex member [97], as CIC’s most significant SL interactor (Figure 1d, Supplementary Table S3b). This is particularly interesting given that CIC has been shown to function with the SWI/SNF complex to regulate neuronal maturation [32] and that we identified BICRA, which encodes another SWI/SNF member, within CIC’s co-essential network. Given that the SL interaction with ARID2 was identified using an NSCLC and an endometrial carcinoma cell line and that the co-essentially network analysis was conducted using 739 pan-cancer cell lines, our data suggests that associations between CIC and SWI/SNF complex members, which have previously been observed in neural progenitor cells [32], may also extend to non-neural contexts.

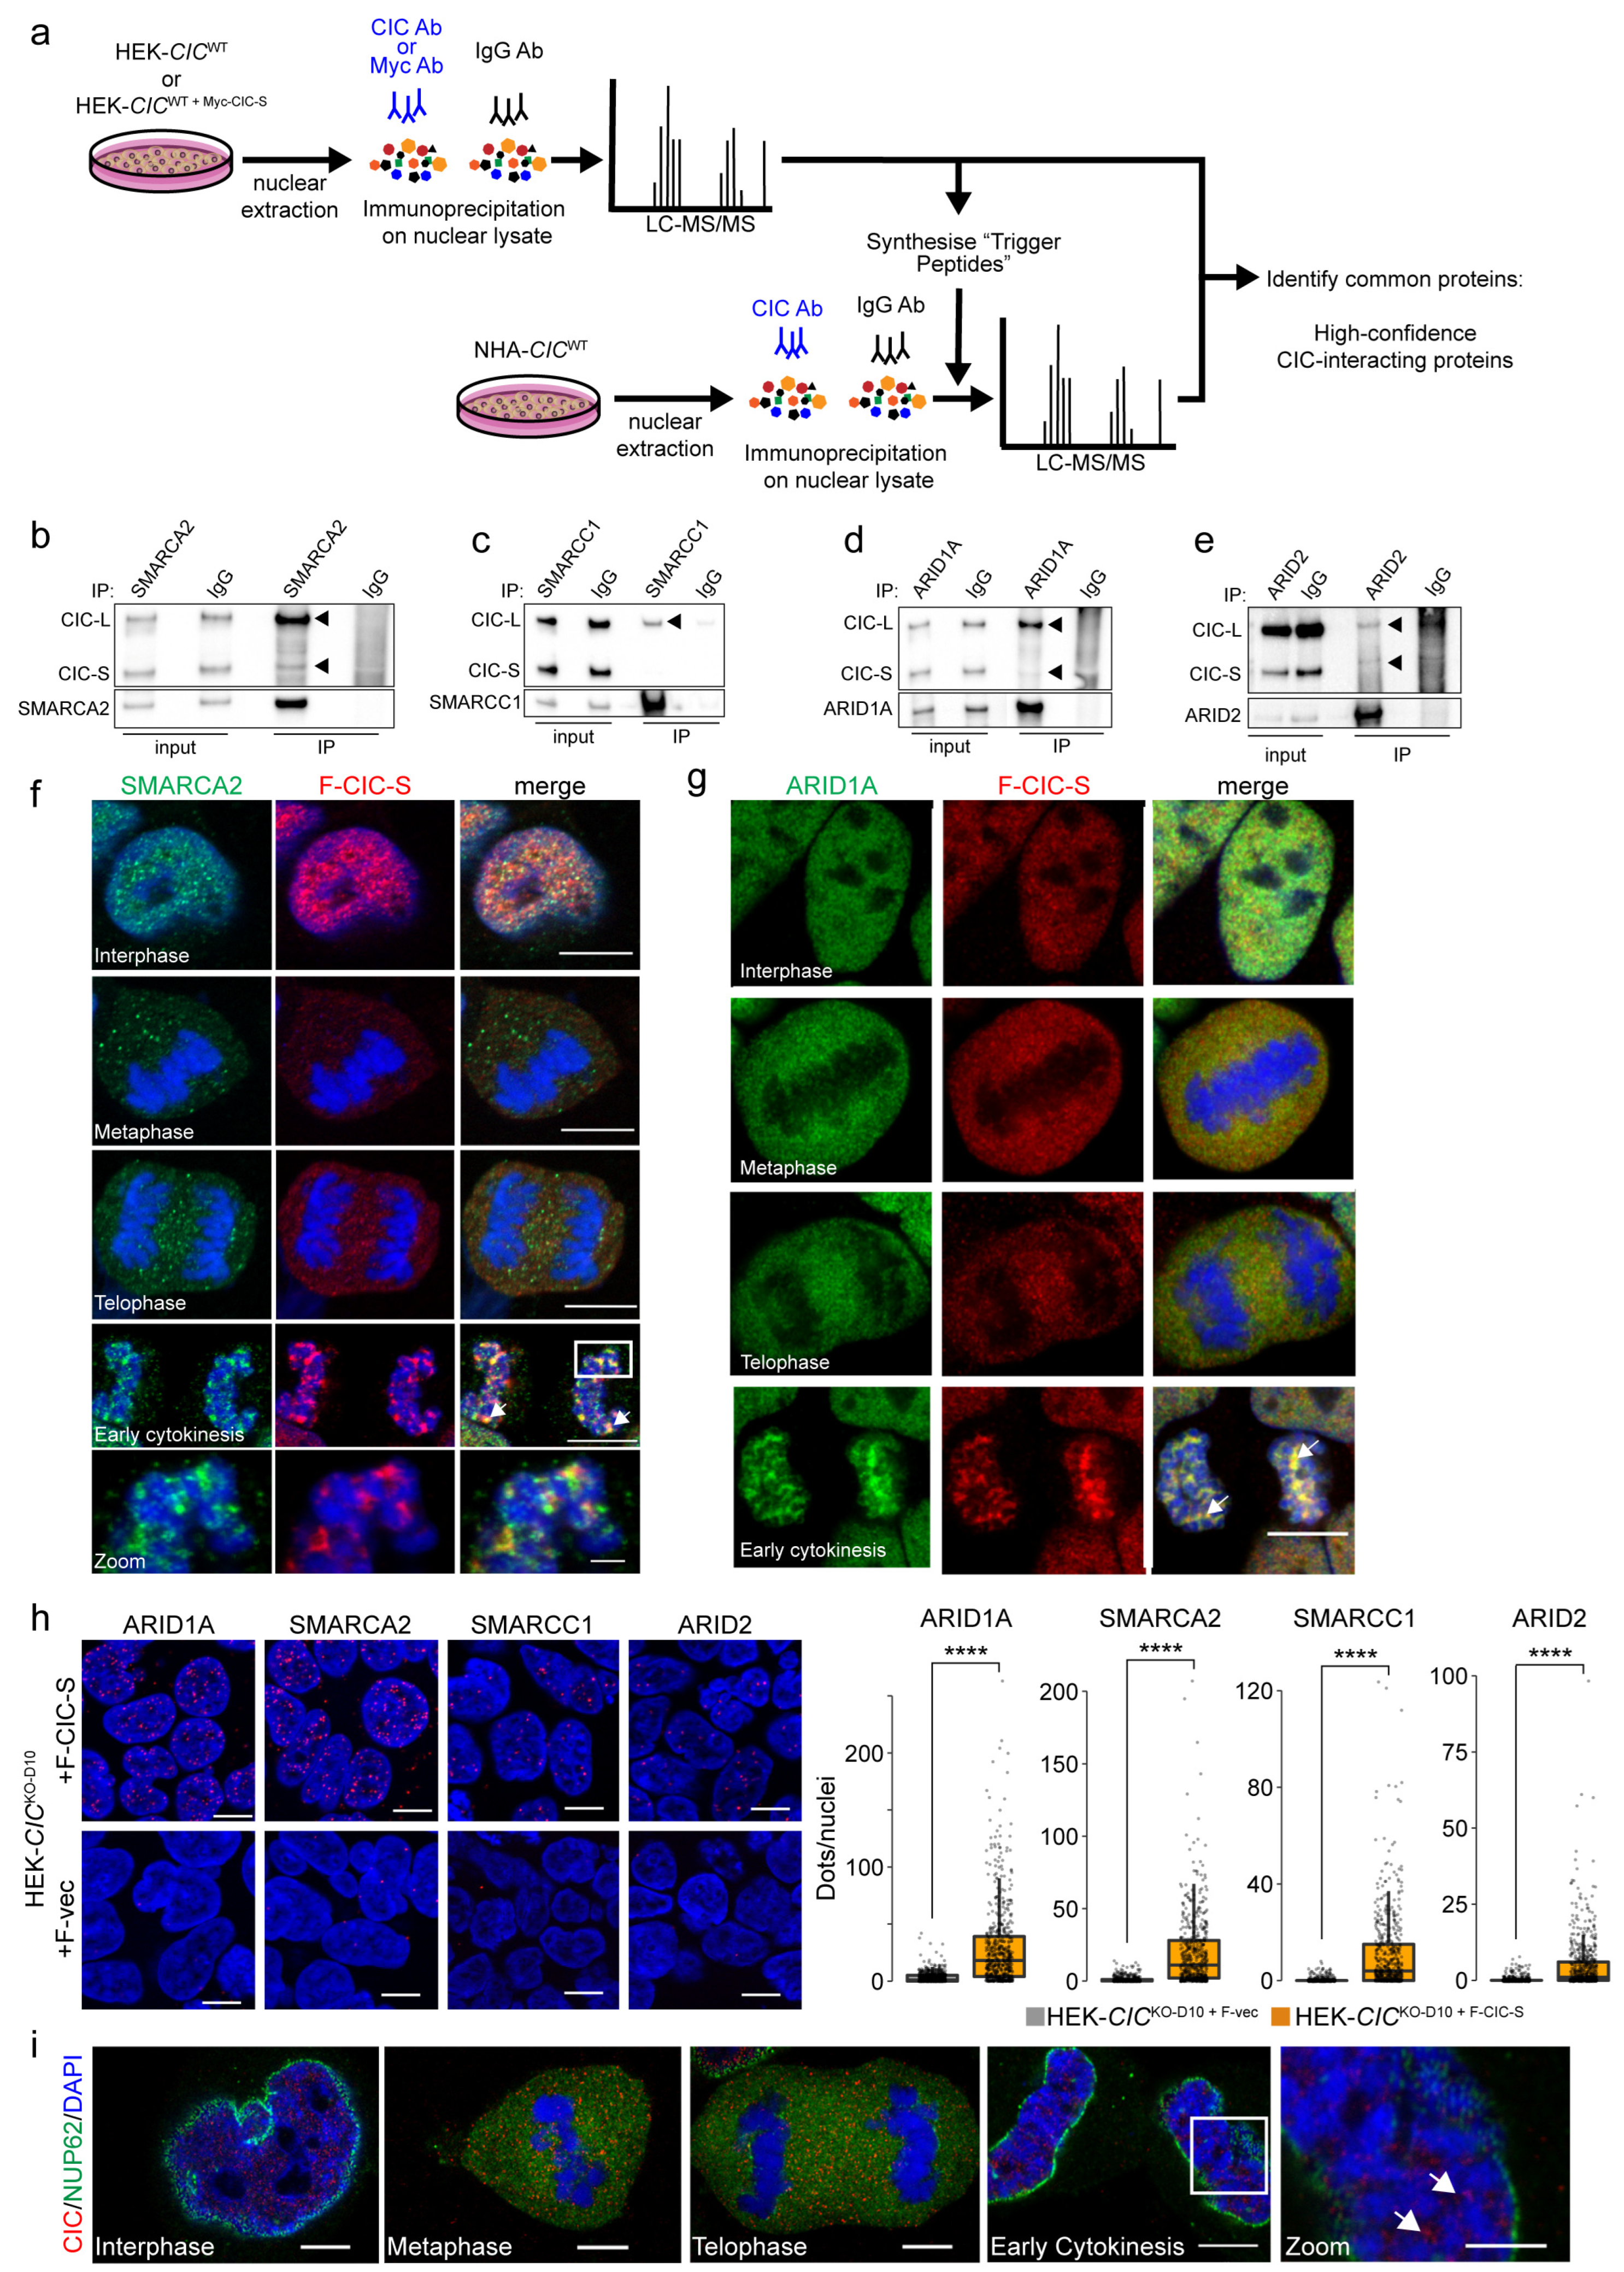
3.3. Nuclear CIC Interacts with Mitotic Regulators and SWI/SNF Complex Members

Our in silico analyses of CIC’s genetic interaction network support the notion that CIC appears to play similar roles across cellular contexts (e.g., in MAPK signal transduction, cell development, and regulation of proliferation and cell cycle). We have previously shown that CIC exerts distinct functions depending on its subcellular location (i.e., nuclear versus cytoplasmic) [36]; however, our above analyses did not provide an opportunity to discriminate between functions exerted in different subcellular compartments. To further explore and refine CIC’s functional networks in a nuclear context specifically, and given CIC’s known function as a transcriptional repressor, we next set out to characterise CIC’s nuclear protein interaction network with the assumption that co-immunoprecipitation (co-IP) assays might identify interacting transcriptional regulators. We first performed co-IP assays (Section 2; Figure 2a) against endogenous CIC and N-terminal MYC-fused CIC-S (using an anti-MYC antibody) in nuclear fractions purified from the HEK293A cell line (HEK-CICWT). The immunoprecipitates were then analysed using liquid chromatography followed by tandem mass spectrometry (MS; Section 2). This yielded 291 candidate CIC-interacting proteins identified in at least two of four IP-MS replicate experiments (Supplementary Table S5), including previously identified CIC protein interactors such as ATXN2L, SMARCA2, SMARCA4, SMARCC1, SMARCC2, and SVIL [29,32]. To identify pathways and protein complexes that were overrepresented in our list of candidate interactors, we performed enrichment analyses and identified mRNA splicing, regulation of RNA metabolism, chromatin remodelling, and chromosome segregation among the significantly enriched processes (BH-adjusted p-value < 0.05; Supplementary Table S5; Supplementary Methods). To identify candidate interactors that are common to more than one cell line, we next performed IP-MS experiments using nuclear fractions of an immortalised normal human astrocyte (NHA) cell line [98] (hereafter referred to as NHA-CICWT). Given CIC’s known function as a transcriptional repressor, we were particularly interested in investigating whether candidate interactions with proteins involved in transcription regulation and chromatin organisation could be replicated. We therefore performed a variation of the IP-MS technique in which ‘trigger peptides’ [99] were used to enhance the sensitivity of the MS for a subset of these proteins of interest (Figure 2a, Supplementary Table S6; Supplementary Methods). This approach revealed candidate interactions between CIC and 456 proteins in NHA cells, 156 of which we considered “high confidence” as we observed them in both the HEK and NHA lines (Supplementary Table S6). This list included the previously identified interactors ATXN2L, SMARCA2, SMARCC1, and SMARCC2. Analysis of these 156 proteins yielded significantly enriched biological processes (BH-adjusted p-value < 0.05) that clustered in 26 groups of terms with similar enrichment memberships, including the groups summarised in Table 3 (see Supplementary Table S6 for full results; Supplementary Methods). Interestingly, among the proteins involved in mRNA metabolism and processing, we found HNRNPA0 and CDC5L. HNRNPA0 is involved in stabilising 3′ UTRs of mRNA [100], and we also identified the gene encoding this protein as a predicted synthetic lethal interactor of CIC (Supplementary Table S4). These results raise the possibility that CIC may have a role in the processes listed in Table 3.
Consistent with our earlier observations of CIC interacting with members of the SWI/SNF complex (GLTSCR1 was identified as co-essential and ARID2 as a SL interaction partner), several members of the SWI/SNF complex were identified among the high-confidence candidate interactors of CIC, including SMARCA2, SMARCC1, SMARCC2, and PBRM1 (Supplementary Table S4). ARID1A and ARID2 were also identified as interactors in the NHA line, but not in HEK cells. Mammalian SWI/SNF has broad roles that overlap with those attributed to CIC, such as in transcriptional regulation, cell differentiation, lineage specification, DNA damage response, and RNA splicing [101,102]. Given these links and the fact that CIC and the SWI/SNF complex were recently shown to cooperatively repress the expression of neuronal development genes [32], we wanted to confirm these high-confidence interactions. To do this, we first performed reciprocal IPs by immunoprecipitating SWI/SNF complex members and probing the co-IPs with Western blot assays to detect CIC (Supplementary Methods). We validated the interactions between endogenous CIC and SMARCA2, SMARCC1, ARID1A, and ARID2 in the NHA-CICWT line (Figure 2b–e). We were unable to validate the interaction between CIC and PBRM1. We also performed immunofluorescence (IF) colocalisation assays in CICKO HEK cells stably expressing a FLAG-tagged construct of the short CIC isoform (HEK-CICKO-D10 + F-CIC-S) and observed a striking apparent colocalisation between F-CIC-S and ARID1A, ARID2, SMARCA2, and SMARCC1 (Figure 2f,g and Supplementary Figure S2a,b). Interestingly, SMARCA2, SMARCC1, and ARID1A apparently colocalised with and exhibited similar localisation dynamics to CIC over the entire course of the cell cycle. All four proteins were found throughout the nucleus during interphase but appeared to be excluded from condensed chromosomes at metaphase and telophase. During early cytokinesis, colocalising foci appeared at de-condensing chromosomes and increasingly accumulated until the completion of cytokinesis (Figure 2f,g, arrowheads). Conversely, ARID2 appeared to surround decondensing chromosomes in late telophase and colocalised with CIC only later at early cytokinesis. Although physical interactions between CIC and ARID1A and ARID2 were identified in IP-MS experiments performed in NHA cells but not detected in those performed in HEK cells, as described above, these results indicate the possibility that CIC may also interact, or at least colocalise, with these proteins in HEK cells. Since co-IP assays can also reveal indirect protein associations (e.g., proteins that are part of the same complex but that do not necessarily directly interact [103]), we further characterised these apparent colocalisation patterns using proximity ligation assays (PLAs). PLAs emit a fluorescent signal when antibodies targeting candidate protein interactors are within 40 nm of each other and thus provide a stronger level of evidence for direct interactions [104]. In HEK-CICKO-D10+F-CIC-S cells, PLA signals were compatible with colocalisation between F-CIC-S and ARID1A, SMARCA2, SMARCC1, and ARID2 during interphase (Figure 2h). Notably, the PLA signals were predominantly observed in the nucleus. Overall, these results appear to indicate spatial relationships between CIC and SWI/SNF complex proteins in both HEK and NHA cell lines, raising the possibility that CIC’s functional interaction with the SWI/SNF complex extends beyond the neural progenitor context in which it was first identified [32].
In order to further probe the intriguing patterns of CIC nuclear localisation observed above, we next performed IF assays in the NHA-CICWT line and the HOG line (HOG-CICWT) [105], observing similar localisation dynamics in both cell lines as were observed in the HEK cells above (Figure 2i, Supplementary Figure S2c). Ectopic expression of F-CIC-S in HEK-CICKO2 + F-CIC-S cells also displayed similar localisation dynamics as endogenous CIC (Supplementary Figure S2d). To determine if CIC’s distinct dynamic localisation pattern was potentially mediated by mitotic structures, we performed IF colocalisation assays using markers of ɑ-tubulin, CENPA, and AURKB to observe spindles, centromeres, and midbody structures, respectively (Supplementary Figure S2e–g). CIC did not appear to be associated with spindle structures, centromeres, kinetochore attachments, or midbody structures over the course of the cell cycle.

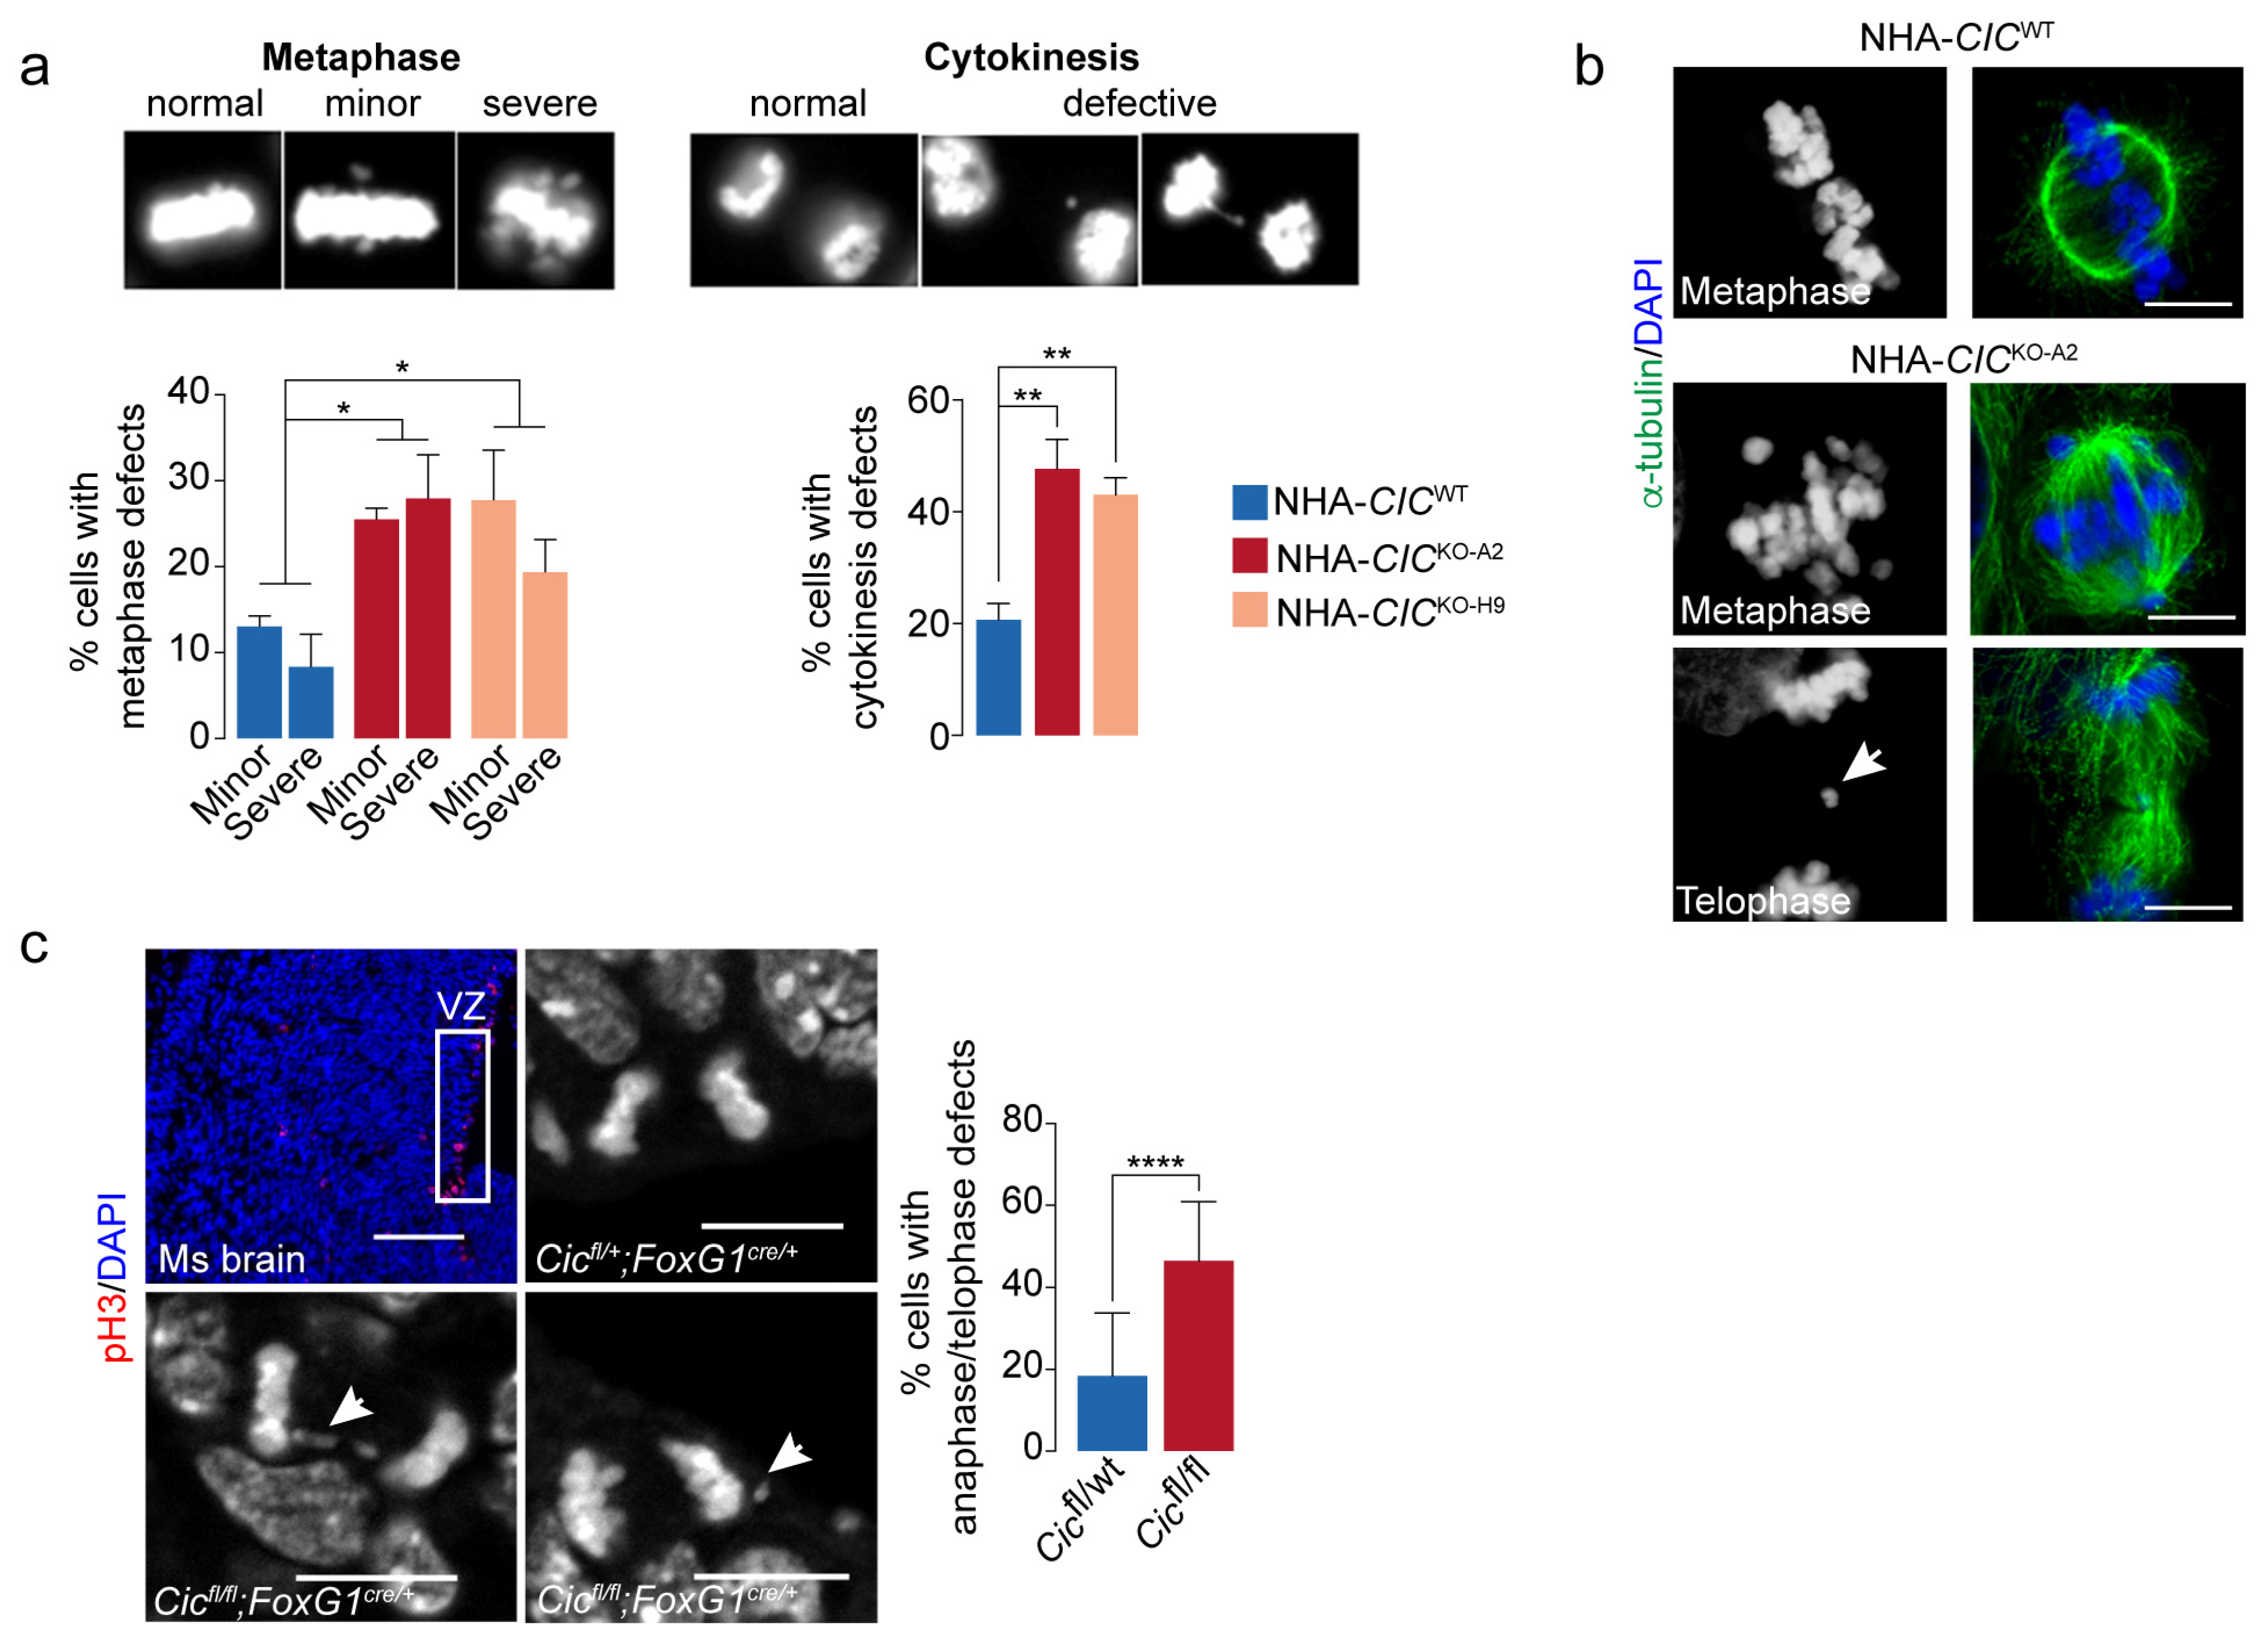
3.4. Loss of CIC Is Associated with Mitotic Defects in Mammalian Cells

While performing the IF assays described above, we observed that the CICKO cells appeared to display a higher frequency of defective mitosis (e.g., improper metaphase alignment, lagging chromosomes) compared to CICWT cells. To investigate this further, additional IF assays in the NHA lines were used to confirm that NHA-CICKO lines had an increased frequency of mitotic defects compared to the parental NHA-CICWT cells (Figure 3a,b). Specifically, the CICKO lines (NHA-CICKO-A2 and NHA-CICKO-H9) showed 2.2–2.5-fold increases in metaphase alignment defects (two-sided Student’s t-test p-value < 0.05) and 2–2.3-fold increases in chromosome segregation defects (e.g., lagging chromosomes and micronuclei) at telophase/cytokinesis (p-value < 0.01). We also observed a significant increase in metaphase defects in HEK-CICKO cell lines compared to HEK-CICWT cell lines (Supplementary Figure S3), indicating that the association between CIC loss and increased frequency of mitotic defects is not specific to the NHA-derived lines.
In order to determine if this phenotype extended beyond mammalian cell lines, we performed additional IF assays in brain sections from E13.5 mice with forebrain-specific Cic loss (Cicfl/fl; FoxG1cre/+) and from heterozygous control mice (Cicfl/+; FoxG1cre/+) [106]. Consistent with our in vitro results, Cic-null cells in the mitotically active ventricular zone displayed an increased frequency of mitotic defects, including lagging chromosomes and micronuclei (average 2.5-fold increase, two-sided Student’s t-test p-value < 0.0001; Figure 3c). Together, these observations support a previously unappreciated relationship between CIC loss and mitotic defects in mammalian cells in vitro and in vivo.

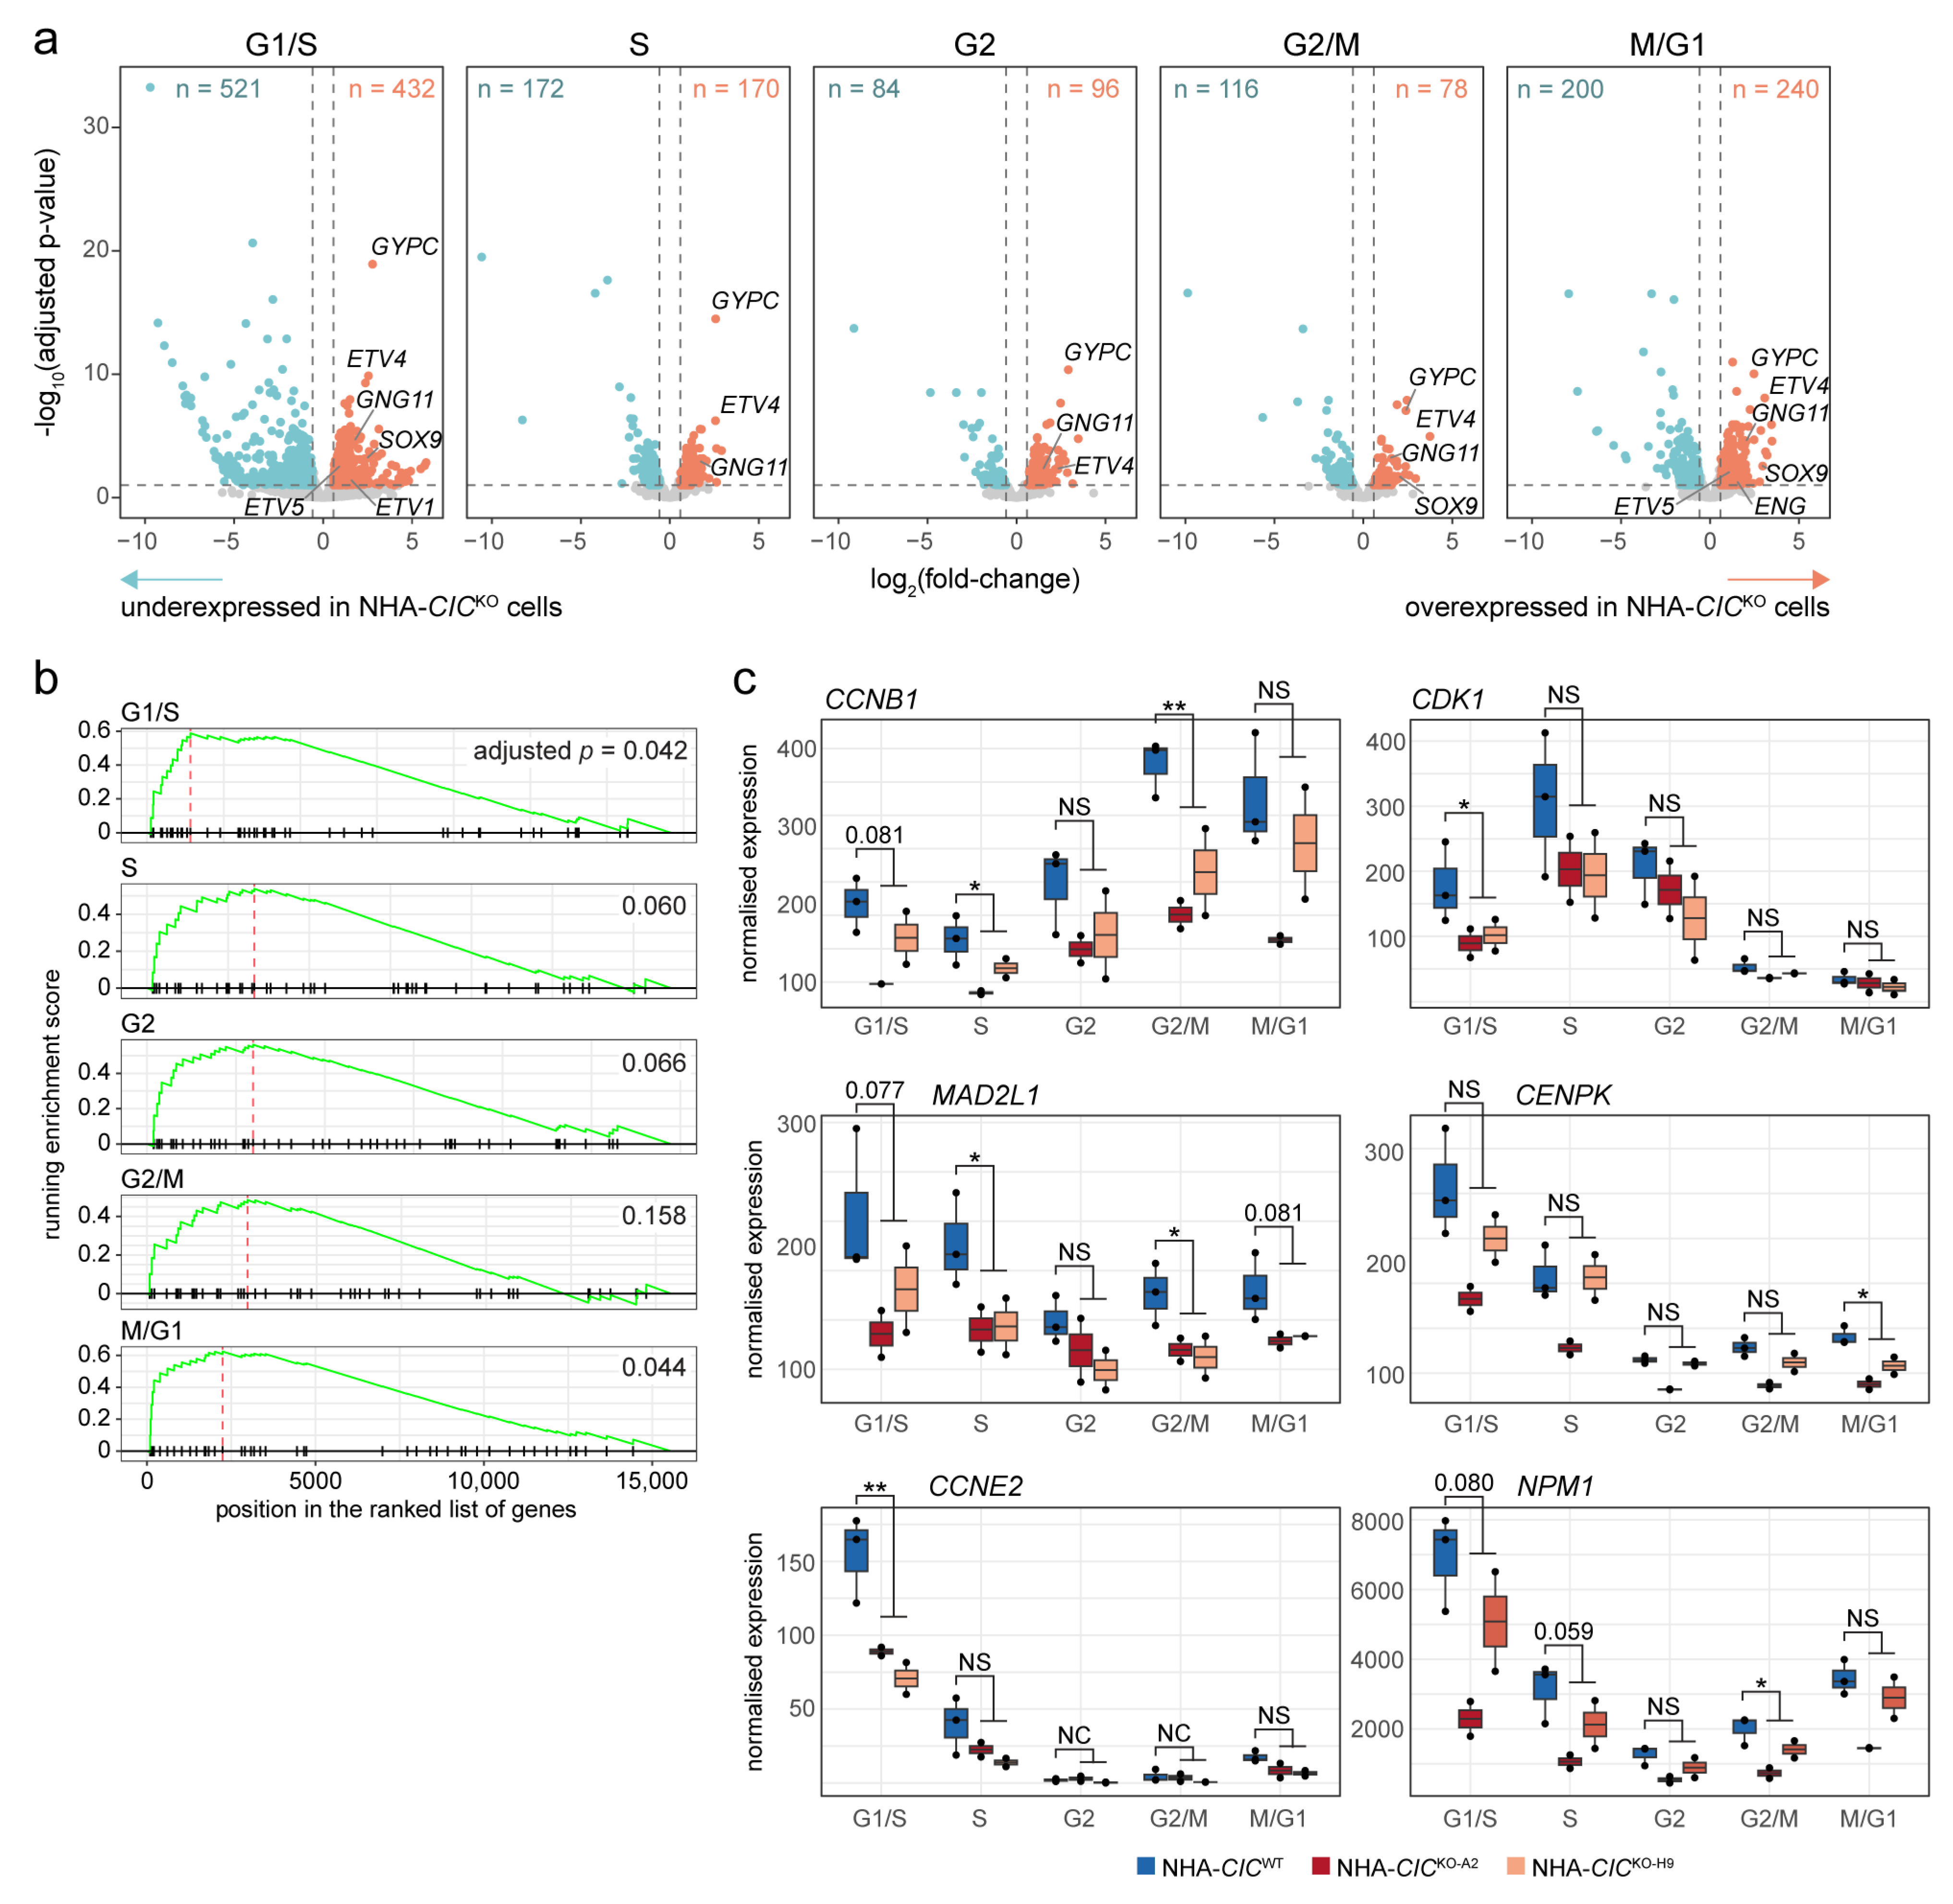
3.5. Loss of CIC Is Associated with Transcriptional Dysregulation across All Cell Cycle Phases

Given CIC’s dynamic pattern of nuclear localisation and the association between its loss and increased mitotic defects, we hypothesised that CIC’s effects on gene expression regulation may depend on the cell cycle. Since dysregulated expression of dynamically expressed genes may not be detectable in asynchronous bulk cell populations and synchronisation through either chemical or physical means can introduce confounding artefacts [107,108], we therefore performed single-cell RNA-seq (scRNA-seq) on asynchronous NHA-CICWT, NHA-CICKO-A2, and NHA-CICKO-H9 cells. To characterise the transcriptional profiles of CIC-proficient and CIC-deficient cells at different phases of the cell cycle, we first scored cells for defined cell cycle phases (G2, G2/M, M/G1, G2/S, and S phases) [41] using approaches described previously [39,40] (Section 2). For each phase, we then performed a differential expression analysis comparing CICWT and CICKO cells assigned to that phase (Figure 4a and Supplementary Table S7), and to explore coordinated patterns in gene expression differences, we also performed a gene set enrichment analysis specific to each phase (Supplementary Table S8). The canonical CIC targets ETV1/4/5 were among the genes found to be significantly more abundantly expressed in CICKO cells at each phase (ETV4) or some phases (G1/S for ETV1, G1/S, and M/G1 for ETV5; BH-adjusted p-value < 0.05 and absolute fold-change > 1.5), supporting the validity of our approach. Genes overexpressed in CICKO cells were also consistently found to be enriched for targets of RAS/MAPK signalling (e.g., ENG, ETV1/4/5, GNG11, GYPC, SOX9), as has previously been shown using bulk transcriptome profiling of CIC-deficient cell lines and tumours [13,20,21,22], indicating that CIC plays a role in the regulation of this signalling cascade at all stages of the cell cycle. In line with CIC’s known role as a transcriptional repressor that interacts with chromatin modifiers such as histone deacetylases and the SWI/SNF complex [22,32], we also observed enrichment of chromatin-related terms within overexpressed genes. Given that our IP-MS analysis identified MECP2 as a high-confidence physical interactor of CIC (Supplementary Table S4), of particular interest was the Reactome term “transcriptional regulation by MECP2” (M27862), which was enriched or trended towards enrichment across all five phases (Figure 4b). Genes belonging to this term that were found to be differentially expressed in CICKO cells in at least one phase included HIPK2, which encodes a serine-threonine kinase that regulates the activity of a wide range of transcription factors and chromatin regulators [109], and TNRC6B and DGCR8, both of which are involved in RNA processing [110,111,112]. Other transcriptional activators, such as ATF4, CREB3L2, FOSL1, MLXIP, RXRA, SMAD3, SOX9/12, SREBF1/2, and STAT6, were also found to be more abundantly expressed in CICKO cells, especially at the G1/S and S phases. Conversely, genes encoding proteins involved in transcriptional repression were also identified among those overexpressed in CICKO cells, including, e.g., the polycomb repressive complex 1 (PRC1)-related genes CBX6 and PHC2, the nucleosome remodelling and deacetylase (NuRD) complex members CHD3, MBD3, and GATAD2A, and the histone deacetylase HDAC7.
Although elevated expression of target genes in CICKO cells could be a direct consequence of CIC loss given its function as a transcriptional repressor, across all cell cycle phases, approximately half (mean 51%, range 45–60%) of all significantly differentially expressed genes displayed lower expression in CICKO cells (Figure 4a). This is in agreement with results we and others have shown previously from bulk RNA-seq profiling of CIC-proficient and CIC-deficient cell lines and tumour samples [21,29,113]. Interestingly, several gene sets related to cell cycle regulation and checkpoints were enriched for downregulated genes, driven by genes such as CCNB1 (significantly less abundant in S and G2/M CICKO cells), CDK1 (G1/S), MAD2L1 (S and G2/M), CENPK (M/G1), and CCNE2 (G1/S; Figure 4c). YWHAQ and YWHAB, which are members of the 14-3-3 family of proteins that bind to CIC and inhibit its activity [114] and which also play a role in cell cycle checkpoints and regulation of apoptosis [115], were also found to be underexpressed in CICKO cells (YWHAQ reaching statistical significance in all phases except G2/M and YWHAB reaching statistical significance in S-phase cells only). Echoing the results of our IP-MS analysis, we also observed an enrichment of genes involved in RNA processing and splicing among genes with lower expression in CICKO cells. These include the small nuclear ribonucleoprotein core protein family members SNRPB2 and SNRPD2, the heterogeneous nuclear ribonucleoproteins HNRNPH3 and HNRNPA2B1, the splicing factor 3B subunit SF3B4, and the spliceosome component PRPF31, all of which were significantly under-expressed in G1/S-phase CICKO cells. Interestingly, our results also indicated that NPM1 had significantly lower expression in G2/M-phase CICKO cells, although it showed a similar trend at all phases, especially in the CICKO-A2 cell line (Figure 4c). NPM1 is frequently mutated in acute myeloid leukaemia and encodes a protein involved in functions related to many of the ones mentioned above, including centrosome licensing (and thereby genome stability), ribosome biogenesis, the p53-mediated stress response, and inhibition of cell growth and proliferation [116]. Notably, we also identified NPM1 as a high-confidence physical interactor of CIC (Supplementary Table S4).
In order to investigate whether genes that were differentially expressed in CICKO cells might be directly regulated by CIC, we compared our gene list with a set of 150 high-confidence CIC binding sites that our group previously identified in the NHA-CICWT line using chromatin immunoprecipitation followed by sequencing (ChIP-seq) [24]. Of the 135 genes associated with these binding sites (Supplementary Table S9), transcripts for 10 of them—DUSP4, DUSP5, ETV4, ETV5, FOSL1, HMGA1, MAFF, OSGIN1, TBC1D14, and TBC1D22A—were differentially abundant between NHA-CICWT and NHA-CICKO cells in at least one cell cycle phase in our scRNA-seq data (Supplementary Table S4). All of these genes were more highly expressed in NHA-CICKO cells, which is consistent with CIC’s known function as a transcriptional repressor. Indeed, ETV4 and ETV5 are well-established targets of CIC transcriptional regulation, and DUSP4, DUSP5, FOSL1, and MAFF have also previously been proposed to be direct targets of CIC in different cellular contexts (Table 4). Several of these genes are also involved in MAPK signalling (Table 4), which is consistent with CIC’s known function within this pathway.
Overall, these results indicate that CIC appears to regulate the expression of genes involved in a wide range of functions, including MAPK signalling, transcriptional regulation, mitotic checkpoint activity, and RNA processing. Notably, our results also indicate that CIC regulates the expression of similar groups of genes across different phases of the cell cycle. Furthermore, candidate direct targets of CIC transcriptional regulation appear enriched for genes involved in functions that we have repeatedly identified in this study, including MAPK signalling, AP-1 activity, and apoptosis, further implicating CIC activity within these functional groups.

3.6. CIC Binding Sites Overlap with a Subset of SWI/SNF Binding Sites

In light of our observations of genetic and physical interactions between CIC and members of the SWI/SNF complex and of a recent study showing that CIC functions with the SWI/SNF complex to regulate gene expression in the context of neuronal development [32], we set out to explore whether CIC may function cooperatively with the SWI/SNF complex to regulate gene expression in contexts beyond the one investigated by Hwang et al. [32]. To do this, we obtained publicly available ChIP-seq data for CIC [22] and ARID1A, BRD4, BRD9, and SMARCA4 [51] generated from mouse embryonic stem cell (mESC) cultures. We chose these datasets to limit, as much as possible, biological variability between cell lines since we were unable to find SWI/SNF ChIP-seq data from human cell lines in which CIC ChIP-seq has been performed. Supporting the translatability of human and mouse datasets, 25 orthologous gene pairs were associated with CIC peaks in both the NHA dataset [24] and the mESC dataset [22] (Supplementary Table S10), including the established CIC targets CCND1/Ccnd1, DUSP4/Dusp4, ETV4/Etv4, ETV5/Etv5, GPR3/Gpr3, LRP8/Lrp8, PTPN9/Ptpn9, SPRED2/Spred2, and SPRY4/Spry4. Of the 108 peaks identified in the mESC CIC ChIP-seq dataset (see Section 2), 26 overlapped with ARID1A peaks (hypergeometric test p = 1.38 × 10⁻¹²), 60 with BRD9 peaks (p = 1.71 × 10−40), 84 with BRD4 peaks (p = 2.26 × 10−38), and 102 with SMARCA4 peaks (p = 8.66 × 10⁻³²). Notably, of the 100 genes associated with these 108 mESC CIC peaks, the human orthologues for 10 of them were found to be differentially expressed in at least one cell cycle phase in our scRNA-seq data (DDX54, DUSP4, DUSP5, ETV1, ETV4, ETV5, HSPG2, MAFF, SREBF2, and TTLL12). The 14 peaks associated with these 10 genes all overlapped with SWI/SNF peaks (14/14, 13/14, 10/10, and 4/14 sites overlapped with SMARCA4, BRD4, BRD9, and ARID1A peaks, respectively; Supplementary Table S10). Together, these results indicate the possibility that CIC may indeed function with the SWI/SNF complex to regulate transcription.

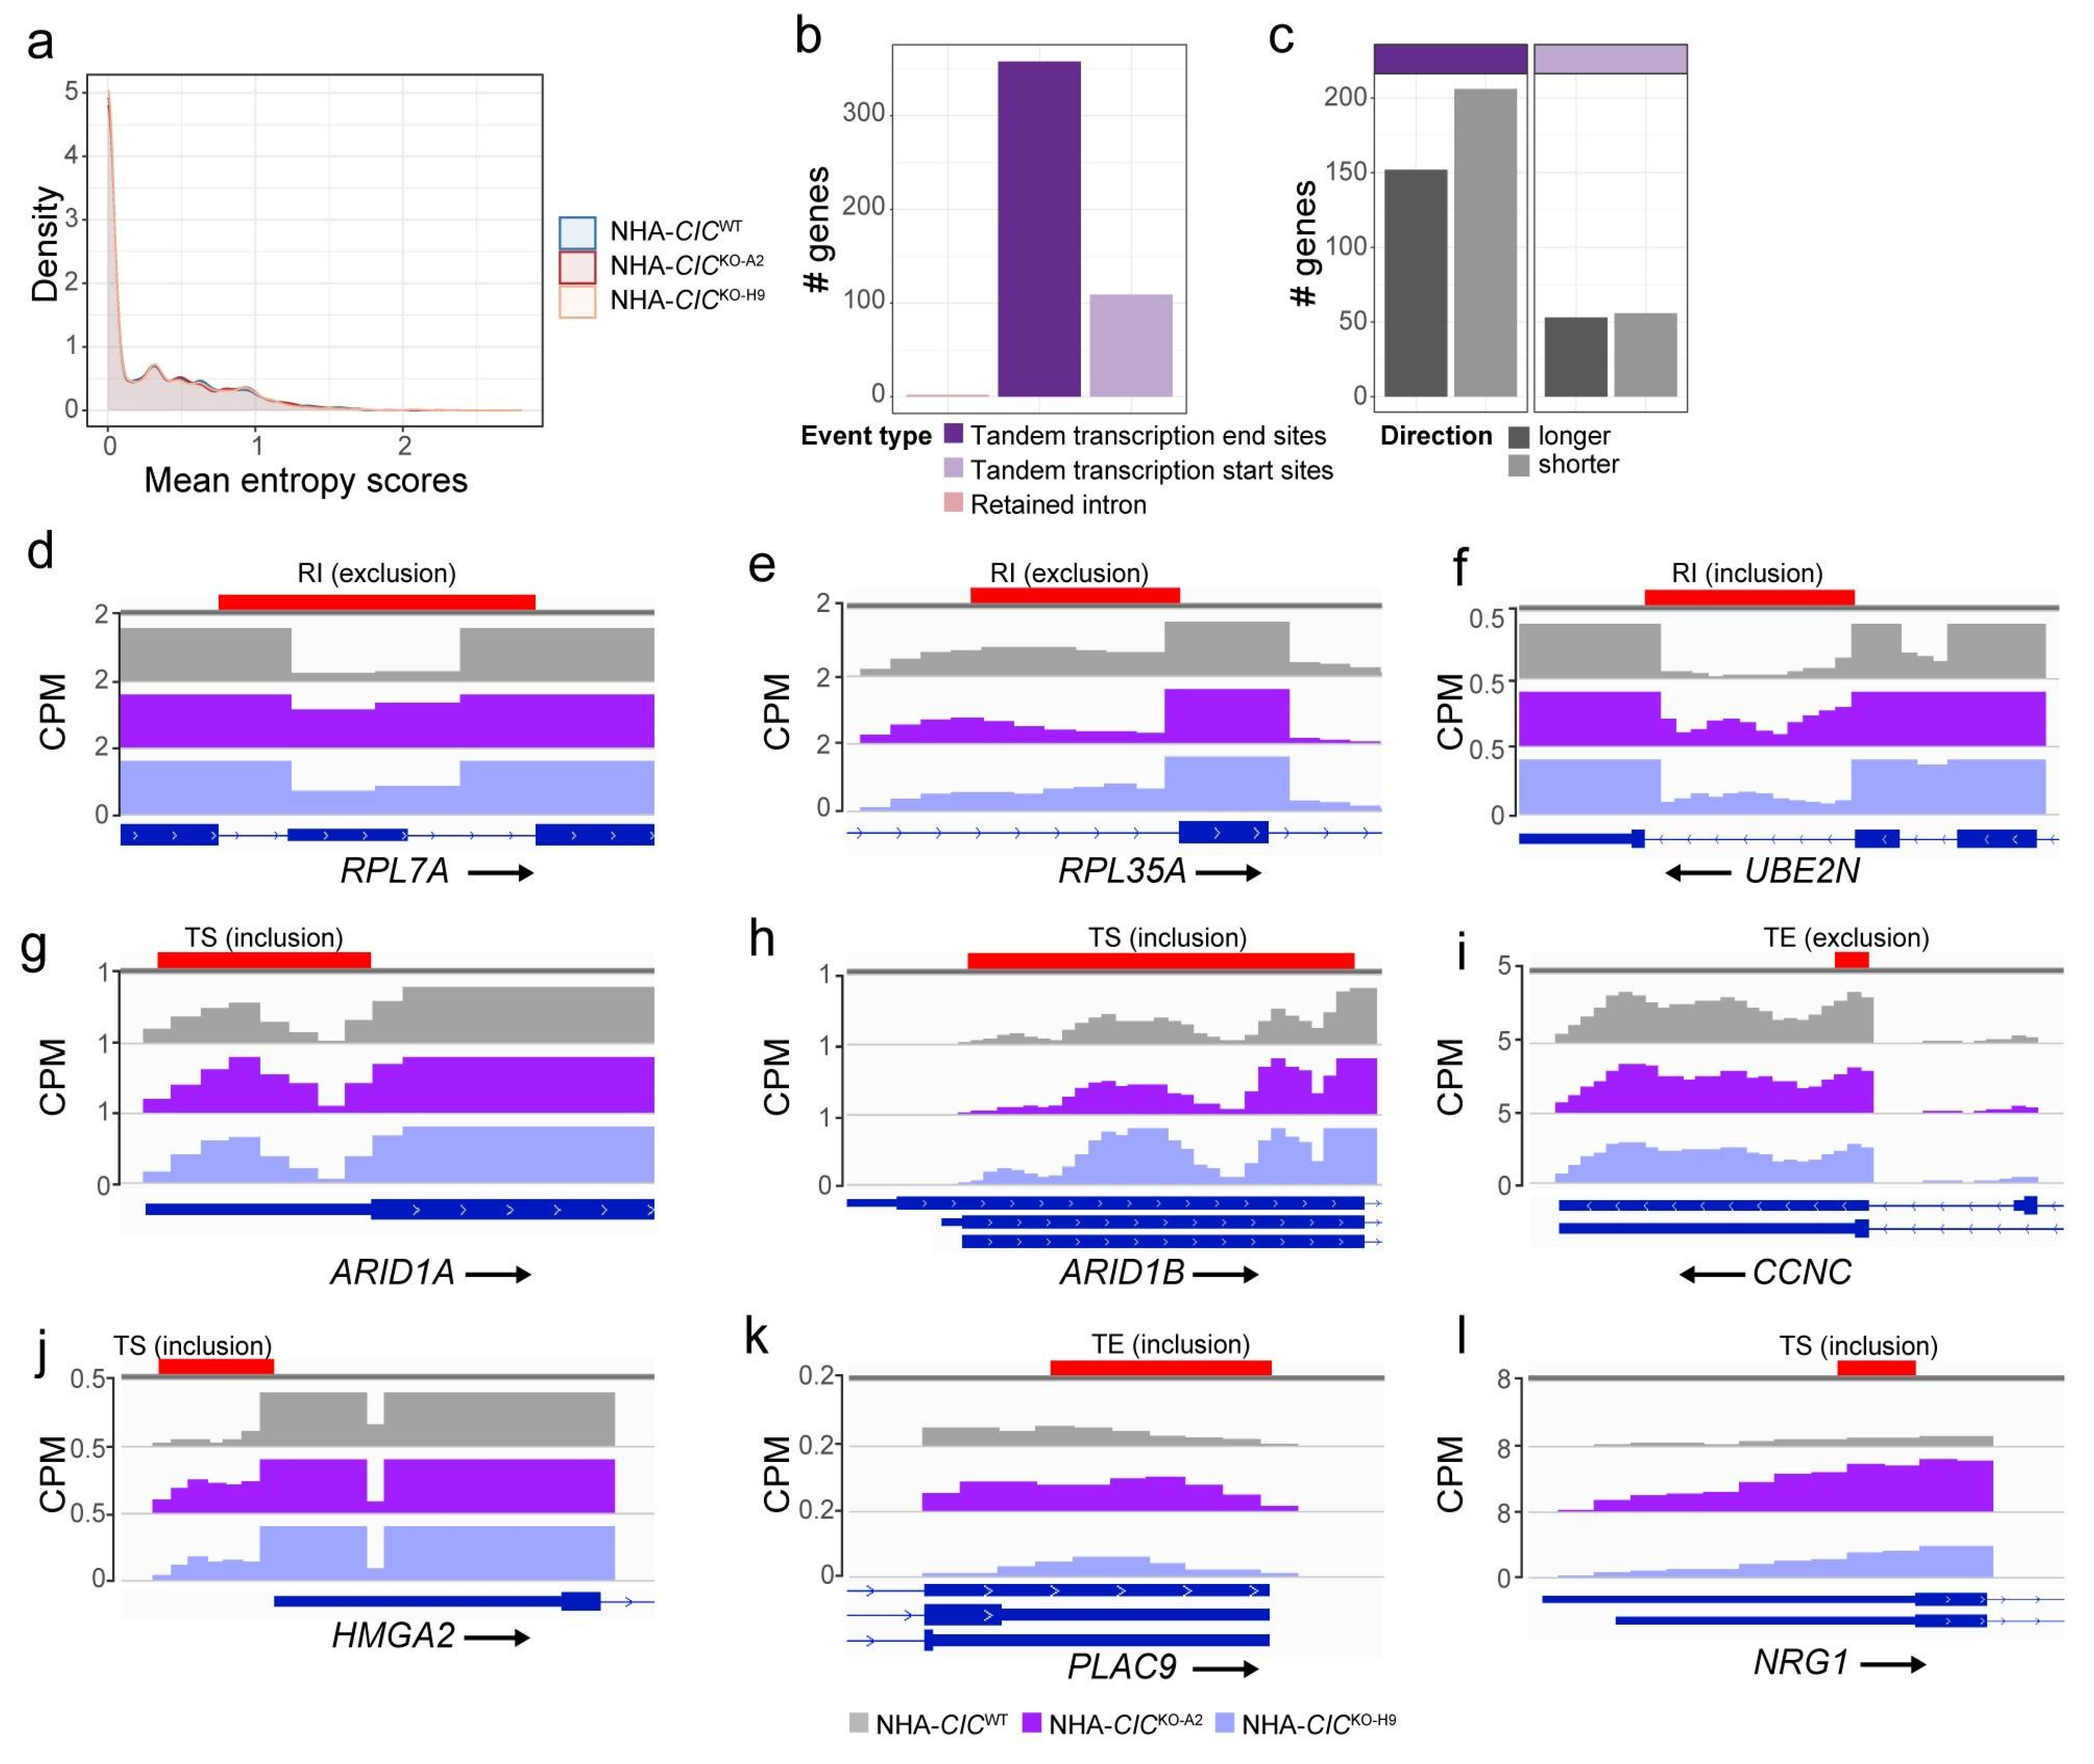
3.7. CIC Loss Destabilises Splicing at Untranslated Regions

Given our observations that RNA splicing factors share genetic and proteomic interactions with CIC and that RNA splicing genes are dysregulated in CIC-deficient cell lines, we posited that loss of CIC may have a global effect on transcript splicing. To investigate this, we applied Whippet, a tool for de novo detection and quantification of alternative splicing events using Shannon entropy-based methods [61], to bulk RNA-seq data we generated previously from three biological replicates of each of the NHA-CICWT, NHA-CICKO-A2, and NHA-CICKO-H9 lines [24] (GEO accession: GSM5708721). We detected 29,020, 28,104, and 27,042 alternative splicing events in at least two replicates of the NHA-CICWT, NHA-CICKO-A2, and NHA-CICKO-H9 cell lines, respectively (Supplementary Table S11a). Whippet attributes entropy scores to genes identified as undergoing alternative splicing, with scores ranging from 0 to log2(number of isoforms). We did not observe differences in the overall distribution of entropy scores between the NHA-CICWT line and either the NHA-CICKO-A2 or NHA-CICKO-H9 lines (Kolmogorov–Smirnov test p-value > 0.05 in both comparisons; Figure 5a), nor did we observe a significant difference in the proportion of high-entropy events (entropy scores > 1.5; i.e., more than three expressed isoforms) between the NHA-CICWT and NHA-CICKO cell lines (Supplementary Figure S4a). Notably, however, the proportion of high-entropy events identified in the NHA cell lines (~2%; Supplementary Figure S4a) was higher than those observed for hepatocellular carcinoma samples, which showed ~0.10% and ~0.12% high-entropy events in control and tumour samples, respectively [61]. This is consistent with previous reports showing that brain cells have higher isoform complexity than other tissue types [124]. Together, these results indicate that CIC loss does not appear to result in marked global changes in alternative splicing events, at least in NHA cells.
Additionally, to determine whether CIC loss affected specific types of splicing events, we used Whippet to perform differential usage analysis and categorised the events by splicing type, comparing the parental NHA-CICWT line to both NHA-CICKO lines. We identified 787 significant differential splicing events affecting 468 genes (absolute delta Ψ > 0.1 and probability > 0.9, as described by Georgakopoulos-Soares et al. [125]; Figure 5b; Supplementary Table S11b). Interestingly, of the eight different types of splicing events that Whippet can detect—namely alternative acceptor, alternative donor, alternative first exon, alternative last exon, core exon, retained intron, tandem transcription end sites, and tandem transcription start sites (TSSs) [61]—the splicing events that were found to be differential between CICWT and CICKO cells were all categorised as one of only three types: transcriptional end sites (or tandem polyadenylated [poly-A] sites; 589 events affecting 360 genes), TSSs (or tandem 5′UTR; 195 events affecting 109 genes), and retained introns (three events affecting three genes; Figure 5b; Supplementary Figure S4b; Supplementary Table S11b). Furthermore, we observed more genes containing events that led to a shorter 3′ UTR (i.e., usage of an earlier poly-A site; ~200 genes) compared to those that lengthened it (~150 genes) in the NHA-CICKO cell lines (Figure 5c). Conversely, tandem TSS events were equally distributed between those that lengthened or shortened the 5′ UTR. These results may indicate that loss of CIC can affect 3′ end usage and, to a lesser extent, 5′ end usage, and that it may favour the shortening of 3′ UTRs. To investigate the genes affected by differential splicing events upon CIC loss, we annotated these genes and summarised their functions into 18 categories (Supplementary Table S11c; Supplementary Figure S4c). We found genes associated with roles such as regulation of vesicle transport, apoptosis and autophagy, cell development and differentiation, the microtubule cytoskeleton, the cell cycle, DNA repair, and chromosome segregation (Supplementary Table S11c). Interestingly, the SWI/SNF complex members ARID1A and ARID1B both displayed alternative TSS usage in CICKO cells (Supplementary Table S11b). The differential intron retention events affected the ribosomal proteins RPL7A and RPL35A (exclusion in the CICKO cells; Figure 5d,e) and the ubiquitin conjugate enzyme UBE2N (inclusion; Figure 5f), which is involved in DNA repair [126]. Differential 3′ UTR usage was detected in BCL2L11, which encodes the proapoptotic BH3-only protein BIM, resulting in a shortening of this region in CICKO cells. Interestingly, in rat neurons, ERK signalling has been shown to regulate Bim expression via the 3′ UTR [127]. Given that 3′ UTR length can affect the stability, localisation, and translation of mRNA [128], these results suggest that loss of CIC may affect the functions of these processes through dysregulation of transcript splicing.
Given that UTR length and intron retention events have both been shown to affect gene expression [129,130,131], we next compared the list of genes affected by significant alternative splicing events to those that were found to be differentially expressed in our scRNA-seq data. We identified 51 genes affected by alternative splicing that were also significantly differentially expressed (31 and 20 genes upregulated and downregulated in NHA-CICKO cells, respectively; Supplementary Table S11d). Consistent with the notion that intron retention can downregulate gene expression [131], RPL7A, which was found to exclude an intron in the NHA-CICKO cell lines that was retained in the NHA-CICWT line (Figure 5d), showed higher expression in NHA-CICKO lines at G1/S, S, and M/G1 phases, whereas UBE2N, which retained an intron in CICKO cells (Figure 5f), was significantly downregulated in G1/S-phase CICKO cells (Supplementary Figure S4d). We also observed several genes associated with cell cycle regulation, namely CCNC [132], HMGA2 [133], and PLAC9 [134], that had differential UTR events as well as differential gene expression (Figure 5i–k and Supplementary Figure S4d). Interestingly, NRG1, which encodes the NRG1 ligand that binds to ERBB receptors to activate MAPK and other signalling pathways [135] and which is also involved in neuronal development [136], was also found to include an additional TSS in CICKO cells (Figure 5l) and was overexpressed in G1/S-phase CICKO cells (Supplementary Figure S4d). NRG1 gives rise to >30 isoforms, which are grouped into six types (I-VI) [137]. The alternative TSS identified in CICKO cells affects NRG1 isoforms 3, 6, 7, and 8 (Uniprot ID Q02297-3, Q02297-6, Q02297-7, and Q02297-8, respectively), which share a common TSS and which belong to types II (isoform 3, predominantly expressed in mesenchymal cells) and III (isoforms 6-8, the major isoforms expressed in neurons) [136]. Since type III NRG1 isoforms bind ERBB2, ERBB3, and ERBB4 [135,137], dysregulation of type III genes may lead to dysregulation of MAPK and other signalling pathways. Altogether, our profile of the alternative splicing patterns in NHA cell lines shows that loss of CIC is associated with destabilised splicing predominantly at UTRs. A subset of genes affected by alternative splicing also show dysregulated gene expression, including genes associated with roles that were previously known or have emerged as part of this study as being associated with CIC, such as MAPK signalling, DNA repair, cell cycle regulation, and neuronal development.

4. Discussion

In this study, we used bioinformatics, mass spectrometry, genomics, single-cell RNA-seq, and microscopy techniques to expand our understanding of CIC function in human and mouse cells and tissues. Results from these orthogonal approaches converged to implicate CIC in cell cycle regulation and splicing in addition to its known function as an effector of MAPK signalling (see Supplementary Table S4 for a summary of genes/proteins that were identified as part of CIC’s functional networks using different ‘omics approaches). Furthermore, we uncovered multiple lines of evidence indicating that CIC interacts with the SWI/SNF complex in additional cellular contexts than the neuronal progenitor one where the interaction was first observed [32] and that CIC may rely on this interaction for some of its functions in these novel cellular contexts. Strikingly, we also observed that CIC loss was associated with an increased frequency of mitotic defects in human cell lines and in an in vivo mouse model of forebrain-specific CIC loss.
Hwang et al. [32] recently showed that CIC functions with the SWI/SNF complex to regulate neuronal differentiation. Our results support and expand these observations into additional cellular contexts, notably demonstrating, for the first time, that CIC physically interacts with the SWI/SNF complex members SMARCA2, SMARCC1, ARID1A, and ARID2 in NHA and HEK cell lines. Additionally, we found that CIC co-localised with ARID1A, SMARCA2, and SMARCC1 throughout the cell cycle, displaying a dynamic relocalisation pattern that included foci formation at de-condensing chromosomes during initiation of nuclear envelope reassembly and accumulation of these foci until completion of cytokinesis.
Our co-essentiality and co-expression analyses indicated that CIC may share functionality with BICRA/GLTSCR1, a component of the recently identified non-canonical GBAF SWI/SNF complex [73]. Our analysis of publicly available ChIP-seq data from mESCs [22,51] also provided further support for a potential association between CIC and the GBAF sub-complex. Specifically, we found that CIC binding sites overlapped with those of BRD4, which has been shown to interact with BICRA/GLTSCR1 [73,138] and to recruit the GBAF complex to naive pluripotency genes in mESCs [51], and those of BRD9, which is a required component of the GBAF complex and an optional component of the npBAF and nBAF complexes [139]. Although the nature of the GBAF complex’s roles in mammalian development and disease remain poorly understood, early evidence is consistent with the notion that it is a key mediator of these processes [139], warranting further investigation into CIC’s potential association with this non-canonical sub-complex. Given that CIC’s transcriptional repressor function was found to be dependent on its interaction with the SWI/SNF complex during neuronal development [32], together, our observations indicate the possibility that this cooperative relationship could be at play in additional cellular contexts and may rely on interactions with one or more sub-complexes.
In addition to CIC’s interactions with SWI/SNF complexes, another major finding of our study is that CIC appears to play a role in mitotic integrity, as evidenced by the observation that its loss is associated with increased mitotic defects in several in vitro and in vivo models. Notably, these two observations may be related to one another; indeed, the SWI/SNF complex has been implicated in the maintenance of genomic stability, and disruption of its activity has been associated with mitotic defects similar to the ones we observed in this study, such as faulty chromosome segregation [140,141,142,143]. The mapping of CIC’s genetic and physical interaction networks also revealed several additional interactors involved in cell cycle and mitotic control. For example, BECN1, which was predicted to share both co-essentiality and a synthetic lethal partnership with CIC, has been shown to promote accurate kinetochore anchoring to mitotic spindles [77], proper cytokinetic abscission [144], and to regulate autophagy and apoptotic processes [76]. Notably, inhibition of BECN1 expression is associated with phenotypes similar to those we observed in CIC-deficient cells, such as an increased frequency of cytokinesis defects [77]. BECN1’s known role in supporting the formation of mitotic structures, together with our failure to observe co-localisation between CIC and these structures in mitotic cells, raise the possibility that CIC may be involved in a parallel role that converges with BECN1’s function in maintaining mitotic fidelity, which could explain why their combined loss is predicted to be incompatible with cell survival.
Another important finding that emerged from our study is the observation that CIC interacts (both physically and genetically) with a wide range of proteins and genes involved in RNA processing, splicing, and mRNA stability. For example, the list of 156 proteins we identified as high-confidence candidate physical interactors of CIC included at least 38 proteins annotated as being involved in functions related to RNA splicing, rRNA/mRNA metabolism and processing, and ribosome biogenesis, which is consistent with the notion that CIC physically interacts with RNA processing complexes. Furthermore, genetic interactions were also observed between CIC and genes that play a role in mRNA stability, such as FXR1, which has been shown to stabilise transcripts through binding to their 5′ or 3′ UTRs [78,79,80] and which was identified as co-essential with CIC, and HNRNPA0, which can also stabilise transcripts through binding to their 3′ UTRs [100] and which was identified as a synthetic lethal partner of CIC as well as a high-confidence physical interactor (Supplementary Table S4). Through analysis of bulk RNA-seq data that our group previously generated from CICWT and CICKO NHA cell lines, we found that loss of CIC is associated with dysregulated at 5′ and 3′ UTRs, raising the possibility that CIC also plays a role in mRNA stability.
It is worth noting that, in addition to the putative novel roles discussed above, our study also reinforced CIC’s known role as an effector of MAPK signalling and provided clues as to interactions between this established function and CIC’s possible novel ones. For example, CIC’s co-essential network, which is composed of genes with which CIC is likely to share functionality, included several known regulators of MAPK signalling, including DUSP6, RASA1, and ERF. Notably, CIC and ERF have been shown to co-regulate the expression of ETV1 in prostate cancer, where their combined loss and the subsequent increase in ETV1 expression contribute to disease progression [72]. As mentioned above, the two genes, which are located directly adjacent to one another on chromosome 19q, are co-deleted in 1p/19q co-deleted low-grade gliomas and also frequently in prostate adenocarcinomas (~10–12% of cases) [72], suggesting that the dual loss of CIC and ERF (possibly with BICRA/GLTSCR1, as discussed above) may favour tumour development, possibly through their combined dysregulation of MAPK signalling. Further studies aimed at distinguishing the joint and distinct roles of CIC and ERF are thus warranted in order to reveal the extent and implication of their cooperative roles.
While our multi-omic analysis uncovered several putative CIC functions, we acknowledge that there are limitations to such analyses. For example, both genetic interaction networks [145] and protein interaction networks [146] are known to contain context-dependent interactions. To focus on generalised CIC functions, we used several methods to mitigate this possible limitation; for example, we used multiple contexts when mapping both genetic interactors (CIC mutant lines included a lung cancer and an endometrial carcinoma line; CIC wild-type lines included 557 lines from 29 cancer contexts) and protein interactors (NHA and HEK cell lines). We also highlighted not only interacting genes/proteins but also the broad functional pathways that were enriched in multiple assays (e.g., MAPK signalling, cell cycle regulation, SWI/SNF function), which are known to be more conserved [147]. While this approach may miss context-dependent interactions, we argue that multi-omic and multi-context studies such as this one are crucial to expanding our understanding of the complexities of CIC functions. Our study thus provides valuable insights into CIC’s roles and provides multiple avenues for future, more focused studies.

5. Conclusions

Overall, our study provides a rigorous exploration of CIC’s genetic and proteomic interaction networks and considerably expands our understanding of the diverse cellular processes in which CIC appears to play a role. Beyond the insights it provides into CIC function specifically, this work also presents a model for how multi-omic, network-based analyses that leverage both public and novel datasets can reveal novel and interconnected roles for pleiotropic genes/proteins across cellular and subcellular contexts. For instance, our results raise the intriguing possibility that CIC may be required to ensure faithful mitotic division and that this function may be related to its interactions with SWI/SNF complexes and/or with RNA processing and spliceosomal complexes. This work thus introduces novel avenues through which CIC can act as a pan-cancer tumour suppressor, and we anticipate that it will catalyse further innovative investigations into this intriguing protein’s varied roles.

Supplementary Materials

The following supporting information can be downloaded at: https://www.mdpi.com/article/10.3390/cancers15102805/s1, Supplementary Figure S1: Workflow of CIC in silico genetic interaction screen leveraging data generated by DepMap. Supplementary Figure S2: Nuclear CIC colocalises with members of the SWI/SNF complex and is dynamically re-distributed during the cell cycle. Supplementary Figure S3: Loss of CIC is associated with an increased frequency of mitotic defects. Supplementary Figure S4: Profile of alternative splicing events detected in NHA cell lines. Supplementary Table S1: CIC’s co-essential and co-expressed gene partners. Supplementary Table S2: CIC mutation characteristics in DepMap 20Q1 cancer cell lines. Supplementary Table S3: In silico genome-wide screening result comparing CICHomDel mutant cell lines to CICWT control cell lines. Supplementary Table S4: Genes and proteins identified in the distinct multi-omic analyses in this study. Supplementary Table S5: Candidate nuclear interactors of CIC in HEK-CICWT cells. Supplementary Table S6: Candidate nuclear interactors of CIC in NHA-CICWT cells. Supplementary Table S7: scRNA-seq phase-specific DE results. Supplementary Table S8: scRNA-seq phase-specific GSEA results. Supplementary Table S9: High-confidence CIC ChIP peaks identified in Lee et al. [24]. Supplementary Table S10: CIC ChIP peaks identified in mESCs. Supplementary Table S11: Alternative splicing events detected in NHA cell lines. Supplementary Table S12: Phase-specific genes identified by Whitfield et al. [41] used to score and assign cells to cell cycle phases. Supplementary Table S13: Antibodies used in this study [148,149,150,151,152,153,154,155,156].

Author Contributions

Conceptualization, M.A.M., Y.T., V.G.L. and S.C.; methodology, M.A.M., Y.T., V.G.L. and S.C.; software, Y.T., V.G.L. and C.S.H.; validation, Y.T., V.G.L., S.C., J.S., S.Y.C., S.A.J.R.A. and S.M.G.; formal analysis, Y.T., V.G.L. and S.C.; investigation, S.C., J.S., S.Y.C., S.D.L., Y.T., A.G., D.L.T., W.R.B., A.M., C.S.H. and G.B.M.; resources, S.C., J.S., S.Y.C., S.T.A., C.S.H., J.G.C., J.A.C., G.B.M., S.A.J.R.A., S.M.G. and M.A.M.; data curation, Y.T., V.G.L., C.S.H., R.D.C. and S.C.; writing—original draft preparation, Y.T., V.G.L. and S.C.; writing—review & editing, Y.T., V.G.L., M.A.M., D.L.T., R.D.C., J.A.C., S.A.J.R.A., S.M.G., G.B.M., J.G.C. and S.Y.; visualisation, Y.T., V.G.L., S.C., J.S. and S.Y.C.; supervision, M.A.M.; project administration, Y.T., V.G.L., S.C. and M.A.M.; funding acquisition, M.A.M. All authors have read and agreed to the published version of the manuscript.

Funding

This study was supported in part by the Canadian Institutes of Health Research (CIHR; FDN-143288).

Institutional Review Board Statement

Animal use was approved by the University of Calgary Animal Care Committee (protocol AC16-0266) in compliance with the Guidelines of the Canadian Council of Animal Care. The work presented here was approved by the UBC BC Cancer Research Ethics Board (H19-03010, H08-02838).

Data Availability Statement

scRNA-seq data have been deposited in the Gene Expression Omnibus (GEO; accession GSE193765). IP-MS data have been deposited with the ProteomeXchange Consortium via the Proteomics Identification (PRIDE) database [157] (accession PXD030942).

Acknowledgments

The authors thank the sequencing, bioinformatics, and project management teams at Canada’s Michael Smith Genome Sciences Centre for their expert technical contributions. We thank Michel Roberge and Phil Hieter for helpful edits and comments on early versions of the manuscript, and G. Dawson for providing the HOG cell line. We are especially grateful to Donna Anderson for her generosity in supporting this project through the UBC Foundation. M.A.M. gratefully acknowledges the support of BC Cancer, the BC Cancer Foundation, the Canada Research Chairs programme, the Canada Foundation for Innovation (projects 20070, 30981, and 33408), Genome BC, Genome Canada, and the University of British Columbia (UBC). V.G.L. was supported by a CIHR Vanier Canada Graduate Scholarship and a Killam Doctoral Scholarship. Y.T. and V.G.L. were supported by UBC 4-year fellowships. Y.T. was supported by UBC international student awards and the UBC President’s Academic Excellence Initiative PhD Awards.

Conflicts of Interest

S.Y. is on the advisory boards of and has received honoraria from Amgen, AstraZeneca, Bayer AG, Incyte, Pfizer Inc, and Roche. S.A.J.R.A. is a co-founder of and consultant to Contextual Genomics Ltd. and is on the advisory boards of Sangamo Biosciences and Repare Therapeutics. The remaining authors declare no competing interest.

References

  1. Haidar, A.; Arekapudi, S.; DeMattia, F.; Abu-Isa, E.; Kraut, M. High-Grade Undifferentiated Small Round Cell Sarcoma with t(4;19)(Q35;Q13.1) CIC-DUX4 Fusion: Emerging Entities of Soft Tissue Tumors with Unique Histopathologic Features—A Case Report and Literature Review. Am. J. Case Rep. 2015, 16, 87–94. [Google Scholar] [CrossRef]
  2. Bettegowda, C.; Agrawal, N.; Jiao, Y.; Sausen, M.; Wood, L.D.; Hruban, R.H.; Rodriguez, F.J.; Cahill, D.P.; McLendon, R.; Riggins, G.; et al. Mutations in CIC and FUBP1 Contribute to Human Oligodendroglioma. Science 2011, 333, 1453–1455. [Google Scholar] [CrossRef]
  3. Yip, S.; Butterfield, Y.S.; Morozova, O.; Chittaranjan, S.; Blough, M.D.; An, J.; Birol, I.; Chesnelong, C.; Chiu, R.; Chuah, E.; et al. Concurrent CIC Mutations, IDH Mutations, and 1p/19q Loss Distinguish Oligodendrogliomas from Other Cancers. J. Pathol. 2012, 226, 7–16. [Google Scholar] [CrossRef]
  4. The Cancer Genome Atlas Research Network. Comprehensive Molecular Characterization of Gastric Adenocarcinoma. Nature 2014, 513, 202–209. [Google Scholar] [CrossRef]
  5. The Cancer Genome Atlas Research Network. Integrated Genomic Characterization of Endometrial Carcinoma. Nature 2013, 497, 67–73. [Google Scholar] [CrossRef]
  6. Cerami, E.; Gao, J.; Dogrusoz, U.; Gross, B.E.; Sumer, S.O.; Aksoy, B.A.; Jacobsen, A.; Byrne, C.J.; Heuer, M.L.; Larsson, E.; et al. The CBio Cancer Genomics Portal: An Open Platform for Exploring Multidimensional Cancer Genomics Data. Cancer Discov. 2012, 2, 401–404. [Google Scholar] [CrossRef]
  7. Gao, J.; Aksoy, B.A.; Dogrusoz, U.; Dresdner, G.; Gross, B.; Sumer, S.O.; Sun, Y.; Jacobsen, A.; Sinha, R.; Larsson, E.; et al. Integrative Analysis of Complex Cancer Genomics and Clinical Profiles Using the CBioPortal. Sci. Signal. 2013, 6, pl1. [Google Scholar] [CrossRef]
  8. Choi, N.; Park, J.; Lee, J.S.; Yoe, J.; Park, G.Y.; Kim, E.; Jeon, H.; Cho, Y.M.; Roh, T.Y.; Lee, Y. MiR-93/MiR-106b/MiR-375-CIC-CRABP1: A Novel Regulatory Axis in Prostate Cancer Progression. Oncotarget 2015, 6, 23533–23547. [Google Scholar] [CrossRef]
  9. Okimoto, R.A.; Breitenbuecher, F.; Olivas, V.R.; Wu, W.; Gini, B.; Hofree, M.; Asthana, S.; Hrustanovic, G.; Flanagan, J.; Tulpule, A.; et al. Inactivation of Capicua Drives Cancer Metastasis. Nat. Genet. 2017, 49, 87–96. [Google Scholar] [CrossRef]
  10. Simon-Carrasco, L.; Grana, O.; Salmon, M.; Jacob, H.K.C.; Gutierrez, A.; Jimenez, G.; Drosten, M.; Barbacid, M. Inactivation of Capicua in Adult Mice Causes T-Cell Lymphoblastic Lymphoma. Genes Dev. 2017, 31, 1456–1468. [Google Scholar] [CrossRef]
  11. Tan, Q.; Brunetti, L.; Rousseaux, M.W.C.; Lu, H.C.; Wan, Y.W.; Revelli, J.P.; Liu, Z.; Goodell, M.A.; Zoghbi, H.Y. Loss of Capicua Alters Early T Cell Development and Predisposes Mice to T Cell Lymphoblastic Leukemia/Lymphoma. Proc. Natl. Acad. Sci. USA 2018, 115, E1511–E1519. [Google Scholar] [CrossRef]
  12. Chan, A.K.; Pang, J.C.; Chung, N.Y.; Li, K.K.; Poon, W.S.; Chan, D.T.; Shi, Z.; Chen, L.; Zhou, L.; Ng, H.K. Loss of CIC and FUBP1 Expressions Are Potential Markers of Shorter Time to Recurrence in Oligodendroglial Tumors. Mod. Pathol. 2014, 27, 332–342. [Google Scholar] [CrossRef]
  13. Gleize, V.; Alentorn, A.; Connen de Kerillis, L.; Labussiere, M.; Nadaradjane, A.; Mundwiller, E.; Ottolenghi, C.; Mangesius, S.; Rahimian, A.; Ducray, F.; et al. CIC Inactivating Mutations Identify Aggressive Subset of 1p19q Codeleted Gliomas. Ann. Neurol. 2015, 78, 355–374. [Google Scholar] [CrossRef]
  14. Specht, K.; Sung, Y.S.; Zhang, L.; Richter, G.H.; Fletcher, C.D.; Antonescu, C.R. Distinct Transcriptional Signature and Immunoprofile of CIC-DUX4 Fusion-Positive Round Cell Tumors Compared to EWSR1-Rearranged Ewing Sarcomas: Further Evidence toward Distinct Pathologic Entities. Genes Chromosomes Cancer 2014, 53, 622–633. [Google Scholar] [CrossRef]
  15. Antonescu, C.R.; Owosho, A.A.; Zhang, L.; Chen, S.; Deniz, K.; Huryn, J.M.; Kao, Y.C.; Huang, S.C.; Singer, S.; Tap, W.; et al. Sarcomas with CIC-Rearrangements Are a Distinct Pathologic Entity with Aggressive Outcome: A Clinicopathologic and Molecular Study of 115 Cases. Am. J. Surg. Pathol. 2017, 41, 941. [Google Scholar] [CrossRef]
  16. Liao, S.; Davoli, T.; Leng, Y.; Li, M.Z.; Xu, Q.; Elledge, S.J. A Genetic Interaction Analysis Identifies Cancer Drivers That Modify EGFR Dependency. Genes Dev. 2017, 31, 184–196. [Google Scholar] [CrossRef]
  17. Wang, B.; Krall, E.B.; Aguirre, A.J.; Kim, M.; Widlund, H.R.; Doshi, M.B.; Sicinska, E.; Sulahian, R.; Goodale, A.; Cowley, G.S.; et al. ATXN1L, CIC, and ETS Transcription Factors Modulate Sensitivity to MAPK Pathway Inhibition. Cell Rep. 2017, 18, 1543–1557. [Google Scholar] [CrossRef]
  18. Hashiba, T.; Yamashita, T.; Okada, H.; Nio, K.; Hayashi, T.; Asahina, Y.; Hayashi, T.; Terashima, T.; Iida, N.; Takatori, H.; et al. Inactivation of Transcriptional Repressor Capicua Confers Sorafenib Resistance in Human Hepatocellular Carcinoma. Cell Mol. Gastroenterol. Hepatol. 2020, 10, 269–285. [Google Scholar] [CrossRef]
  19. Simón-Carrasco, L.; Jiménez, G.; Barbacid, M.; Drosten, M. The Capicua Tumor Suppressor: A Gatekeeper of Ras Signaling in Development and Cancer. Cell Cycle 2018, 17, 702–711. [Google Scholar] [CrossRef]
  20. Padul, V.; Epari, S.; Moiyadi, A.; Shetty, P.; Shirsat, N.V. ETV/Pea3 Family Transcription Factor-Encoding Genes Are Overexpressed in CIC-Mutant Oligodendrogliomas. Genes Chromosomes Cancer 2015, 54, 725–733. [Google Scholar] [CrossRef]
  21. LeBlanc, V.G.; Firme, M.; Song, J.; Chan, S.Y.; Lee, M.H.; Yip, S.; Chittaranjan, S.; Marra, M.A. Comparative Transcriptome Analysis of Isogenic Cell Line Models and Primary Cancers Links CIC Loss to Activation of the MAPK Signalling Cascade. J. Pathol. 2017, 242, 206–220. [Google Scholar] [CrossRef]
  22. Weissmann, S.; Cloos, P.A.; Sidoli, S.; Jensen, O.N.; Pollard, S.; Helin, K. The Tumor Suppressor CIC Directly Regulates MAPK Pathway Genes via Histone Deacetylation. Cancer Res. 2018, 78, 4114–4125. [Google Scholar] [CrossRef]
  23. Ren, Y.; Ouyang, Z.; Hou, Z.; Yan, Y.; Zhi, Z.; Shi, M.; Du, M.; Liu, H.; Wen, Y.; Shao, Y. CIC Is a Mediator of the ERK1/2-DUSP6 Negative Feedback Loop. iScience 2020, 23, 101635. [Google Scholar] [CrossRef]
  24. Lee, S.D.; Song, J.; LeBlanc, V.G.; Marra, M.A. Integrative Multi-Omic Analysis Reveals Neurodevelopmental Gene Dysregulation in CIC-Knockout and IDH1-Mutant Cells. J. Pathol. 2022, 256, 297–309. [Google Scholar] [CrossRef]
  25. Jimenez, G.; Shvartsman, S.Y.; Paroush, Z. The Capicua Repressor—A General Sensor of RTK Signaling in Development and Disease. J. Cell Sci. 2012, 125, 1383–1391. [Google Scholar] [CrossRef]
  26. Tseng, A.S.; Tapon, N.; Kanda, H.; Cigizoglu, S.; Edelmann, L.; Pellock, B.; White, K.; Hariharan, I.K. Capicua Regulates Cell Proliferation Downstream of the Receptor Tyrosine Kinase/Ras Signaling Pathway. Curr. Biol. 2007, 17, 728–733. [Google Scholar] [CrossRef]
  27. Jin, Y.; Ha, N.; Fores, M.; Xiang, J.; Glasser, C.; Maldera, J.; Jimenez, G.; Edgar, B.A. EGFR/Ras Signaling Controls Drosophila Intestinal Stem Cell Proliferation via Capicua-Regulated Genes. PLoS Genet. 2015, 11, e1005634. [Google Scholar] [CrossRef]
  28. Yang, R.; Chen, L.H.; Hansen, L.J.; Carpenter, A.B.; Moure, C.J.; Liu, H.; Pirozzi, C.J.; Diplas, B.H.; Waitkus, M.S.; Greer, P.K.; et al. Cic Loss Promotes Gliomagenesis via Aberrant Neural Stem Cell Proliferation and Differentiation. Cancer Res. 2017, 77, 6097–6108. [Google Scholar] [CrossRef]
  29. Wong, D.; Lounsbury, K.; Lum, A.; Song, J.; Chan, S.; LeBlanc, V.; Chittaranjan, S.; Marra, M.; Yip, S. Transcriptomic Analysis of CIC and ATXN1L Reveal a Functional Relationship Exploited by Cancer. Oncogene 2019, 38, 273–290. [Google Scholar] [CrossRef]
  30. Lee, Y. Regulation and Function of Capicua in Mammals. Exp. Mol. Med. 2020, 52, 531–537. [Google Scholar] [CrossRef]
  31. Lam, Y.C.; Bowman, A.B.; Jafar-Nejad, P.; Lim, J.; Richman, R.; Fryer, J.D.; Hyun, E.D.; Duvick, L.A.; Orr, H.T.; Botas, J.; et al. ATAXIN-1 Interacts with the Repressor Capicua in Its Native Complex to Cause SCA1 Neuropathology. Cell 2006, 127, 1335–1347. [Google Scholar] [CrossRef] [PubMed]
  32. Hwang, I.; Pan, H.; Yao, J.; Elemento, O.; Zheng, H.; Paik, J. CIC Is a Critical Regulator of Neuronal Differentiation. JCI Insight 2020, 5, 135826. [Google Scholar] [CrossRef] [PubMed]
  33. VanderSluis, B.; Costanzo, M.; Billmann, M.; Ward, H.N.; Myers, C.L.; Andrews, B.J.; Boone, C. Integrating Genetic and Protein-Protein Interaction Networks Maps a Functional Wiring Diagram of a Cell. Curr. Opin. Microbiol. 2018, 45, 170–179. [Google Scholar] [CrossRef]
  34. Takemon, Y.; Chick, J.M.; Gerdes Gyuricza, I.; Skelly, D.A.; Devuyst, O.; Gygi, S.P.; Churchill, G.A.; Korstanje, R. Proteomic and Transcriptomic Profiling Reveal Different Aspects of Aging in the Kidney. eLife 2021, 10, e62585. [Google Scholar] [CrossRef]
  35. Shan, G.; Zhang, H.; Bi, G.; Bian, Y.; Liang, J.; Valeria, B.; Zeng, D.; Yao, G.; Zhan, C.; Fan, H. Multi-Omics Analysis of Cancer Cell Lines with High/Low Ferroptosis Scores and Development of a Ferroptosis-Related Model for Multiple Cancer Types. Front. Cell Dev. Biol. 2021, 9, 794475. [Google Scholar] [CrossRef]
  36. Chittaranjan, S.; Chan, S.; Yang, C.; Yang, K.C.; Chen, V.; Moradian, A.; Firme, M.; Song, J.; Go, N.E.; Blough, M.D.; et al. Mutations in CIC and IDH1 Cooperatively Regulate 2-Hydroxyglutarate Levels and Cell Clonogenicity. Oncotarget 2014, 5, 7960–7979. [Google Scholar] [CrossRef]
  37. R Core Team. R: A Language and Environment for Statistical Computing; R Core Team: Vienna, Austria, 2020. [Google Scholar]
  38. Lun, A.T.; Bach, K.; Marioni, J.C. Pooling across Cells to Normalize Single-Cell RNA Sequencing Data with Many Zero Counts. Genome Biol. 2016, 17, 75. [Google Scholar] [CrossRef]
  39. Macosko, E.Z.; Basu, A.; Satija, R.; Nemesh, J.; Shekhar, K.; Goldman, M.; Tirosh, I.; Bialas, A.R.; Kamitaki, N.; Martersteck, E.M.; et al. Highly Parallel Genome-Wide Expression Profiling of Individual Cells Using Nanoliter Droplets. Cell 2015, 161, 1202–1214. [Google Scholar] [CrossRef]
  40. Schwabe, D.; Formichetti, S.; Junker, J.P.; Falcke, M.; Rajewsky, N. The Transcriptome Dynamics of Single Cells during the Cell Cycle. Mol. Syst. Biol. 2020, 16, e9946. [Google Scholar] [CrossRef]
  41. Whitfield, M.L.; Sherlock, G.; Saldanha, A.J.; Murray, J.I.; Ball, C.A.; Alexander, K.E.; Matese, J.C.; Perou, C.M.; Hurt, M.M.; Brown, P.O.; et al. Identification of Genes Periodically Expressed in the Human Cell Cycle and Their Expression in Tumors. Mol. Biol. Cell 2002, 13, 1977–2000. [Google Scholar] [CrossRef]
  42. Zheng, S.C.; Stein-O’Brien, G.; Augustin, J.J.; Slosberg, J.; Carosso, G.A.; Winer, B.; Shin, G.; Bjornsson, H.T.; Goff, L.A.; Hansen, K.D. Universal Prediction of Cell-Cycle Position Using Transfer Learning. Genome Biol. 2022, 23, 41. [Google Scholar] [CrossRef] [PubMed]
  43. Love, M.I.; Huber, W.; Anders, S. Moderated Estimation of Fold Change and Dispersion for RNA-Seq Data with DESeq2. Genome Biol. 2014, 15, 550. [Google Scholar] [CrossRef] [PubMed]
  44. Takemon, Y.; Marra, M.A. GRETA: An R Package for Mapping in Silico Genetic Interaction and Essentiality Networks. bioRxiv 2022. bioRxiv:2022-09. [Google Scholar] [CrossRef]
  45. DepMap, Broad (2020): DepMap 20Q1 Public. Figshare. Dataset. Available online: https://figshare.com/articles/dataset/DepMap_20Q1_Public/11791698/3 (accessed on 10 February 2020).
  46. Meyers, R.M.; Bryan, J.G.; McFarland, J.M.; Weir, B.A.; Sizemore, A.E.; Xu, H.; Dharia, N.V.; Montgomery, P.G.; Cowley, G.S.; Pantel, S.; et al. Computational Correction of Copy Number Effect Improves Specificity of CRISPR-Cas9 Essentiality Screens in Cancer Cells. Nat. Genet. 2017, 49, 1779–1784. [Google Scholar] [CrossRef] [PubMed]
  47. Dempster, J.M.; Rossen, J.; Kazachkova, M.; Pan, J.; Kugener, G.; Root, D.E.; Tsherniak, A. Extracting Biological Insights from the Project Achilles Genome-Scale CRISPR Screens in Cancer Cell Lines. bioRxiv 2019, 720243. [Google Scholar] [CrossRef]
  48. Obayashi, T.; Kagaya, Y.; Aoki, Y.; Tadaka, S.; Kinoshita, K. COXPRESdb v7: A Gene Coexpression Database for 11 Animal Species Supported by 23 Coexpression Platforms for Technical Evaluation and Evolutionary Inference. Nucleic Acids Res. 2019, 47, D55–D62. [Google Scholar] [CrossRef]
  49. Pan, J.; Meyers, R.M.; Michel, B.C.; Mashtalir, N.; Sizemore, A.E.; Wells, J.N.; Cassel, S.H.; Vazquez, F.; Weir, B.A.; Hahn, W.C.; et al. Interrogation of Mammalian Protein Complex Structure, Function, and Membership Using Genome-Scale Fitness Screens. Cell Syst. 2018, 6, 555–568.e7. [Google Scholar] [CrossRef]
  50. Wainberg, M.; Kamber, R.A.; Balsubramani, A.; Meyers, R.M.; Sinnott-Armstrong, N.; Hornburg, D.; Jiang, L.; Chan, J.; Jian, R.; Gu, M.; et al. A Genome-Wide Atlas of Co-Essential Modules Assigns Function to Uncharacterized Genes. Nat. Genet. 2021, 53, 638–649. [Google Scholar] [CrossRef]
  51. Gatchalian, J.; Malik, S.; Ho, J.; Lee, D.-S.; Kelso, T.W.R.; Shokhirev, M.N.; Dixon, J.R.; Hargreaves, D.C. A Non-Canonical BRD9-Containing BAF Chromatin Remodeling Complex Regulates Naive Pluripotency in Mouse Embryonic Stem Cells. Nat. Commun. 2018, 9, 5139. [Google Scholar] [CrossRef]
  52. Li, H.; Durbin, R. Fast and Accurate Short Read Alignment with Burrows-Wheeler Transform. Bioinformatics 2009, 25, 1754–1760. [Google Scholar] [CrossRef]
  53. Li, H.; Handsaker, B.; Wysoker, A.; Fennell, T.; Ruan, J.; Homer, N.; Marth, G.; Abecasis, G.; Durbin, R. 1000 Genome Project Data Processing Subgroup The Sequence Alignment/Map Format and SAMtools. Bioinformatics 2009, 25, 2078–2079. [Google Scholar] [CrossRef]
  54. Danecek, P.; Bonfield, J.K.; Liddle, J.; Marshall, J.; Ohan, V.; Pollard, M.O.; Whitwham, A.; Keane, T.; McCarthy, S.A.; Davies, R.M.; et al. Twelve Years of SAMtools and BCFtools. Gigascience 2021, 10, giab008. [Google Scholar] [CrossRef] [PubMed]
  55. Zhang, Y.; Liu, T.; Meyer, C.A.; Eeckhoute, J.; Johnson, D.S.; Bernstein, B.E.; Nusbaum, C.; Myers, R.M.; Brown, M.; Li, W.; et al. Model-Based Analysis of ChIP-Seq (MACS). Genome Biol. 2008, 9, R137. [Google Scholar] [CrossRef] [PubMed]
  56. Yu, G.; Wang, L.-G.; He, Q.-Y. ChIPseeker: An R/Bioconductor Package for ChIP Peak Annotation, Comparison and Visualization. Bioinformatics 2015, 31, 2382–2383. [Google Scholar] [CrossRef] [PubMed]
  57. Wang, Q.; Li, M.; Wu, T.; Zhan, L.; Li, L.; Chen, M.; Xie, W.; Xie, Z.; Hu, E.; Xu, S.; et al. Exploring Epigenomic Datasets by ChIPseeker. Curr. Protoc. 2022, 2, e585. [Google Scholar] [CrossRef] [PubMed]
  58. Lawrence, M.; Huber, W.; Pages, H.; Aboyoun, P.; Carlson, M.; Gentleman, R.; Morgan, M.T.; Carey, V.J. Software for Computing and Annotating Genomic Ranges. PLoS Comput. Biol. 2013, 9, e1003118. [Google Scholar] [CrossRef] [PubMed]
  59. Zhu, L.J.; Gazin, C.; Lawson, N.D.; Pagès, H.; Lin, S.M.; Lapointe, D.S.; Green, M.R. ChIPpeakAnno: A Bioconductor Package to Annotate ChIP-Seq and ChIP-Chip Data. BMC Bioinform. 2010, 11, 237. [Google Scholar] [CrossRef] [PubMed]
  60. Zhu, L.J. Integrative Analysis of ChIP-Chip and ChIP-Seq Dataset. In Tiling Arrays: Methods and Protocols; Lee, T.-L., Shui Luk, A.C., Eds.; Humana Press: Totowa, NJ, USA, 2013; pp. 105–124. ISBN 9781627036078. [Google Scholar]
  61. Sterne-Weiler, T.; Weatheritt, R.J.; Best, A.J.; Ha, K.C.H.; Blencowe, B.J. Efficient and Accurate Quantitative Profiling of Alternative Splicing Patterns of Any Complexity on a Laptop. Mol. Cell 2018, 72, 187–200.e6. [Google Scholar] [CrossRef]
  62. Thorvaldsdóttir, H.; Robinson, J.T.; Mesirov, J.P. Integrative Genomics Viewer (IGV): High-Performance Genomics Data Visualization and Exploration. Brief. Bioinform. 2013, 14, 178–192. [Google Scholar] [CrossRef]
  63. Ramírez, F.; Ryan, D.P.; Grüning, B.; Bhardwaj, V.; Kilpert, F.; Richter, A.S.; Heyne, S.; Dündar, F.; Manke, T. DeepTools2: A next Generation Web Server for Deep-Sequencing Data Analysis. Nucleic Acids Res. 2016, 44, W160–W165. [Google Scholar] [CrossRef]
  64. Michel, B.C.; D’Avino, A.R.; Cassel, S.H.; Mashtalir, N.; McKenzie, Z.M.; McBride, M.J.; Valencia, A.M.; Zhou, Q.; Bocker, M.; Soares, L.M.M.; et al. A Non-Canonical SWI/SNF Complex Is a Synthetic Lethal Target in Cancers Driven by BAF Complex Perturbation. Nat. Cell Biol. 2018, 20, 1410–1420. [Google Scholar] [CrossRef] [PubMed]
  65. van Dam, S.; Võsa, U.; van der Graaf, A.; Franke, L.; de Magalhães, J.P. Gene Co-Expression Analysis for Functional Classification and Gene-Disease Predictions. Brief. Bioinform. 2018, 19, 575–592. [Google Scholar] [CrossRef] [PubMed]
  66. Reinhard, N.R.; Van Der Niet, S.; Chertkova, A.; Postma, M.; Hordijk, P.L.; Gadella, T.W.J., Jr.; Goedhart, J. Identification of Guanine Nucleotide Exchange Factors That Increase Cdc42 Activity in Primary Human Endothelial Cells. Small GTPases 2021, 12, 226–240. [Google Scholar] [CrossRef]
  67. Chou, M.M.; Masuda-Robens, J.M.; Gupta, M.L. Cdc42 Promotes G1 Progression through P70 S6 Kinase-Mediated Induction of Cyclin E Expression. J. Biol. Chem. 2003, 278, 35241–35247. [Google Scholar] [CrossRef]
  68. Yasuda, S.; Taniguchi, H.; Oceguera-Yanez, F.; Ando, Y.; Watanabe, S.; Monypenny, J.; Narumiya, S. An Essential Role of Cdc42-like GTPases in Mitosis of HeLa Cells. FEBS Lett. 2006, 580, 3375–3380. [Google Scholar] [CrossRef]
  69. Le Gallic, L.; Virgilio, L.; Cohen, P.; Biteau, B.; Mavrothalassitis, G. ERF Nuclear Shuttling, a Continuous Monitor of Erk Activity That Links It to Cell Cycle Progression. Mol. Cell. Biol. 2004, 24, 1206–1218. [Google Scholar] [CrossRef] [PubMed]
  70. Twigg, S.R.F.; Vorgia, E.; McGowan, S.J.; Peraki, I.; Fenwick, A.L.; Sharma, V.P.; Allegra, M.; Zaragkoulias, A.; Akha, E.S.; Knight, S.J.L.; et al. Reduced Dosage of ERF Causes Complex Craniosynostosis in Humans and Mice and Links ERK1/2 Signaling to Regulation of Osteogenesis. Nat. Genet. 2013, 45, 308–313. [Google Scholar] [CrossRef]
  71. Singh, R.; Cohen, A.S.A.; Poulton, C.; Hjortshøj, T.D.; Akahira-Azuma, M.; Mendiratta, G.; Khan, W.A.; Azmanov, D.N.; Woodward, K.J.; Kirchhoff, M.; et al. Deletion of ERF and CIC Causes Abnormal Skull Morphology and Global Developmental Delay. Cold Spring Harb. Mol. Case Stud. 2021, 7, a005991. [Google Scholar] [CrossRef]
  72. Gupta, N.; Song, H.; Wu, W.; Ponce, R.K.; Lin, Y.K.; Kim, J.W.; Small, E.J.; Feng, F.Y.; Huang, F.W.; Okimoto, R.A. The CIC-ERF Co-Deletion Underlies Fusion-Independent Activation of ETS Family Member, ETV1, to Drive Prostate Cancer Progression. eLife 2022, 11, e77072. [Google Scholar] [CrossRef]
  73. Alpsoy, A.; Dykhuizen, E.C. Glioma Tumor Suppressor Candidate Region Gene 1 (GLTSCR1) and Its Paralog GLTSCR1-like Form SWI/SNF Chromatin Remodeling Subcomplexes. J. Biol. Chem. 2018, 293, 3892–3903. [Google Scholar] [CrossRef]
  74. Yue, J.; López, J.M. Understanding MAPK Signaling Pathways in Apoptosis. Int. J. Mol. Sci. 2020, 21, 2346. [Google Scholar] [CrossRef] [PubMed]
  75. Guo, Y.-J.; Pan, W.-W.; Liu, S.-B.; Shen, Z.-F.; Xu, Y.; Hu, L.-L. ERK/MAPK Signalling Pathway and Tumorigenesis. Exp. Ther. Med. 2020, 19, 1997–2007. [Google Scholar] [CrossRef] [PubMed]
  76. Kang, R.; Zeh, H.J.; Lotze, M.T.; Tang, D. The Beclin 1 Network Regulates Autophagy and Apoptosis. Cell Death Differ. 2011, 18, 571–580. [Google Scholar] [CrossRef] [PubMed]
  77. Frémont, S.; Gérard, A.; Galloux, M.; Janvier, K.; Karess, R.E.; Berlioz-Torrent, C. Beclin-1 Is Required for Chromosome Congression and Proper Outer Kinetochore Assembly. EMBO Rep. 2013, 14, 364–372. [Google Scholar] [CrossRef]
  78. Deng, M.; Wang, N.; Li, Z.; Chen, R.; Duan, J.; Peng, Y.; Wu, Z.; Zhang, Z.; Jiang, L.; Zheng, X.; et al. FXR1 Can Bind with the CFIm25/CFIm68 Complex and Promote the Progression of Urothelial Carcinoma of the Bladder by Stabilizing TRAF1 MRNA. Cell Death Dis. 2022, 13, 170. [Google Scholar] [CrossRef]
  79. George, J.; Li, Y.; Kadamberi, I.P.; Parashar, D.; Tsaih, S.-W.; Gupta, P.; Geethadevi, A.; Chen, C.; Ghosh, C.; Sun, Y.; et al. RNA-Binding Protein FXR1 Drives CMYC Translation by Recruiting EIF4F Complex to the Translation Start Site. Cell Rep. 2021, 37, 109934. [Google Scholar] [CrossRef]
  80. Davidovic, L.; Durand, N.; Khalfallah, O.; Tabet, R.; Barbry, P.; Mari, B.; Sacconi, S.; Moine, H.; Bardoni, B. A Novel Role for the RNA-Binding Protein FXR1P in Myoblasts Cell-Cycle Progression by Modulating P21/Cdkn1a/Cip1/Waf1 MRNA Stability. PLoS Genet. 2013, 9, e1003367. [Google Scholar] [CrossRef]
  81. Cui, Z.; Shen, Y.; Chen, K.H.; Mittal, S.K.; Yang, J.-Y.; Zhang, G. KANK1 Inhibits Cell Growth by Inducing Apoptosis through Regulating CXXC5 in Human Malignant Peripheral Nerve Sheath Tumors. Sci. Rep. 2017, 7, 40325. [Google Scholar] [CrossRef]
  82. Chen, N.-P.; Sun, Z.; Fässler, R. The Kank Family Proteins in Adhesion Dynamics. Curr. Opin. Cell Biol. 2018, 54, 130–136. [Google Scholar] [CrossRef]
  83. Benatti, P.; Dolfini, D.; Viganò, A.; Ravo, M.; Weisz, A.; Imbriano, C. Specific Inhibition of NF-Y Subunits Triggers Different Cell Proliferation Defects. Nucleic Acids Res. 2011, 39, 5356–5368. [Google Scholar] [CrossRef]
  84. Moeinvaziri, F.; Shahhoseini, M. Epigenetic Role of CCAAT Box-Binding Transcription Factor NF-Y on ID Gene Family in Human Embryonic Carcinoma Cells. IUBMB Life 2015, 67, 880–887. [Google Scholar] [CrossRef] [PubMed]
  85. Zhang, Y.; Li, Y.; Wang, Q.; Su, B.; Xu, H.; Sun, Y.; Sun, P.; Li, R.; Peng, X.; Cai, J. Role of RASA1 in Cancer: A Review and Update. Oncol. Rep. 2020, 44, 2386–2396. [Google Scholar] [CrossRef] [PubMed]
  86. Jongsma, M.L.M.; de Waard, A.A.; Raaben, M.; Zhang, T.; Cabukusta, B.; Platzer, R.; Blomen, V.A.; Xagara, A.; Verkerk, T.; Bliss, S.; et al. The SPPL3-Defined Glycosphingolipid Repertoire Orchestrates HLA Class I-Mediated Immune Responses. Immunity 2021, 54, 132–150.e9. [Google Scholar] [CrossRef] [PubMed]
  87. Park, S.; Lee, S.; Lee, C.G.; Park, G.Y.; Hong, H.; Lee, J.S.; Kim, Y.M.; Lee, S.B.; Hwang, D.; Choi, Y.S.; et al. Capicua Deficiency Induces Autoimmunity and Promotes Follicular Helper T Cell Differentiation via Derepression of ETV5. Nat. Commun. 2017, 8, 16037. [Google Scholar] [CrossRef] [PubMed]
  88. Park, S.; Park, J.; Kim, E.; Lee, Y. The Capicua-ETV5 Axis Regulates Liver-Resident Memory CD8(+) T Cell Development and the Pathogenesis of Liver Injury. Hepatology 2019, 391, 806–811. [Google Scholar] [CrossRef]
  89. Park, G.-Y.; Lee, G.-W.; Kim, S.; Hong, H.; Park, J.S.; Cho, J.-H.; Lee, Y. Deletion Timing of Cic Alleles during Hematopoiesis Determines the Degree of Peripheral CD4+ T Cell Activation and Proliferation. Immune Netw. 2020, 20, e43. [Google Scholar] [CrossRef]
  90. Kim, S.; Park, G.-Y.; Park, J.S.; Park, J.; Hong, H.; Lee, Y. Regulation of Positive and Negative Selection and TCR Signaling during Thymic T Cell Development by Capicua. eLife 2021, 10, e71769. [Google Scholar] [CrossRef] [PubMed]
  91. Li, H.; Liu, Q.; Hu, X.; Feng, D.; Xiang, S.; He, Z.; Hu, X.; Zhou, J.; Ding, X.; Zhou, C.; et al. Human ZCCHC12 Activates AP-1 and CREB Signaling as a Transcriptional Co-Activator. Acta Biochim. Biophys. Sin. 2009, 41, 535–544. [Google Scholar] [CrossRef] [PubMed]
  92. Ghandi, M.; Huang, F.W.; Jané-Valbuena, J.; Kryukov, G.V.; Lo, C.C.; McDonald, E.R., 3rd; Barretina, J.; Gelfand, E.T.; Bielski, C.M.; Li, H.; et al. Next-Generation Characterization of the Cancer Cell Line Encyclopedia. Nature 2019, 569, 503–508. [Google Scholar] [CrossRef]
  93. Nusinow, D.P.; Szpyt, J.; Ghandi, M.; Rose, C.M.; McDonald, E.R., 3rd; Kalocsay, M.; Jané-Valbuena, J.; Gelfand, E.; Schweppe, D.K.; Jedrychowski, M.; et al. Quantitative Proteomics of the Cancer Cell Line Encyclopedia. Cell 2020, 180, 387–402.e16. [Google Scholar] [CrossRef]
  94. Behan, F.M.; Iorio, F.; Picco, G.; Gonçalves, E.; Beaver, C.M.; Migliardi, G.; Santos, R.; Rao, Y.; Sassi, F.; Pinnelli, M.; et al. Prioritization of Cancer Therapeutic Targets Using CRISPR–Cas9 Screens. Nature 2019, 568, 511–516. [Google Scholar] [CrossRef] [PubMed]
  95. Nijman, S.M. Synthetic Lethality: General Principles, Utility and Detection Using Genetic Screens in Human Cells. FEBS Lett. 2011, 585, 1–6. [Google Scholar] [CrossRef]
  96. Van Leeuwen, J.; Boone, C.; Andrews, B.J. Mapping a Diversity of Genetic Interactions in Yeast. Curr. Opin. Syst. Biol. 2017, 6, 14–21. [Google Scholar] [CrossRef] [PubMed]
  97. Mashtalir, N.; D’Avino, A.R.; Michel, B.C.; Luo, J.; Pan, J.; Otto, J.E.; Zullow, H.J.; McKenzie, Z.M.; Kubiak, R.L.; St Pierre, R.; et al. Modular Organization and Assembly of SWI/SNF Family Chromatin Remodeling Complexes. Cell 2018, 175, 1272–1288.e20. [Google Scholar] [CrossRef] [PubMed]
  98. Sonoda, Y.; Ozawa, T.; Hirose, Y.; Aldape, K.D.; McMahon, M.; Berger, M.S.; Pieper, R.O. Formation of Intracranial Tumors by Genetically Modified Human Astrocytes Defines Four Pathways Critical in the Development of Human Anaplastic Astrocytoma. Cancer Res. 2001, 61, 4956–4960. [Google Scholar]
  99. Erickson, B.K.; Rose, C.M.; Braun, C.R.; Erickson, A.R.; Knott, J.; McAlister, G.C.; Wühr, M.; Paulo, J.A.; Everley, R.A.; Gygi, S.P. A Strategy to Combine Sample Multiplexing with Targeted Proteomics Assays for High-Throughput Protein Signature Characterization. Mol. Cell 2017, 65, 361–370. [Google Scholar] [CrossRef] [PubMed]
  100. Reinhardt, H.C.; Hasskamp, P.; Schmedding, I.; Morandell, S.; van Vugt, M.A.T.M.; Wang, X.; Linding, R.; Ong, S.-E.; Weaver, D.; Carr, S.A.; et al. DNA Damage Activates a Spatially Distinct Late Cytoplasmic Cell-Cycle Checkpoint Network Controlled by MK2-Mediated RNA Stabilization. Mol. Cell 2010, 40, 34–49. [Google Scholar] [CrossRef] [PubMed]
  101. Mittal, P.; Roberts, C.W.M. The SWI/SNF Complex in Cancer—Biology, Biomarkers and Therapy. Nat. Rev. Clin. Oncol. 2020, 17, 435–448. [Google Scholar] [CrossRef]
  102. Gañez-Zapater, A.; Mackowiak, S.D.; Guo, Y.; Tarbier, M.; Jordán-Pla, A.; Friedländer, M.R.; Visa, N.; Östlund Farrants, A.-K. The SWI/SNF Subunit BRG1 Affects Alternative Splicing by Changing RNA Binding Factor Interactions with Nascent RNA. Mol. Genet. Genom. 2022, 297, 463–484. [Google Scholar] [CrossRef]
  103. Lin, J.-S.; Lai, E.-M. Protein–Protein Interactions: Co-Immunoprecipitation. In Bacterial Protein Secretion Systems: Methods and Protocols; Journet, L., Cascales, E., Eds.; Springer: New York, NY, USA, 2017; pp. 211–219. ISBN 9781493970339. [Google Scholar]
  104. Söderberg, O.; Gullberg, M.; Jarvius, M.; Ridderstråle, K.; Leuchowius, K.-J.; Jarvius, J.; Wester, K.; Hydbring, P.; Bahram, F.; Larsson, L.-G.; et al. Direct Observation of Individual Endogenous Protein Complexes in Situ by Proximity Ligation. Nat. Methods 2006, 3, 995–1000. [Google Scholar] [CrossRef]
  105. Post, G.R.; Dawson, G. Characterization of a Cell Line Derived from a Human Oligodendroglioma. Mol. Chem. Neuropathol. 1992, 16, 303–317. [Google Scholar] [CrossRef] [PubMed]
  106. Ahmad, S.T.; Rogers, A.D.; Chen, M.J.; Dixit, R.; Adnani, L.; Frankiw, L.S.; Lawn, S.O.; Blough, M.D.; Alshehri, M.; Wu, W.; et al. Capicua Regulates Neural Stem Cell Proliferation and Lineage Specification through Control of Ets Factors. Nat. Commun. 2019, 10, 2000. [Google Scholar] [CrossRef] [PubMed]
  107. Cooper, S. Rethinking Synchronization of Mammalian Cells for Cell Cycle Analysis. Cell. Mol. Life Sci. 2003, 60, 1099–1106. [Google Scholar] [CrossRef] [PubMed]
  108. Hsiao, C.J.; Tung, P.; Blischak, J.D.; Burnett, J.E.; Barr, K.A.; Dey, K.K.; Stephens, M.; Gilad, Y. Characterizing and Inferring Quantitative Cell Cycle Phase in Single-Cell RNA-Seq Data Analysis. Genome Res. 2020, 30, 611–621. [Google Scholar] [CrossRef]
  109. Conte, A.; Valente, V.; Paladino, S.; Pierantoni, G.M. HIPK2 in Cancer Biology and Therapy: Recent Findings and Future Perspectives. Cell. Signal. 2023, 101, 110491. [Google Scholar] [CrossRef]
  110. Meister, G.; Landthaler, M.; Peters, L.; Chen, P.Y.; Urlaub, H.; Lührmann, R.; Tuschl, T. Identification of Novel Argonaute-Associated Proteins. Curr. Biol. 2005, 15, 2149–2155. [Google Scholar] [CrossRef]
  111. Lazzaretti, D.; Tournier, I.; Izaurralde, E. The C-Terminal Domains of Human TNRC6A, TNRC6B, and TNRC6C Silence Bound Transcripts Independently of Argonaute Proteins. RNA 2009, 15, 1059–1066. [Google Scholar] [CrossRef]
  112. Pong, S.K.; Gullerova, M. Noncanonical Functions of MicroRNA Pathway Enzymes—Drosha, DGCR8, Dicer and Ago Proteins. FEBS Lett. 2018, 592, 2973–2986. [Google Scholar] [CrossRef]
  113. Park, J.-W.; Kilic, O.; Deo, M.; Jimenez-Cowell, K.; Demirdizen, E.; Kim, H.; Turcan, Ş. CIC Reduces XCT/SLC7A11 Expression and Glutamate Release in Glioma. Acta Neuropathol. Commun. 2023, 11, 13. [Google Scholar] [CrossRef]
  114. Dissanayake, K.; Toth, R.; Blakey, J.; Olsson, O.; Campbell, D.G.; Prescott, A.R.; MacKintosh, C. ERK/P90(RSK)/14-3-3 Signalling Has an Impact on Expression of PEA3 Ets Transcription Factors via the Transcriptional Repressor Capicua. Biochem. J. 2011, 433, 515–525. [Google Scholar] [CrossRef]
  115. Gardino, A.K.; Yaffe, M.B. 14-3-3 Proteins as Signaling Integration Points for Cell Cycle Control and Apoptosis. Semin. Cell Dev. Biol. 2011, 22, 688–695. [Google Scholar] [CrossRef]
  116. Heath, E.M.; Chan, S.M.; Minden, M.D.; Murphy, T.; Shlush, L.I.; Schimmer, A.D. Biological and Clinical Consequences of NPM1 Mutations in AML. Leukemia 2017, 31, 798–807. [Google Scholar] [CrossRef]
  117. Owens, D.M.; Keyse, S.M. Differential Regulation of MAP Kinase Signalling by Dual-Specificity Protein Phosphatases. Oncogene 2007, 26, 3203–3213. [Google Scholar] [CrossRef]
  118. Sobolev, V.V.; Khashukoeva, A.Z.; Evina, O.E.; Geppe, N.A.; Chebysheva, S.N.; Korsunskaya, I.M.; Tchepourina, E.; Mezentsev, A. Role of the Transcription Factor FOSL1 in Organ Development and Tumorigenesis. Int. J. Mol. Sci. 2022, 23, 1521. [Google Scholar] [CrossRef]
  119. Chaudhari, H.G.; Cohen, B.A. Local Sequence Features That Influence AP-1 Cis-Regulatory Activity. Genome Res. 2018, 28, 171–181. [Google Scholar] [CrossRef]
  120. Kannan, M.B.; Solovieva, V.; Blank, V. The Small MAF Transcription Factors MAFF, MAFG and MAFK: Current Knowledge and Perspectives. Biochim. Biophys. Acta 2012, 1823, 1841–1846. [Google Scholar] [CrossRef]
  121. Katsuoka, F.; Yamamoto, M. Small Maf Proteins (MafF, MafG, MafK): History, Structure and Function. Gene 2016, 586, 197–205. [Google Scholar] [CrossRef]
  122. Amit, I.; Citri, A.; Shay, T.; Lu, Y.; Katz, M.; Zhang, F.; Tarcic, G.; Siwak, D.; Lahad, J.; Jacob-Hirsch, J.; et al. A Module of Negative Feedback Regulators Defines Growth Factor Signaling. Nat. Genet. 2007, 39, 503–512. [Google Scholar] [CrossRef]
  123. Hu, J.; Yao, H.; Gan, F.; Tokarski, A.; Wang, Y. Interaction of OKL38 and P53 in Regulating Mitochondrial Structure and Function. PLoS ONE 2012, 7, e43362. [Google Scholar] [CrossRef]
  124. Melé, M.; Ferreira, P.G.; Reverter, F.; DeLuca, D.S.; Monlong, J.; Sammeth, M.; Young, T.R.; Goldmann, J.M.; Pervouchine, D.D.; Sullivan, T.J.; et al. Human Genomics. The Human Transcriptome across Tissues and Individuals. Science 2015, 348, 660–665. [Google Scholar] [CrossRef]
  125. Georgakopoulos-Soares, I.; Parada, G.E.; Wong, H.Y.; Medhi, R.; Furlan, G.; Munita, R.; Miska, E.A.; Kwok, C.K.; Hemberg, M. Alternative Splicing Modulation by G-Quadruplexes. Nat. Commun. 2022, 13, 2404. [Google Scholar] [CrossRef]
  126. Kolas, N.K.; Chapman, J.R.; Nakada, S.; Ylanko, J.; Chahwan, R.; Sweeney, F.D.; Panier, S.; Mendez, M.; Wildenhain, J.; Thomson, T.M.; et al. Orchestration of the DNA-Damage Response by the RNF8 Ubiquitin Ligase. Science 2007, 318, 1637–1640. [Google Scholar] [CrossRef]
  127. Hughes, R.; Gilley, J.; Kristiansen, M.; Ham, J. The MEK-ERK Pathway Negatively Regulates Bim Expression through the 3′ UTR in Sympathetic Neurons. BMC Neurosci. 2011, 12, 69. [Google Scholar] [CrossRef]
  128. Moore, M.J. From Birth to Death: The Complex Lives of Eukaryotic MRNAs. Science 2005, 309, 1514–1518. [Google Scholar] [CrossRef]
  129. Sandberg, R.; Neilson, J.R.; Sarma, A.; Sharp, P.A.; Burge, C.B. Proliferating Cells Express MRNAs with Shortened 3′ Untranslated Regions and Fewer MicroRNA Target Sites. Science 2008, 320, 1643–1647. [Google Scholar] [CrossRef]
  130. Cenik, C.; Derti, A.; Mellor, J.C.; Berriz, G.F.; Roth, F.P. Genome-Wide Functional Analysis of Human 5′ Untranslated Region Introns. Genome Biol. 2010, 11, R29. [Google Scholar] [CrossRef]
  131. Grabski, D.F.; Broseus, L.; Kumari, B.; Rekosh, D.; Hammarskjold, M.-L.; Ritchie, W. Intron Retention and Its Impact on Gene Expression and Protein Diversity: A Review and a Practical Guide. Wiley Interdiscip. Rev. RNA 2021, 12, e1631. [Google Scholar] [CrossRef]
  132. Li, N.; Fassl, A.; Chick, J.; Inuzuka, H.; Li, X.; Mansour, M.R.; Liu, L.; Wang, H.; King, B.; Shaik, S.; et al. Cyclin C Is a Haploinsufficient Tumour Suppressor. Nat. Cell Biol. 2014, 16, 1080–1091. [Google Scholar] [CrossRef]
  133. Chen, Q.; Fu, Q.; Pu, L.; Liu, X.; Liu, Y. Effects of HMGA2 Gene Silencing on Cell Cycle and Apoptosis in the Metastatic Renal Carcinoma Cell Line ACHN. J. Int. Med. Res. 2022, 50, 3000605221075511. [Google Scholar] [CrossRef]
  134. Wang, H.-X.; Qin, X.-H.; Shen, J.; Liu, Q.-H.; Shi, Y.-B.; Xue, L. Proteomic Analysis Reveals That Placenta-Specific Protein 9 Inhibits Proliferation and Stimulates Motility of Human Bronchial Epithelial Cells. Front. Oncol. 2021, 11, 628480. [Google Scholar] [CrossRef]
  135. Fernandez-Cuesta, L.; Thomas, R.K. Molecular Pathways: Targeting NRG1 Fusions in Lung Cancer. Clin. Cancer Res. 2015, 21, 1989–1994. [Google Scholar] [CrossRef] [PubMed]
  136. Mei, L.; Xiong, W.-C. Neuregulin 1 in Neural Development, Synaptic Plasticity and Schizophrenia. Nat. Rev. Neurosci. 2008, 9, 437–452. [Google Scholar] [CrossRef] [PubMed]
  137. Mei, L.; Nave, K.-A. Neuregulin-ERBB Signaling in the Nervous System and Neuropsychiatric Diseases. Neuron 2014, 83, 27–49. [Google Scholar] [CrossRef] [PubMed]
  138. Rahman, S.; Sowa, M.E.; Ottinger, M.; Smith, J.A.; Shi, Y.; Harper, J.W.; Howley, P.M. The Brd4 Extraterminal Domain Confers Transcription Activation Independent of PTEFb by Recruiting Multiple Proteins, Including NSD3. Mol. Cell. Biol. 2011, 31, 2641–2652. [Google Scholar] [CrossRef] [PubMed]
  139. Innis, S.M.; Cabot, B. GBAF, a Small BAF Sub-Complex with Big Implications: A Systematic Review. Epigen. Chromatin 2020, 13, 48. [Google Scholar] [CrossRef]
  140. Coisy-Quivy, M.; Disson, O.; Roure, V.; Muchardt, C.; Blanchard, J.-M.; Dantonel, J.-C. Role for Brm in Cell Growth Control. Cancer Res. 2006, 66, 5069–5076. [Google Scholar] [CrossRef]
  141. Dykhuizen, E.C.; Hargreaves, D.C.; Miller, E.L.; Cui, K.; Korshunov, A.; Kool, M.; Pfister, S.; Cho, Y.J.; Zhao, K.; Crabtree, G.R. BAF Complexes Facilitate Decatenation of DNA by Topoisomerase IIalpha. Nature 2013, 497, 624–627. [Google Scholar] [CrossRef]
  142. Brownlee, P.M.; Chambers, A.L.; Cloney, R.; Bianchi, A.; Downs, J.A. BAF180 Promotes Cohesion and Prevents Genome Instability and Aneuploidy. Cell Rep. 2014, 6, 973–981. [Google Scholar] [CrossRef]
  143. Xue, Y.; Canman, J.C.; Lee, C.S.; Nie, Z.; Yang, D.; Moreno, G.T.; Young, M.K.; Salmon, E.D.; Wang, W. The Human SWI/SNF-B Chromatin-Remodeling Complex Is Related to Yeast Rsc and Localizes at Kinetochores of Mitotic Chromosomes. Proc. Natl. Acad. Sci. USA 2000, 97, 13015–13020. [Google Scholar] [CrossRef]
  144. You, S.Y.; Park, Y.S.; Jeon, H.-J.; Cho, D.-H.; Jeon, H.B.; Kim, S.H.; Chang, J.W.; Kim, J.-S.; Oh, J.S. Beclin-1 Knockdown Shows Abscission Failure but Not Autophagy Defect during Oocyte Meiotic Maturation. Cell Cycle 2016, 15, 1611–1619. [Google Scholar] [CrossRef]
  145. Henkel, L.; Rauscher, B.; Boutros, M. Context-Dependent Genetic Interactions in Cancer. Curr. Opin. Genet. Dev. 2019, 54, 73–82. [Google Scholar] [CrossRef] [PubMed]
  146. Cheng, F.; Zhao, J.; Wang, Y.; Lu, W.; Liu, Z.; Zhou, Y.; Martin, W.R.; Wang, R.; Huang, J.; Hao, T.; et al. Comprehensive Characterization of Protein–Protein Interactions Perturbed by Disease Mutations. Nat. Genet. 2021, 53, 166. [Google Scholar] [CrossRef] [PubMed]
  147. Zinman, G.E.; Zhong, S.; Bar-Joseph, Z. Biological Interaction Networks Are Conserved at the Module Level. BMC Syst. Biol. 2011, 5, 134. [Google Scholar] [CrossRef] [PubMed]
  148. Perkins, D.N.; Pappin, D.J.; Creasy, D.M.; Cottrell, J.S. Probability-Based Protein Identification by Searching Sequence Databases Using Mass Spectrometry Data. Electrophoresis 1999, 20, 3551–3567. [Google Scholar] [CrossRef]
  149. UniProt Consortium. UniProt: The Universal Protein Knowledgebase in 2021. Nucleic Acids Res. 2021, 49, D480–D489. [Google Scholar] [CrossRef]
  150. Bairoch, A.; Apweiler, R. The SWISS-PROT Protein Sequence Database and Its Supplement TrEMBL in 2000. Nucleic Acids Res. 2000, 28, 45–48. [Google Scholar] [CrossRef]
  151. Hughes, C.S.; Foehr, S.; Garfield, D.A.; Furlong, E.E.; Steinmetz, L.M.; Krijgsveld, J. Ultrasensitive Proteome Analysis Using Paramagnetic Bead Technology. Mol. Syst. Biol. 2014, 10, 757. [Google Scholar] [CrossRef]
  152. Hughes, C.S.; McConechy, M.K.; Cochrane, D.R.; Nazeran, T.; Karnezis, A.N.; Huntsman, D.G.; Morin, G.B. Quantitative Profiling of Single Formalin Fixed Tumour Sections: Proteomics for Translational Research. Sci. Rep. 2016, 6, 34949. [Google Scholar] [CrossRef]
  153. Zolg, D.P.; Wilhelm, M.; Schnatbaum, K.; Zerweck, J.; Knaute, T.; Delanghe, B.; Bailey, D.J.; Gessulat, S.; Ehrlich, H.-C.; Weininger, M.; et al. Building ProteomeTools Based on a Complete Synthetic Human Proteome. Nat. Methods 2017, 14, 259–262. [Google Scholar] [CrossRef]
  154. Rappsilber, J.; Ishihama, Y.; Mann, M. Stop and Go Extraction Tips for Matrix-Assisted Laser Desorption/Ionization, Nanoelectrospray, and LC/MS Sample Pretreatment in Proteomics. Anal. Chem. 2003, 75, 663–670. [Google Scholar] [CrossRef]
  155. Käll, L.; Canterbury, J.D.; Weston, J.; Noble, W.S.; MacCoss, M.J. Semi-Supervised Learning for Peptide Identification from Shotgun Proteomics Datasets. Nat. Methods 2007, 4, 923–925. [Google Scholar] [CrossRef]
  156. Spivak, M.; Weston, J.; Bottou, L.; Käll, L.; Noble, W.S. Improvements to the Percolator Algorithm for Peptide Identification from Shotgun Proteomics Data Sets. J. Proteome Res. 2009, 8, 3737–3745. [Google Scholar] [CrossRef]
  157. Perez-Riverol, Y.; Csordas, A.; Bai, J.; Bernal-Llinares, M.; Hewapathirana, S.; Kundu, D.J.; Inuganti, A.; Griss, J.; Mayer, G.; Eisenacher, M.; et al. The PRIDE Database and Related Tools and Resources in 2019: Improving Support for Quantification Data. Nucleic Acids Res. 2019, 47, D442–D450. [Google Scholar] [CrossRef]
Figure 1. CIC is predicted to share co-essentialities and synthetic lethal interactions with regulators of cell proliferation and differentiation and chromatin remodelers. (a) Pearson correlation coefficients between the lethality probabilities of CIC and those of all genes targeted by DepMap genetic screens (n = 18,333) across 739 cancer cell lines. Red points indicate genes with coefficients above the inflection point (88 genes; coefficient > 0.178). Non-syntenic genes are labelled in blue, and selected syntenic genes are labelled in black. (b) Transcriptomic and proteomic data from DepMap were compared across cancer cell lines. Left: CIC mRNA abundance in CICHomDel (n = 2), CICT-HetDel (n = 5), CICHetDel (n = 53), and CICWT (n = 557) cancer cell lines. mRNA expression values were normalised to transcripts per million (TPM). Analysis of variance (ANOVA) p-value = 0.00407. Right: CIC protein expression (scaled and mean-centred) in CICT-HetDel (n = 3), CICHetDel (n = 16), and CICWT (n = 189) cancer cell lines. ANOVA (p-value = 0.00217) followed by Tukey’s HSD analysis: * p-value < 0.05, ** < 0.01. Not significant (ns; p-value > 0.05). (c) Ranked lethal genetic interaction scores of CIC. Each point represents the interaction score of a single gene KO compared between the CICHomDel (n = 2) and CICWT (n = 557) cancer cell line groups, where a higher interaction score indicates an increased likelihood of a gene KO being lethal specifically in the CICHomDel cancer cell line group (see Section 2). Red points indicate significant lethal genetic interactors of CIC (adjusted Mann-Whitney U test p-value < 0.05 and median lethality probability >0.5 in at least one cell line group). (d) Heatmap showing Jaccard index similarities between 232 GO terms enriched for the SL partners of CIC (left). Jaccard index-based hierarchical clustering was used to summarise the GO terms into eight distinct functional groups, and these functions were summarised in the text (right; see also Supplementary Table S3).
Cancers 15 02805 g001
Figure 2. Figure 2. CIC interacts with members of the SWI/SNF complex. (a) Workflow of CIC IP-MS in HEK-CICWT and NHA-CICWT cell lines. See Section 2 and Supplementary Methods for more detail. (be) Reciprocal IPs confirm interactions between CIC and select SWI/SNF subunits. SMARCA2 (b), SMARCC1 (c), ARID1A (d), and ARID2 (e) were immunoprecipitated from nuclear lysates of the parental NHA-CICWT cell line, and CIC interaction was visualised using western blotting. Input lanes indicate nuclear lysate samples used as input for the respective IPs. The CIC-L and CIC-S bands are marked with arrowheads. ((f),g) Localisation of F-CIC-S (FLAG, red), SMARCA2 (f, green), and ARID1A ((g), green) in HEK-CICKO-D10 + F-CIC-S cells at indicated phases of the cell cycle, visualised using IF. DNA was stained with DAPI (blue). Arrows indicate colocalisation of CIC and the relevant interactor at early cytokinesis (yellow foci). Scale bars: 10 µm and 5 µm (zoomed image in (f)). (h) Left: representative PLAs using antibodies against FLAG and ARID1A, SMARCA2, SMARCC1, or ARID2 in HEK-CICKO-D10 cells expressing F-CIC-S (HEK-CICKO-D10 + F-CIC-S, top) or an empty vector (HEK-CICKO-D10 + F-Vec, bottom). DNA was visualised using DAPI staining (blue). Red spots are PLA signals indicating proximity of the proteins assayed (<40 nm). Right: Tukey boxplots showing quantifications of PLA spots per nuclear region. ARID1A, n = 732 and 583; SMARCA2, n = 564 and 533; SMARCC1, n = 564 and 533; ARID2, n = 564 and 588 (nuclei counts for HEK-CICKO-D10 + F-Vec and HEK-CICKO-D10 + F-CIC-S, respectively). **** p-value < 0.0001 (Welch’s t-test). (i) IF staining of endogenous CIC (red) and the nuclear envelope protein NUP62 (green) in the parental NHA-CICWT line. CIC shows a punctate localisation pattern (arrows) throughout the decondensing nucleus. Scale bars: 10 µm and 5 µm (zoomed image).
Cancers 15 02805 g002
Figure 3. Cells lacking CIC have an increased frequency of mitotic defects. (a) Top: representative images of NHA cells with normal or defective metaphase and cytokinesis. Bottom: proportions of cells from indicated cell lines assigned to each category. Bars represent the mean from three independent experiments, and error bars indicate the standard error of the mean (s.e.m.). NHA-CICWT, n = 146 and 122; NHA-CICKO-A2, n = 99 and 94; NHA-CICKO-H9, n = 104 and 89 (metaphase and cytokinesis cell counts, respectively). (b) Representative images of an NHA-CICWT cell with normal metaphase (top) and NHA-CICKO-A2 cells with defective metaphase alignment (middle) and a lagging chromosome at telophase (arrowhead, bottom). DNA was stained with DAPI (blue) and microtubules were visualised using α-tubulin staining (green). Left: DAPI staining alone. Scale bars: 10 µm. (c) Left: mitotically active (boxed) ventricular zone (VZ) region from an E13.5 Cicfl/+;FoxG1cre/+ mouse forebrain and representative images of a normal cell division in a Cicfl/+; FoxG1cre/+ mouse (top right) and a lagging chromosome and a micronucleus in Cicfl/fl; FoxG1cre/+ mice (arrowheads, bottom left and right, respectively). DNA was stained with DAPI (blue) and mitotically active cells were visualised using pH3 staining (red). Right: proportions of cells with defective anaphase/telophase. Bars represent the mean from four animals for each genotype, and error bars indicate s.e.m (n = 186 cells for Cicfl/+; FoxG1cre/+ mice and 180 for Cicfl/fl; FoxG1cre/+ mice). Scale bars: 100 µm (top left) and 10 µm. * p-value < 0.05, ** < 0.01, **** < 0.0001 (two-sided Student’s t-test (a,c)).
Cancers 15 02805 g003
Figure 4. CICKO cells display dysregulated expression of genes involved in chromatin organisation and cell cycle checkpoints. (a) Volcano plots depicting differential expression analysis results for CICKO versus CICWT cells assigned to each indicated phase. Genes considered to be significantly differentially expressed (BH-adjusted p-value < 0.05 and absolute fold-change > 1.5) are coloured, and their numbers are indicated at the top of each plot. (b) Graphical representation of GSEA results for the Reactome term “transcriptional regulation by MECP2”. (c) Normalised expression of indicated genes across cell lines and phases. * BH-adjusted p-value < 0.05, ** < 0.01 (Wald test as implemented by DESeq2), NS: non-significant, NC: adjusted p-value not calculated due to low expression (see Section 2).
Cancers 15 02805 g004
Figure 5. CICKO cells show differential splicing predominantly at UTRs. (a) Density plot showing the proportion of genes with different entropy scores in NHA cell lines. Entropy scores are shown as the mean of three replicates. Kolmogorov–Smirnov tests between the distributions of the NHA-CICWT line and both NHA-CICKO lines were not significant (p-value > 0.05). (b) The number of genes affected by significant differential splicing events (absolute delta Ψ > 0.1 and probability > 0.9) that were detected when comparing the NHA-CICWT line to both NHA-CICKO lines combined, grouped into the indicated categories (see Supplementary Figure S4b for all detected events). (c) The number of genes with alternative transcriptional start or end site events from panel b that led to either longer or shorter UTR sites. See panel b for the event type colour legend. (dl) Representative images from IGV of one replicate each of the NHA-CICWT, NHA-CICKO-A2, and NHA-CICKO-H9 lines showing genes affected by significant differential splicing events. Reads were normalised to counts per million (CPM) for visualisation. Red bars highlight the genomic regions where the events were detected, and the event types are indicated above (retained intron [RI], tandem transcription end site [TE], and tandem transcription start site [TS]). RefSeq transcript models are shown in dark blue below the sample tracks, with transcriptional direction indicated by arrows.
Cancers 15 02805 g005
Table 2. Summary of biological functions enriched in candidate SL interactors (see Supplementary Table S3c for details).
Enriched FunctionsSelected SL Interactors in
Relevant Term(s)
Regulation of epithelial cell function (morphogenesis, differentiation, proliferation, and migration)RREB1, GATA3, PAX8, CEBPB, and SP1
Regulation of cell cycle processes and cell divisionANKRD17, CARM1, CSNK2A1, HAUS2, CDK10, BECN1, UBE2S, CKAP2, and KMT5A
Chromatin/nucleosome disassemblyARID2, and NFE2
Histone modification and chromatin organisationBECN1, CARM1, GATA3, KMT5A, and RIF1
Regulation of double-stranded break repair ARID2, RIF1, and ATP23
RNA splicingLUC7L2, HNRNPA0, and RBM23
Apoptotic processesCEBPB, GATA3, ILK, NKX2-5, PAX8, and PRKC1
Wnt signallingFERMT2, ILK, GATA3, GNAQ, CSNK2A1, NKX2-5, and CALCOCO1
Table 3. Summary of selected biological functions enriched in high-confidence CIC protein interactors (see Supplementary Table S6 for details).
Enriched FunctionsHigh-Confidence Interactors
RNA splicing and ribosomal and messenger RNA (rRNA and mRNA, respectively) metabolism and processing >30 interactors
DNA conformation change and duplex unwinding DDX3X, G3BP1, HNRNPA2B1, HP1BP3, NPM1, RUVBL1, TOP1, TTN, and XRCC5/6
Chromatin remodelling and nucleosome organisationACTB, HNRNPC, HP1BP3, NPM1, PBRM1, RUVBL1, SMARCA2/A4/A5/C1/C2, TOP1, and TRIM28
Chromatin organisation and epigenetic regulation of gene expressionACTB, DDX21, FMR1, GLYR1, HNRNPU, MECP2, MKI67, SIN3A, SMARCA5, SNW1, TRIM28, and UPF1
Telomere organisation and maintenanceDKC1, GAR1, GNL3, HNRNPA1/A2B1/C/D/U, NAT10, UPF1, XRCC5/6, and YLPM1
Intrinsic apoptotic signallingDDX3X, DDX5, DNM1L, HNRNPK, NONO, PRKDC, RPL11, SFPQ, and SNW1
Table 4. Summarised functions of selected genes that are bound by CIC (ChIP-seq) and that show differential expression between CICWT and CICKO cells (scRNA-seq).
Gene(s)Function(s)
ETV4 and ETV5Effectors of MAPK signalling. Known targets of CIC-mediated transcriptional regulation in multiple cellular contexts [19]
DUSP4 and DUSP5Negative feedback regulators of MAPK signalling [117].
Proposed direct targets of CIC in HEK cells, mouse embryonic stem cells, and developing mouse brains [21,22,32].
FOSL1Proto-oncogene and member of the FOS gene family, which encodes a group of proteins that can dimerize with proteins of the JUN family to form the transcription factor AP-1.
Activated by the RAS/MAPK signalling cascade through phosphorylation by ERK2, ERK5, and RSK2 [118].
Proposed direct target of CIC in mouse embryonic stem cells [22].
MAFFMember of the basic leucine zipper (bZIP) family of transcription factors. Can also participate in the formation and binding activity of the AP-1 complex [119].
Has been associated with a variety of functions, mostly related to the stress response. Its activity has been implicated in cancer [120,121].
Has been implicated as a feedback regulator of the MAPK signalling cascade, potentially downstream of AP-1 activity [122].
Proposed direct target of CIC in mouse embryonic stem cells [22].
OSGIN1Involved in oxidative stress and DNA damage responses. Tumour suppressor that acts downstream of and in concert with p53 to induce mitochondrial cytochrome c release and apoptosis [123].
Disclaimer/Publisher’s Note: The statements, opinions and data contained in all publications are solely those of the individual author(s) and contributor(s) and not of MDPI and/or the editor(s). MDPI and/or the editor(s) disclaim responsibility for any injury to people or property resulting from any ideas, methods, instructions or products referred to in the content.

