Article

Development and Validation of Blood-Based Predictive Biomarkers for Response to PD-1/PD-L1 Checkpoint Inhibitors: Evidence of a Universal Systemic Core of 3D Immunogenetic Profiling across Multiple Oncological Indications

by
Ewan Hunter
1,
Matthew Salter
1,
Ryan Powell
1,
Ann Dring
1,
Tarun Naithani
1,
Maria Eleni Chatziioannou
1,
Abel Gebregzabhar
1,
Mutaz Issa
1,
Jayne Green
1,
Serene Ng
2,
Chun Ren Lim
2,
Cheah Soon Keat
3,4,
Ang Tick Suan
3,
Rakesh Raman
3,
Ho Kean Fatt
3,
Fabian Lee Wei Luen
3,
Heba Alshaker
5,
Dmitri Pchejetski
5,
Dave Blum
6,
Thomas Guiel
6,
Robert Heaton, Jr.
6,
Jedd Levine
6 and
Alexandre Akoulitchev
1,*
add Show full author list remove Hide full author list
1
Oxford BioDynamics Plc., Oxford OX4 2WB, UK
2
Oxford BioDynamics (M) Sdn Bhd, Penang 10470, Malaysia
3
Mount Miriam Cancer Hospital (MMCH), Penang 11200, Malaysia
4
Island Hospital, Penang 10450, Malaysia
5
School of Medicine, University of East Anglia, Norwich NR4 7TJ, UK
6
Oxford BioDynamics Inc., Gaithersburg, MD 20878, USA
*
Author to whom correspondence should be addressed.
Cancers 2023, 15(10), 2696; https://doi.org/10.3390/cancers15102696
Submission received: 3 April 2023 / Revised: 6 May 2023 / Accepted: 8 May 2023 / Published: 10 May 2023
(This article belongs to the Topic Biomarker Development and Application)

Abstract

:

Simple Summary

Immune checkpoint inhibitors (ICIs) offer high efficacy of cancer treatment, but their use is limited to a subset of patients who respond well to the resetting of the immune system. To attempt to identify patients and predict response to ICI, tumour-based biomarkers such as PD-L1 expression or mutational tumour burden have been widely used but proved to be of insufficient accuracy. Here, we have deployed epigenetic profiling that detects specific chromosome conformations in the blood of the patients. It has been successfully used for predictive and prognostic applications. In this study, we developed and validated blood biomarkers for a checkpoint inhibitor response test that offers a significant increase in the accuracy of predicting positive response to ICI across multiple oncological indications. This new test is accurate, rapid, and minimally invasive. It could assist in treatment decisions, help to improve patient selection, and more efficiently manage costs.

Abstract

Background: Unprecedented advantages in cancer treatment with immune checkpoint inhibitors (ICIs) remain limited to only a subset of patients. Systemic analyses of the regulatory 3D genome architecture linked to individual epigenetic and immunogenetic controls associated with tumour immune evasion mechanisms and immune checkpoint pathways reveal a highly prevalent molecular profile predictive of response to PD-1/PD-L1 ICIs. A clinical blood test based on a set of eight (8) 3D genomic biomarkers has been developed and validated on the basis of an observational trial to predict response to ICI therapy. Methods: The predictive eight biomarker set is derived from prospective observational clinical trials, representing 280 treatments with Pembrolizumab, Atezolizumab, Durvalumab, Nivolumab, and Avelumab in a broad range of indications: melanoma, lung, hepatocellular, renal, breast, bladder, colon, head and neck, bone, brain, lymphoma, prostate, vulvar, and cervical cancers. Results: The 3D genomic eight biomarker panel for response to immune checkpoint therapy achieved a high accuracy of 85%, sensitivity of 93%, and specificity of 82%. Conclusions: This study demonstrates that a 3D genomic approach can be used to develop a predictive clinical assay for response to PD-1/PD-L1 checkpoint inhibition in cancer patients.

1. Background

Insights into tumour immunology related to mechanisms of tumour immunosurveillance and anti-tumour immune responses have led to unprecedented advances in cancer treatment. This breakthrough in cancer treatment takes advantage of key mechanisms that mitigate tumour immune evasion by targeting immune checkpoints to enhance anti-tumour immunity and harnesses the overall patient immune system. These agents have shown considerable clinical benefit in certain patient populations [1,2,3].
Under physiological conditions, immune checkpoint molecules regulate the immune system by dampening the immune response following successful mitigation of an infection and preventing the onset auto-immune conditions. One of the first identified inhibitory checkpoints—CD152, also known as T lymphocyte-associated protein (CTLA-4)—has been shown to prevent expansion of CD4+ helper T cells, boost regulatory T cells, and promote a pro-tumour immuno-suppressive phenotype [4,5]. Strategies to antagonise CTLA-4 as a means of increasing anti-tumour immunity eventually lead to US Food and Drug Administration (FDA) approval of ipilimumab for treatment of metastatic melanoma [6]. With limited other therapeutic options to improve the survival of advanced melanoma patients, ipilimumab demonstrated a 2-year survival rate of 23.5%. However, consistent with auto-immunity observed in pre-clinical models targeting CTLA-4 [7,8], treatment with ipilimumab was associated with immune-related adverse effects in 60% of patients [9].
Today, the two most successfully exploited immune checkpoints are CD279, called programmed cell death protein 1 (PD-1), expressed on tumour infiltrating lymphocytes, B cells, NK cells, and myeloid cells; and its ligand, CD274, called programmed death-ligand 1 (PD-L1), expressed on tumour cells. The PD-L1/PD-1 interaction is a major mechanism leading to tumour immune evasion. Agents that interfere with this interaction have demonstrated potent and durable anti-tumour activities, with less severe immune-related toxicity compared to CTLA-4 blockade [3]. Accordingly, in earlier clinical trials the anti-PD-1 antibodies Nivolumab and Pembrolizumab had already been proven effective in treatments of melanoma, non-small cell lung cancer (NSCLC), and colorectal cancer [10,11,12,13,14], while anti-PD-L1 antibodies, such as Atezolizumab, Avelumab, Durvalumab—have been proven effective in treatments of NSCLC, urothelial carcinoma, and triple negative breast cancer [15,16,17,18]. Additional cancer types are currently under active clinical investigation.
In addition to the expanding array of therapeutic agents targeting PD-(L)1 (dostarlimab, tyvyt, libtayo, tislelizumab, camrelizumab, and sasanlimab), a series of novel immune checkpoint molecules are undergoing evaluation (LAG-3/CD223, TIM-3, TIGIT, VISTA, B7-H3/CD276, BTLA/CD272) [3].
Limitations of currently approved immune checkpoint inhibitors (ICIs) include variable responses among cancer types, primary resistance in the majority of patients with objective responses observed in the minority, acquired resistance in most cancer types, and significant risk of immune-related adverse side effects. The objective response rate (ORR) for anti-CTLA-4 ipilimumab (Yervoy) in melanoma was 10.9%, with a high-grade treatment-related adverse event rate of 15% [9]; for anti-PD-1 Pembrolizumab (Keytruda) in advanced melanoma—33% ORR, with 14% high-grade treatment-related adverse events [19]; for anti-PD-L1 Avelumab (Bavencio) in urothelial carcinoma—17% ORR, with 8% high-grade treatment adverse events [20].
In practical terms, oncologists prescribing an ICI must weigh the risk of immune-related adverse effects against the ORR and benefits of ICI treatment, with very limited data to guide the decision. This has led to multiple efforts to develop predictive biomarkers to identify patients who will benefit from treatment. The predictive value of tumour intrinsic factors such as tumour mutational burden (TMB), microsatellite instability (MSI), and DNA mismatch repair deficiencies (dMMR) has been supported by several studies [21,22,23]. In 2017, the FDA approved Pembrolizumab for treatment of advanced paediatric and adult solid tumours with high MSI and dMMR, which have not responded to prior treatments and have no other alternative treatment options [3]. The association of genetic biomarkers such as TMB with response to ICI treatment is not observed in all patients [21], and has been reported to have limited predictive value in a particular study context [24].
Also, the advanced technology and standardisation required for such biopsy-based tests impose practical limitations on applicability of these biomarkers in practice-based clinical settings.
Assessment of tumour infiltrating lymphocytes has been evaluated for predictive value with mixed success [25]. With that said, there is much work still required, one thought being that the standardisation of histologic evaluation may improve reliability [26].
Earlier trials of anti-PD-1/PD-L1 inhibitors reported association between tumour PD-L1 expression and response to treatment in melanoma and NSCLC [27,28]. In contrast, other reports showed that durable responses to ICI could be obtained in the absence of tumour PD-L1 expression [29]. The variability in the definitions of PD-L1 positivity and in methods for its evaluation account for significant inconsistencies in predictive results, with calls for further standardisation [3].
The 3D configuration of the genome plays a crucial role in coordinated gene regulation and homeostasis of cellular phenotype [30,31,32]. Three-dimensional genome architecture has been shown to act as the regulatory interface and integration point for genetic risks, epigenetic cues and modifications, metabolic signalling, and transcriptional events all integrated into the manifestation of specific cellular phenotypes and, ultimately, clinical outcomes [30,33,34]. EpiSwitch® is a biomarker platform and methodology for patient stratification developed on the basis of the original chromosome conformation capture (3C) approach as a novel biomarker modality [35,36]. The EpiSwitch® platform has reduced to practice all stages of the discovery, development, validation, and monitoring of blood-based biomarkers, based on 3D genome architecture. To date, 3D genomic EpiSwitch® biomarkers, also known as chromosome conformation signatures; have been used in blood test format to stratify melanoma patients; prognostically stratify patients with fast versus slow progressing motor neurone disease; stratify patients with symptomatic and pre-symptomatic neurodegenerative disease; diagnose patients with thyroid cancer and various stages of prostate cancer; prognostically stratify patients for outcome in diffuse large B cell lymphoma; predictively stratify patients with NSCLC for response to the anti-PD-L1 ICI Avelumab; prognostically stratify high-risk individuals with an immune-health profile susceptible to systemic hyperreaction and severe COVID disease complications upon infection with SARS-CoV-2; and significantly increase PSA positive predictive value in the context of prostate cancer treatment in the population at risk [37,38,39,40,41,42,43,44,45,46,47,48,49,50,51].
Based on predictive and prognostic methodologies developed with systemic 3D genomic biomarkers, we looked at the EpiSwitch® platform 3D genomic profiles in patients treated with ICIs to see if any could be used to predict responsiveness to ICI treatment. We have focused on the PD-(L)1 pathway target, as it is the most advanced in terms of clinically developed inhibitors. We have based our analysis on a prospective observational study with the use of several of the approved ICIs for a variety of oncological indications.
We have used the EpiSwitch® Explorer array platform for whole genome profiling of patients prior to ICI treatment, with subsequent classification of the clinical outcome of response based on standard ORR criteria/RECIST 1.1, as a standard in clinical practice and trials settings [52,53]. After analysing 1.1 million data points with annotations across the whole genome for each screened patient, we identified significant and reproducible differences in marker profiles of responders and non-responders, as potential marker leads. The top leads representing alternative 3D genomic conformations were then translated into a qPCR format, evaluated, and reduced to a molecular classifier. The classifier was then validated on samples from the observational trial and from independent validation cohorts. Here, we report on the development of the 3D genomic biomarker panel with clinical utility in predicting response to ICIs targeting PD-(L)1 across a variety of oncological indications. These biomarkers reflect prevalent regulatory settings at the level of 3D genomics in the dynamic equilibrium with the patient immune system. They are systemically present at baseline prior to treatment and have predictive value for response/non-response outcomes to ICI treatments, either with a PD-1 or PD-L1 monoclonal antibody antagonist.

2. Materials and Methods

2.1. Patient Characteristics

Whole blood samples, 232 in total, were obtained from consenting patients enrolled in the observational trial “Identifying and Developing Chromosomal Conformation Signatures in Patients Undergoing Cancer Immunotherapy” at Mount Miriam Cancer Hospital (MMCH) in Penang, Malaysia. Additionally, 48 retrospective baseline IO treatment samples were procured commercially (Supplementary Table S1). Thirty-two (32) patients were used in the EpiSwitch® screening and discovery stage, 77 in the training model cohort, and there were three independent validation cohorts of 24, 128, and 51 patients. The subject pool represented a multinational set of ICI treated cases, with over 40 distinct oncological diagnoses, from the United States, Europe, and Asia. Patient indications, treatments, clinical outcomes, calls by EpiSwitch® classifier, and sample use at different stages of the biomarker development are listed in (Supplementary Table S1). Disease response or progression to the therapy was assessed by the investigators according to RECIST 1.1 guidelines [52].

2.2. Preparation of 3D Genomic Templates

EpiSwitch® 3D libraries, chromosome conformation analytes converted to sequence-based tags, were prepared from frozen whole blood samples. Using EpiSwitch® protocols following the manufacturer’s instructions for EpiSwitch® Explorer Array kits (Oxford BioDynamics Plc, Oxford, UK), samples were processed on the Freedom EVO 200 robotic platform (Tecan Group Ltd., Männedorf, Switzerland). Briefly, 50 µL of whole blood was diluted and fixed with a formaldehyde containing EpiSwitch buffer. Density cushion centrifugation was used to purify intact nuclei. Following a short detergent-based step to permeabilise the nuclei, restriction enzyme digestion and proximity ligation were used to generate the 3D libraries. Samples were centrifuged to pellet the intact nuclei before purification with an adapted protocol from the QIAmp DNA FFPE Tissue kit (Qiagen, Hilden, Germany) Eluting in 1x TE buffer pH7.5. The 3D libraries were quantified using the Quant-iT™ Picogreen dsDNA Assay kit (Invitrogen, Waltham, MA, USA) and normalised to 5 ng/mL prior to interrogation by PCR.

2.3. Array Design

Custom microarrays were designed using the EpiSwitch® pattern recognition algorithm, which operates on Bayesian modelling and provides a probabilistic score that a region is involved in long-range chromatin interactions. The algorithm was used to annotate the GRCh38 human genome assembly across ~1.1 million sites with the potential to form long-range chromosome conformations [29,30,31,32,33,34,35,36]. The most probable interactions were identified and filtered on a probabilistic score and proximity to the protein, long non-coding RNA, or microRNA coding sequences. Predicted interactions were limited to EpiSwitch® sites greater than 10 kb and less than 300 kb apart. Repeat masking and sequence analysis was used to ensure unique marker sequences for each interaction. The EpiSwitch® Explorer array (Agilent Technologies, Product Code X-HS-AC-02), containing 60-mer oligonucleotide probes, was designed to interrogate potential 3D genomic interactions. In total, 964,631 experimental probes and 2500 control probes were added to a 1 × 1 M CGH microarray slide design. The experimental probes were placed on the design in singlicate with the controls in groups of 250. The control probes consisted of six different EpiSwitch® interactions that are generated during the extraction processes and used for monitoring library quality. A further four external inline control probe designs were added to detect non-human (Arabidopsis thaliana) spikes in DNA added during the sample labelling protocol to provide a standard curve and control for labelling. The external spike DNA consists of 400 bp ssDNA fragments from genomic regions of A. thaliana. Array-based comparisons were performed as described previously, with the modification of only one sample being hybridised to each array slide in the Cy3 channel [45].

2.4. Translation of Array-Based 3D Genomic Markers to PCR Readouts

The top array-derived markers identified in our previous study were interrogated using OBD’s proprietary primer design software package to identify genomic positions suitable for a hydrolysis probe-based real-time PCR (RT-PCR) assay [46]. Briefly, the top array-derived markers associated with predictive potential to differentiate between response and non-response to ICI outcomes were filtered on the logistic regression Glmnet coefficient. PCR primer probes were ordered from Eurofins (Luxembourg) genomics as salt-free primers. The probes were designed with a 5′ FAM fluorophore, 3′ IABkFQ quencher and an additional internal ZEN quencher and ordered from iDT (Integrated DNA Technologies, Coralville, IA, USA) [54]. Each assay was optimised using a temperature gradient PCR with an annealing temperature range from 58 to 68 °C. Individual PCR assays were tested across the temperature gradient alongside negative controls including soluble and unstructured commercial TaqMan human genomic DNA controls (Life Technologies, Carslbad, CA, USA) and used a TE buffer-only negative control. Assay performance was assessed based on Cq values and reliability of detection and efficiency based on the slope of the individual amplification curves. Assays that passed the quality criteria and presented with reliable detection differences between the pooled samples associated with responders and non-responders to ICI treatment outcomes were used to screen individual patient samples.

2.5. EpiSwitch® PCR

Each patient sample was interrogated using RT-PCR in triplicate. Each reaction consisted of 50 ng of EpiSwitch® library template, 250 mM of each of the primers, 200 mM of the hydrolysis probe, and a final 1X Kapa Probe Force Universal (Roche) concentration in a final 25 mL volume. The PCR cycling and data collection were performed using a CFX96 Touch Real-Time PCR detection system (Bio-Rad, Hercule, CA, USA). The annealing temperature of each assay was changed to the optimum temperature identified in the temperature gradients performed during translation for each assay. Otherwise, the same cycling conditions were used: 98 °C for 3 min followed by 45 cycles of 95 °C for 10 s and 20 s at the identified optimum annealing temperature. The individual well Cq values were exported from the CFX manager software after baseline and threshold value checks. A total of 20 3D genomic markers that passed the translation phase were screened on 32 responder and non-responder samples as a marker reduction step based on statistical criteria to identify the top 8 discriminating markers. These markers were evaluated on 78 individual samples from the training cohort as part of the classifier model design. They were then used to screen the independent validation cohorts of 24 and 128 samples.

2.6. Genomic Mapping

The 24 3D genomic markers from the statistically filtered list with the greatest and lowest abundance scores were selected for genome mapping. Mapping was carried out using Bedtools closest function for the 3 closest protein coding loci—upstream, downstream, and within the long-range chromosome interaction (Gencode v33). All markers were visualised using the EpiSwitch® Analytical Portal.

2.7. Statistical Analysis

The 20 markers screened on 32 individual patient samples in Screens 1 and 2 were subject to permutated logistic modelling with bootstrapping for 500 data splits and non-parametric Rank Product analysis (EpiSwitch® RankProd R library). Two machine learning procedures (eXtreme Gradient Boosting: XGBoost and CatBoost) were used to further reduce the feature pool and identify the most predictive/prognostic 3D genomic markers. The resulting markers were then used to build the final classifying models using CatBoost on a 78 sample cohort. Catboost is a member of the Gradient Boosted Decision Trees machine learning ensemble techniques [55]. All analysis was performed using R statistical language with the Caret, XGBoost, SHAPforxgboost, and CatBoost libraries.

2.8. Biological Network/Pathway Analysis

Protein interaction networks and pathway enrichment were generated using the Search Tool for the Retrieval of Interacting proteins (STRING) and Reactome Pathway Browser databases [56,57,58].

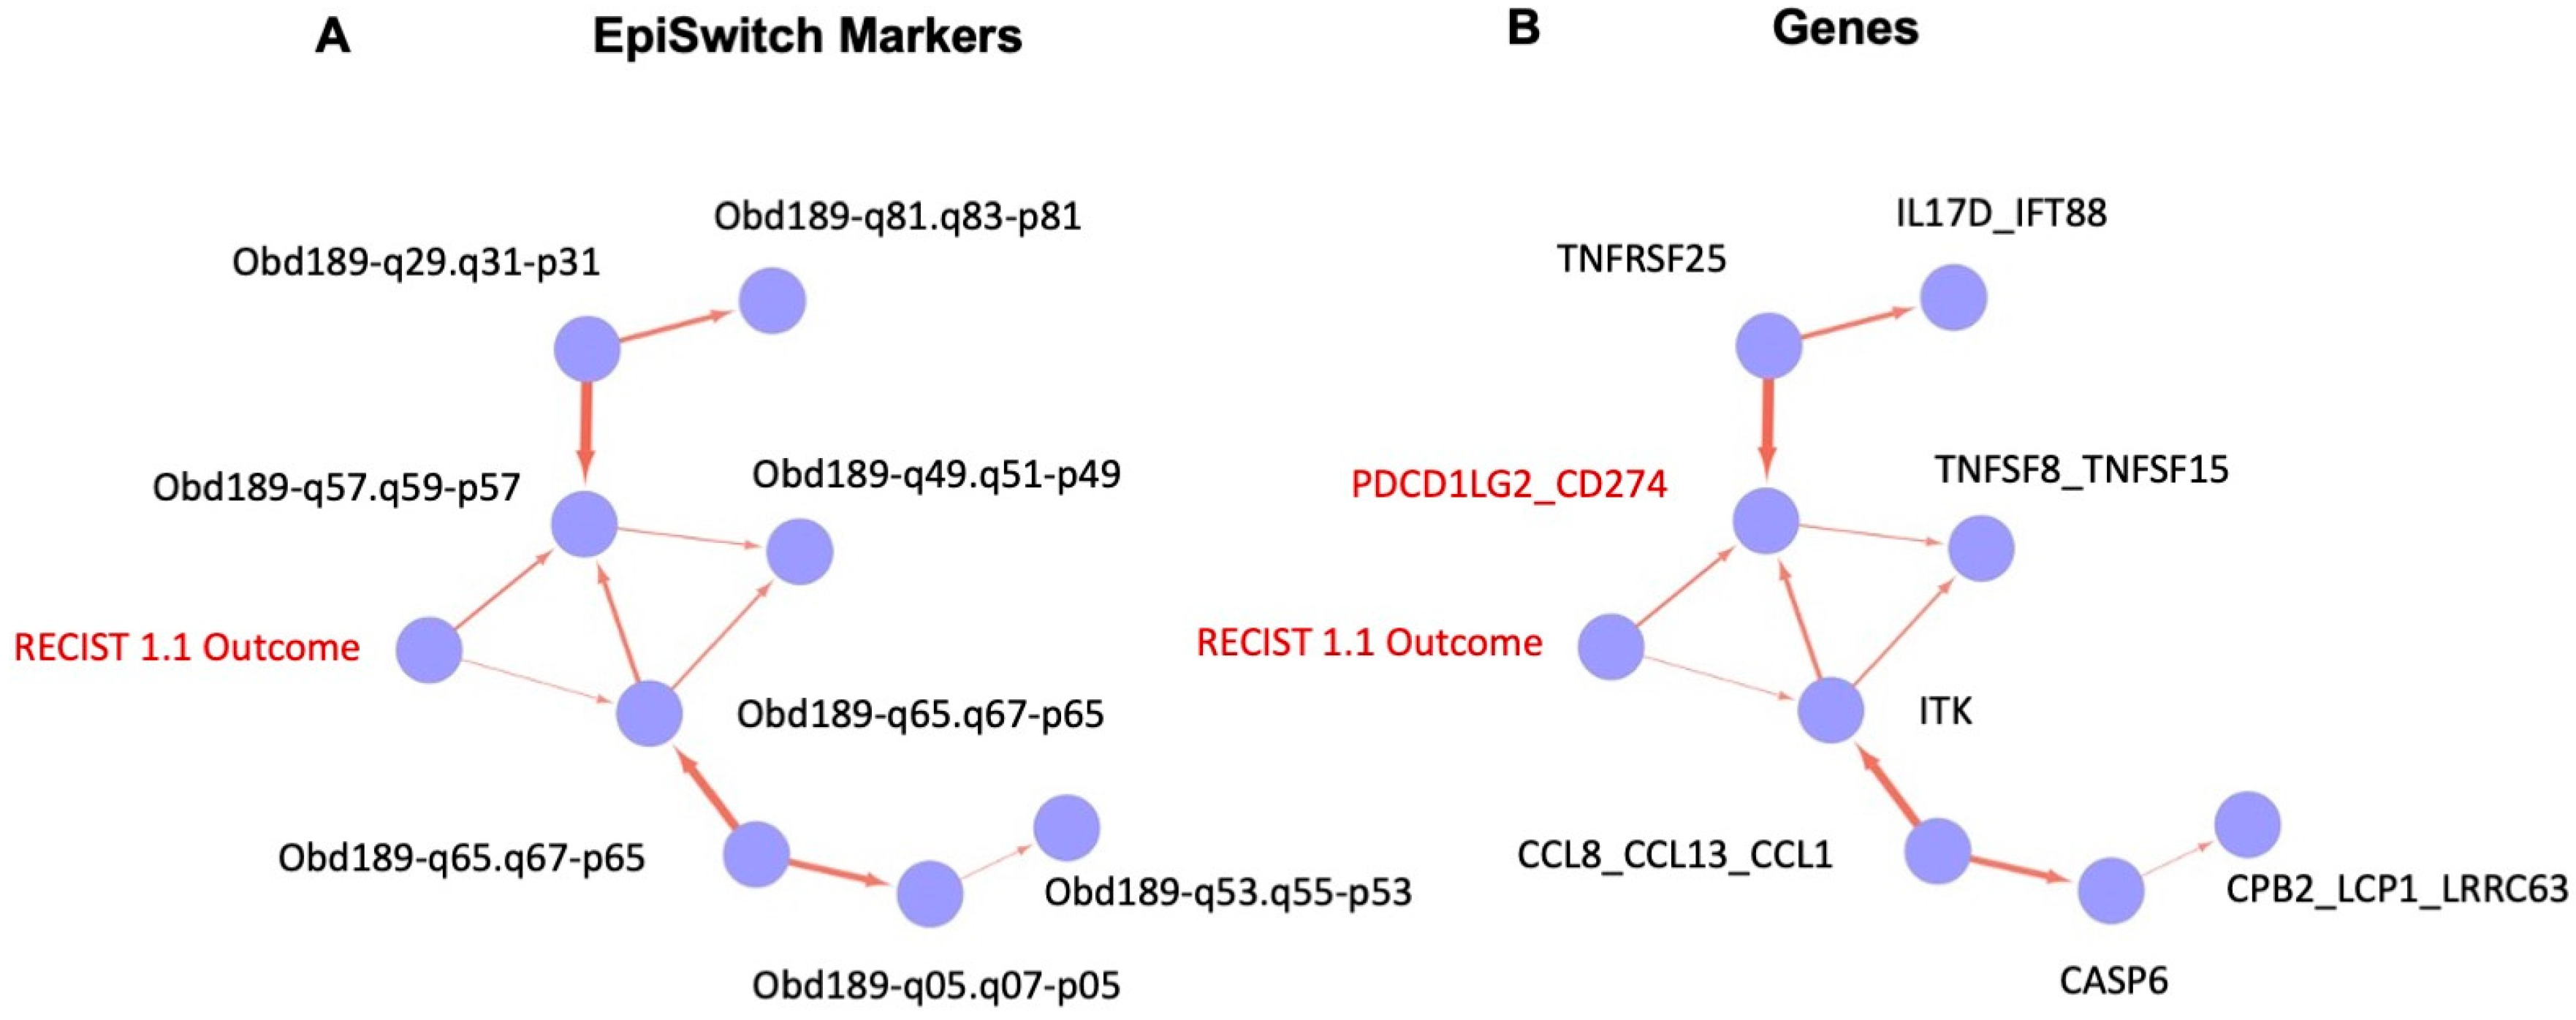
2.9. Causal Graph Analysis

The bnlearn (version 4.7.1) package in R (version 4.0.3) was used to generate Bayesian causal networks [59]. A score-based algorithm—the hill-climbing greedy search algorithm with bootstrapping (500 with 5 restarts)—was used as the basis for the Bayesian structure learning algorithm to generate weighting for the relationships found between the markers within the training set.

3. Results

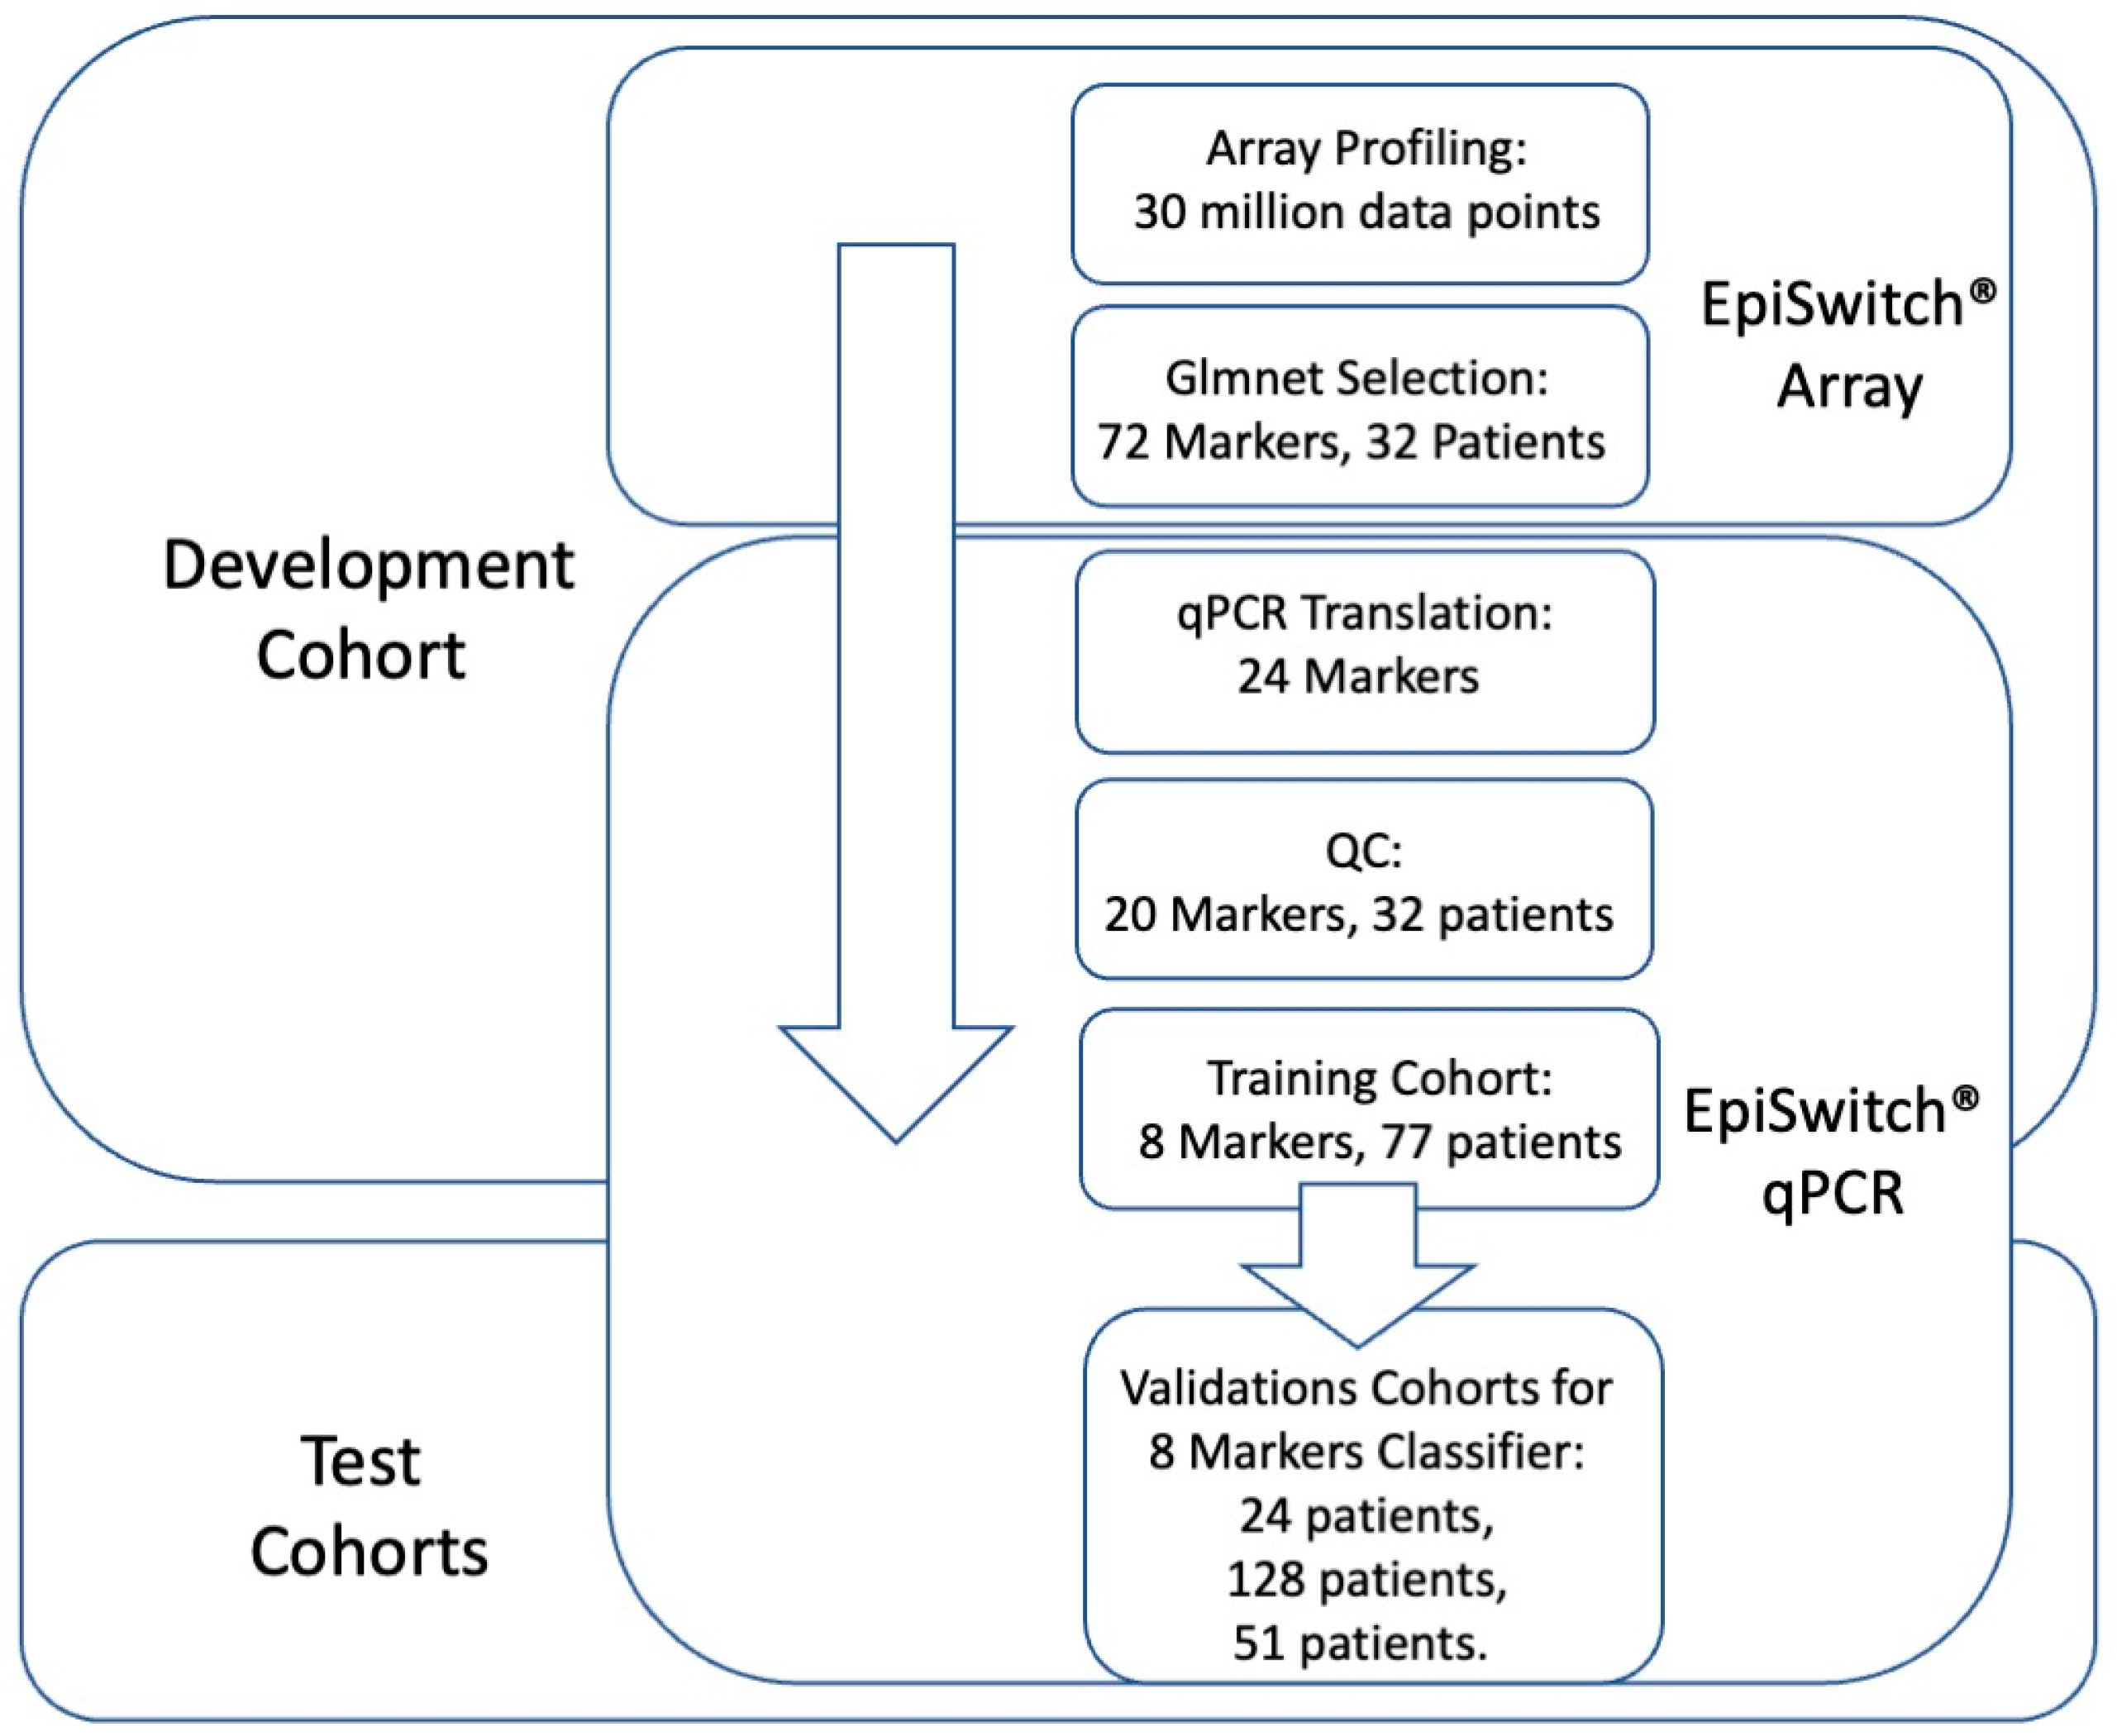
3.1. Whole Genome Array Profiling for Discovery of Predictive 3D Genomic Marker Leads in Baseline Immuno-Oncology (IO) Patients at Baseline

The EpiSwitch® array platform was used for whole genome screening and the discovery of 3D genomic biomarker leads. It has been utilised to date on over 120 IO patients, generating over 104 million individual chromosome conformation data points. We based our initial selection of marker leads on the screening results from a whole genome EpiSwitch array for 32 patients from the observational trial at Mount Miriam Cancer Hospital (MMCH). These patients were treated with either Pembrolizumab, Atezolizumab, or Durvalumab, and were diagnosed with one of the following indications: lung cancer, kidney cancer, nasopharyngeal cancer, sagittal sinus carcinoma, neuroendocrine tumour, or vulvar carcinoma. Among the responders, those patients were confirmed in the durable nature of their response and absence of acquired resistance.
From over 30 million data points, following the logistic regression Glmnet coefficient selection for baseline responders and non-responders, we identified the top 72 marker leads associated with predictive value for response and non-response to ICI (Table 1).
It is important to point out that the most significant marker in this selection was associated with CD274 and PDCD1LG2 loci, at the junction of the genes encoding for PD-L1 and PD-L2 checkpoint inhibitors. Functionally, this suggests a regulatory event associated with the predictive profile for response to ICI and leading to specific conditional differences among patients, as captured systemically through regulatory 3D genomic profiles. This is consistent with earlier observations that PD-L1 expression levels, as reflected in HIT testing, could share predictive values under specific conditions [27,28].

3.2. Identification of the Top Predictive 3D Genomic Markers for ICI Treatment Outcomes

Following the established methodology for EpiSwitch® marker reduction [42,46], we employed a stepwise approach to translate array-based marker leads from the 32 array screened patients into qPCR format in order to identify a minimal set of biomarkers for predictive stratification of ICI treatment response outcome (Figure 1).
From over 30 million data points on array profiling, the top 72 markers were used for translation into qPCR format. The design and sequencing restrictions on the primers and fluorescent probes corresponding to the array probe sites of genome long-ranged junction points have reduced 72 markers to 24 qPCR designs (denoted in Table 1). At the experimental stage of temperature gradient optimisation, 20 qPCR marker designs have passed quality control (Table 2).
All 20 markers then underwent feature reduction in several steps (Materials and Methods). Firstly, they were evaluated in qPCR format on pooled samples from 32 patients representing either responders or non-responders. These sample cohorts represented patients treated with Pembrolizumab, Atezolizumab, and Durvalumab. Based on the results, the top 13 markers were then evaluated on patient samples individually, reducing the selection to the top eight markers (Table 2).
The eight selected markers were further evaluated on the training cohort of 77 patients (Supplementary Table S1). Blood samples taken from patients prior to initiation of ICI therapy were used together with clinical assessment for response status according to RECIST 1.1 criteria. Baseline clinical characteristics were similar between responders and non-responders (Supplementary Table S1). The training cohort of 77 patients represented ICI treatments: Pembrolizumab, Atezolizumab, and Durvalumab, with cancers of the lung, pancreas, bladder, kidney, head and neck (larynx, nasopharynx, salivary gland), liver, breast, colon, meninges, and vulva.
We used these eight markers to generate the 3D genomic classifier with predictive ability for ICI response, which we then applied to the independent test cohorts.

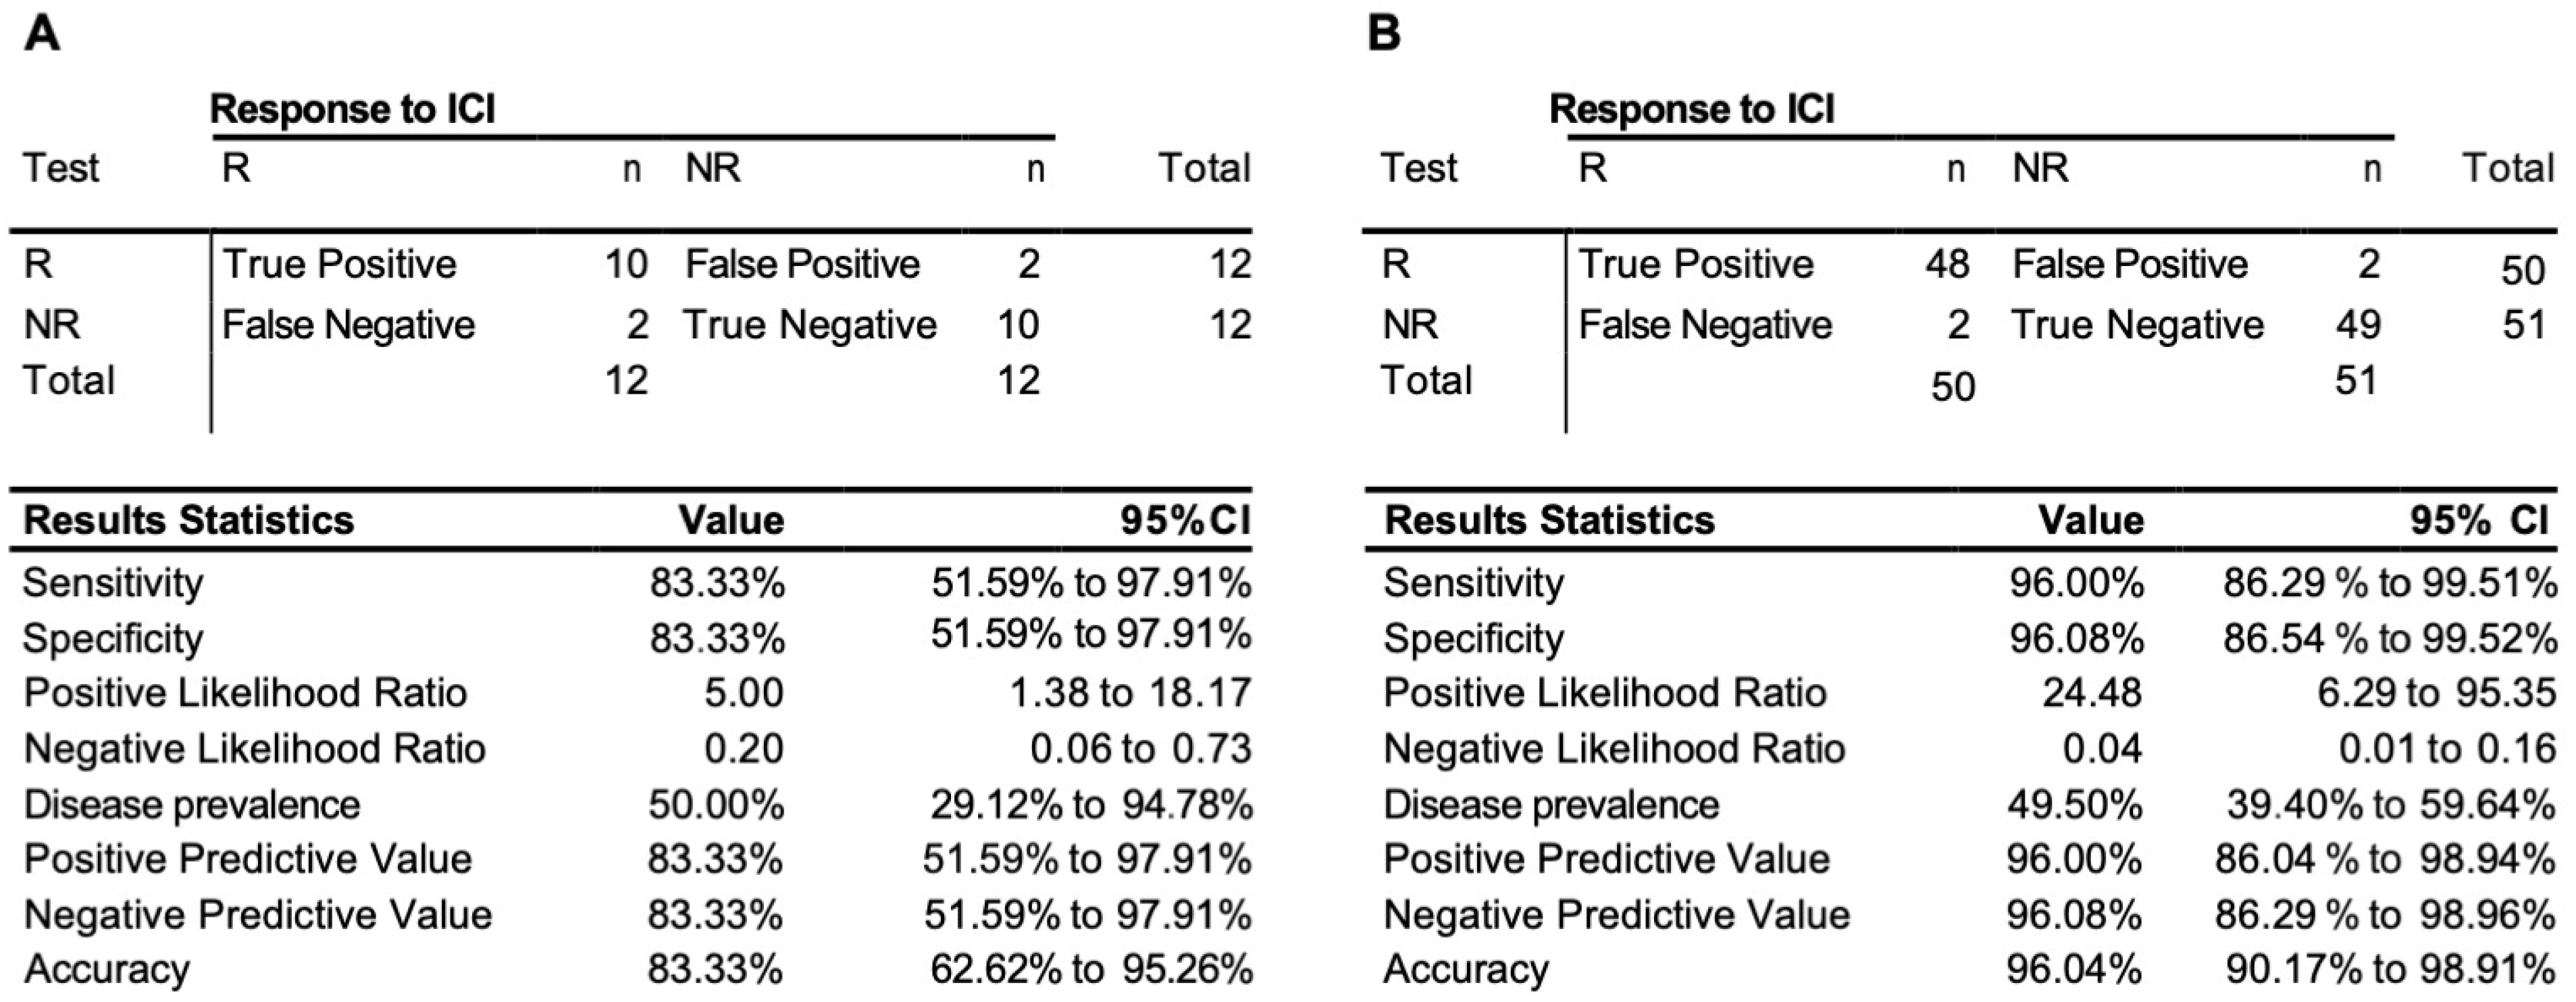
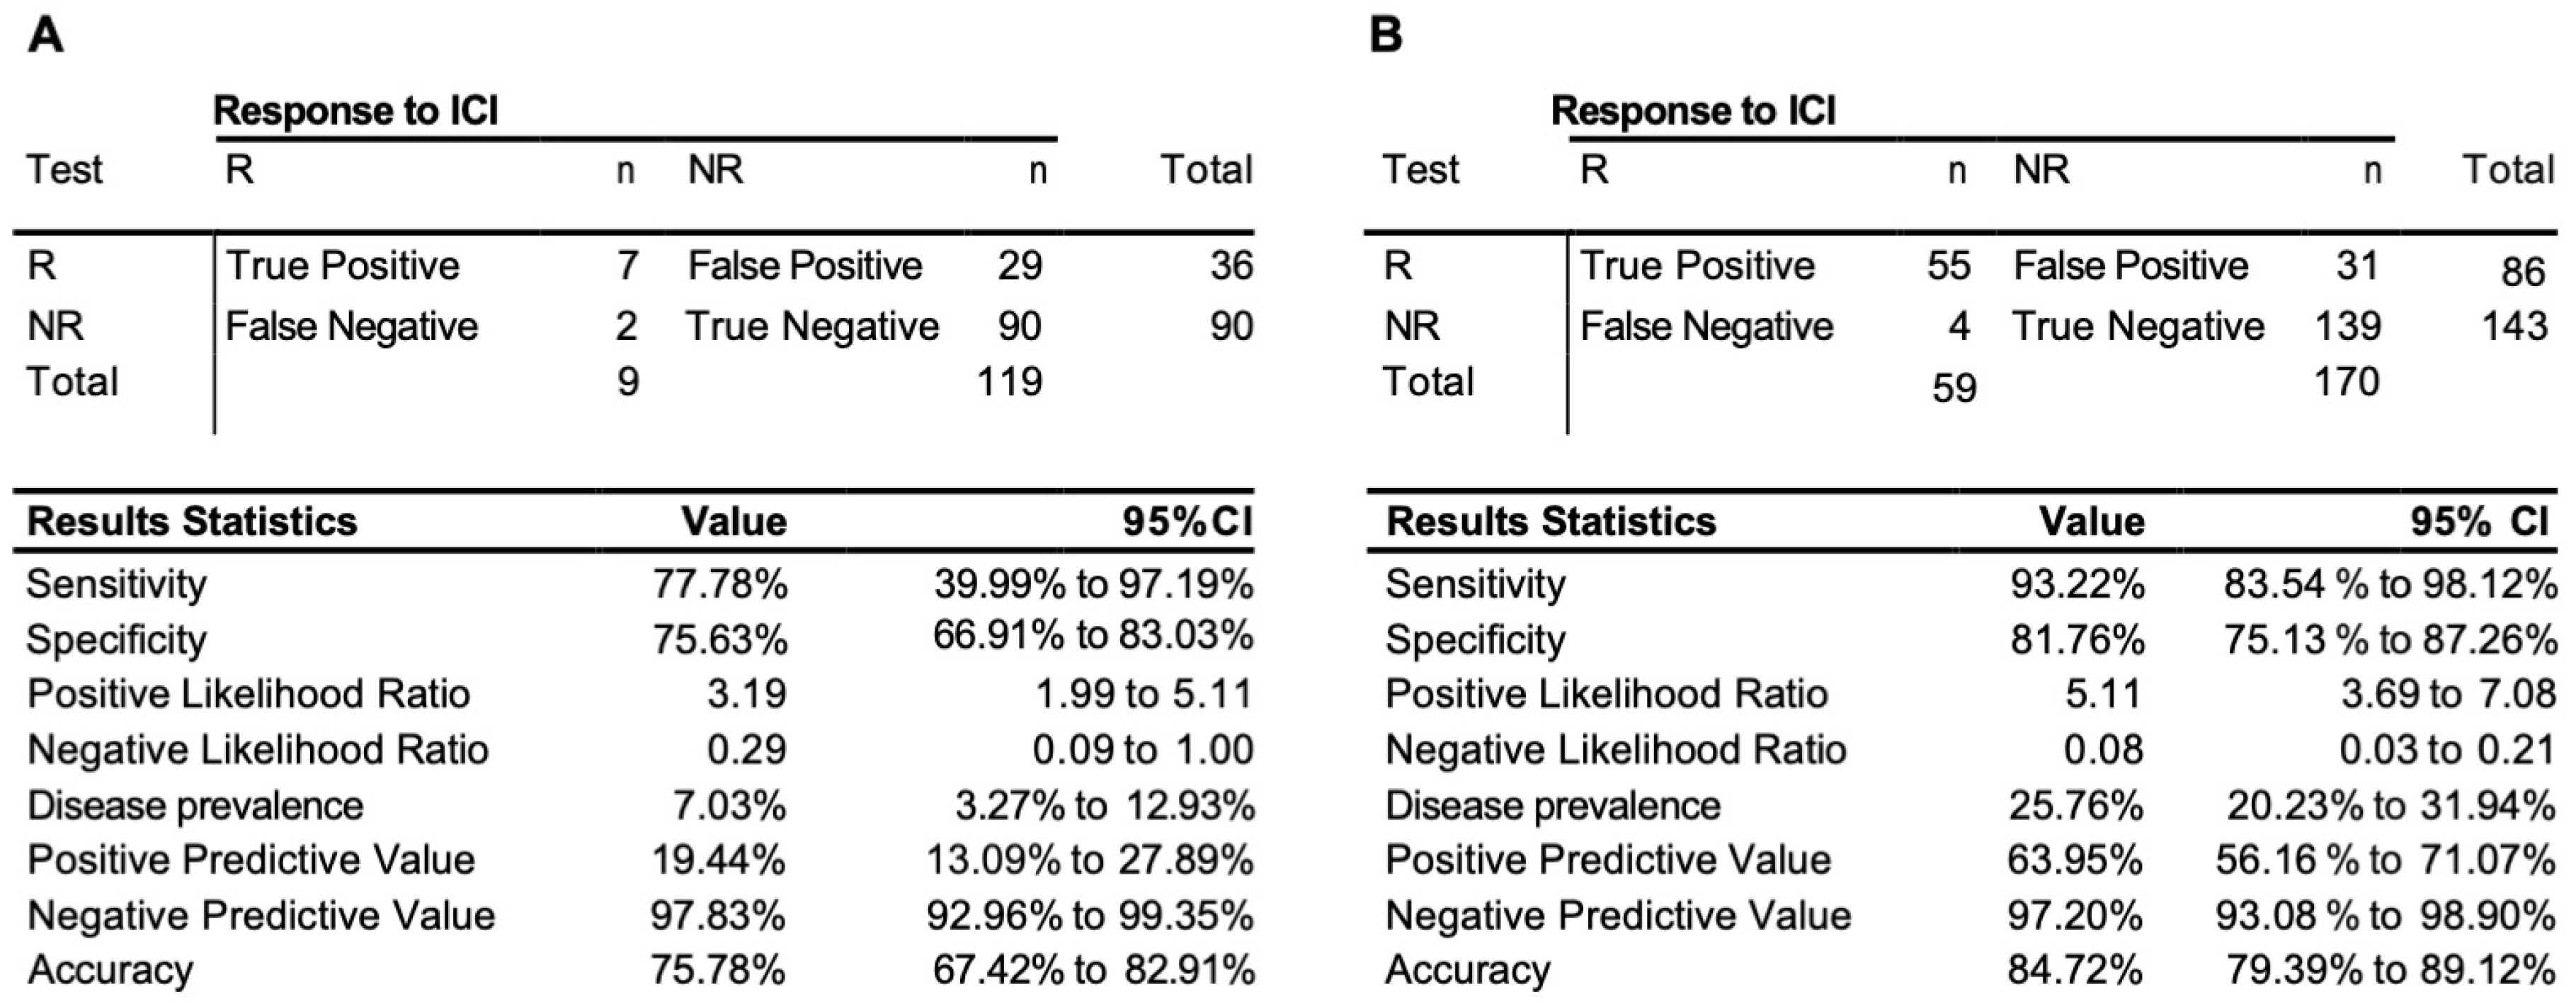
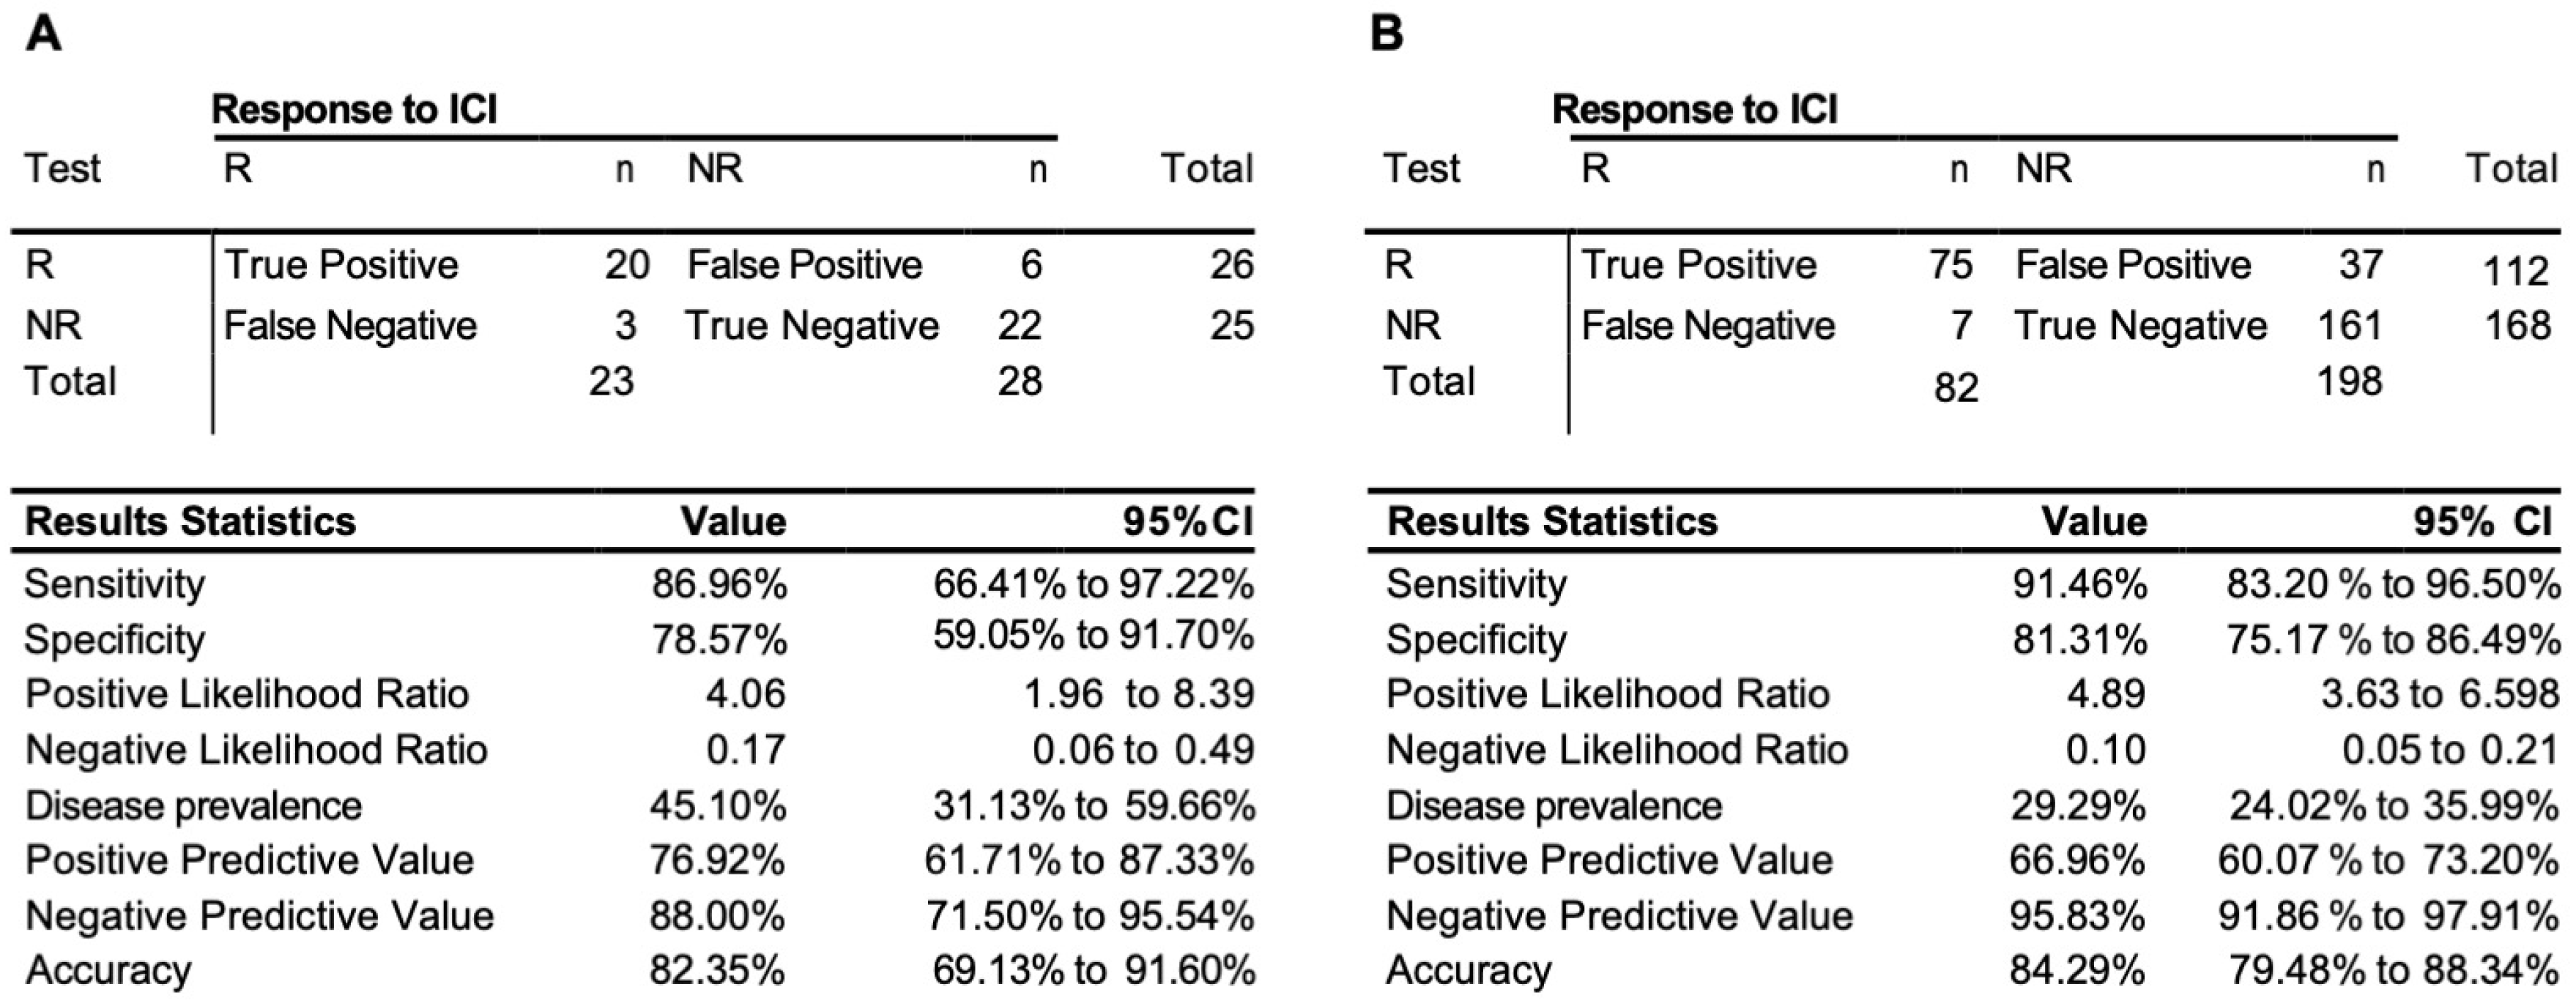
3.3. Testing of the Predictive 3D Genomic Biomarker Panel for Response to ICI Treatments on Independent Patient Cohorts

To access the predictive power of the classifier model, the eight-marker 3D genomic panel was validated on an independent baseline test cohort #1 (Supplementary Table S1). No samples from that cohort were used to rebuild or refine the model. The EpiSwitch platform readouts for the eight-marker classifier model were uploaded to the EpiSwitch Analytical Portal for analysis. Clinical outcomes for the test cohort #1 included a balanced representation of 12 responders and 8 non-responders and 3 stable diseases. It is important to mention that, from the start of the model classification design, all the stable disease cases were considered to be non-responders. EpiSwitch predictive calls based on the eight-marker model demonstrated a high performance of 83% balanced accuracy and 83% positive predictive value in the test cohort #1 (Figure 2A). Across all 101 patients used in this study in both training and testing cohorts, the test demonstrated positive predictive value of 96% and balanced accuracy of 96% (Figure 2B). The patients represented ICI treatments: Pembrolizumab, Atezolizumab, and Durvalumab, and indications including cancer of the cervix, kidney, liver, lung, neuroendocrine, meninges, and vulva.
We have further extended our validation exercise, obtaining additional 128 samples as test cohort #2 (Supplementary Table S1). This cohort was based largely on retrospective samples and represented an unbalanced group of non-responders with only nine responders among them. The EpiSwitch predictive calls based on eight-marker model demonstrated 76% accuracy, 78% sensitivity, and 76% specificity on 128 patients in the test cohort #2 (Figure 3A). Across all 229 patients used, with 170 non-responders and 59 responders in training and both testing cohorts, the test demonstrated an accuracy of 85%, sensitivity of 93%, and specificity of 82%, with a positive predictive value of 64%, and negative predictive value of 97% (Figure 3B).
The validation was lastly extended with the further collection of 51 samples exclusively from the observational trial (cohort #3, Supplementary Table S1). Unlike the retrospective collection, all the observational samples were evaluated by EpiSwitch predictive biomarkers against RECIST 1.1 response assessment preformed for the same cycle of treatment as the sample collection. The EpiSwitch predictive calls based on the eight-marker model demonstrated 87% sensitivity, 82% balanced accuracy, and 77% positive predictive value of the test cohort #3 (Figure 4A). Across all 280 samples used in this study, the test demonstrated a sensitivity of 91%, positive predictive value of 67%, and balanced accuracy of 84% (Figure 4B).
Altogether, the combined cohort of patients used in this study represented treatments with anti-PD-1 or anti-PD-L1 ICI therapies, including: Pembrolizumab, Atezolizumab, Durvalumab, and Nivolumab in a variety of indications including cancer of: pancreas, soft tissue (alveolar soft part sarcoma), bile duct (cholangiocarcinoma), bladder, cervix, vulva, kidney, head and neck (larynx, parotid gland (mucoepidermoid carcinoma), nasopharynx, oral cavity and maxilla) colon, liver, breast, lung (adenocarcinoma, small cell carcinoma, squamous cell carcinoma), lymphoepithelial carcinoma, prostate, stomach, high-grade neuroendocrine tumour, melanoma, meninges, and brain.

4. Discussion

Cancer treatment has been revolutionised by the development of therapies that target the immune checkpoint response [3]. However, only a minority of patients ultimately benefit from ICI therapies today. It is well recognised that there is a high prevalence of immune-related adverse events accompanying ICI treatments. Both clinical decisions and evaluation of the risk–benefit ratio would greatly benefit from the development of molecular biomarkers to predict the clinical response to therapy.
Here, we used a 3D genomics biomarker approach, which has demonstrated successful development of valuable prognostic and predictive biomarkers in oncology and autoimmune conditions [38,42,50]. We have identified eight systemic 3D genomic biomarkers that, when assessed as a molecular classifier in blood samples from a diverse group of baseline patients treated with anti-PD-(L)1 ICIs, gave an early readout of likely response or non-response to ICI therapies prior to treatment initiation.
Additionally, we have followed a subset of patients longitudinally and demonstrated that the same test re-affirms a patient’s likely response or non-response to therapy even while they are in the middle of their therapy course. Importantly, as a reflection of the network regulation, the identified 3D genomic markers are associated with genes related to the regulation of the immune system (Figure 5). This is consistent with the concept that ICI therapies exert their therapeutic effects on tumour cells by enhancing the cell-mediated immune response [3].
The captured 3D genomic differences observed between responder and non-responder baseline patients also identified 3D biomarkers corresponding to genetic loci and pathways (Figure 6) including NF-kB and TGF-b, whose biological functions are related to checkpoint response [60,61,62].
The top 3D genomic markers identified by the EpiSwitch Explorer Array profile as associated at baseline with response/non-response to ICI treatment were also analysed using the Search Tool for Retrieval of Interacting Genes (STRING) database. The view from the established protein–protein networks confirmed that the coding regions associated with the top 24 EpiSwitch marker leads are highly connected (Figure 7). In fact, no additional nodes were added to generate the network based on these 24 EpiSwitch marker leads. This is consistent with the regulatory network formed by the 3D genome architecture, as an integrator of molecular multi-omics mechanisms [30] and being concordant with controls of the protein expression and cellular phenotype.
Among other interesting observations is the high prevalence of the validated 3D marker OBD189_q057_q059 responsible for conditional regulatory long-range interactions in the region spanning CD274 (PD-L1) and PDCD1LG2 (PD-L2) (Figure 5). In fact, this systemic predictive marker has been consistently observed across multiple cohorts of IO patients, indicating that the complex network regulation manifestly shares predictive value both at the systemic 3D genomic level and at the level of PD-L1 gene expression in established IHC testing [3]. The EpiSwitch Portal view of this marker (Figure 8) identifies variable allelic frequency SNPs and the affected transcriptional factor (TF) binding motifs around the marker anchor sites. Three TFs were identified at the proximal anchor site of the marker: NFIC, ZEB1, MZF1. Analysis of the GeneHancer repository (GeneCards) shows evidence of enhancer controls (Gene association score) over CD274 (PD-L1) for the distal anchor site of the same marker. Altogether, this strongly suggests that the regulatory effect of the EpiSwitch marker over the PD-L1 locus is executed through coordinated activities of the CD274 enhancer and ZEB1 TF activities.
Finally, we deployed causal graphs, also known as Bayesian causal networks, to evaluate the relationship between the markers and other variables within the training set of the data. Such analysis is based on graphical models where nodes represent random variables and arrows represent probabilistic dependencies between them [64]. The graphical structure of a Bayesian network is a directed acyclic graph, of nodes (or vertexes) and arcs (or edges). The graph defines a factorisation of the global probability distribution, into a set of local probability distributions, one for each variable.
Analysis of the training data set showed the causal relationships, based on probabilistic relationships, between all the final EpiSwitch markers selected into the signature for the classifier model, starting from the clinical outcome of RECIST 1.1 assessment for IO treatment response (Figure 9A, RECIST 1.1 outcome). Translating the causal graph from the identities of the 3D Genomic EpiSwitch markers to the identities of the genes (Figure 9B) affected by those markers at the level of 3D genomic organisation reveals a close causal relationship between the RECIST 1.1 clinical outcome and changes in the regulatory architecture of the PD-L1 (CD274) locus, presumably contributing as a result to complex changes of its expression pattern as well. As mentioned earlier, our data suggested that the systemic 3D genomic regulatory profiles at the PD-L1 (CD274) locus shared their predictive values with threshold changes in PD-L1 gene expression from the established IHC PD-L1 testing [3].
Altogether, our data show that the predictive model developed in this study has high biological relevance and is anchored on the baseline presence of a prevalent systemic 3D genomic profile, itself functionally linked to immuno-genetic settings conducive to the clinical outcome of response to PD-(L)1 blockade. The systemic nature of the observed marker profile is not surprising since the 3D genomic approach described here was done on whole blood samples, with dominant lymphocytic representation. The fact that some T-cell-related loci were found to bear conditional regulatory differences in 3D genome architecture, in association with clinical phenotypes of responder/non-responder profiles, is a fascinating regulatory phenomenon. It is consistent with multiple observations of the role 3D genome architecture plays in regulation of oncological phenotype and clinical outcomes [30].
A simple blood-based assay that provides a readout of likely response to PD-(L)1 ICI therapy could be a valuable asset for oncologists considering ICI therapy, since only a minority of patients experience durable tumour responses. For example, ORR for metastatic NSCLC is 24% and 16%, for treatment-naïve and previously treated patients, respectively [65]. A positive PD-L1 expression result from an immunohistochemistry test, which increases ORR to 39.7% (PD-L1 50% or greater) [65]. Many of the remaining patients derive no clinical benefit, suffering significant drug-related adverse events (~14%) or even death from pulmonary toxicity (>1%) [66]. Moreover, approximately 15% of non-responders may also be at risk of hyper-progressive disease, accelerated by ICI therapy and shortening their lives by months [67]. Today, despite a low response rate, many patients are prescribed ICI therapies at a substantial financial cost to both payers and patients [68]. Altogether, these aspects highlight the importance of a response predictive assay to improve patient selection for optimised treatment, better overall treatment-decision planning, potential utilisation of alternative effective treatments, avoiding futile care and unnecessarily toxicity, and efficiently managing costs and resources [68].
This study has been exclusively focused on systemic readouts based on liquid biopsy, rather than exclusively on the solid tumour itself. Therefore, relative to predictive features for the response to immune checkpoint inhibitors, these treatments act by systemically releasing the brakes of the immune system and at the same time resetting it, all within the context of the dynamic immune exchanges between the tumour and the host. The validity of the liquid biopsy approach with 3D genomic biomarkers was initially demonstrated in the development and validation of systemic EpiSwitch biomarkers for response to Avelumab in a NSCLC cohort of 99 patients from the Javelin Solid Tumor trial NCT01772004, in collaboration with the Pfizer-EMD Serono consortium and the Mayo Clinic [50]. In that study, the systemic readout with the EpiSwitch 3D genomic profile far exceeded the predictive powers of the IHC PD-L1 expression in the tumour biopsy. Recently, the systemic EpiSwitch approach has also been validated on a cohort of 384 metastatic urothelial cancer patients tin a 2-arm study, from the Pfizer JAVELIN Bladder 100 trial NCT02603432 [69]. In that study, an EpiSwitch systemic biomarker associated with regulation of the POU2F2 locus provided highly significant binary baseline calls for benefit from treatment with Avelumab in combination with best supportive care (BSC) against the control arm of BSC alone, demonstrating a Hazard Ratio of 0.44. The systemic biomarker approach therefore significantly improved the TMB predictive classification.
Interestingly, from a broader perspective, EpiSwitch prognostic systemic biomarkers in DLBCL patients also turned out to be more informative than the punch biopsy based gene profiles classification models looking at the cell or origin distinctions (Fluidigm), particularly for Type III patient sub-type [42].
Even with such results, it might still be difficult to conceptualise how systemic 3D profiling can relate ICI sensitivity to the relevant aspects of the immune microenvironment in the tumour tissue, specifically the impact of tumour burden and various mutations which may contribute to the individual patient outcome. Important insights into the complex relationships between systemic and localised deregulations at the level of 3D genomic architecture comes from the latest breakthroughs into the understanding of mechanisms behind systemic epigenetic synchronisation; from horizontal transfer of secretory microRNA in cancer [70], to cancer exosomes promoting tumorigenesis [71], to characterisation of cross-tissue genetic-epigenetic synchronisation effects [72]. It has been noted that almost half of the epigenetic bandwidth reflects tissue-specific patterns while the other half reflects systemic synchronised patterns, indicating molecular pathological dysregulation from the distant sites of origin, including even on the other side of the brain barrier [72].
One of the most relevant studies has demonstrated that two independent methodologies of exposure to exosome signalling from prostate cancer cells leads to changes in 3D genomic profiles of the monocytes, consistent with the clinical biomarkers already identified in prostate cancer patients [44,51,73].
Exosome traffic, or in its broader definition—the traffic of extracellular vesicles (EV), is a high-density flow (up to 1010 per mL of blood) of endosomal representations from multiple cells of origin in the body, loaded with selective protein content (including PD-1 and PD-L1), metabolites, and non-coding RNAs—all of which could potentially act as epigenetic regulators in the recipient effector cells (Figure 10). Here, the exosome traffic has been clearly observed to switch regulatory 3D architecture towards a cell of origin profile on a subset of genomic loci [73,74,75]. Such changes in 3D architecture of the genome are highly informative of the primary site conditions. Moreover, they have been shown to take place as similar stable binary changes both in cell–cell and cell–conditioned media settings. Together, this has provided the first insights into a mechanistic explanation of the concordance observed between individual 3D genomic switches detected in the blood of patients and within their primary tumours [73].
The current study represents a proof of concept that 3D genomic changes, measurable in blood, can be used as biomarkers of response prediction to PD-(L)1 ICIs in oncology. In this study, all patients underwent ICI treatment, with no comparator arm undergoing control treatment or basic standard of care. The single-arm design of this study does not allow us to definitively differentiate between predictive and prognostic values of the classifier. Extension of this work to a larger number of advanced patients with different ICI therapies and with a comparator treatment arm could help further validate the predictive value of the developed EpiSwitch ICI biomarker classifier.
The endpoint of the model developed is whether an individual patient, rather than just a localised neoplasm, will respond to checkpoint inhibition. This is an assessment of the whole biological system, capturing the dynamic between the systemic host responses and profile of the specific features of the tumour mass itself. The analyte we measure, a present or absent conditional chromosome conformation has certain benefit over existing continuous data modalities (RNA and protein expression levels, DNA methylation, IHC etc.), due to it being a binary marker at its root. There is similarity through its binary nature with classic genetic risk markers like SNPs. However, a SNP represents a single point of change in 3.2 billion full genomic length, with the potential for four base differences. Such features significantly reduce the effect size for SNPs as a biomarker modality. One requires a high number of input samples in order to identify any significant SNPs of interest. The conditional chromosome conformations are also binary, they establish themselves over an extensive footprint of anchor site sequences and demonstrate lasting stability, featuring a high effect size as biomarkers. Importantly, the high effect size helps to reduce the bias potential when using mid-sized heterogenic populations.
Currently, further collections and monitoring of IO responses by RECIST 1.1 and by the identified EpiSwitch predictive biomarkers have been expanded to over five hospital sites and clinical practices, from Malaysia to the US. Real life data on predictive stratifications for IO patients will further evaluate the established classification model. A pan-therapy application of the test with response prediction across tumour types with historically low ORRs could help to improve both patient outcomes and increase the cost effectiveness of cancer care [76,77].

5. Conclusions

With the rapid advancement of novel therapies targeting the immune checkpoint pathway, there is a pressing need to develop better biomarkers to assess likely clinical response in advance of therapeutic intervention. Here, we report on a novel 3D genomics approach to identify predictive blood-based markers that can identify, with high accuracy, individuals that are likely to respond to PD-(L)1 ICIs monotherapy, especially across tumour types with low ORRs. The 3D genomics approach described here has been developed into a clinical assay to assist in treatment decisions, help improve patient selection for optimised treatment, help better utilise alternative effective treatments, minimise or avoid unnecessarily toxicity, and efficiently manage costs and resources.

Supplementary Materials

The following supporting information can be downloaded at: https://www.mdpi.com/article/10.3390/cancers15102696/s1, Table S1: Clinical annotations and classification calls for patient samples used in this study.

Author Contributions

E.H. and A.A. conceived the study, S.N., C.R.L., C.S.K., A.T.S., R.R., H.K.F. and F.L.W.L. assisted with study design and clinical samples collection. A.D., M.S. and E.H. assisted with EpiSwitch® array design. M.S. assisted with design of experiments. J.G. and A.A. planned and reviewed experiments. T.N. and E.H. analysed the data. R.P., A.D., M.E.C., A.G. and M.I. performed experiments. H.A., D.P., T.G., R.H.J. and J.L. helped with interpretation of the data and writing of the manuscript. A.A., E.H., D.B. and T.G. wrote and reviewed the manuscript. All authors have read and agreed to the published version of the manuscript.

Funding

This work is part of the program funded by Oxford BioDynamics Plc and by the award “Development and validation of baseline blood-based epigenetic biomarkers for predicting non-responders to ICB monotherapies” by PACT, FNIH, USA (2021-PACT001).

Institutional Review Board Statement

The observational study at Mount Miriam Cancer Hospital, Penang, Malaysia was approved -9 February 2021 by the Medical Research and Ethics Committee, Ministry of Health (NMRR-18-183-40087, NMRR-19-60-46027). The study was conducted in accordance with Good Clinical Practice guidelines and the Declaration of Helsinki.

Informed Consent Statement

All participants signed informed consent forms prior to providing blood samples. All data were anonymised.

Data Availability Statement

The datasets used and analysed during the current study are available from the corresponding author on reasonable request.

Acknowledgments

The authors would like to thank Jane Mellor, University of Oxford, for helpful discussions; past and present members of OBD Mehrnoush Dezfouli, Christina Koutsothanasi, Adam Wilson, Franisco C. Santos, Jurjen W. Westra, Benedict Egan, Matthew Parnall, Morgan Thacker, Marella Curvas, Louis James, Thomas Lavin, Catriona Williams, Aemilia Katzinski, Paulina Braier, Pieter Harvey, and Kalsoom Rana for their operational support, Olly Hunter for assistance in data analysis. In addition, we acknowledge Agilent Technologies, Inc. for supply of EpiSwitch® designed CGH microarray slides.

Conflicts of Interest

E.H., M.S., R.P., A.D. and A.A. are full-time employees at Oxford BioDynamics plc. A.A. is a company director. The remaining authors have no conflict of interest. The company had no role in the design of the study; in the collection, analyses, or interpretation of data; in the writing of the manuscript; or in the decision to publish the results.

References

  1. Pardoll, D.M. The blockade of immune checkpoints in cancer immunotherapy. Nat. Rev. Cancer 2012, 12, 252–264. [Google Scholar] [CrossRef] [PubMed]
  2. Wykes, M.N.; Lewin, S.R. Immune checkpoint blockade in infectious diseases. Nat. Rev. Immunol. 2018, 18, 91–104. [Google Scholar] [CrossRef] [PubMed]
  3. Morad, G.; Helmink, B.A.; Sharma, P.; Wargo, J.A. Hallmarks of response, resistance, and toxicity to immune checkpoint blockade. Cell 2021, 184, 5309–5337. [Google Scholar] [CrossRef] [PubMed]
  4. Doyle, A.M.; Mullen, A.C.; Villarino, A.V.; Hutchins, A.S.; High, F.A.; Lee, H.W. Induction of Cytotoxic T Lymphocyte Antigen 4 (Ctla-4) Restricts Clonal Expansion of Helper T Cells. J. Exp. Med. 2001, 194, 893–902. [Google Scholar] [CrossRef] [PubMed]
  5. Wing, K.; Onishi, Y.; Prieto-Martin, P.; Yamaguchi, T.; Miyara, M.; Fehervari, Z.; Nomura, T.; Sakaguchi, S. CTLA-4 control over Foxp3+ regulatory T cell function. Sci. N. Y. 2008, 322, 271–275. [Google Scholar] [CrossRef]
  6. O’Day, S.J.; Maio, M.; Chiarion-Sileni, V.; Gajewski, T.F.; Pehamberger, H.; Bondarenko, I.N.; Queirolo, P.; Lundgren, L.; Mikhailov, S.; Roman, L.; et al. Efficacy and safety of ipilimumab monotherapy in patients with pretreated advanced melanoma: A multicenter single-arm phase II study. Ann. Oncol. 2010, 21, 1712–1717. [Google Scholar] [CrossRef]
  7. Leach, D.R.; Krummel, M.F.; Allison, J.P. Enhancement of Antitumor Immunity by CTLA-4 Blockade. Science 1996, 271, 1734–1736. [Google Scholar] [CrossRef]
  8. Tivol, E.A.; Borriello, F.; Schweitzer, A.N.; Lynch, W.P.; Bluestone, J.A.; Sharpe, A.H. Loss of CTLA-4 leads to massive lymphoproliferation and fatal multiorgan tissue destruction, revealing a critical negative regulatory role of CTLA-4. Immunity 1995, 3, 541–547. [Google Scholar] [CrossRef]
  9. Hodi, F.S.; O’Day, S.J.; McDermott, D.F.; Weber, R.W.; Sosman, J.A.; Haanen, J.B.; Gonzales, R.; Robert, C.; Schadendorf, D.; Hassel, J.C.; et al. Improved Survival with Ipilimumab in Patients with Metastatic Melanoma. N. Engl. J. Med. 2010, 363, 711–723. [Google Scholar] [CrossRef]
  10. Brahmer, J.; Reckamp, K.L.; Baas, P.; Crinò, L.; Eberhardt, W.E.E.; Poddubskaya, E.; Antonia, S.; Pluzanski, A.; Vokes, E.E.; Holdago, E.; et al. Nivolumab versus Docetaxel in Advanced Squamous-Cell Non–Small-Cell Lung Cancer. N. Engl. J. Med. 2015, 373, 123–135. [Google Scholar] [CrossRef]
  11. Robert, C.; Long, G.V.; Brady, B.; Dutriaux, C.; Maio, M.; Mortier, L.; Hassel, J.C.; Rutkowski, P.; McNeil, C.; Kalinka-Warocha, E.; et al. Nivolumab in Previously Untreated Melanoma without BRAF Mutation. N. Engl. J. Med. 2015, 372, 320–330. [Google Scholar] [CrossRef] [PubMed]
  12. Garon, E.B.; Rizvi, N.A.; Hui, R.; Leighl, N.; Balmanoukian, A.S.; Eder, J.P.; Patnaik, A.; Aggarwal, C.; Gubens, M.; Horn, L.; et al. Pembrolizumab for the Treatment of Non–Small-Cell Lung Cancer. N. Engl. J. Med. 2015, 372, 2018–2028. [Google Scholar] [CrossRef] [PubMed]
  13. Patnaik, A.; Kang, S.P.; Rasco, D.; Papadopoulos, K.P.; Elassaiss-Schaap, J.; Beeram, M.; Drengler, R.; Chen, C.; Smith, L.; Espino, G.; et al. Phase I Study of Pembrolizumab (MK-3475; Anti–PD-1 Monoclonal Antibody) in Patients with Advanced Solid Tumors. Clin. Cancer Res. 2015, 21, 4286–4293. [Google Scholar] [CrossRef]
  14. Topalian, S.L.; Sznol, M.; McDermott, D.F.; Kluger, H.M.; Carvajal, R.D.; Sharfman, W.H.; Brahmer, J.R.; Lawrence, D.P.; Atkins, M.B.; Powderly, J.D.; et al. Survival, Durable Tumor Remission, and Long-Term Safety in Patients With Advanced Melanoma Receiving Nivolumab. J. Clin. Oncol. 2014, 32, 1020–1030. [Google Scholar] [CrossRef] [PubMed]
  15. Iwata, H.; Inoue, K.; Kaneko, K.; Ito, Y.; Tsugawa, K.; Hasegawa, A.; Nakagawa, S.; Kuratomi, H.; Tamura, K. Subgroup analysis of Japanese patients in a Phase 3 study of atezolizumab in advanced triple-negative breast cancer (IMpassion130). Jpn. J. Clin. Oncol. 2019, 49, 1083–1091. [Google Scholar] [CrossRef]
  16. Kaufman, H.L.; Russell, J.S.; Hamid, O.; Bhatia, S.; Terheyden, P.; D’Angelo, S.P.; Shih, K.C.; Lebbe, C.; Milella, M.; Brownell, I.; et al. Updated efficacy of avelumab in patients with previously treated metastatic Merkel cell carcinoma after ≥1 year of follow-up: JAVELIN Merkel 200, a phase 2 clinical trial. J. Immunother. Cancer 2018, 6, 7. [Google Scholar] [CrossRef]
  17. Powles, T.; Durán, I.; Heijden, M.S.; van der Loriot, Y.; Vogelzang, N.J.; Giorgi, U.D.; OUdard, S.; Retz, M.M.; Castellano, D.; Bamias, A.; et al. Atezolizumab versus chemotherapy in patients with platinum-treated locally advanced or metastatic urothelial carcinoma (IMvigor211): A multicentre, open-label, phase 3 randomised controlled trial. Lancet 2018, 391, 748–757. [Google Scholar] [CrossRef]
  18. Rittmeyer, A.; Barlesi, F.; Waterkamp, D.; Park, K.; Ciardiello, F.; von Pawel, J.; Gadgeel, S.M.; Hida, T.; Kowalski, D.M.; Dols, M.C.; et al. Atezolizumab versus docetaxel in patients with previously treated non-small-cell lung cancer (OAK): A phase 3, open-label, multicentre randomised controlled trial. Lancet 2017, 389, 255–265. [Google Scholar] [CrossRef]
  19. Ribas, A.; Hamid, O.; Daud, A.; Hodi, F.S.; Wolchok, J.D.; Kefford, R.; Joshua, M.A.; Patnaik, A.; Hwu, W.J.; Weber, J.S.; et al. Association of Pembrolizumab With Tumor Response and Survival among Patients With Advanced Melanoma. JAMA 2016, 315, 1600–1609. [Google Scholar] [CrossRef]
  20. Patel, M.R.; Ellerton, J.; Infante, J.R.; Agrawal, M.; Gordon, M.; Aljumaily, R.; Britten, C.D.; Dirix, L.; Lee, K.W.; Taylor, M.; et al. Avelumab in metastatic urothelial carcinoma after platinum failure (JAVELIN Solid Tumor): Pooled results from two expansion cohorts of an open-label, phase 1 trial. Lancet Oncol. 2018, 19, 51–64. [Google Scholar] [CrossRef]
  21. Snyder, A.; Makarov, V.; Merghoub, T.; Yuan, J.; Zaretsky, J.M.; Desrichard, A.; Walsh, L.A.; Postow, M.A.; Wong, P.; Ho, T.S.; et al. Genetic basis for clinical response to CTLA-4 blockade in melanoma. N. Engl. J. Med. 2014, 371, 2189–2199. [Google Scholar] [CrossRef] [PubMed]
  22. Rizvi, N.A.; Hellmann, M.D.; Snyder, A.; Kvistborg, P.; Makarov, V.; Havel, J.J.; Lee, W.; Yuan, J.; Wong, P.; Ho, T.S.; et al. Mutational landscape determines sensitivity to PD-1 blockade in non–small cell lung cancer. Science 2015, 348, 124–128. [Google Scholar] [CrossRef] [PubMed]
  23. Le, D.T.; Durham, J.N.; Smith, K.N.; Wang, H.; Bartlett, B.R.; Aulakh, L.K.; Lu, S.; Kemberling, H.; Wilt, C.; Luber, B.S.; et al. Mismatch repair deficiency predicts response of solid tumors to PD-1 blockade. Science 2017, 357, 409–413. [Google Scholar] [CrossRef] [PubMed]
  24. Riaz, N.; Havel, J.J.; Makarov, V.; Desrichard, A.; Urba, W.J.; Sims, J.S.; Hodi, F.S.; Martin-Algarra, S.; Mandal, R.; Sharfman, W.H.; et al. Tumor and Microenvironment Evolution during Immunotherapy with Nivolumab. Cell 2017, 171, 934–949.e16. [Google Scholar] [CrossRef] [PubMed]
  25. Tumeh, P.C.; Harview, C.L.; Yearley, J.H.; Shintaku, I.P.; Taylor, E.J.M.; Robert, L.; Chmielowski, B.; Spasic, M.; Henry, G.; Ciobanu, V.; et al. PD-1 blockade induces responses by inhibiting adaptive immune resistance. Nature 2014, 515, 568–571. [Google Scholar] [CrossRef]
  26. Hendry, S.; Salgado, R.; Gevaert, T.; Russell, P.A.; John, T.; Thapa, B.; Christie, M.; van de Vijver, K.; Estrada, M.V.; Gonzales-Ericsson, P.I.; et al. Assessing Tumor-Infiltrating Lymphocytes in Solid Tumors: A Practical Review for Pathologists and Proposal for a Standardized Method from the International Immuno-Oncology Biomarkers Working Group: Part 2: TILs in Melanoma, Gastrointestinal Tract Carcinomas, Non-Small Cell Lung Carcinoma and Mesothelioma, Endometrial and Ovarian Carcinomas, Squamous Cell Carcinoma of the Head and Neck, Genitourinary Carcinomas, and Primary Brain Tumors. Adv. Anat. Pathol. 2017, 24, 311–335. [Google Scholar]
  27. Herbst, R.S.; Soria, J.C.; Kowanetz, M.; Fine, G.D.; Hamid, O.; Gordon, M.S.; Sosman, J.A.; McDermott, D.F.; Powderly, J.D.; Gettinger, S.N.; et al. Predictive correlates of response to the anti-PD-L1 antibody MPDL3280A in cancer patients. Nature 2014, 515, 563–567. [Google Scholar] [CrossRef]
  28. Reck, M.; Rodríguez-Abreu, D.; Robinson, A.G.; Hui, R.; Csőszi, T.; Fülöp, A.; Gottfried, M.; Peled, N.; Tafreshi, A.; Cuffe, S.; et al. Pembrolizumab versus Chemotherapy for PD-L1–Positive Non–Small-Cell Lung Cancer. N. Engl. J. Med. 2016, 375, 1823–1833. [Google Scholar] [CrossRef]
  29. Daud, A.I.; Wolchok, J.D.; Robert, C.; Hwu, W.J.; Weber, J.S.; Ribas, A.; Hodi, F.S.; Joshua, M.A.; Kefford, R.; Hersey, P.; et al. Programmed Death-Ligand 1 Expression and Response to the Anti–Programmed Death 1 Antibody Pembrolizumab in Melanoma. J. Clin. Oncol. 2016, 34, 4102–4109. [Google Scholar] [CrossRef]
  30. Tordini, F.; Aldinucci, M.; Milanesi, L.; Liò, P.; Merelli, I. The Genome Conformation As an Integrator of Multi-Omic Data: The Example of Damage Spreading in Cancer. Front. Genet. 2016, 7, 194. [Google Scholar] [CrossRef]
  31. Bonev, B.; Cavalli, G. Organization and function of the 3D genome. Nat. Rev. Genet. 2016, 17, 661–678. [Google Scholar] [CrossRef] [PubMed]
  32. Stadhouders, R.; Filion, G.J.; Graf, T. Transcription factors and 3D genome conformation in cell-fate decisions. Nature 2019, 569, 345–354. [Google Scholar] [CrossRef] [PubMed]
  33. Huang, J.; Li, K.; Cai, W.; Liu, X.; Zhang, Y.; Orkin, S.H.; Xu, J.; Yuan, G.C. Dissecting super-enhancer hierarchy based on chromatin interactions. Nat. Commun. 2018, 9, 943. [Google Scholar] [CrossRef] [PubMed]
  34. Di Iulio, J.; Bartha, I.; Wong, E.H.M.; Yu, H.C.; Lavrenko, V.; Yang, D.; Jung, I.; Hicks, M.A.; Shah, N.; Kirkness, E.F.; et al. The human noncoding genome defined by genetic diversity. Nat. Genet. 2018, 50, 333–337. [Google Scholar] [CrossRef]
  35. Kempfer, R.; Pombo, A. Methods for mapping 3D chromosome architecture. Nat. Rev. Genet. 2019, 21, 207–226. [Google Scholar] [CrossRef]
  36. Dekker, J.; Rippe, K.; Dekker, M.; Kleckner, N. Capturing Chromosome Conformation. Science 2002, 295, 1306–1311. [Google Scholar] [CrossRef]
  37. Jakub, J.W.; Grotz, T.E.; Jordan, P.; Hunter, E.; Pittelkow, M.; Ramadass, A.; Akoulitchev, A.; Markovic, S. A pilot study of chromosomal aberrations and epigenetic changes in peripheral blood samples to identify patients with melanoma. Melanoma Res. 2015, 25, 406–411. [Google Scholar] [CrossRef]
  38. Carini, C.; Hunter, E.; Porter, D.; McInnes, I.; Reid, D.; Ralston, S.H. Chromosome conformation signatures define predictive markers of inadequate response to methotrexate in early rheumatoid arthritis. J. Transl. Med. 2018, 16, 18. [Google Scholar] [CrossRef]
  39. Bastonini, E.; Jeznach, M.; Field, M.; Juszczyk, K.; Corfield, E.; Dezfouli, M.; Ahmat, N.; Smith, A.; Womersley, H.; Jordan, P.; et al. Chromatin barcodes as biomarkers for melanoma. Pigm. Cell Melanoma R 2014, 27, 788–800. Available online: http://www.ncbi.nlm.nih.gov/pubmed/24807349 (accessed on 2 April 2023). [CrossRef]
  40. Salter, M.; Corfield, E.; Ramadass, A.; Grand, F.; Green, J.; Westra, J.; Liim, C.R.; Farrimond, L.; Feneberg, E.; Scaber, J.; et al. Initial Identification of a Blood-Based Chromosome Conformation Signature for Aiding in the Diagnosis of Amyotrophic Lateral Sclerosis. Ebiomedicine 2018, 33, 169–184. [Google Scholar] [CrossRef]
  41. Yan, H.; Hunter, E.; Akoulitchev, A.; Park, P.; Winchester, D.J.; Moo-Young, T.A.; Prinz, R.A. Epigenetic chromatin conformation changes in peripheral blood can detect thyroid cancer. Surgery 2019, 165, 44–49. [Google Scholar] [CrossRef]
  42. Hunter, E.; McCord, R.; Ramadass, A.S.; Green, J.; Westra, J.W.; Mundt, K.; Akoulitchev, A. Comparative molecular cell-of-origin classification of diffuse large B-cell lymphoma based on liquid and tissue biopsies. Transl. Med. Commun. 2020, 5, 5. [Google Scholar] [CrossRef]
  43. Salter, M.; Powell, R.; Back, J.; Grand, F.; Koutsothanasi, C.; Green, J.; Hunter, E.; Ramadass, A.; Westra, J.; Akoulitchev, A. Genomic architecture differences at the HTT locus associated with symptomatic and pre-symptomatic cases of Huntington’s disease in a pilot study. F1000research 2019, 7, 1757. [Google Scholar]
  44. Alshaker, H.; Mills, R.; Hunter, E.; Salter, M.; Ramadass, A.; Skinner, B.M.; Westra, W.; Green, J.; Akoulitchev, A.; Winkler, M.; et al. Chromatin conformation changes in peripheral blood can detect prostate cancer and stratify disease risk groups. J. Transl. Med. 2021, 19, 46. [Google Scholar] [CrossRef]
  45. Hunter, E.; Koutsothanasi, C.; Wilson, A.; Santos, F.C.; Salter, M.; Powell, R.; Dring, A.; Brajer, P.; Egan, B.; Westra, J.W.; et al. 3D genomic capture of regulatory immuno-genetic profiles in COVID-19 patients for prognosis of severe COVID disease outcome. Biorxiv 2021. [Google Scholar] [CrossRef]
  46. Hunter, E.; Koutsothanasi, C.; Wilson, A.; Santos, F.C.; Salter, M.; Westra, J.W.; Powel, R.; Dring, A.S.; Brajer, P.; Egan, B.; et al. Development and validation of blood-based prognostic biomarkers for severity of COVID disease outcome using EpiSwitch 3D genomic regulatory immuno-genetic profiling. Medrxiv 2021. Available online: http://medrxiv.org/content/early/2021/06/28/2021.06.21.21259145.abstract (accessed on 28 June 2021).
  47. Cao, F.; Fang, Y.; Tan, H.K.; Goh, Y.; Choy, J.Y.H.; Koh, B.T.H. Super-Enhancers and Broad H3K4me3 Domains Form Complex Gene Regulatory Circuits Involving Chromatin Interactions. Sci. Rep. 2017, 7, 2186. Available online: http://www.nature.com/articles/s41598-017-02257-3 (accessed on 19 May 2017). [CrossRef] [PubMed]
  48. Mukhopadhyay, S.; Ramadass, A.S.; Akouloitchev, A.; Gordon, S. Formation of distinct chromatin conformation signatures epigenetically regulate macrophage activation. Int. Immunopharmacol. 2014, 18, 7–11. Available online: http://www.ncbi.nlm.nih.gov/pubmed/24211766 (accessed on 20 January 2014). [CrossRef] [PubMed]
  49. Hunter, E.; Akoulitchev, A. Clinical and Statistical Considerations in Personalized Medicine; Carini, C., Menon, S.M., Chang, M., Eds.; Current Advances in Epigenetics; CRC Press: Boca Raton, FL, USA, 2014. [Google Scholar]
  50. Hunter, E.; Potluri, S.; Zhang, S.; Dezfouli, M.; Back, J.; James, L.; Jandor, N.; Powell, R.; Salter, M.; Ramadass, A.S.; et al. Development and validation of baseline predictive biomarkers for response to avelumab in second-line (2L) non-small cell lung cancer (NSCLC) using EpiSwitch epigenetic profiling. J. Immunother. Cancer 2019, 7, 143. [Google Scholar]
  51. Pchejetski, D.; Hunter, E.; Dezfouli, M.; Salter, M.; Powell, R.; Green, J.; Naithani, T.; Koutsothanasi, C.; Alshaker, H.; Jaipura, J.; et al. Circulating Chromosome Conformation Signatures Significantly Enhance PSA Positive Predicting Value and Overall Accuracy for Prostate Cancer Detection. Cancers 2023, 15, 821. [Google Scholar] [CrossRef]
  52. Aykan, N.F.; Özatlı, T. Objective response rate assessment in oncology: Current situation and future expectations. World J. Clin. Oncol. 2020, 11, 53–73. [Google Scholar] [CrossRef]
  53. Levy, B.P.; Giaccone, G.; Besse, B.; Felip, E.; Garassino, M.C.; Gomez, M.D.; Garrido, P.; Piperdi, B.; Ponce-Aix, S.; Menezes, D.; et al. Randomised phase 2 study of pembrolizumab plus CC-486 versus pembrolizumab plus placebo in patients with previously treated advanced non-small cell lung cancer. Eur. J. Cancer 2019, 108, 120–128. [Google Scholar] [CrossRef] [PubMed]
  54. Tsourkas, A.; Behlke, M.A.; Xu, Y.; Bao, G. Spectroscopic Features of Dual Fluorescence/Luminescence Resonance Energy-Transfer Molecular Beacons. Anal. Chem. 2003, 75, 3697–3703. [Google Scholar] [CrossRef] [PubMed]
  55. Hancock, J.T.; Khoshgoftaar, T.M. CatBoost for big data: An interdisciplinary review. J. Big Data 2020, 7, 94. [Google Scholar] [CrossRef]
  56. Szklarczyk, D.; Morris, J.H.; Cook, H.; Kuhn, M.; Wyder, S.; Simonovic, M.; Santos, A.; Doncheva, N.T.; Roth, A.; Bork, P. The STRING database in 2017: Quality-controlled protein–protein association networks, made broadly accessible. Nucleic Acids Res. 2017, 45, D362–D368. [Google Scholar] [CrossRef] [PubMed]
  57. Fabregat, A.; Sidiropoulos, K.; Viteri, G.; Forner, O.; Marin-Garcia, P.; Arnau, V.; D’Eustachio, P.; Stein, L.; Hermjakob, H. Reactome pathway analysis: A high-performance in-memory approach. BMC Bioinform. 2017, 18, 142. [Google Scholar] [CrossRef] [PubMed]
  58. Fabregat, A.; Korninger, F.; Viteri, G.; Sidiropoulos, K.; Marin-Garcia, P.; Ping, P.; Wu, G.; Stein, L.; D’Eustachio, P.; Hermjakob, H. Reactome graph database: Efficient access to complex pathway data. PLoS Comput. Biol. 2018, 14, e1005968. [Google Scholar] [CrossRef]
  59. Scutari, M. Learning Bayesian Networks with the bnlearn R Package. J. Stat. Softw. 2010, 35, 1–22. [Google Scholar] [CrossRef]
  60. Betzler, A.C.; Theodoraki, M.N.; Schuler, P.J.; Döscher, J.; Laban, S.; Hoffmann, T.K.; Brunner, C. NF-κB and Its Role in Checkpoint Control. Int. J. Mol. Sci. 2020, 21, 3949. [Google Scholar] [CrossRef] [PubMed]
  61. Ganesh, K.; Massagué, J. TGF-β Inhibition and Immunotherapy: Checkmate. Immunity 2018, 48, 626–628. [Google Scholar] [CrossRef]
  62. Ravi, R.; Noonan, K.A.; Pham, V.; Bedi, R.; Zhavoronkov, A.; Ozerov, I.V.; Makarev, E.; Artemov, A.V.; Wysotcki, P.T.; Mehra, R.; et al. Bifunctional immune checkpoint-targeted antibody-ligand traps that simultaneously disable TGFβ enhance the efficacy of cancer immunotherapy. Nat. Commun. 2018, 9, 741. [Google Scholar] [CrossRef]
  63. Guo, Y.; Lu, X.; Chen, Y.; Rendon, B.; Mitchell, R.A.; Cuatrecasas, M.; Cortes, M.; Postigo, A.; Lu, Y.; Dean, D.C. Zeb1 induces immune checkpoints to form an immunosuppressive envelope around invading cancer cells. Sci Adv. 2021, 7, eabd7455. [Google Scholar] [CrossRef] [PubMed]
  64. Korb, K.B.; Hope, L.R.; Nicholson, A.E.; Axnick, K. PRICAI 2004: Trends in Artificial Intelligence. In Proceedings of the 8th Pacific Rim International Conference on Artificial Intelligence, Auckland, New Zealand, 9–13 August 2004; Springer: Berlin/Heidelberg, Germany, 2004; pp. 322–331. [Google Scholar]
  65. Man, J.; Millican, J.; Mulvey, A.; Gebski, V.; Hui, R. Response Rate and Survival at Key Timepoints With PD-1 Blockade vs Chemotherapy in PD-L1 Subgroups: Meta-Analysis of Metastatic NSCLC Trials. Jnci. Cancer Spectr. 2021, 5, pkab012. [Google Scholar] [CrossRef] [PubMed]
  66. Topalian, S.L.; Hodi, F.S.; Brahmer, J.R.; Gettinger, S.N.; Smith, D.C.; McDermott, D.F.; Powderly, J.D.; Carvajal, R.D.; Sosman, J.A.; Atkins, M.B.; et al. Safety, Activity, and Immune Correlates of Anti–PD-1 Antibody in Cancer. N. Engl. J. Med. 2012, 366, 2443–2454. [Google Scholar] [CrossRef] [PubMed]
  67. Adashek, J.J.; Subbiah, I.M.; Matos, I.; Garralda, E.; Menta, A.K.; Ganeshan, D.M.; Subbiah, V. Hyperprogression and Immunotherapy: Fact, Fiction, or Alternative Fact? Trends Cancer 2020, 6, 181–191. [Google Scholar] [CrossRef] [PubMed]
  68. Nesline, M.K.; Knight, T.; Colman, S.; Patel, K. Economic Burden of Checkpoint Inhibitor Immunotherapy for the Treatment of Non–Small Cell Lung Cancer in US Clinical Practice. Clin. Ther. 2020, 42, 1682–1698.e7. [Google Scholar] [CrossRef] [PubMed]
  69. Powles, T.B.; Sridhar, S.; Bellmunt, J.; Sternberg, C.; Grivas, P.; Hunter, E.; Dezfouli, M.; Salter, M.; Powell, R.; Dring, A.; et al. LBA74 Genomic biomarkers in peripheral blood (PB) from patients (pts) enrolled in the JAVELIN Bladder 100 trial of avelumab first-line (1L) maintenance in advanced urothelial carcinoma (aUC). Ann. Oncol. 2022, 33, S1442. [Google Scholar] [CrossRef]
  70. Kosaka, N.; Ochiya, T. Unraveling the Mystery of Cancer by Secretory microRNA: Horizontal microRNA Transfer between Living Cells. Front. Genet. 2012, 2, 97. [Google Scholar] [CrossRef]
  71. Melo, S.A.; Sugimoto, H.; O’Connell, J.T.; Kato, N.; Villanueva, A.; Vidal, A.; Qiu, L.; Vikin, E.; Perelman, L.T.; Melo, C.A.; et al. Cancer Exosomes Perform Cell-Independent MicroRNA Biogenesis and Promote Tumorigenesis. Cancer Cell 2014, 26, 707–721. [Google Scholar] [CrossRef]
  72. Lin, D.; Chen, J.; Perrone-Bizzozero, N.; Bustillo, J.R.; Du, Y.; Calhoun, V.D.; Liu, J. Characterization of cross-tissue genetic-epigenetic effects and their patterns in schizophrenia. Genome Med. 2018, 10, 13. [Google Scholar] [CrossRef]
  73. Alshaker, H.; Hunter, E.; Salter, M.; Ramadass, A.; Westra, W.; Winkler, M.; Green, J.; Akoulitchev, A.; Pchejetski, D. Monocytes acquire prostate cancer specific chromatin conformations upon indirect co-culture with prostate cancer cells. Front. Oncol. 2022, 12, 990842. [Google Scholar] [CrossRef]
  74. Serratì, S.; Guida, M.; Fonte, R.D.; Summa, S.D.; Strippoli, S.; Iacobazzi, R.M.; Quarta, A.; De Risis, I.; Guida, G.; Paradiso, A.; et al. Circulating extracellular vesicles expressing PD1 and PD-L1 predict response and mediate resistance to checkpoint inhibitors immunotherapy in metastatic melanoma. Mol. Cancer 2022, 21, 20. [Google Scholar] [CrossRef] [PubMed]
  75. Chen, G.; Huang, A.C.; Zhang, W.; Zhang, G.; Wu, M.; Xu, W.; Yu, Z.; Yang, J.; Wang, B.; Sun, H.; et al. Exosomal PD-L1 Contributes to Immunosuppression and is Associated with anti-PD-1 Response. Nature 2018, 560, 382–386. [Google Scholar] [CrossRef]
  76. Vaddepally, R.K.; Kharel, P.; Pandey, R.; Garje, R.; Chandra, A.B. Review of Indications of FDA-Approved Immune Checkpoint Inhibitors per NCCN Guidelines with the Level of Evidence. Cancers 2020, 12, 738. [Google Scholar] [CrossRef] [PubMed]
  77. Twomey, J.D.; Zhang, B. Cancer Immunotherapy Update: FDA-Approved Checkpoint Inhibitors and Companion Diagnostics. Aaps J. 2021, 23, 39. [Google Scholar] [CrossRef] [PubMed]
Figure 1. Workflow for development and testing the 3D genomic classifier model for prediction of ICI treatment response outcome. From EpiSwitch array screening profiles accounting for over 30 million data points, 72 top array markers were selected based on Glmnet logistic regression. Twenty-four markers qualified for translation into EpiSwitch qPCR format, of which 20 markers have passed quality control and feature reduction control on 32 patient samples. A training cohort of 77 patients was used to build a predictive classifier model based on eight qPCR markers. It was then validated on independent cohorts of 24, 128, and 51 patients.
Cancers 15 02696 g001
Figure 2. Performance of the prognostic biomarker classifier for calling response (R) and non-response (NR) to ICI treatment outcome. (A) Confusion matrix and test performance statistics for the eight-marker classifier on the 24 patients of the test cohort and (B) in the combined train and test cohort of 102 patients.
Cancers 15 02696 g002
Figure 3. Performance of the prognostic biomarker classifier for calling response (R) and non-response (NR) to ICI treatment outcome. (A) Confusion matrix and test performance statistics for the eight-marker classifier on the 128 patients of the test cohort 2 and (B) in the combined train and test cohort of 229 patients.
Cancers 15 02696 g003
Figure 4. Performance of the prognostic biomarker classifier for calling response (R) and non-response (NR) to ICI treatment outcome. (A) Confusion matrix and test performance statistics for the eight-marker classifier on the 51 patients of the observational test cohort #3 and (B) in the total combined train and test cohort of 280 patients.
Cancers 15 02696 g004
Figure 5. Mapping of the top eight predictive 3D genetic markers. Identities of genes associated with the location of the eight top 3D genomic markers analysed in this study. Distance—actual distance of the 3D long-range interaction marker from the gene ORF. Rank_Model—ranking order of the markers in the classifier model.
Cancers 15 02696 g005
Figure 6. Mapping of the top eight predictive 3D genomic markers to biological pathways. Analysis of the top eight 3D genomic markers separating PD-1/PD-L1 ICI responders and non-responders at baseline.
Cancers 15 02696 g006
Figure 7. STRING Network associated with baseline prediction of response/non-response to ICI treatment. The proteins encoded by genes in the top 3D genomic markers associated with baseline response/non-response to ICI profile show a highly connected network. The yellow nodes mark the coding regions associated with the top eight markers of the validated classifier.
Cancers 15 02696 g007
Figure 8. EpiSwitch Data Portal view of the EpiSwitch Marker located in CD274/PDCD1LG2 region imposed over the Integrative Genomic Viewer (IGV) (ref). Anchor sites brought into juxtaposition by chromosome long-range interactions of the EpiSwitch marker overlap with the listed SNPs and enhancers. Analysis of SNPs identified affected binding sites for transcription factors (TFs) such as ZEB1 [63]. GeneCards analysis of the enhancers identifies CD274 enhancer at the distal anchor site of the EpiSwitch marker. CD274 corresponds to PD-L1, and PDCD1LG2 to PD-L2 immune checkpoints.
Cancers 15 02696 g008
Figure 9. Causal graphs (Bayesian causal networks) based on training set of the EpiSwitch biomarkers and clinical outcome of IO treatment. Probabilistic relationship of the EpiSwitch markers and RECIST 1.1 assessment of IO treatment outcome, based on 3D genomic architecture (A) and gene identities at the sites of EpiSwitch markers (B). The edge in (B) marks the causal relationship between RECIST 1.1 outcome and PD-L1 (CD274)-based EpiSwitch marker (marked in red, see also Figure 8 for the detailed location of the marker).
Cancers 15 02696 g009
Figure 10. Horizontal transfer by EV, including exosomes, carry epigenetic information from primary sites to the secondary sites and the sites of systemic detection. Extracellular vehicles, including exosomes, carry representative loads of proteins, metabolites, and non-coding RNAs from primary sites, all of which could act as epigenetic regulatory factors for resetting 3D architecture of the selective genetic loci of the effector cells [73]. In early symptomatic systemic readouts, the cells of immunosurveillance were identified as a potential subject of primary 3D modulation, as in the case of early melanoma detection [39].
Cancers 15 02696 g010
Table 1. Array based 3D genomic marker leads for baseline response to ICI.
Probe aGlmnet_Coef bp. Valueadj.p.Val cFC dPrimers Design ID ePrimer1 fPrimer2 fGene g
Hg38_9_5495992_5572986_RR0.2471015220.0012133440.0391065641.18337794OBD189-q0s57/q059GAGGGTCACTCACTGCCCAACAGGCGACTGTAAGGTAGAAATCCTGCCTGGGTPDCD1LG2, CD274
Hg38_9_5495992_5572986_RR0.2471015220.0012133440.0391065641.18337794OBD189-q057/q059GAGGGTCACTCACTGCCCAACAGGCGACTGTAAGGTAGAAATCCTGCCTGGGTCD274
Hg38_9_5495992_5572986_RR0.2471015220.0012133440.0391065641.18337794OBD189-q057/q059GAGGGTCACTCACTGCCCAACAGGCGACTGTAAGGTAGAAATCCTGCCTGGGTRIC1
Hg38_13_20664875_20698635_FF0.1118157290.0394474940.2584988981.165419467OBD189-q081/q083GAAGTGCCACGAGAAGGAGGATGGTCCGGGCTGTGTCCTGATAAACCCATTGTTAIFT88
Hg38_13_20664875_20698635_FF0.1118157290.0394474940.2584988981.165419467OBD189-q081/q083GAAGTGCCACGAGAAGGAGGATGGTCCGGGCTGTGTCCTGATAAACCCATTGTTAIL17D
Hg38_13_20664875_20698635_FF0.1118157290.0394474940.2584988981.165419467OBD189-q081/q083GAAGTGCCACGAGAAGGAGGATGGTCCGGGCTGTGTCCTGATAAACCCATTGTTAN6AMT2
Hg38_13_46087370_46193039_RF0.1327587310.0979372960.3912494841.09303819OBD189-q053/q055TAGAAGCAGGGAGTAGTTGAGCAATGGGTCTTCACTTGTGCTATTGGCTTTCCAGCCPB2
Hg38_13_46087370_46193039_RF0.1327587310.0979372960.3912494841.09303819OBD189-q053/q055TAGAAGCAGGGAGTAGTTGAGCAATGGGTCTTCACTTGTGCTATTGGCTTTCCAGCLCP1
Hg38_13_46087370_46193039_RF0.1327587310.0979372960.3912494841.09303819OBD189-q053/q055TAGAAGCAGGGAGTAGTTGAGCAATGGGTCTTCACTTGTGCTATTGGCTTTCCAGCLRRC63
Hg38_15_98731539_98790114_FF0.1657269080.1089614140.4100375371.08563184OBD189-q001/q003GGCTGGTGGGAGTATTTTCAAAGAGAACGCTCTGTTCAAGTGGCTCTGTTCCAIGF1R
Hg38_15_98731539_98790114_FF0.1657269080.1089614140.4100375371.08563184OBD189-q001/q003GGCTGGTGGGAGTATTTTCAAAGAGAACGCTCTGTTCAAGTGGCTCTGTTCCAPGPEP1L
Hg38_15_98731539_98790114_FF0.1657269080.1089614140.4100375371.08563184OBD189-q001/q003GGCTGGTGGGAGTATTTTCAAAGAGAACGCTCTGTTCAAGTGGCTCTGTTCCAFAM169B
Hg38_8_42264241_42332799_FR0.102113070.1600691690.4844525741.079808853OBD148_261/263CGGTGAGCACGGTCTGTCTACTTGTCCTGGGTCCTGGGTGAAAGTCIKBKB
Hg38_8_42264241_42332799_FR0.102113070.1600691690.4844525741.079808853OBD148_261/263CGGTGAGCACGGTCTGTCTACTTGTCCTGGGTCCTGGGTGAAAGTCPOLB
Hg38_8_42264241_42332799_FR0.102113070.1600691690.4844525741.079808853OBD148_261/263CGGTGAGCACGGTCTGTCTACTTGTCCTGGGTCCTGGGTGAAAGTCDKK4
Hg38_1_6461604_6515315_FR0.0496609070.1711789370.4983424531.125005092OBD189-q029/q031TGCCCGTCGTGGTTCCGCCTTCAAGAGACCCACCCCAGCCTCCTGATNFRSF25
Hg38_1_6461604_6515315_FR0.0496609070.1711789370.4983424531.125005092OBD189-q029/q031TGCCCGTCGTGGTTCCGCCTTCAAGAGACCCACCCCAGCCTCCTGAPLEKHG5
Hg38_1_6461604_6515315_FR0.0496609070.1711789370.4983424531.125005092OBD189-q029/q031TGCCCGTCGTGGTTCCGCCTTCAAGAGACCCACCCCAGCCTCCTGAESPN
Hg38_4_109703339_109741090_RF0.0508646250.2182838990.5514271371.109210269OBD189-q005/q007CCCCAACTCACAACACCCCAGACAGAGGAGGGCAAGGTGTCTGGCTCASP6
Hg38_4_109703339_109741090_RF0.0508646250.2182838990.5514271371.109210269OBD189-q005/q007CCCCAACTCACAACACCCCAGACAGAGGAGGGCAAGGTGTCTGGCTPLA2G12A
Hg38_4_109703339_109741090_RF0.0508646250.2182838990.5514271371.109210269OBD189-q005/q007CCCCAACTCACAACACCCCAGACAGAGGAGGGCAAGGTGTCTGGCTCFI
Hg38_8_81007411_81099880_FR0.1157633620.2248812460.558021921.062648413OBD189-q061/q063TGGACAGCCACTACTCAACCTTTTCCTACAAACCCAGATTGGACCTCACAGCCCCPAG1
Hg38_8_81007411_81099880_FR0.1157633620.2248812460.558021921.062648413OBD189-q061/q063TGGACAGCCACTACTCAACCTTTTCCTACAAACCCAGATTGGACCTCACAGCCCCZNF704
Hg38_8_81007411_81099880_FR0.1157633620.2248812460.558021921.062648413OBD189-q061/q063TGGACAGCCACTACTCAACCTTTTCCTACAAACCCAGATTGGACCTCACAGCCCCFABP5
Hg38_1_161633494_161661864_RF0.0275795940.2475732070.5810477461.148972903OBD189-q041/q043TTGCCACCTGTCTCAGATACCCTTGGTTGCTGCTCCTCTTGCCTGGAATGCCTATTFCGR2B
Hg38_1_161633494_161661864_RF0.0275795940.2475732070.5810477461.148972903OBD189-q041/q043TTGCCACCTGTCTCAGATACCCTTGGTTGCTGCTCCTCTTGCCTGGAATGCCTATTFCGR3B
Hg38_1_161633494_161661864_RF0.0275795940.2475732070.5810477461.148972903OBD189-q041/q043TTGCCACCTGTCTCAGATACCCTTGGTTGCTGCTCCTCTTGCCTGGAATGCCTATTFCRLA
Hg38_5_157178319_157271762_RR0.0264565970.2984980070.6285680251.13173441OBD189-q065/q067TGTATGTCTCCTGAGGTGAAGCAAGAGGCTTCCACCGTGCCCGCAGCCAGCITK
Hg38_5_157178319_157271762_RR0.0264565970.2984980070.6285680251.13173441OBD189-q065/q067TGTATGTCTCCTGAGGTGAAGCAAGAGGCTTCCACCGTGCCCGCAGCCAGCCYFIP2
Hg38_5_157178319_157271762_RR0.0264565970.2984980070.6285680251.13173441OBD189-q065/q067TGTATGTCTCCTGAGGTGAAGCAAGAGGCTTCCACCGTGCCCGCAGCCAGCFAM71B
Hg38_9_114957908_114977746_RF−0.0262698290.3011727070.630926161−1.124920787OBD148-q917/q919TTGCTTGTGAGTTTGATGCAGAAGCCAAATGGGCCTAGCCATNFSF8
Hg38_9_114957908_114977746_RF−0.0262698290.3011727070.630926161−1.124920787OBD148-q917/q919TTGCTTGTGAGTTTGATGCAGAAGCCAAATGGGCCTAGCCATNC
Hg38_9_114957908_114977746_RF−0.0262698290.3011727070.630926161−1.124920787OBD148-q917/q919TTGCTTGTGAGTTTGATGCAGAAGCCAAATGGGCCTAGCCATNFSF15
Hg38_18_62330039_62362521_FR−0.1025703520.3013747890.631092221−1.070331563OBD189-q037/q039CCTACTGGCACCACTGTGTTGGCTGGTATCATAATCAGGCAACTGGCTGGTGCTNFRSF11A
Hg38_18_62330039_62362521_FR−0.1025703520.3013747890.631092221−1.070331563OBD189-q037/q039CCTACTGGCACCACTGTGTTGGCTGGTATCATAATCAGGCAACTGGCTGGTGCKIAA1468
Hg38_18_62330039_62362521_FR−0.1025703520.3013747890.631092221−1.070331563OBD189-q037/q039CCTACTGGCACCACTGTGTTGGCTGGTATCATAATCAGGCAACTGGCTGGTGCPIGN
Hg38_9_136904007_136941363_RF0.0218767970.3021885320.6318346491.115259064OBD189-q009/q011AGCACTCGTCGTTGGGCGTGTAGCGGCACACCTCTACTCTCAGCCTRABL6
Hg38_9_136904007_136941363_RF0.0218767970.3021885320.6318346491.115259064OBD189-q009/q011AGCACTCGTCGTTGGGCGTGTAGCGGCACACCTCTACTCTCAGCCTTRAF2
Hg38_9_136904007_136941363_RF0.0218767970.3021885320.6318346491.115259064OBD189-q009/q011AGCACTCGTCGTTGGGCGTGTAGCGGCACACCTCTACTCTCAGCCTFBXW5
Hg38_17_34316073_34373948_RF−0.2438560530.3591719730.67918219−1.036704719OBD148-q893/q895ACTTGTGGCTTCCTTAGCCCTCCTTTGCAGGTATGGACATCCCL8
Hg38_17_34316073_34373948_RF−0.2438560530.3591719730.67918219−1.036704719OBD148-q893/q895ACTTGTGGCTTCCTTAGCCCTCCTTTGCAGGTATGGACATCCCL13
Hg38_17_34316073_34373948_RF−0.2438560530.3591719730.67918219−1.036704719OBD148-q893/q895ACTTGTGGCTTCCTTAGCCCTCCTTTGCAGGTATGGACATCCCL1
Hg38_13_20664875_20744490_FR0.0809191320.4607466760.7526842531.036210668OBD189-q073/q075GGAAGTGCCACGAGAAGGAGGATGGTCCGGTAAGATGAGGCTGTGGGCAAGGAGCIFT88
Hg38_13_20664875_20744490_FR0.0809191320.4607466760.7526842531.036210668OBD189-q073/q075GGAAGTGCCACGAGAAGGAGGATGGTCCGGTAAGATGAGGCTGTGGGCAAGGAGCIL17D
Hg38_13_20664875_20744490_FR0.0809191320.4607466760.7526842531.036210668OBD189-q073/q075GGAAGTGCCACGAGAAGGAGGATGGTCCGGTAAGATGAGGCTGTGGGCAAGGAGCN6AMT2
Hg38_11_77430379_77519103_RF0.1500084190.4829390860.7669773251.027489411OBD189-q033/q035CATAACCACACTGCTACCAACACACCTACTGGTTATTCGGACACTCATAGGACTGGPAK1
Hg38_11_77430379_77519103_RF0.1500084190.4829390860.7669773251.027489411OBD189-q033/q035CATAACCACACTGCTACCAACACACCTACTGGTTATTCGGACACTCATAGGACTGGCLNS1A
Hg38_11_77430379_77519103_RF0.1500084190.4829390860.7669773251.027489411OBD189-q033/q035CATAACCACACTGCTACCAACACACCTACTGGTTATTCGGACACTCATAGGACTGGAQP11
Hg38_8_42264241_42292124_FR0.0283500690.4865918630.7693057111.0425716OBD189-q025/q027GGTGAGCACGGTCTGTCTACTTTCCCGGACCCAGGCTCTGCTGCTACAGIKBKB
Hg38_8_42264241_42292124_FR0.0283500690.4865918630.7693057111.0425716OBD189-q025/q027GGTGAGCACGGTCTGTCTACTTTCCCGGACCCAGGCTCTGCTGCTACAGPOLB
Hg38_8_42264241_42292124_FR0.0283500690.4865918630.7693057111.0425716OBD189-q025/q027GGTGAGCACGGTCTGTCTACTTTCCCGGACCCAGGCTCTGCTGCTACAGPLAT
Hg38_18_62296384_62386748_FF0.0553161790.4995748360.7773548091.031115956OBD189-q045/q047CATAGACCCAGGTGTGCTCCGTGGCAGCGAGCACTGGTTCCCCGCAAATACTGGGKIAA1468
Hg38_18_62296384_62386748_FF0.0553161790.4995748360.7773548091.031115956OBD189-q045/q047CATAGACCCAGGTGTGCTCCGTGGCAGCGAGCACTGGTTCCCCGCAAATACTGGGTNFRSF11A
Hg38_18_62296384_62386748_FF0.0553161790.4995748360.7773548091.031115956OBD189-q045/q047CATAGACCCAGGTGTGCTCCGTGGCAGCGAGCACTGGTTCCCCGCAAATACTGGGPIGN
Hg38_9_114855753_114929419_FR0.1341895130.526988680.7938761251.033468601OBD189-q049/q051CCATTGTTGCTCAGGCTGCCCTCTTGCGCATTCAAGTGACAGAGAGAAAAGAGGCTNFSF8
Hg38_9_114855753_114929419_FR0.1341895130.526988680.7938761251.033468601OBD189-q049/q051CCATTGTTGCTCAGGCTGCCCTCTTGCGCATTCAAGTGACAGAGAGAAAAGAGGCTNFSF15
Hg38_9_114855753_114929419_FR0.1341895130.526988680.7938761251.033468601OBD189-q049/q051CCATTGTTGCTCAGGCTGCCCTCTTGCGCATTCAAGTGACAGAGAGAAAAGAGGCTNC
Hg38_8_26561792_26644530_FR0.0558432870.6251621610.8480394881.042292141OBD189-q069/q071CAGTATGAGTGTTCTGTGGCTGCTCCCAGCGTGTCTCTCAGGGAAGGCAGGATGCDPYSL2
Hg38_8_26561792_26644530_FR0.0558432870.6251621610.8480394881.042292141OBD189-q069/q071CAGTATGAGTGTTCTGTGGCTGCTCCCAGCGTGTCTCTCAGGGAAGGCAGGATGCPNMA2
Hg38_8_26561792_26644530_FR0.0558432870.6251621610.8480394881.042292141OBD189-q069/q071CAGTATGAGTGTTCTGTGGCTGCTCCCAGCGTGTCTCTCAGGGAAGGCAGGATGCBNIP3L
Hg38_8_127691489_127740424_FR−0.0005809830.6766177380.8739134671.034088403OBD189-q013/q015GTCACCTTCATCTCCTTCTCACAGCAGGCTTCGCTTACCAGAGTCGCTGCMYC
Hg38_8_127691489_127740424_FR−0.0005809830.6766177380.8739134671.034088403OBD189-q013/q015GTCACCTTCATCTCCTTCTCACAGCAGGCTTCGCTTACCAGAGTCGCTGCAC108925.1
Hg38_8_127691489_127740424_FR−0.0005809830.6766177380.8739134671.034088403OBD189-q013/q015GTCACCTTCATCTCCTTCTCACAGCAGGCTTCGCTTACCAGAGTCGCTGCPOU5F1B
Hg38_9_120888366_120919710_RR0.0187533850.7845459890.9220289681.010214644OBD189-q017/q019CCCAGTTGTCCAGGTTGCTGCCTCCTGGAGCAGAACCTGTCAGACCPHF19
Hg38_9_120888366_120919710_RR0.0187533850.7845459890.9220289681.010214644OBD189-q017/q019CCCAGTTGTCCAGGTTGCTGCCTCCTGGAGCAGAACCTGTCAGACCTRAF1
Hg38_9_120888366_120919710_RR0.0187533850.7845459890.9220289681.010214644OBD189-q017/q019CCCAGTTGTCCAGGTTGCTGCCTCCTGGAGCAGAACCTGTCAGACCC5
Hg38_13_20664875_20691044_FF−0.0239127470.803650950.929901824−1.012741717OBD189-q077/q079GGAAGTGCCACGAGAAGGAGGATGGTCCCCACCCAGTTCCTCCAGGCATAGCAGGIFT88
Hg38_13_20664875_20691044_FF−0.0239127470.803650950.929901824−1.012741717OBD189-q077/q079GGAAGTGCCACGAGAAGGAGGATGGTCCCCACCCAGTTCCTCCAGGCATAGCAGGIL17D
Hg38_13_20664875_20691044_FF−0.0239127470.803650950.929901824−1.012741717OBD189-q077/q079GGAAGTGCCACGAGAAGGAGGATGGTCCCCACCCAGTTCCTCCAGGCATAGCAGGN6AMT2
Hg38_5_168579937_168620163_RR0.0196852830.89534530.964751362−1.005369684OBD189-q021/q023CCGACCCTAACATTCAAGGTGTCTCTATGAGTCAGCGTGTAGTGCTCCCACPANK3
Hg38_5_168579937_168620163_RR0.0196852830.89534530.964751362−1.005369684OBD189-q021/q023CCGACCCTAACATTCAAGGTGTCTCTATGAGTCAGCGTGTAGTGCTCCCACSLIT3
Hg38_5_168579937_168620163_RR0.0196852830.89534530.964751362−1.005369684OBD189-q021/q023CCGACCCTAACATTCAAGGTGTCTCTATGAGTCAGCGTGTAGTGCTCCCACFBLL1
a Internal Array probe ID. b Glment coefficient. c Adjusted p value. d Fold Change. e Internal primer design ID. f Primer sequence. g Gene at the locus of the probe. Top array-based 3D genomic markers identified from over 30 million data points in 32 responders and non-responders across several indications and several choices of ICI: Pembrolizumab, Atezolizumab, or Durvalumab. Probe—array-based marker coordinates for long-range interaction junction; Glmnet coefficient, p value, Adjusted p value, and Fold Change (FC) are array-based measures of markers in the comparison of responder and non-responder groups; primer design ID—qPCR primer probe designs corresponding to array probes. Twenty-four optimal in silico designs (marked in green) were taken forward to quality control checks in temperature gradient analysis. Gene—identity of genes of interest in the location of 3D genomic markers.
Table 2. Translation and selection of top markers into qPCR format.
Episwitch Interaction aPrimers Design ID bProbe UsedOpt Ann Tm cQC Optimisation dScreen 1Screen 2
CASP6_4_109703339_109741090_RFOBD189-q005/q007OBD189-p00568PassedPassedPassed
IGF1R_15_98731539_98790114_FFOBD189-q001/q003OBD189-p00364.4Passed Failed
IKBKB_8_42264241_42292124_FROBD189-q025/q027OBD189-p02566.4Passed Failed
IKBKB_8_42264241_42332799_FROBD148_261/263OBD189-p26168Passed Failed
IL17D_13_20664875_20691044_FFOBD189-q077/q079OBD189-p07767.5Passed Failed
ITK_5_157178319_157271762_RROBD189-q065/q067OBD189-p06566.4PassedPassedPassed
MYC_8_127691489_127740424_FROBD189-q013/q015OBD189-p01366.4Passed Failed
ORF102_17_34316073_34373948_RFOBD148-q893/q895OBD148-p89362PassedPassedPassed
ORF197_8_26561792_26644530_FROBD189-q069/q071N/A eN/AFailed Failed
ORF243_1_161633494_161661864_RFOBD189-q041/q043OBD189-p04362Passed Failed
ORF313_13_20664875_20698635_FFOBD189-q081/q083OBD189-p08164.4PassedPassedPassed
ORF313_13_20664875_20744490_FROBD189-q073/q075N/AN/AFailed Failed
ORF369_13_46087370_46193039_RFOBD189-q053/q055OBD189-p05367.5PassedPassedPassed
ORF479_8_81007411_81099880_FROBD189-q061/q063OBD189-p06164.4Passed Failed
ORF480_11_77430379_77519103_RFOBD189-q033/q035OBD189-p03366.4Passed Failed
ORF482_5_168579937_168620163_RROBD189-q021/q023OBD189-p02166.4Passed Failed
ORF698_18_62296384_62386748_FFOBD189-q045/q047OBD189-p04566.4Passed Failed
ORF698_18_62330039_62362521_FROBD189-q037/q039N/AN/AFailed Failed
ORF703_1_6461604_6515315_FROBD189-q029/q031OBD189-p03167.5PassedPassedPassed
ORF705_9_114855753_114929419_FROBD189-q049/q051OBD189-p04966.4PassedPassedPassed
ORF712_9_120888366_120919710_RROBD189-q017/q019OBD189-p01768Passed Failed
PDCD1LG2_9_5495992_5572986_RROBD189-q057/q059OBD189-p05767.5PassedPassedPassed
TNFSF8_9_114957908_114977746_RFOBD148-q917/q919N/AN/AFailed Failed
TRAF2_9_136904007_136941363_RFOBD189-q009/q011OBD189-p00964.4Passed Failed
a Internal EpiSwitch Interaction ID. b Internal primer design ID. c Optimum Annealing Temperature. d Quality Control Optimisation. e Not Available. Temperature gradient optimisation for primer probe designs of the top 24 markers: markers that failed quality control and feature reduction in Screen 1 and Screen 2, are marked.
Disclaimer/Publisher’s Note: The statements, opinions and data contained in all publications are solely those of the individual author(s) and contributor(s) and not of MDPI and/or the editor(s). MDPI and/or the editor(s) disclaim responsibility for any injury to people or property resulting from any ideas, methods, instructions or products referred to in the content.

