
Development of an Image Analysis-Based Prognosis Score Using Google’s Teachable Machine in Melanoma

 , and
, and
Abstract
:Simple Summary
Abstract
1. Introduction
2. Materials and Methods
2.1. Study Population
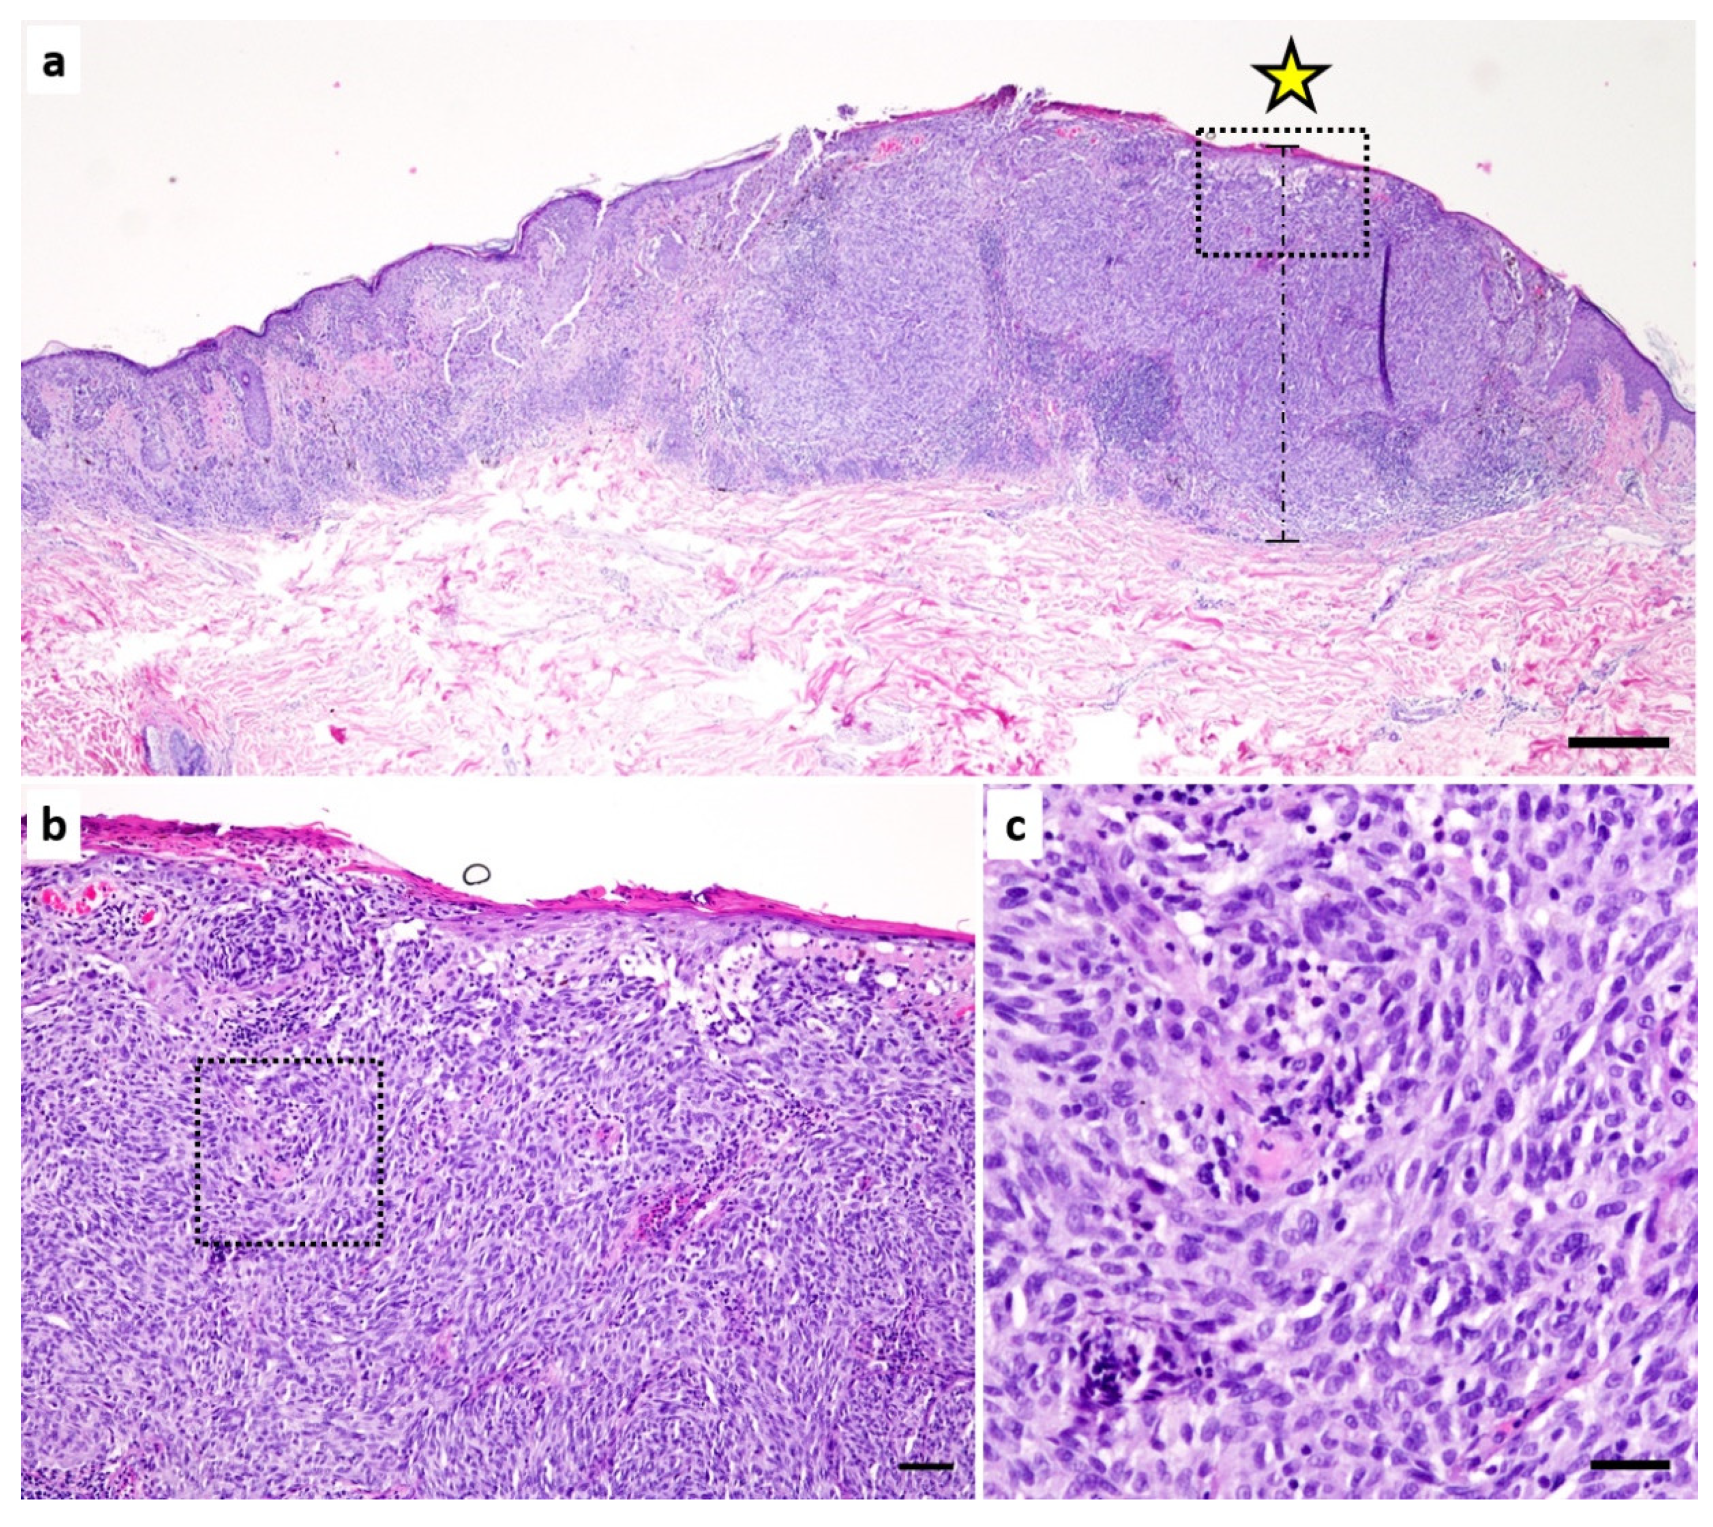
2.2. Digitization of HE Sections and AI-Based Evaluation
2.3. Statistics
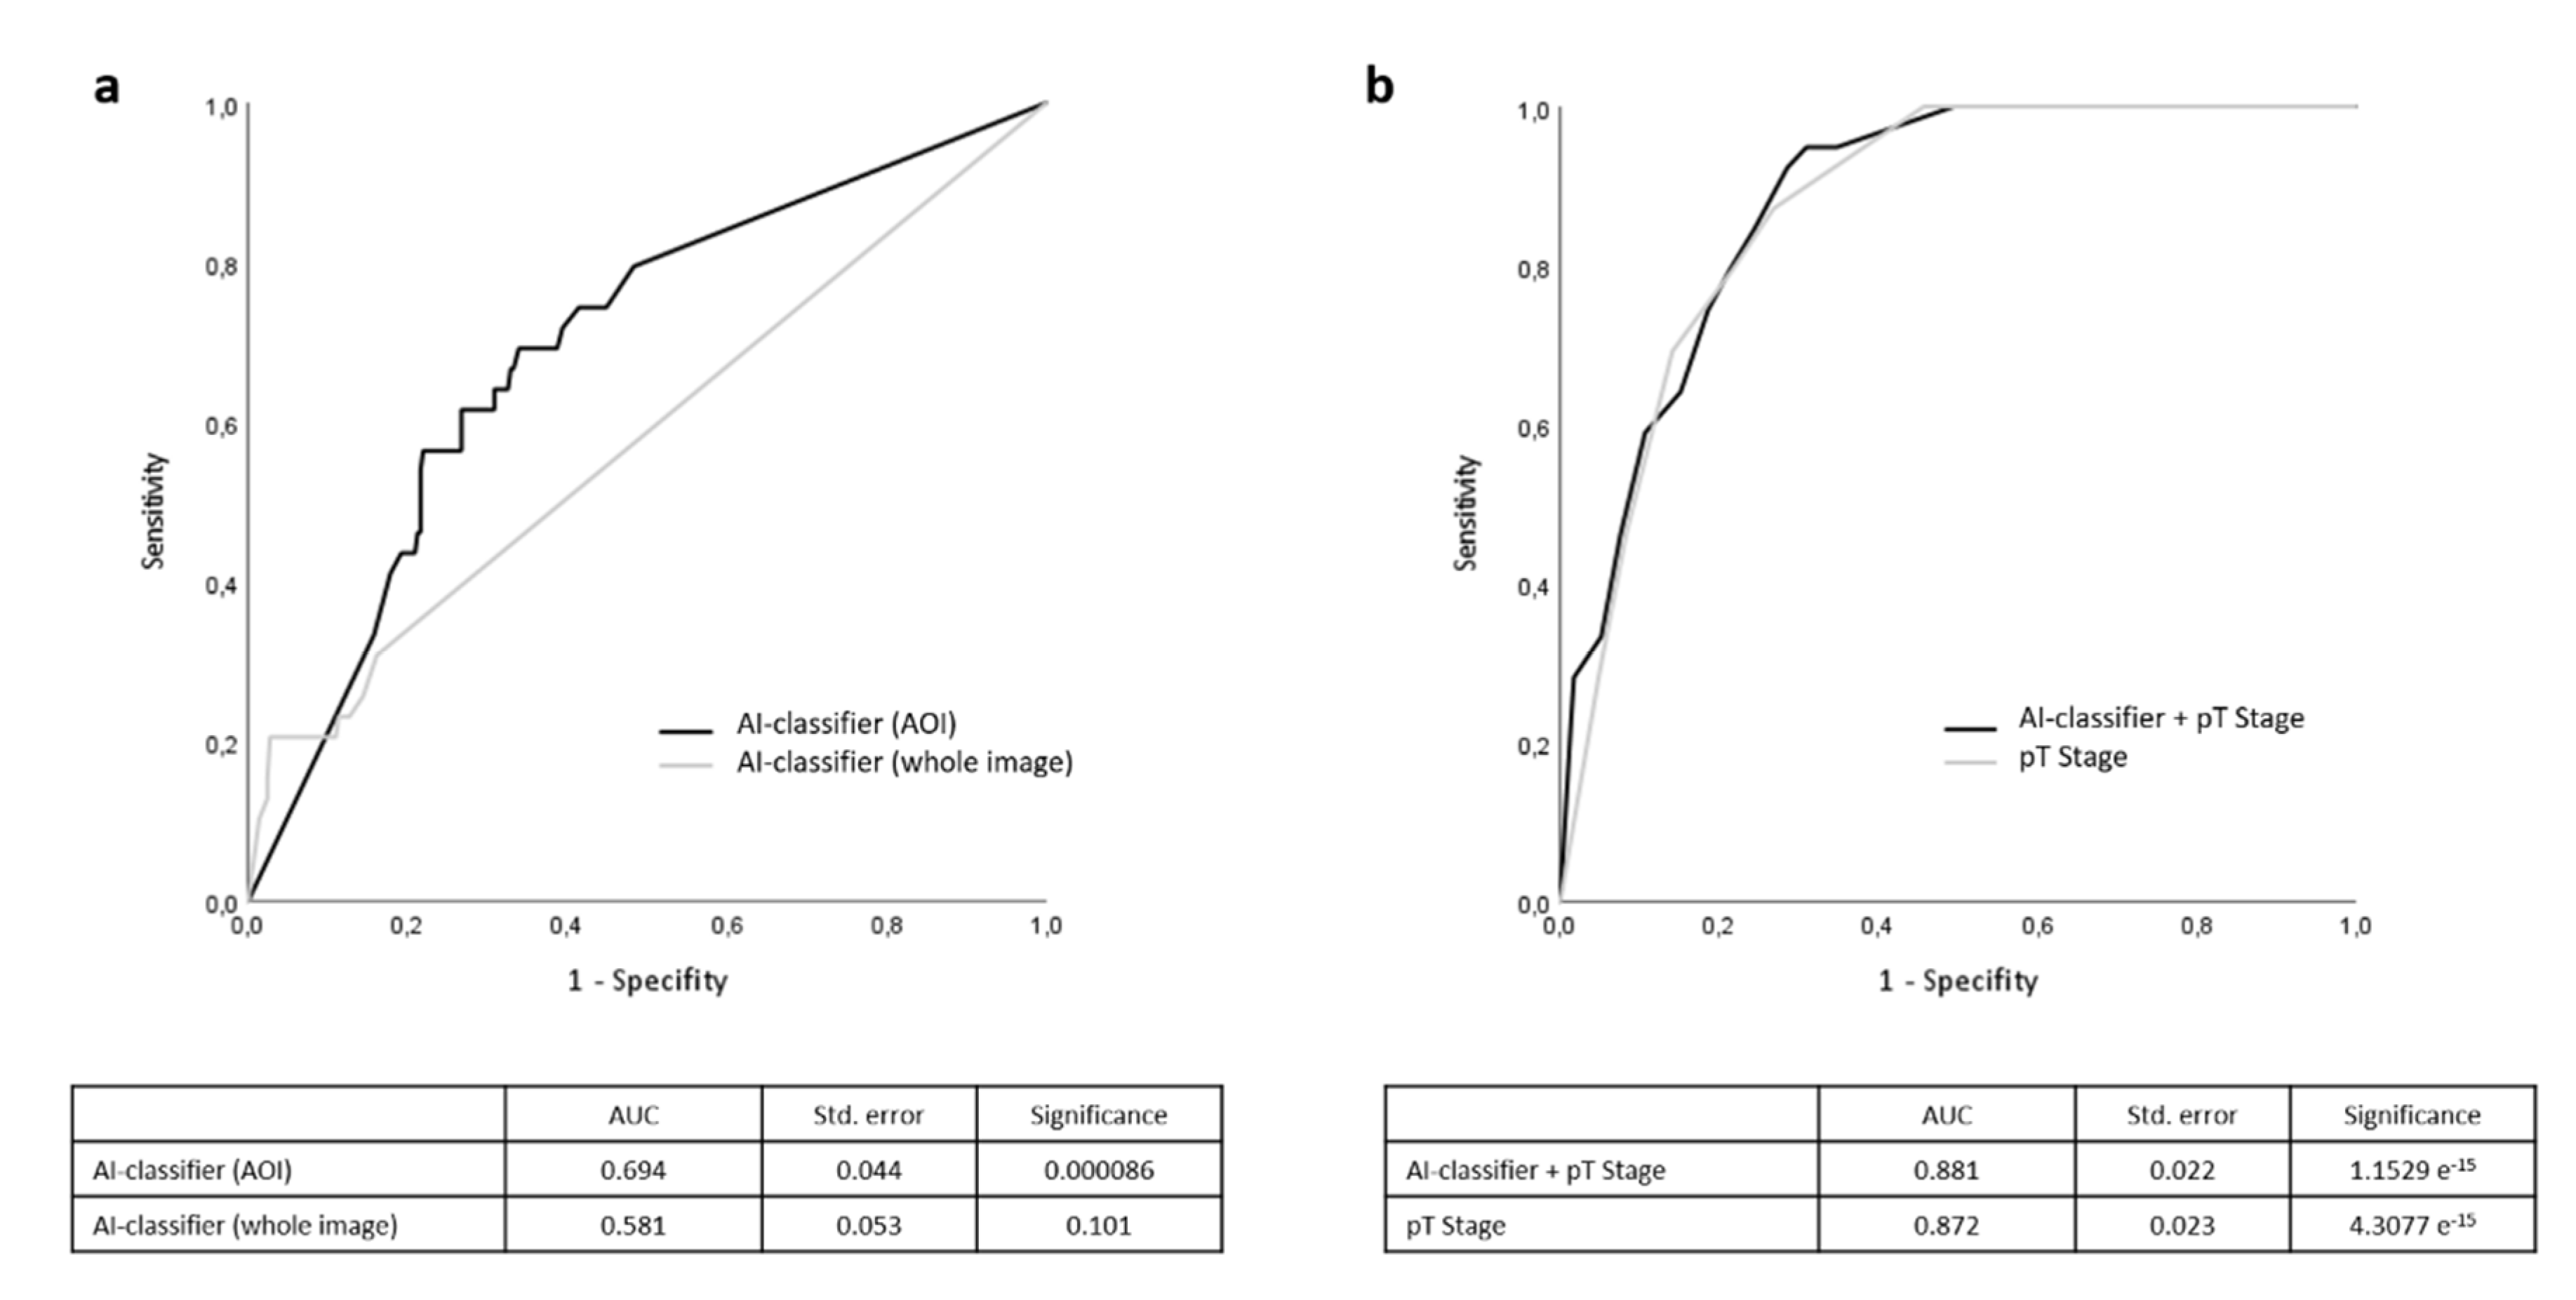
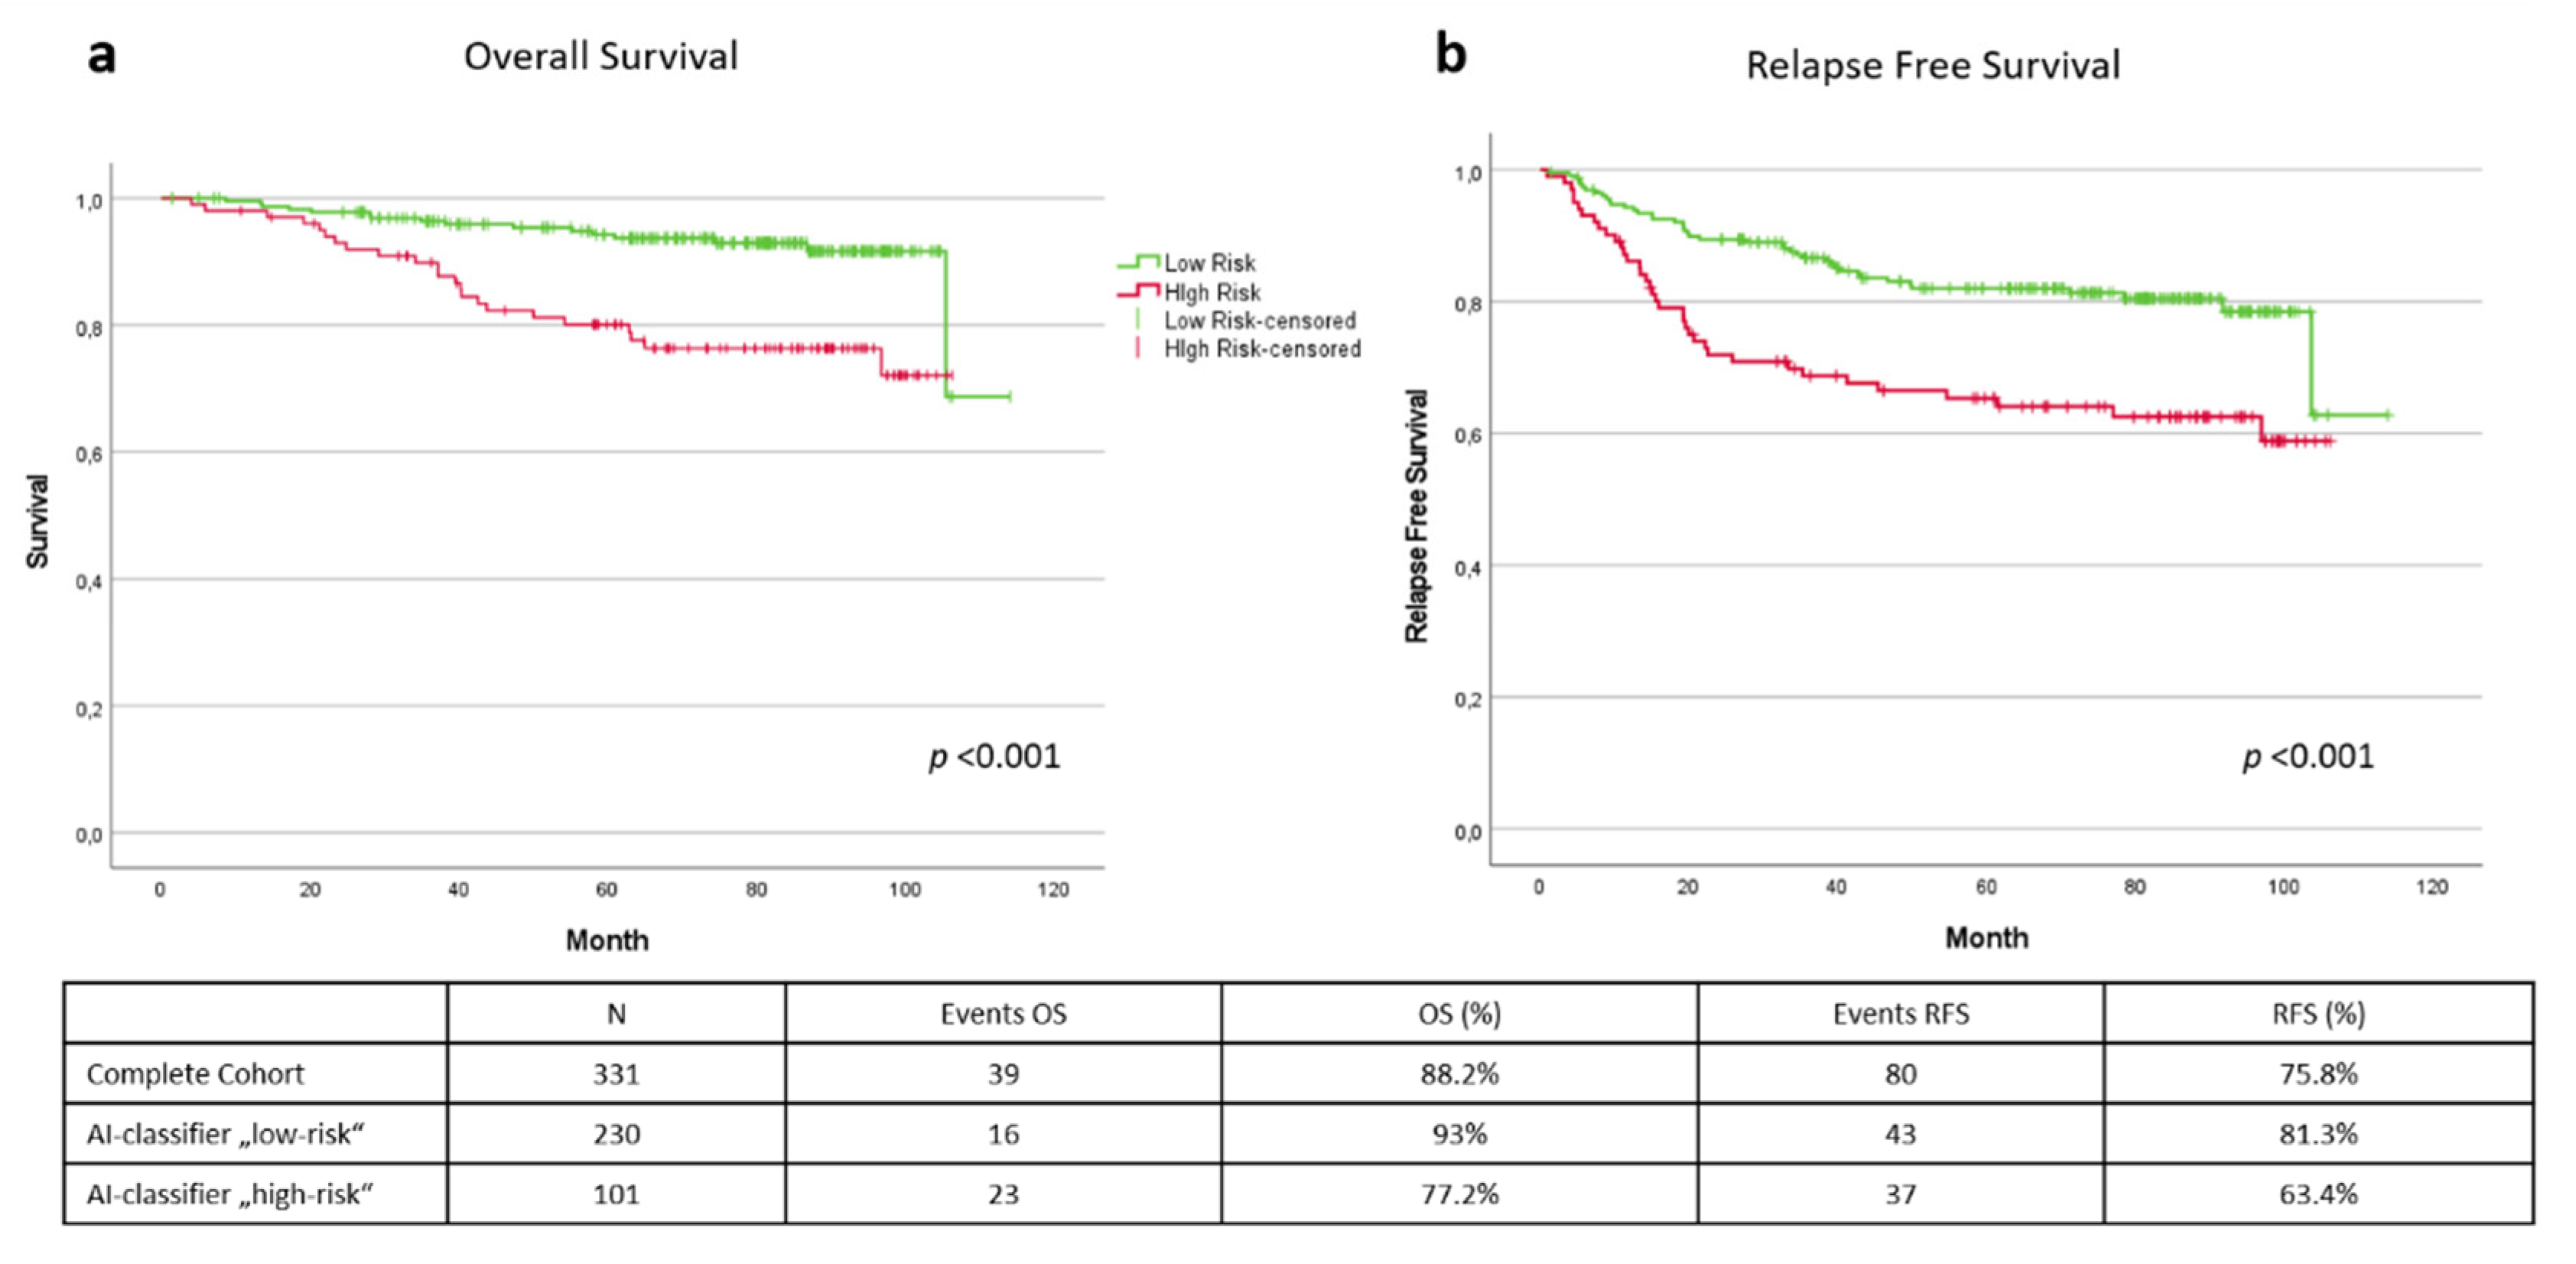
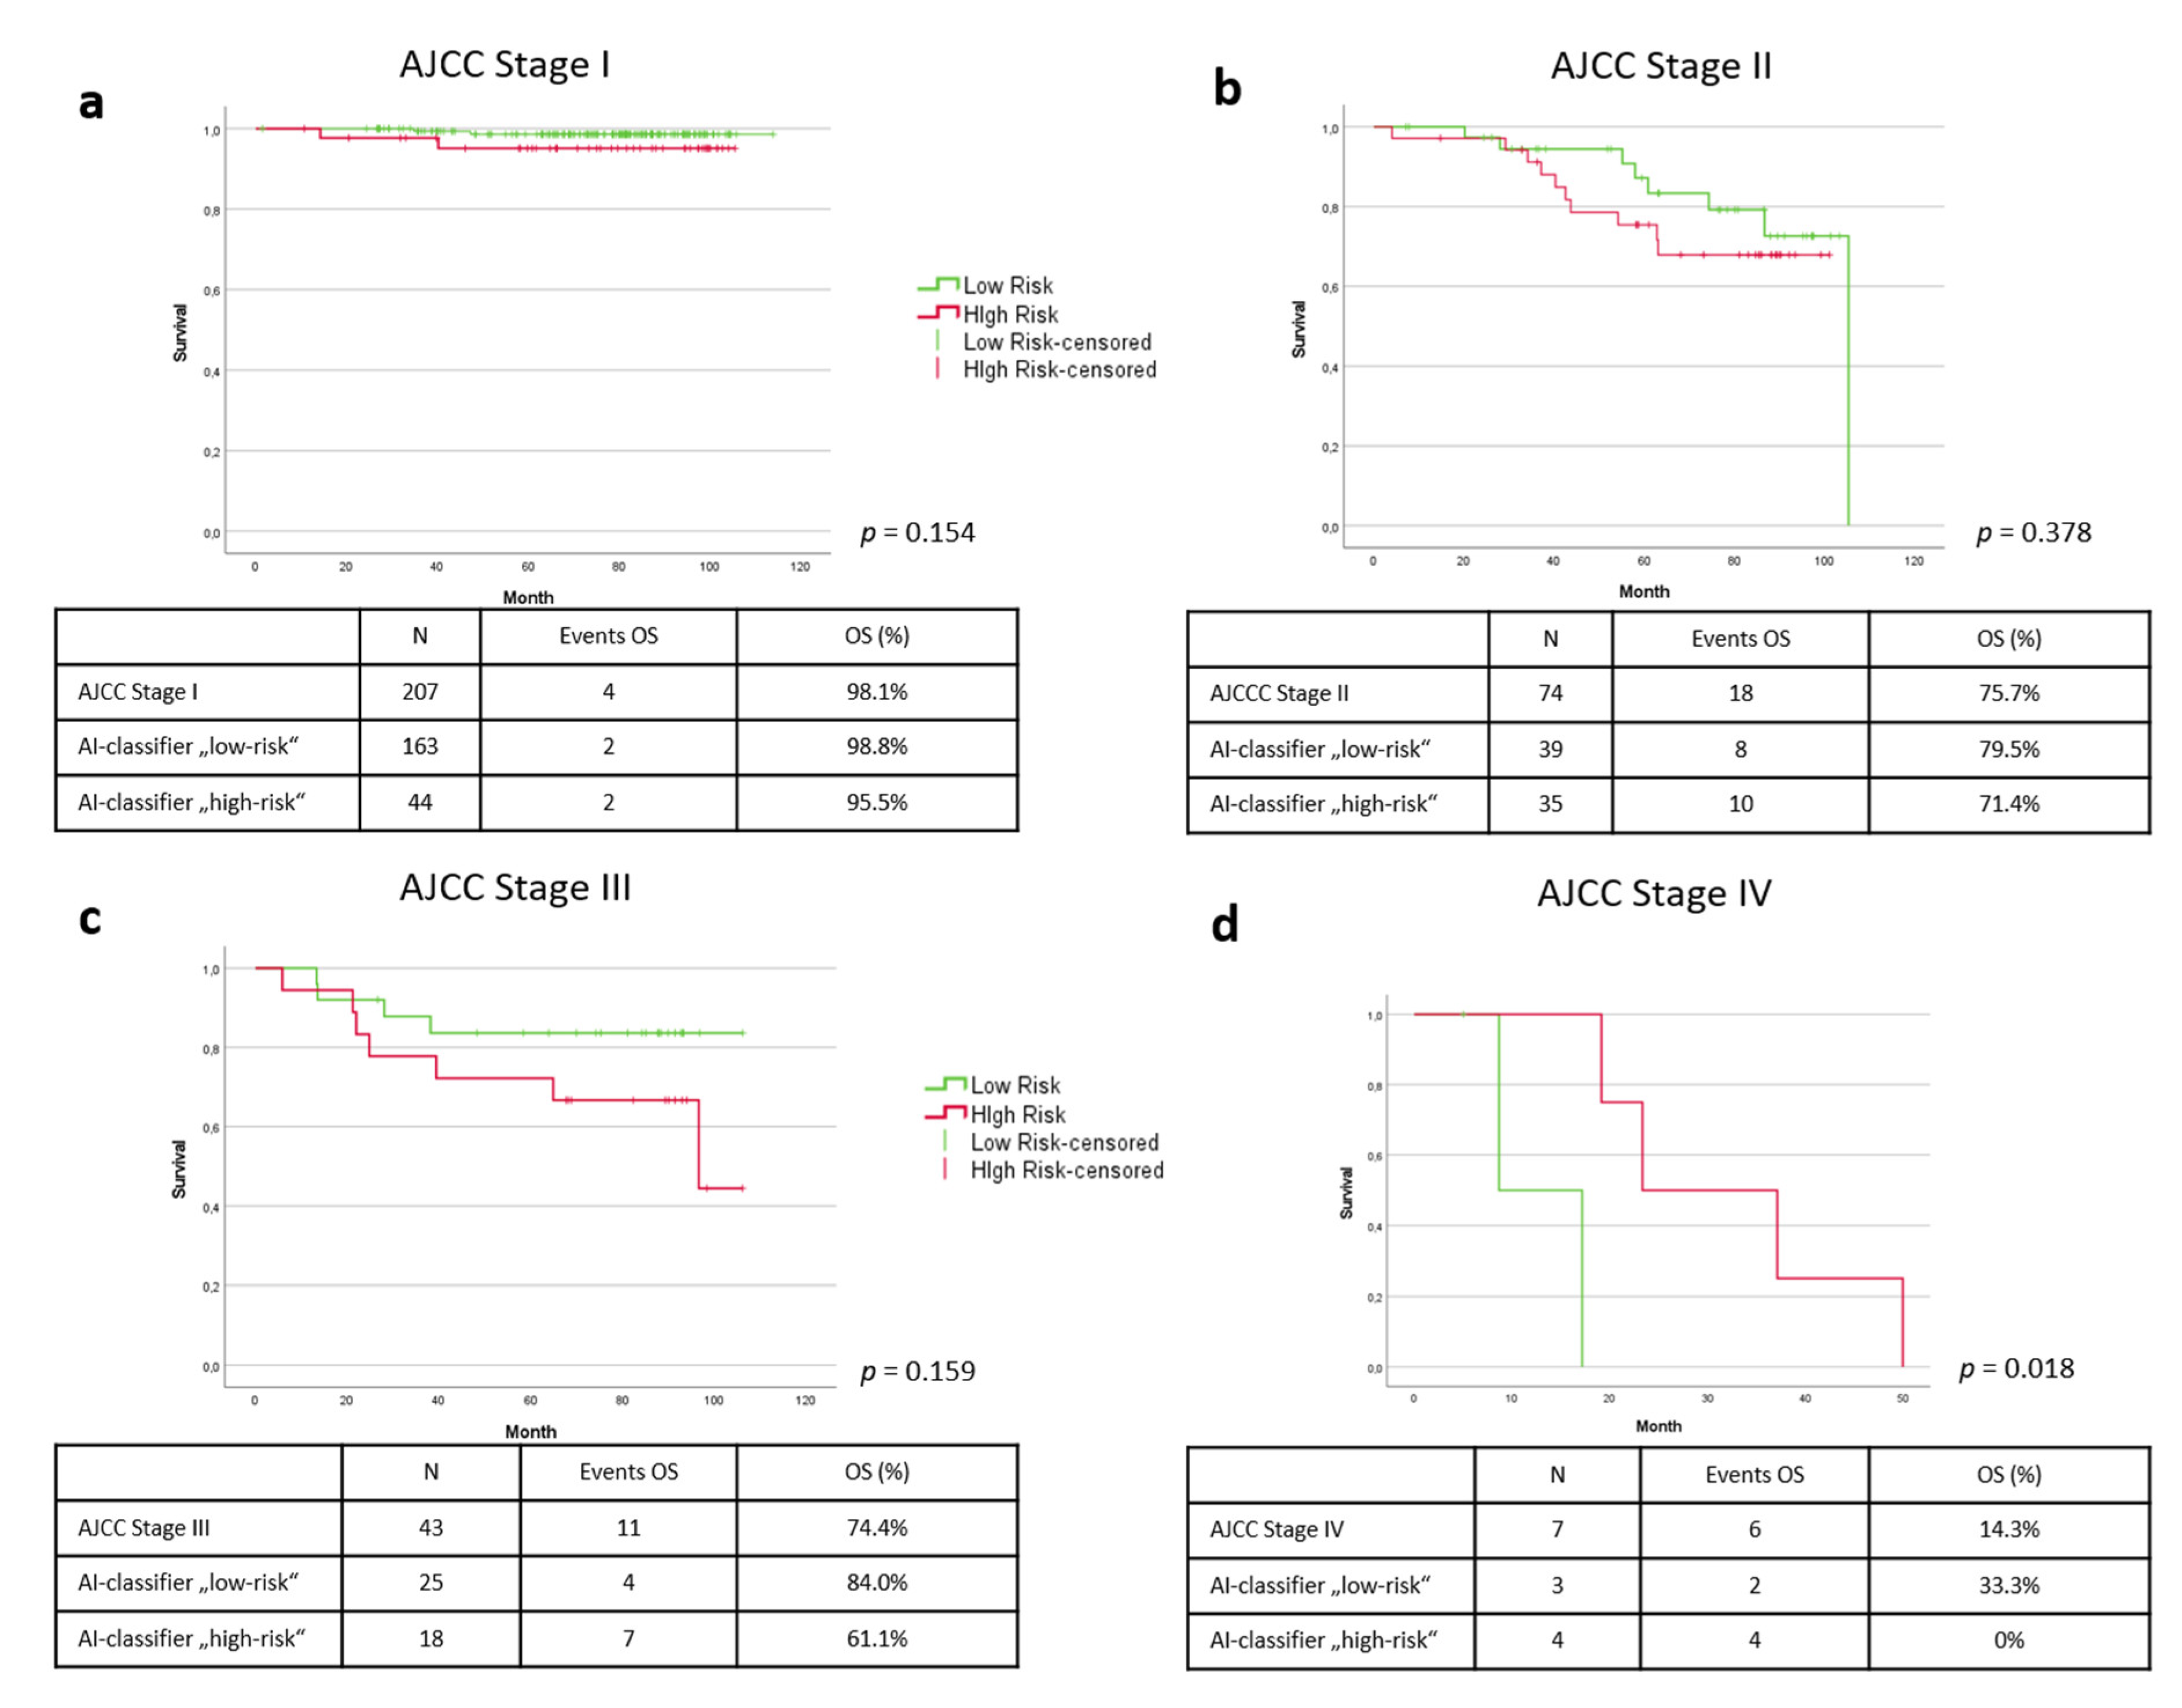
3. Results
4. Discussion
4.1. Results
4.2. Limitations
5. Conclusions
Supplementary Materials
Author Contributions
Funding
Institutional Review Board Statement
Informed Consent Statement
Data Availability Statement
Acknowledgments
Conflicts of Interest
References
- Sacchetto, L.; Zanetti, R.; Comber, H.; Bouchardy, C.; Brewster, D.; Broganelli, P.; Chirlaque, M.; Coza, D.; Galceran, J.; Gavin, A. Trends in incidence of thick, thin and in situ melanoma in Europe. Eur. J. Cancer 2018, 92, 108–118. [Google Scholar] [CrossRef] [PubMed] [Green Version]
- Schadendorf, D.; van Akkooi, A.C.; Berking, C.; Griewank, K.G.; Gutzmer, R.; Hauschild, A.; Stang, A.; Roesch, A.; Ugurel, S. Melanoma. Lancet 2018, 392, 971–984. [Google Scholar] [CrossRef]
- Elder, D.E.; Bastian, B.C.; Cree, I.A.; Massi, D.; Scolyer, R.A. The 2018 World Health Organization classification of cutaneous, mucosal, and uveal melanoma: Detailed analysis of 9 distinct subtypes defined by their evolutionary pathway. Arch. Pathol. Lab. Med. 2020, 144, 500–522. [Google Scholar] [CrossRef] [PubMed] [Green Version]
- Gershenwald, J.E.; Scolyer, R.A.; Hess, K.R.; Sondak, V.K.; Long, G.V.; Ross, M.I.; Lazar, A.J.; Faries, M.B.; Kirkwood, J.M.; McArthur, G.A. Melanoma staging: Evidence-based changes in the American Joint Committee on Cancer eighth edition cancer staging manual. Cancer J. Clin. 2017, 67, 472–492. [Google Scholar] [CrossRef] [PubMed] [Green Version]
- Evans, J.L.; Vidri, R.J.; MacGillivray, D.C.; Fitzgerald, T.L. Tumor mitotic rate is an independent predictor of survival for nonmetastatic melanoma. Surgery 2018, 164, 589–593. [Google Scholar] [CrossRef]
- Hale, C.S.; Qian, M.; Ma, M.W.; Scanlon, P.; Berman, R.S.; Shapiro, R.L.; Pavlick, A.C.; Shao, Y.; Polsky, D.; Osman, I. Mitotic rate in melanoma: Prognostic value of immunostaining and computer-assisted image analysis. Am. J. Surg. Pathol. 2013, 37, 882. [Google Scholar] [CrossRef] [Green Version]
- Ribero, S.; Moscarella, E.; Ferrara, G.; Piana, S.; Argenziano, G.; Longo, C. Regression in cutaneous melanoma: A comprehensive review from diagnosis to prognosis. J. Eur. Acad. Dermatol. Venereol. 2016, 30, 2030–2037. [Google Scholar] [CrossRef]
- Garbe, C.; Amaral, T.; Peris, K.; Hauschild, A.; Arenberger, P.; Bastholt, L.; Bataille, V.; Del Marmol, V.; Dreno, B.; Fargnoli, M.C.; et al. European consensus-based interdisciplinary guideline for melanoma. Part 1: Diagnostics—Update 2019. Eur. J. Cancer 2020, 126, 141–158. [Google Scholar] [CrossRef] [Green Version]
- Gambichler, T.; Tsagoudis, K.; Kiecker, F.; Reinhold, U.; Stockfleth, E.; Hamscho, R.; Egberts, F.; Hauschild, A.; Amaral, T.; Garbe, C. Prognostic significance of an 11-gene RNA assay in archival tissue of cutaneous melanoma stage I–III patients. Eur. J. Cancer 2021, 143, 11–18. [Google Scholar] [CrossRef]
- Amaral, T.M.S.; Hoffmann, M.C.; Sinnberg, T.; Niessner, H.; Sulberg, H.; Eigentler, T.K.; Garbe, C. Clinical validation of a prognostic 11-gene expression profiling score in prospectively collected FFPE tissue of patients with AJCC v8 stage II cutaneous melanoma. Eur. J. Cancer 2020, 125, 38–45. [Google Scholar] [CrossRef] [Green Version]
- Gerami, P.; Cook, R.W.; Wilkinson, J.; Russell, M.C.; Dhillon, N.; Amaria, R.N.; Gonzalez, R.; Lyle, S.; Johnson, C.E.; Oelschlager, K.M.; et al. Development of a prognostic genetic signature to predict the metastatic risk associated with cutaneous melanoma. Clin. Cancer Res. 2015, 21, 175–183. [Google Scholar] [CrossRef] [PubMed] [Green Version]
- Bellomo, D.; Arias-Mejias, S.M.; Ramana, C.; Heim, J.B.; Quattrocchi, E.; Sominidi-Damodaran, S.; Bridges, A.G.; Lehman, J.S.; Hieken, T.J.; Jakub, J.W.; et al. Model Combining Tumor Molecular and Clinicopathologic Risk Factors Predicts Sentinel Lymph Node Metastasis in Primary Cutaneous Melanoma. JCO Precis. Oncol. 2020, 4, 319–334. [Google Scholar] [CrossRef] [PubMed]
- Samuel, A.L. Some studies in machine learning using the game of checkers. IBM J. Res. Dev. 1959, 3, 210–229. [Google Scholar] [CrossRef]
- Forchhammer, S.; Hartmann, T. Digitale Dermatopathologie: Vorteile für Befundung, Forschung und Ausbildung. Dtsch. Dermatol. 2021, 69, 810–813. [Google Scholar] [CrossRef]
- Brinker, T.J.; Hekler, A.; Enk, A.H.; Berking, C.; Haferkamp, S.; Hauschild, A.; Weichenthal, M.; Klode, J.; Schadendorf, D.; Holland-Letz, T. Deep neural networks are superior to dermatologists in melanoma image classification. Eur. J. Cancer 2019, 119, 11–17. [Google Scholar] [CrossRef] [Green Version]
- Brinker, T.J.; Hekler, A.; Enk, A.H.; Klode, J.; Hauschild, A.; Berking, C.; Schilling, B.; Haferkamp, S.; Schadendorf, D.; Holland-Letz, T. Deep learning outperformed 136 of 157 dermatologists in a head-to-head dermoscopic melanoma image classification task. Eur. J. Cancer 2019, 113, 47–54. [Google Scholar] [CrossRef] [PubMed] [Green Version]
- Hekler, A.; Utikal, J.S.; Enk, A.H.; Hauschild, A.; Weichenthal, M.; Maron, R.C.; Berking, C.; Haferkamp, S.; Klode, J.; Schadendorf, D. Superior skin cancer classification by the combination of human and artificial intelligence. Eur. J. Cancer 2019, 120, 114–121. [Google Scholar] [CrossRef] [Green Version]
- Phillips, M.; Marsden, H.; Jaffe, W.; Matin, R.N.; Wali, G.N.; Greenhalgh, J.; McGrath, E.; James, R.; Ladoyanni, E.; Bewley, A. Assessment of accuracy of an artificial intelligence algorithm to detect melanoma in images of skin lesions. JAMA Netw. Open 2019, 2, e1913436. [Google Scholar] [CrossRef] [Green Version]
- Brinker, T.J.; Schmitt, M.; Krieghoff-Henning, E.I.; Barnhill, R.; Beltraminelli, H.; Braun, S.A.; Carr, R.; Fernandez-Figueras, M.-T.; Ferrara, G.; Fraitag, S. Diagnostic performance of artificial intelligence for histologic melanoma recognition compared to 18 international expert pathologists. J. Am. Acad. Dermatol. 2022, 86, 640–642. [Google Scholar] [CrossRef]
- Hekler, A.; Utikal, J.S.; Enk, A.H.; Berking, C.; Klode, J.; Schadendorf, D.; Jansen, P.; Franklin, C.; Holland-Letz, T.; Krahl, D.; et al. Pathologist-level classification of histopathological melanoma images with deep neural networks. Eur. J. Cancer 2019, 115, 79–83. [Google Scholar] [CrossRef] [Green Version]
- Hekler, A.; Utikal, J.S.; Enk, A.H.; Solass, W.; Schmitt, M.; Klode, J.; Schadendorf, D.; Sondermann, W.; Franklin, C.; Bestvater, F.; et al. Deep learning outperformed 11 pathologists in the classification of histopathological melanoma images. Eur. J. Cancer 2019, 118, 91–96. [Google Scholar] [CrossRef] [PubMed] [Green Version]
- Hart, S.N.; Flotte, W.; Norgan, A.P.; Shah, K.K.; Buchan, Z.R.; Mounajjed, T.; Flotte, T.J. Classification of melanocytic lesions in selected and whole-slide images via convolutional neural networks. J. Pathol. Inform. 2019, 10, 5. [Google Scholar] [CrossRef] [PubMed]
- Ianni, J.D.; Soans, R.E.; Sankarapandian, S.; Chamarthi, R.V.; Ayyagari, D.; Olsen, T.G.; Bonham, M.J.; Stavish, C.C.; Motaparthi, K.; Cockerell, C.J. Tailored for real-world: A whole slide image classification system validated on uncurated multi-site data emulating the prospective pathology workload. Sci. Rep. 2020, 10, 3217. [Google Scholar] [CrossRef] [PubMed] [Green Version]
- Jiang, Y.; Xiong, J.; Li, H.; Yang, X.; Yu, W.; Gao, M.; Zhao, X.; Ma, Y.; Zhang, W.; Guan, Y. Recognizing basal cell carcinoma on smartphone-captured digital histopathology images with a deep neural network. Br. J. Dermatol. 2020, 182, 754–762. [Google Scholar] [CrossRef]
- Brinker, T.J.; Kiehl, L.; Schmitt, M.; Jutzi, T.B.; Krieghoff-Henning, E.I.; Krahl, D.; Kutzner, H.; Gholam, P.; Haferkamp, S.; Klode, J. Deep learning approach to predict sentinel lymph node status directly from routine histology of primary melanoma tumours. Eur. J. Cancer 2021, 154, 227–234. [Google Scholar] [CrossRef]
- Kulkarni, P.M.; Robinson, E.J.; Sarin Pradhan, J.; Gartrell-Corrado, R.D.; Rohr, B.R.; Trager, M.H.; Geskin, L.J.; Kluger, H.M.; Wong, P.F.; Acs, B.; et al. Deep Learning Based on Standard H&E Images of Primary Melanoma Tumors Identifies Patients at Risk for Visceral Recurrence and Death. Clin. Cancer Res. 2020, 26, 1126–1134. [Google Scholar]
- Johannet, P.; Coudray, N.; Donnelly, D.M.; Jour, G.; Illa-Bochaca, I.; Xia, Y.; Johnson, D.B.; Wheless, L.; Patrinely, J.R.; Nomikou, S. Using machine learning algorithms to predict immunotherapy response in patients with advanced melanoma. Clin. Cancer Res. 2021, 27, 131–140. [Google Scholar] [CrossRef]
- Moore, M.R.; Friesner, I.D.; Rizk, E.M.; Fullerton, B.T.; Mondal, M.; Trager, M.H.; Mendelson, K.; Chikeka, I.; Kurc, T.; Gupta, R. Automated digital TIL analysis (ADTA) adds prognostic value to standard assessment of depth and ulceration in primary melanoma. Sci. Rep. 2021, 11, 2809. [Google Scholar] [CrossRef]
- Taylor, R.C.; Patel, A.; Panageas, K.S.; Busam, K.J.; Brady, M.S. Tumor-infiltrating lymphocytes predict sentinel lymph node positivity in patients with cutaneous melanoma. J. Clin. Oncol. 2007, 25, 869–875. [Google Scholar] [CrossRef]
- Yang, J.; Lian, J.W.; Chin, Y.-P.H.; Wang, L.; Lian, A.; Murphy, G.F.; Zhou, L. Assessing the Prognostic Significance of Tumor-Infiltrating Lymphocytes in Patients with Melanoma Using Pathologic Features Identified by Natural Language Processing. JAMA Netw. Open 2021, 4, e2126337. [Google Scholar] [CrossRef]
- Google.com. Teachable Machine: Train a Computer to Recognize Your Own Images, Sounds, Poses. Available online: https://teachablemachine.withgoogle.com (accessed on 3 January 2022).
- Jeong, H. Feasibility Study of Google’s Teachable Machine in Diagnosis of Tooth-Marked Tongue. J. Dent. Hyg. Sci. 2020, 20, 206–212. [Google Scholar]
- Warnat-Herresthal, S.; Schultze, H.; Shastry, K.L.; Manamohan, S.; Mukherjee, S.; Garg, V.; Sarveswara, R.; Handler, K.; Pickkers, P.; Aziz, N.A.; et al. Swarm Learning for decentralized and confidential clinical machine learning. Nature 2021, 594, 265–270. [Google Scholar] [CrossRef] [PubMed]
- Courtiol, P.; Maussion, C.; Moarii, M.; Pronier, E.; Pilcer, S.; Sefta, M.; Manceron, P.; Toldo, S.; Zaslavskiy, M.; Le Stang, N. Deep learning-based classification of mesothelioma improves prediction of patient outcome. Nat. Med. 2019, 25, 1519–1525. [Google Scholar] [CrossRef] [PubMed]


| Demographics and Tumor Parameters | All (n = 831) | Training Cohort (n = 500) | Test Cohort (n = 331) |
|---|---|---|---|
| Age at Diagnosis (years) | |||
| Min./Max. | 7/93 | 9/93 | 7/91 |
| Median (+IQR) | 62 (49/72) | 63 (50/73) | 59 (48/71) |
| Mean value (±SD) | 59.88 (±15.3) | 61.06 (±15.0) | 58.11 (±15.7) |
| Sex (n, %) | |||
| Male (n, %) | 462 (55.6%) | 285 (57%) | 177 (53.5%) |
| Female (n, %) | 369 (44.4%) | 215 (43%) | 154 (46.5%) |
| Primary tumor | |||
| Tumor thickness (Breslow, mm), Median (+IQR) | 1.05 (0.5/2.4) | 1.00 (0.45/2.2) | 1.10 (0.55/2.5) |
| Ulceration (n, %) | 177 (21.3%) | 103 (20.6%) | 74 (22.4%) |
| Histologic subtype | |||
| Superficially spreading melanoma (SSM) (n, %) | 493 (59.3%) | 303 (60.6%) | 190 (57.4%) |
| Nodular melanoma (NM) (n, %) | 134 (16.1%) | 75 (15.0%) | 59 (17.8%) |
| Lentigo Maligna melanoma (LMM) (n, %) | 76 (9.1%) | 52 (10.4%) | 24 (7.3%) |
| Acrolentiginous melanoma (ALM) (n, %) | 50 (6.0%) | 27 (5.4%) | 23 (6.9%) |
| Others (n, %) | 47 (5.7%) | 27 (5.4%) | 20 (6.0%) |
| Unknown (n, %) | 29 (3.5%) | 15 (3.0%) | 14 (4.2%) |
| Localisation | |||
| Head/neck (n, %) | 147 (17.7%) | 91 (18.2%) | 56 (16.9%) |
| Trunk (n, %) | 344 (41.4%) | 224 (44.8%) | 120 (36.3%) |
| Upper Extremities (n, %) | 117 (14.1%) | 67 (13.4%) | 50 (15.1%) |
| Lower Extremities (n, %) | 219 (26.4%) | 116 (23.2%) | 103 (31.1%) |
| Others/unknown (n, %) | 4 (0.4%) | 2 (0.4%) | 2 (0.6%) |
| Stage (AJCC 2017) | |||
| IA (n, %) | 401 (48.3%) | 248 (49.6%) | 153 (46.2%) |
| IB (n, %) | 133 (16.0%) | 79 (15.8%) | 54 (16.3%) |
| IIA (n, %) | 80 (9.6%) | 45 (9%) | 35 (10.6%) |
| IIB (n, %) | 60 (7.2%) | 37 (7.4%) | 23 (6.9%) |
| IIC (n, %) | 35 (4.2%) | 19 (3.8%) | 16 (4.8%) |
| IIIA (n, %) | 24 (2.9%) | 14 (2.8%) | 10 (3%) |
| IIIB (n, %) | 23 (2.8%) | 15 (3%) | 8 (2.4%) |
| IIIC (n, %) | 62 (7.5%) | 37 (7.4%) | 25 (7.6%) |
| IIID (n, %) | 2 (0.2%) | 2 (0.4%) | 0 |
| IV (n, %) | 11 (1.3%) | 4 (0.8%) | 7 (2.1%) |
Publisher’s Note: MDPI stays neutral with regard to jurisdictional claims in published maps and institutional affiliations. |
© 2022 by the authors. Licensee MDPI, Basel, Switzerland. This article is an open access article distributed under the terms and conditions of the Creative Commons Attribution (CC BY) license (https://creativecommons.org/licenses/by/4.0/).
Share and Cite
Forchhammer, S.; Abu-Ghazaleh, A.; Metzler, G.; Garbe, C.; Eigentler, T. Development of an Image Analysis-Based Prognosis Score Using Google’s Teachable Machine in Melanoma. Cancers 2022, 14, 2243. https://doi.org/10.3390/cancers14092243
Forchhammer S, Abu-Ghazaleh A, Metzler G, Garbe C, Eigentler T. Development of an Image Analysis-Based Prognosis Score Using Google’s Teachable Machine in Melanoma. Cancers. 2022; 14(9):2243. https://doi.org/10.3390/cancers14092243
Chicago/Turabian StyleForchhammer, Stephan, Amar Abu-Ghazaleh, Gisela Metzler, Claus Garbe, and Thomas Eigentler. 2022. "Development of an Image Analysis-Based Prognosis Score Using Google’s Teachable Machine in Melanoma" Cancers 14, no. 9: 2243. https://doi.org/10.3390/cancers14092243