
Efficient Small Extracellular Vesicles (EV) Isolation Method and Evaluation of EV-Associated DNA Role in Cell–Cell Communication in Cancer

 ,
,  , , , , and
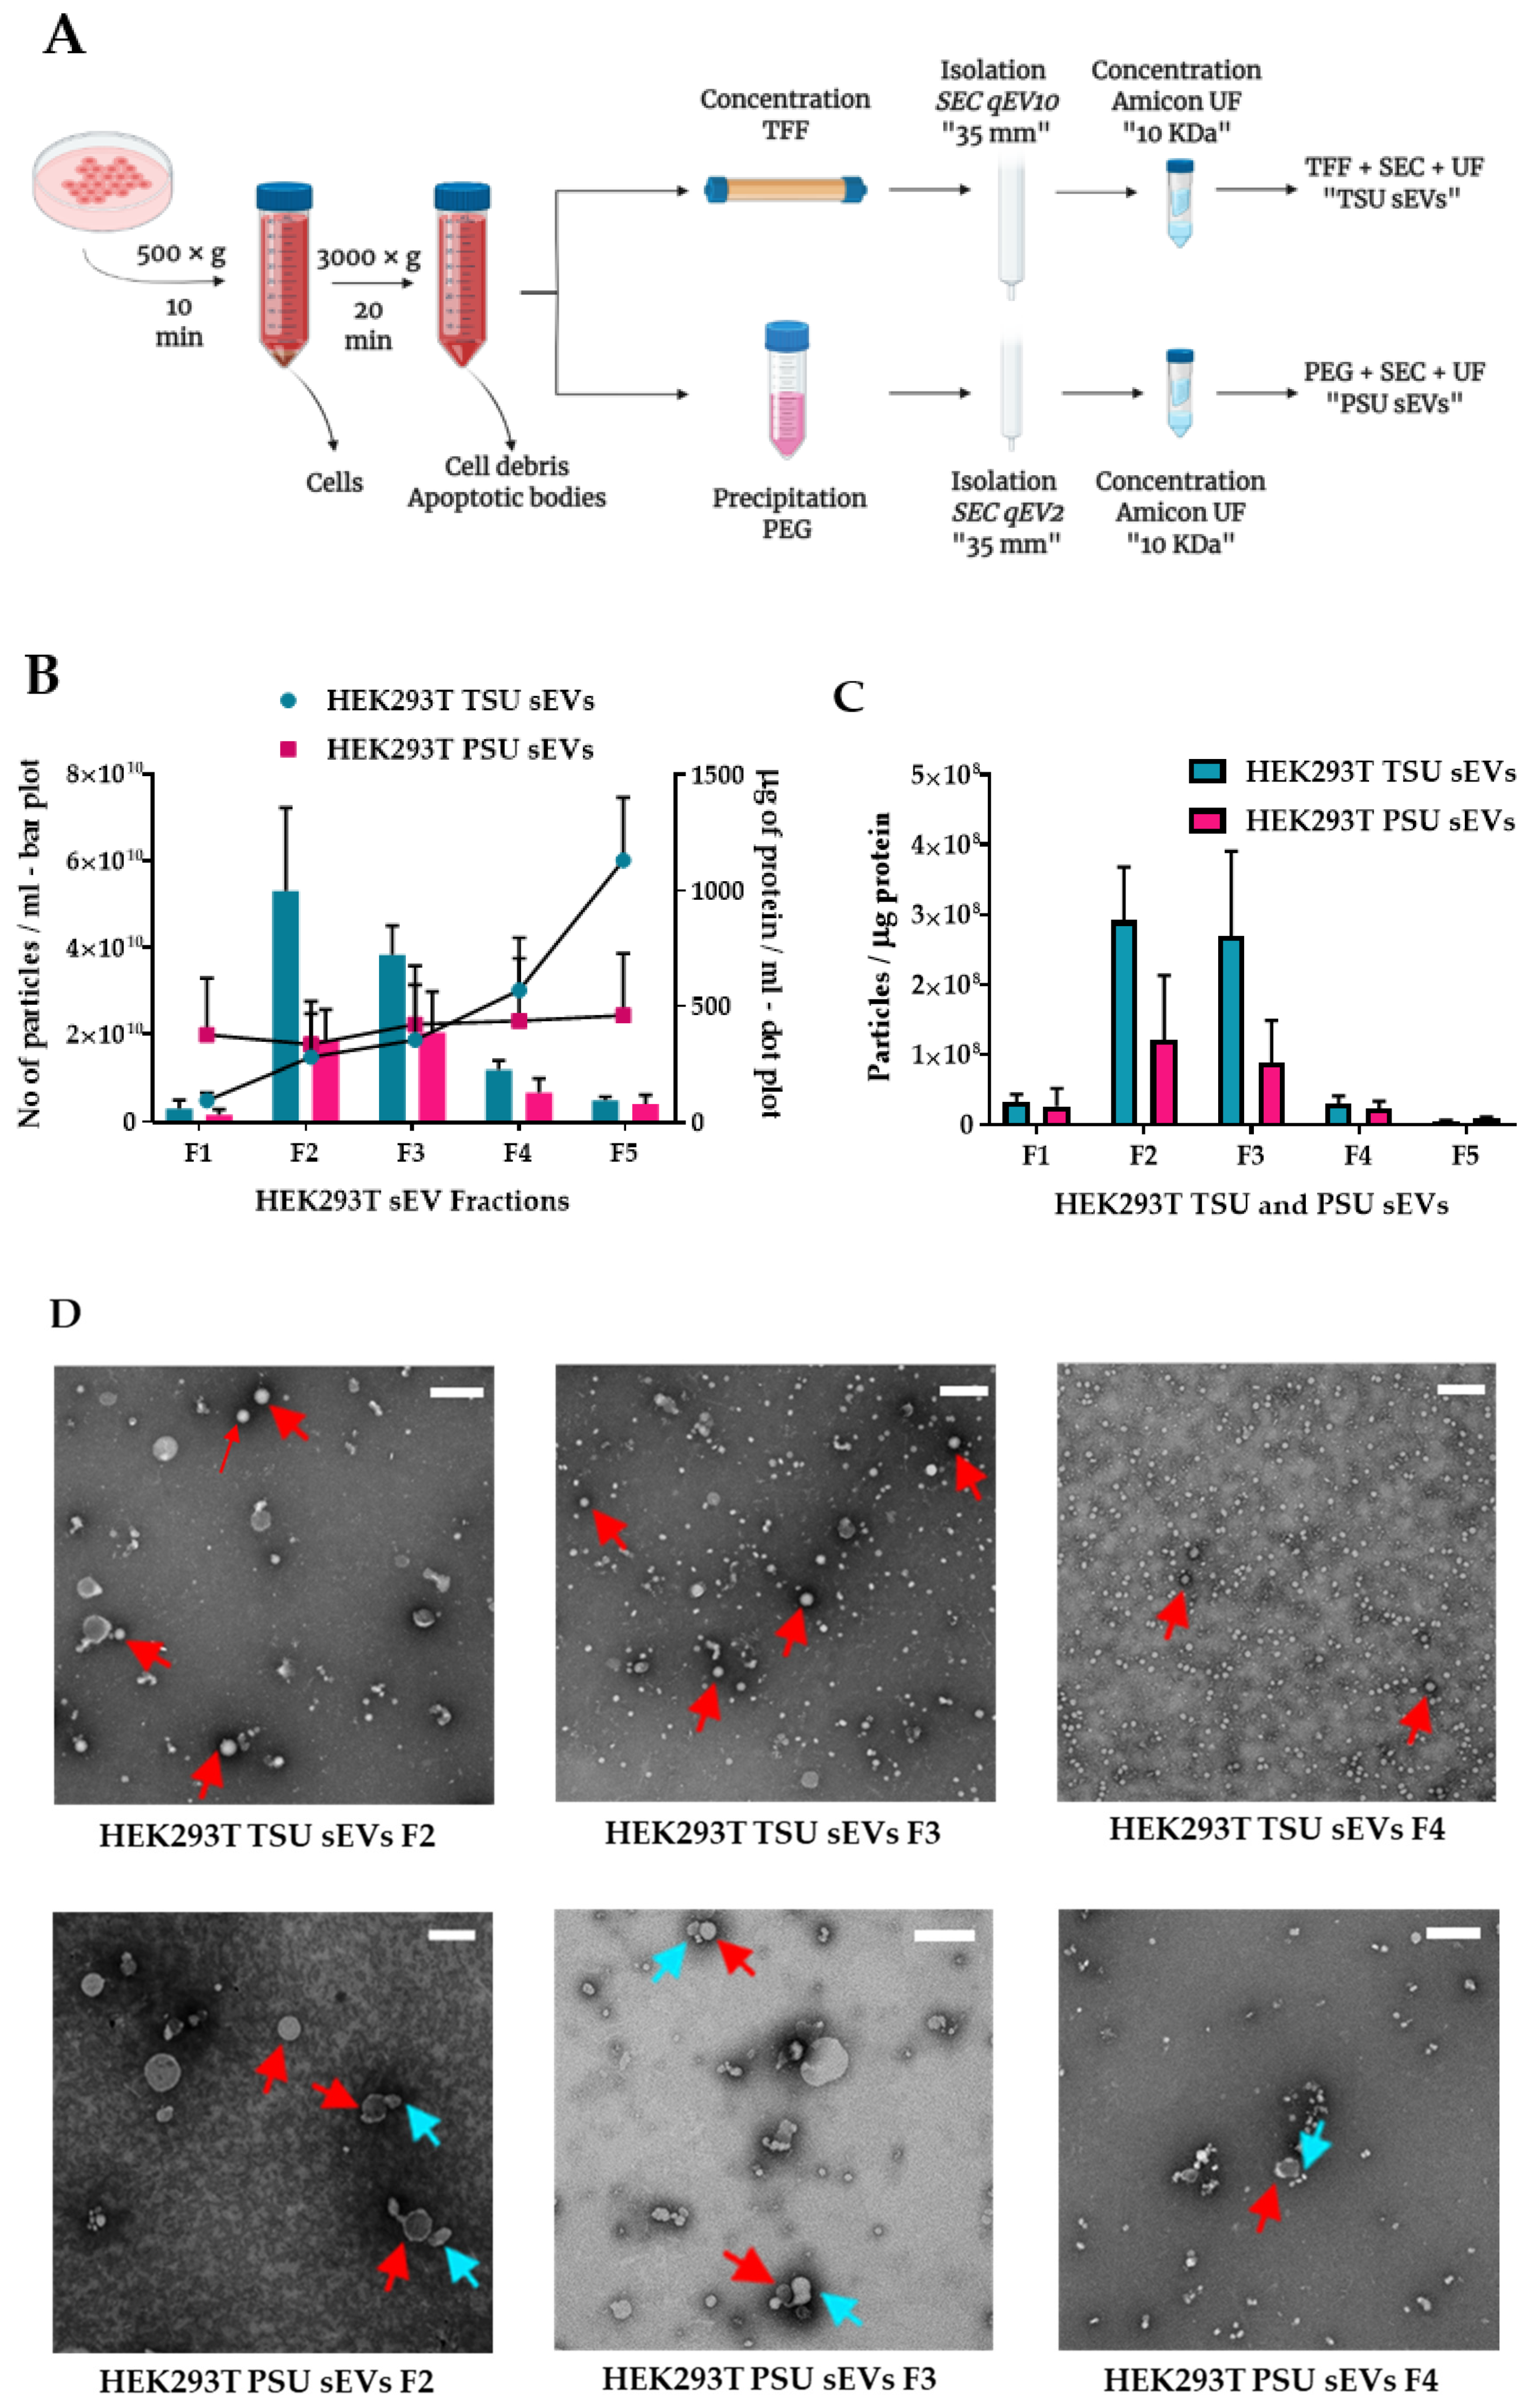
Abstract
:Simple Summary
Abstract
1. Introduction
2. Materials and Methods
2.1. Cells and Cell Culture
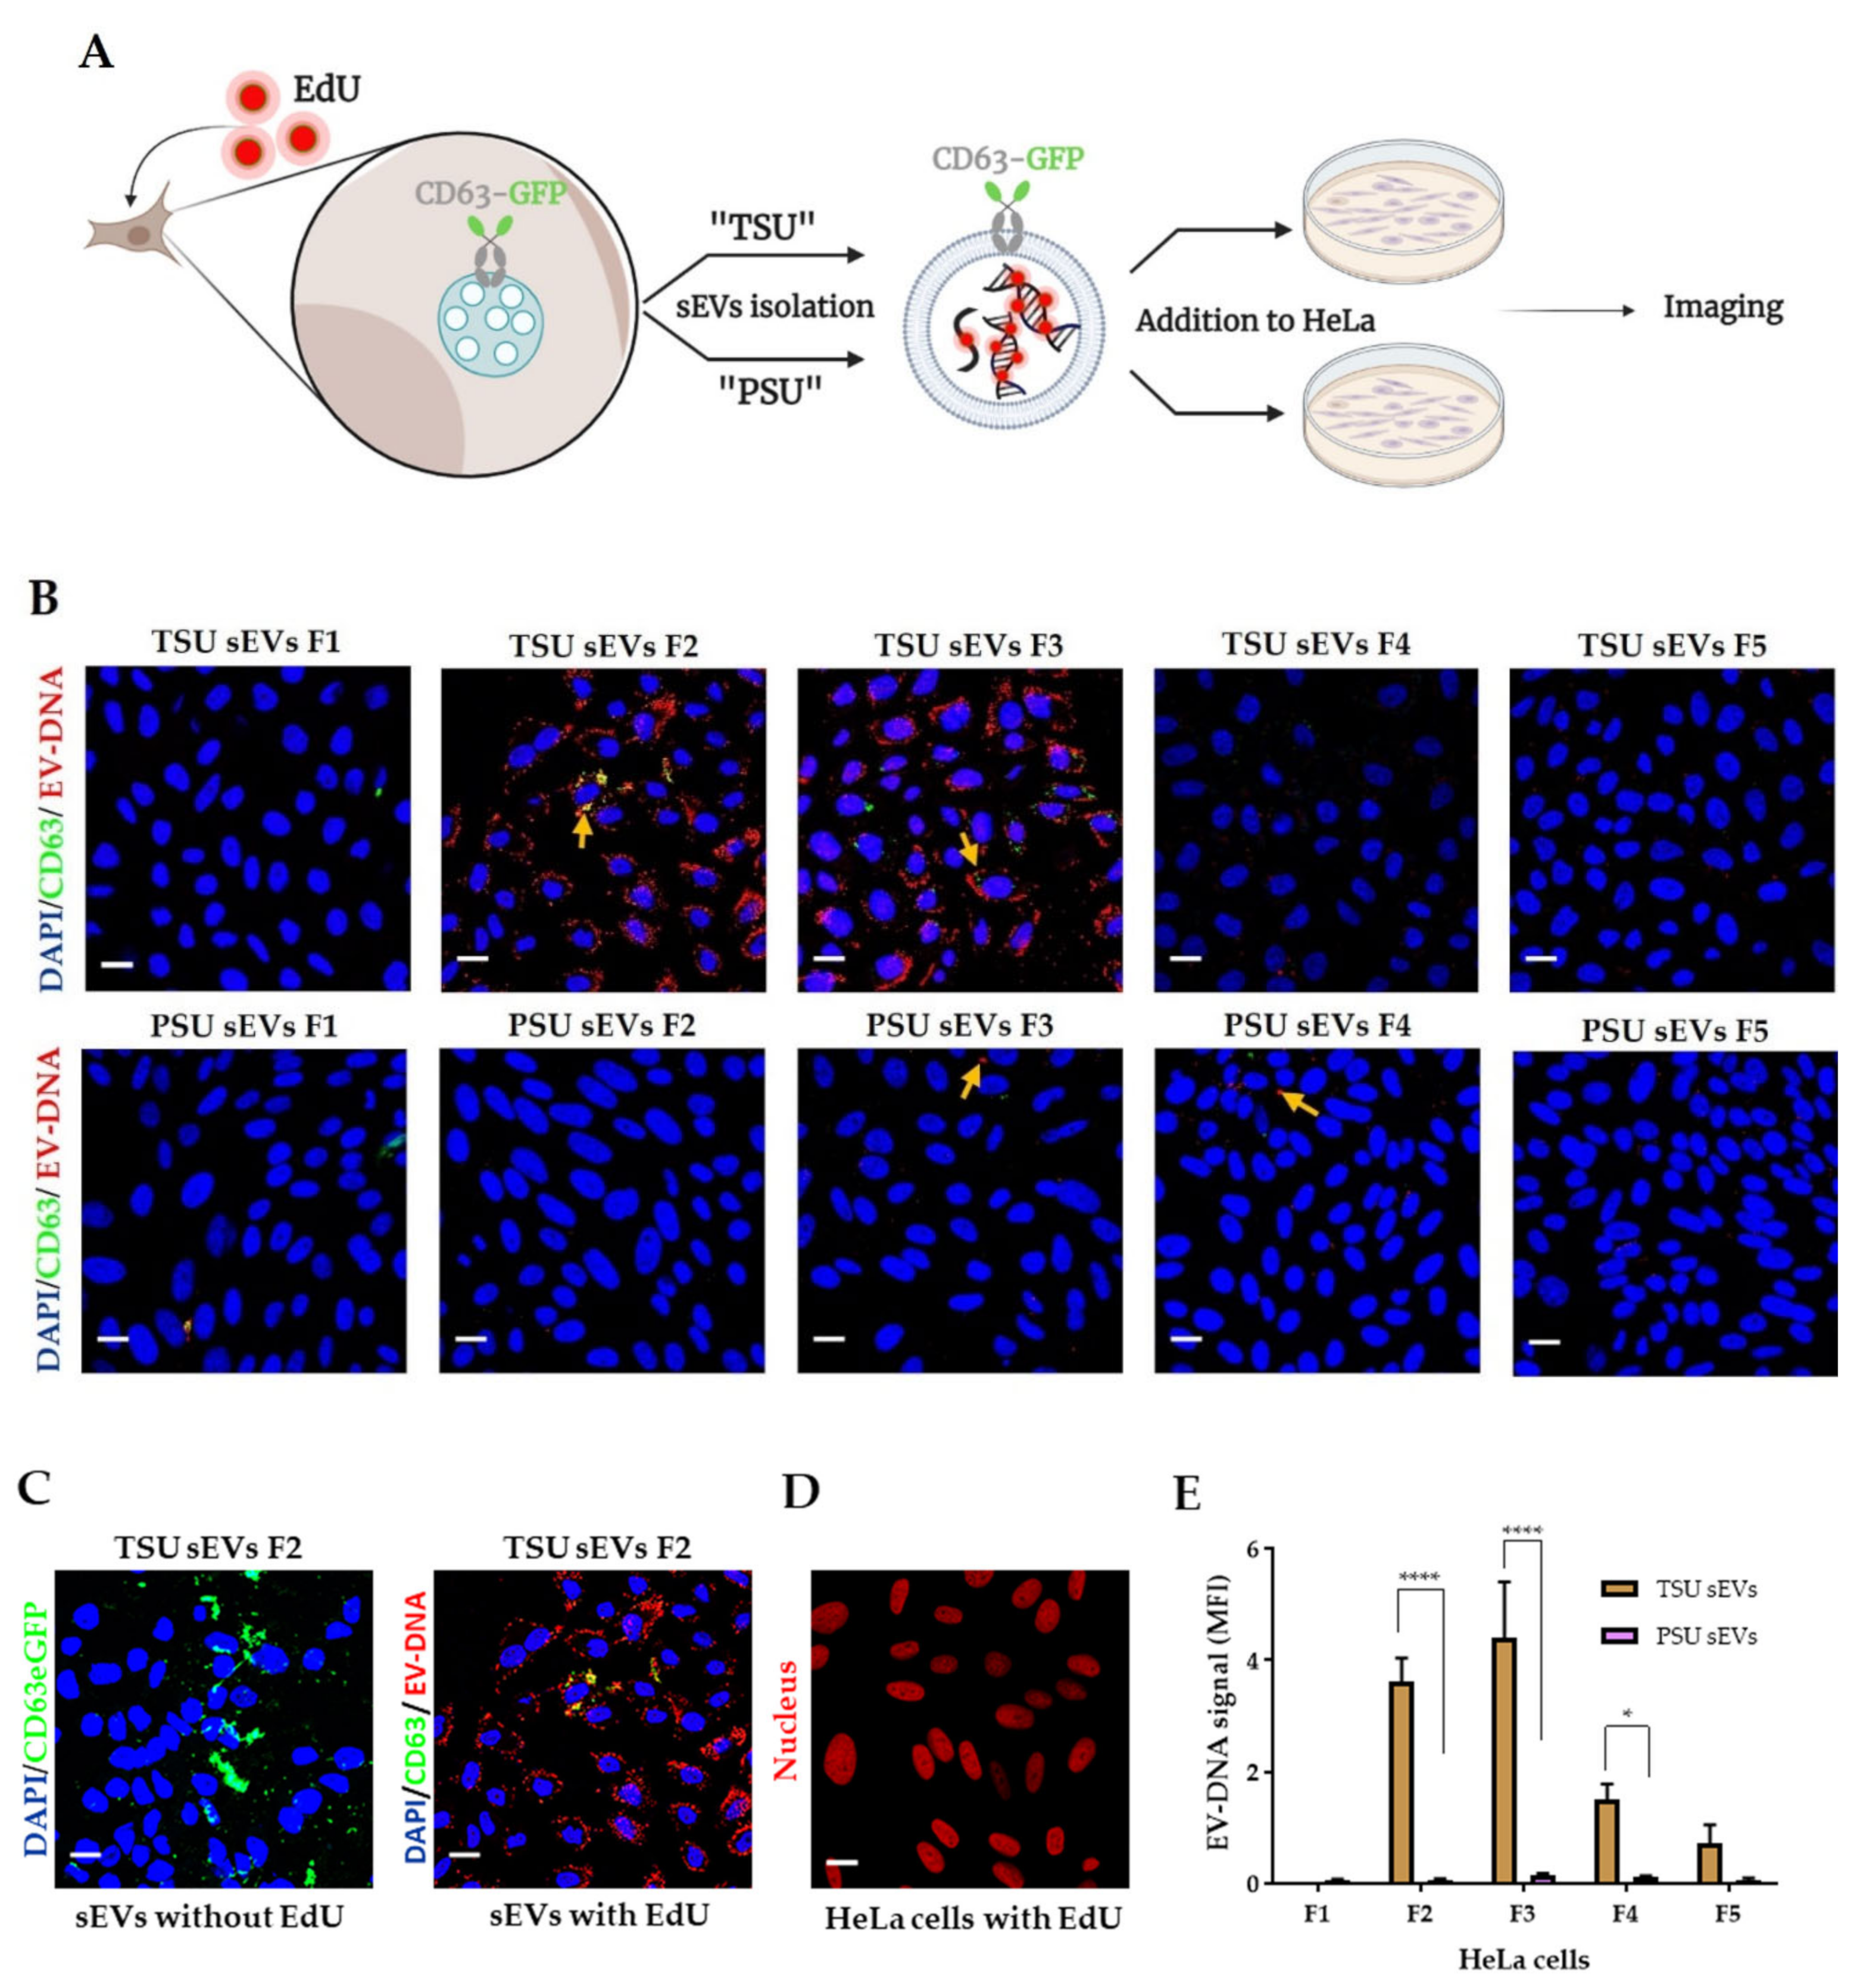
2.2. Isolation of Small EVs by TSU and PSU
2.3. Characterization of TSU and PSU sEVs
2.3.1. Measurement of Particle Count and Total Protein Concentration
2.3.2. Transmission Electron Microscopy (TEM)
2.3.3. Western Blot Analysis
2.3.4. Bead-Assisted Flow Cytometry
2.4. Application of TSU and PSU sEVs for Diagnostics and Functional Studies
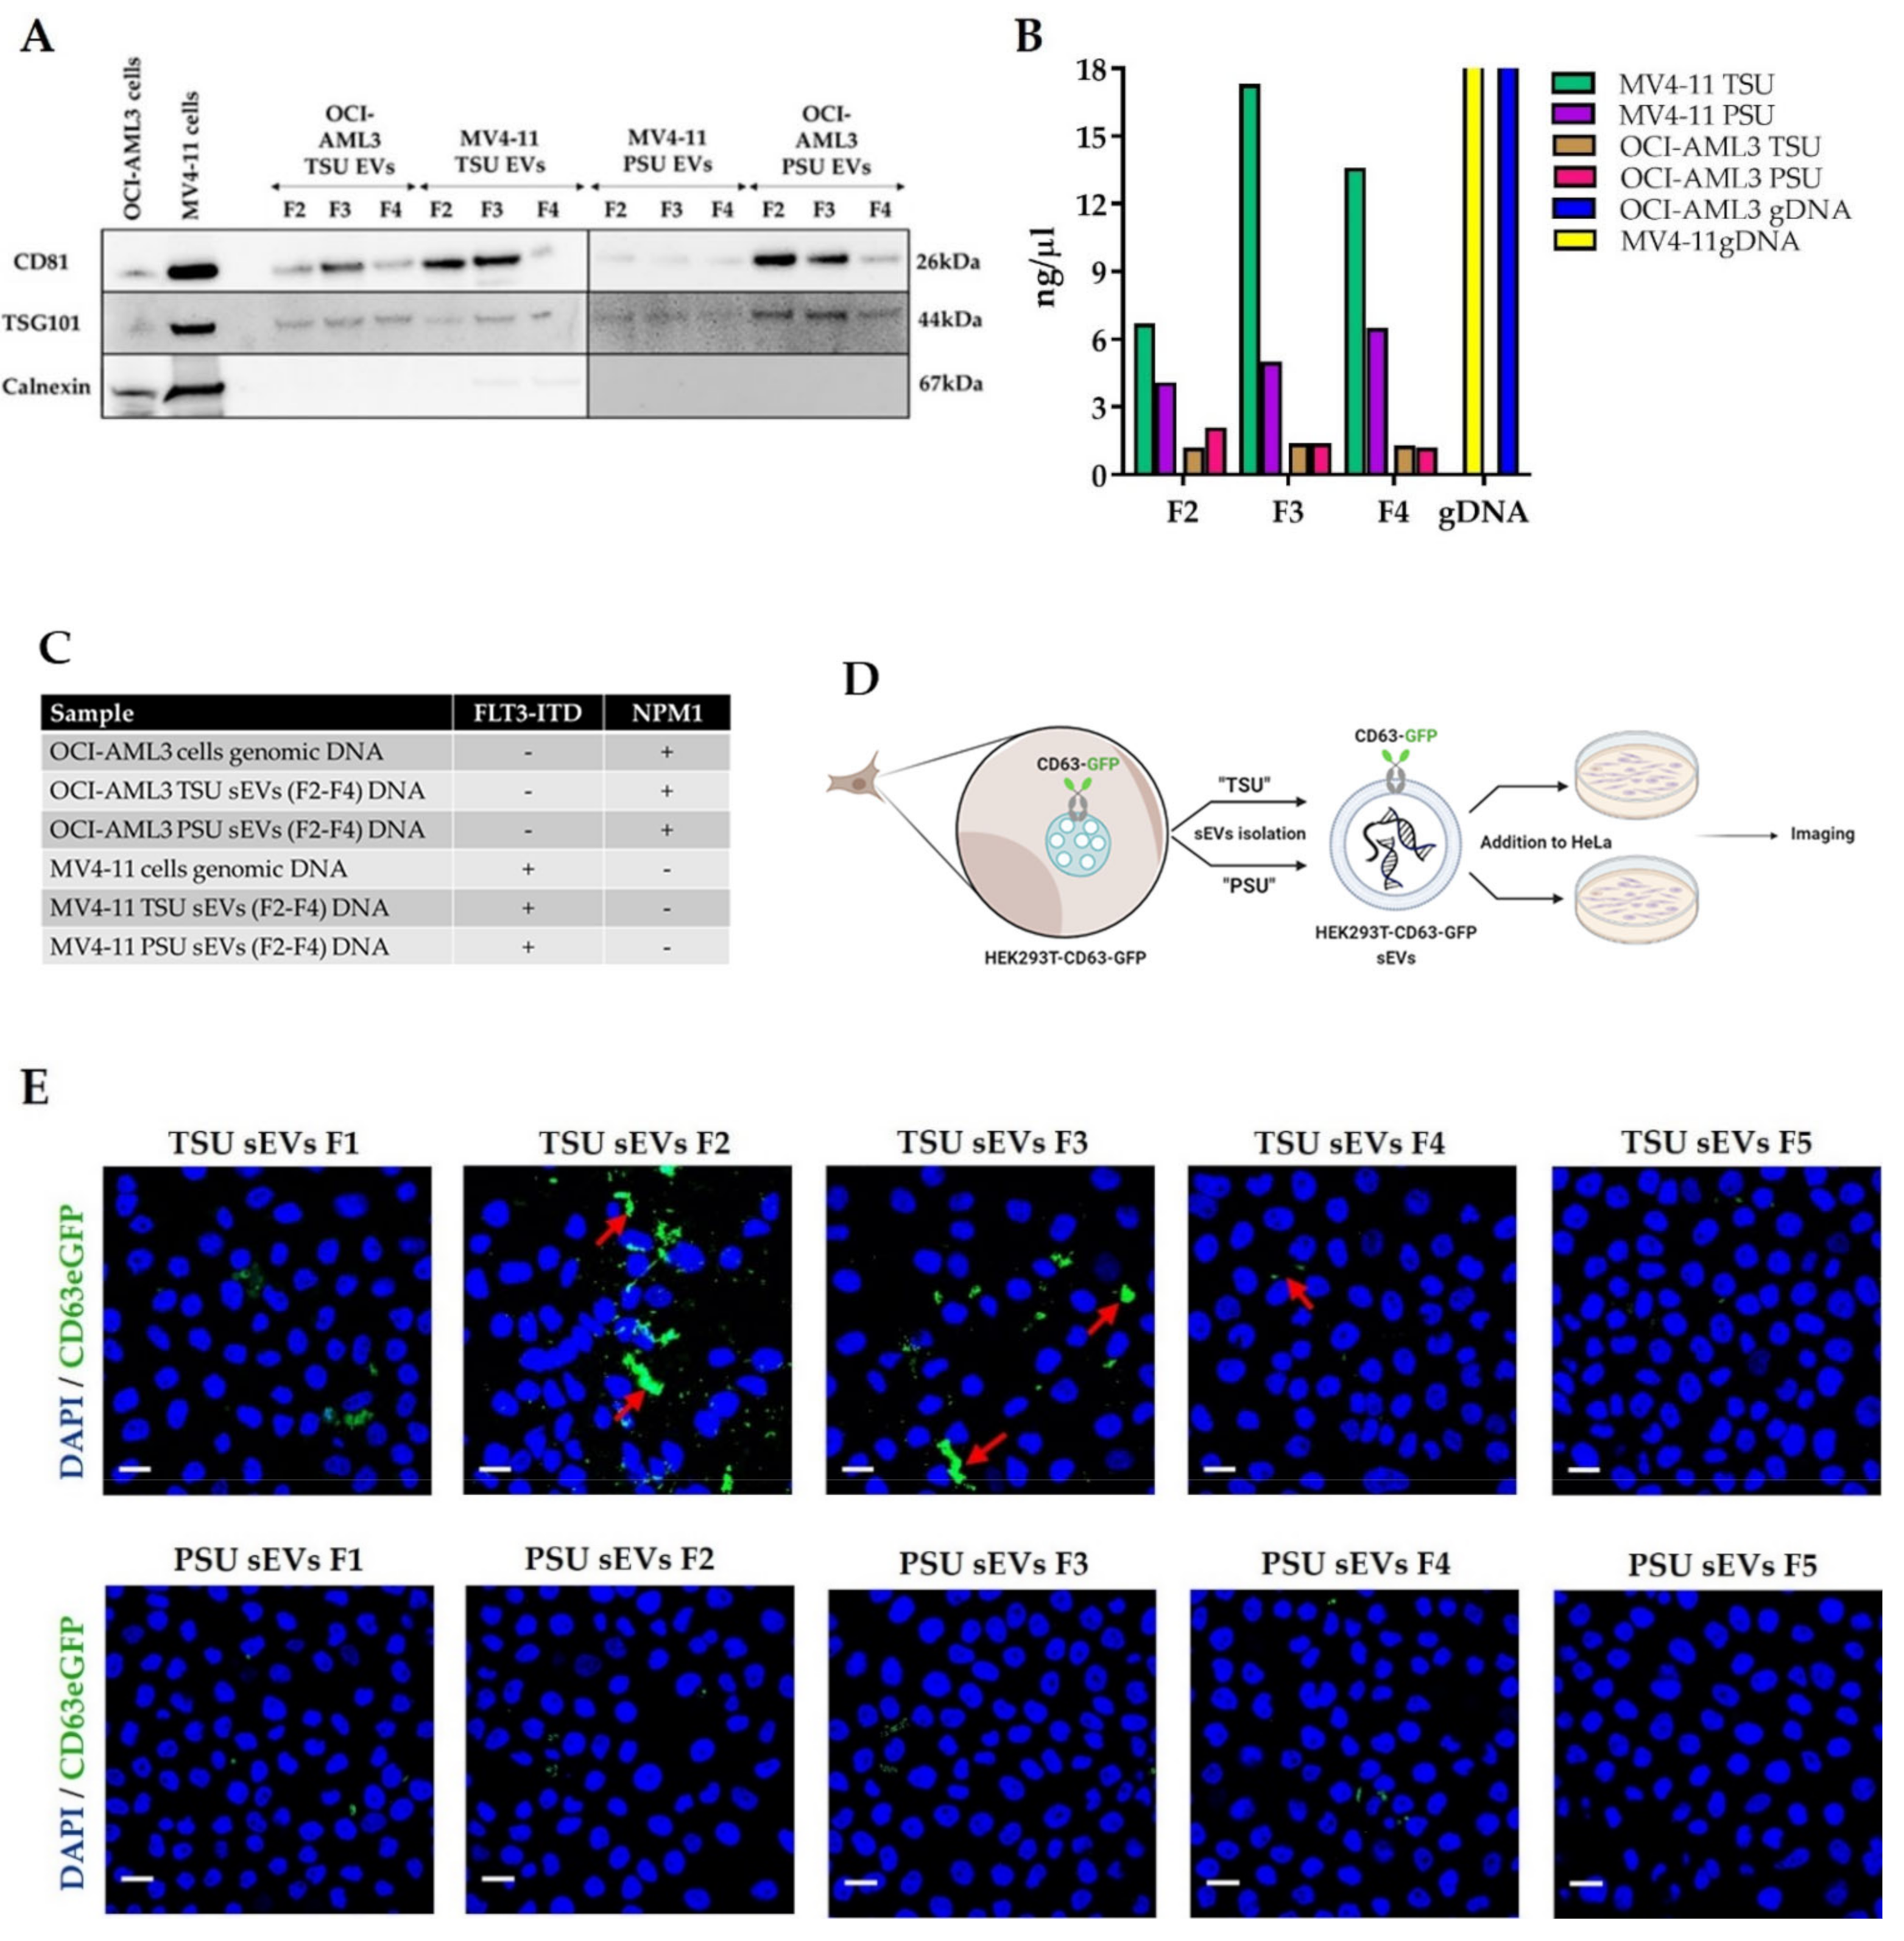
2.4.1. MV4−11 and OCI−AML3 sEVs for AML Diagnostics
2.4.2. Incubation of HEK-CD63-GFP sEVs with HeLa Cells
2.4.3. Zeta Potential
2.5. Transfer of Foreign EV-DNA in the Recipient Cells
2.5.1. Labelling of EV-DNA with EdU
2.5.2. Incubation of sEVs Containing EV-DNA-EdU with HeLa Cells
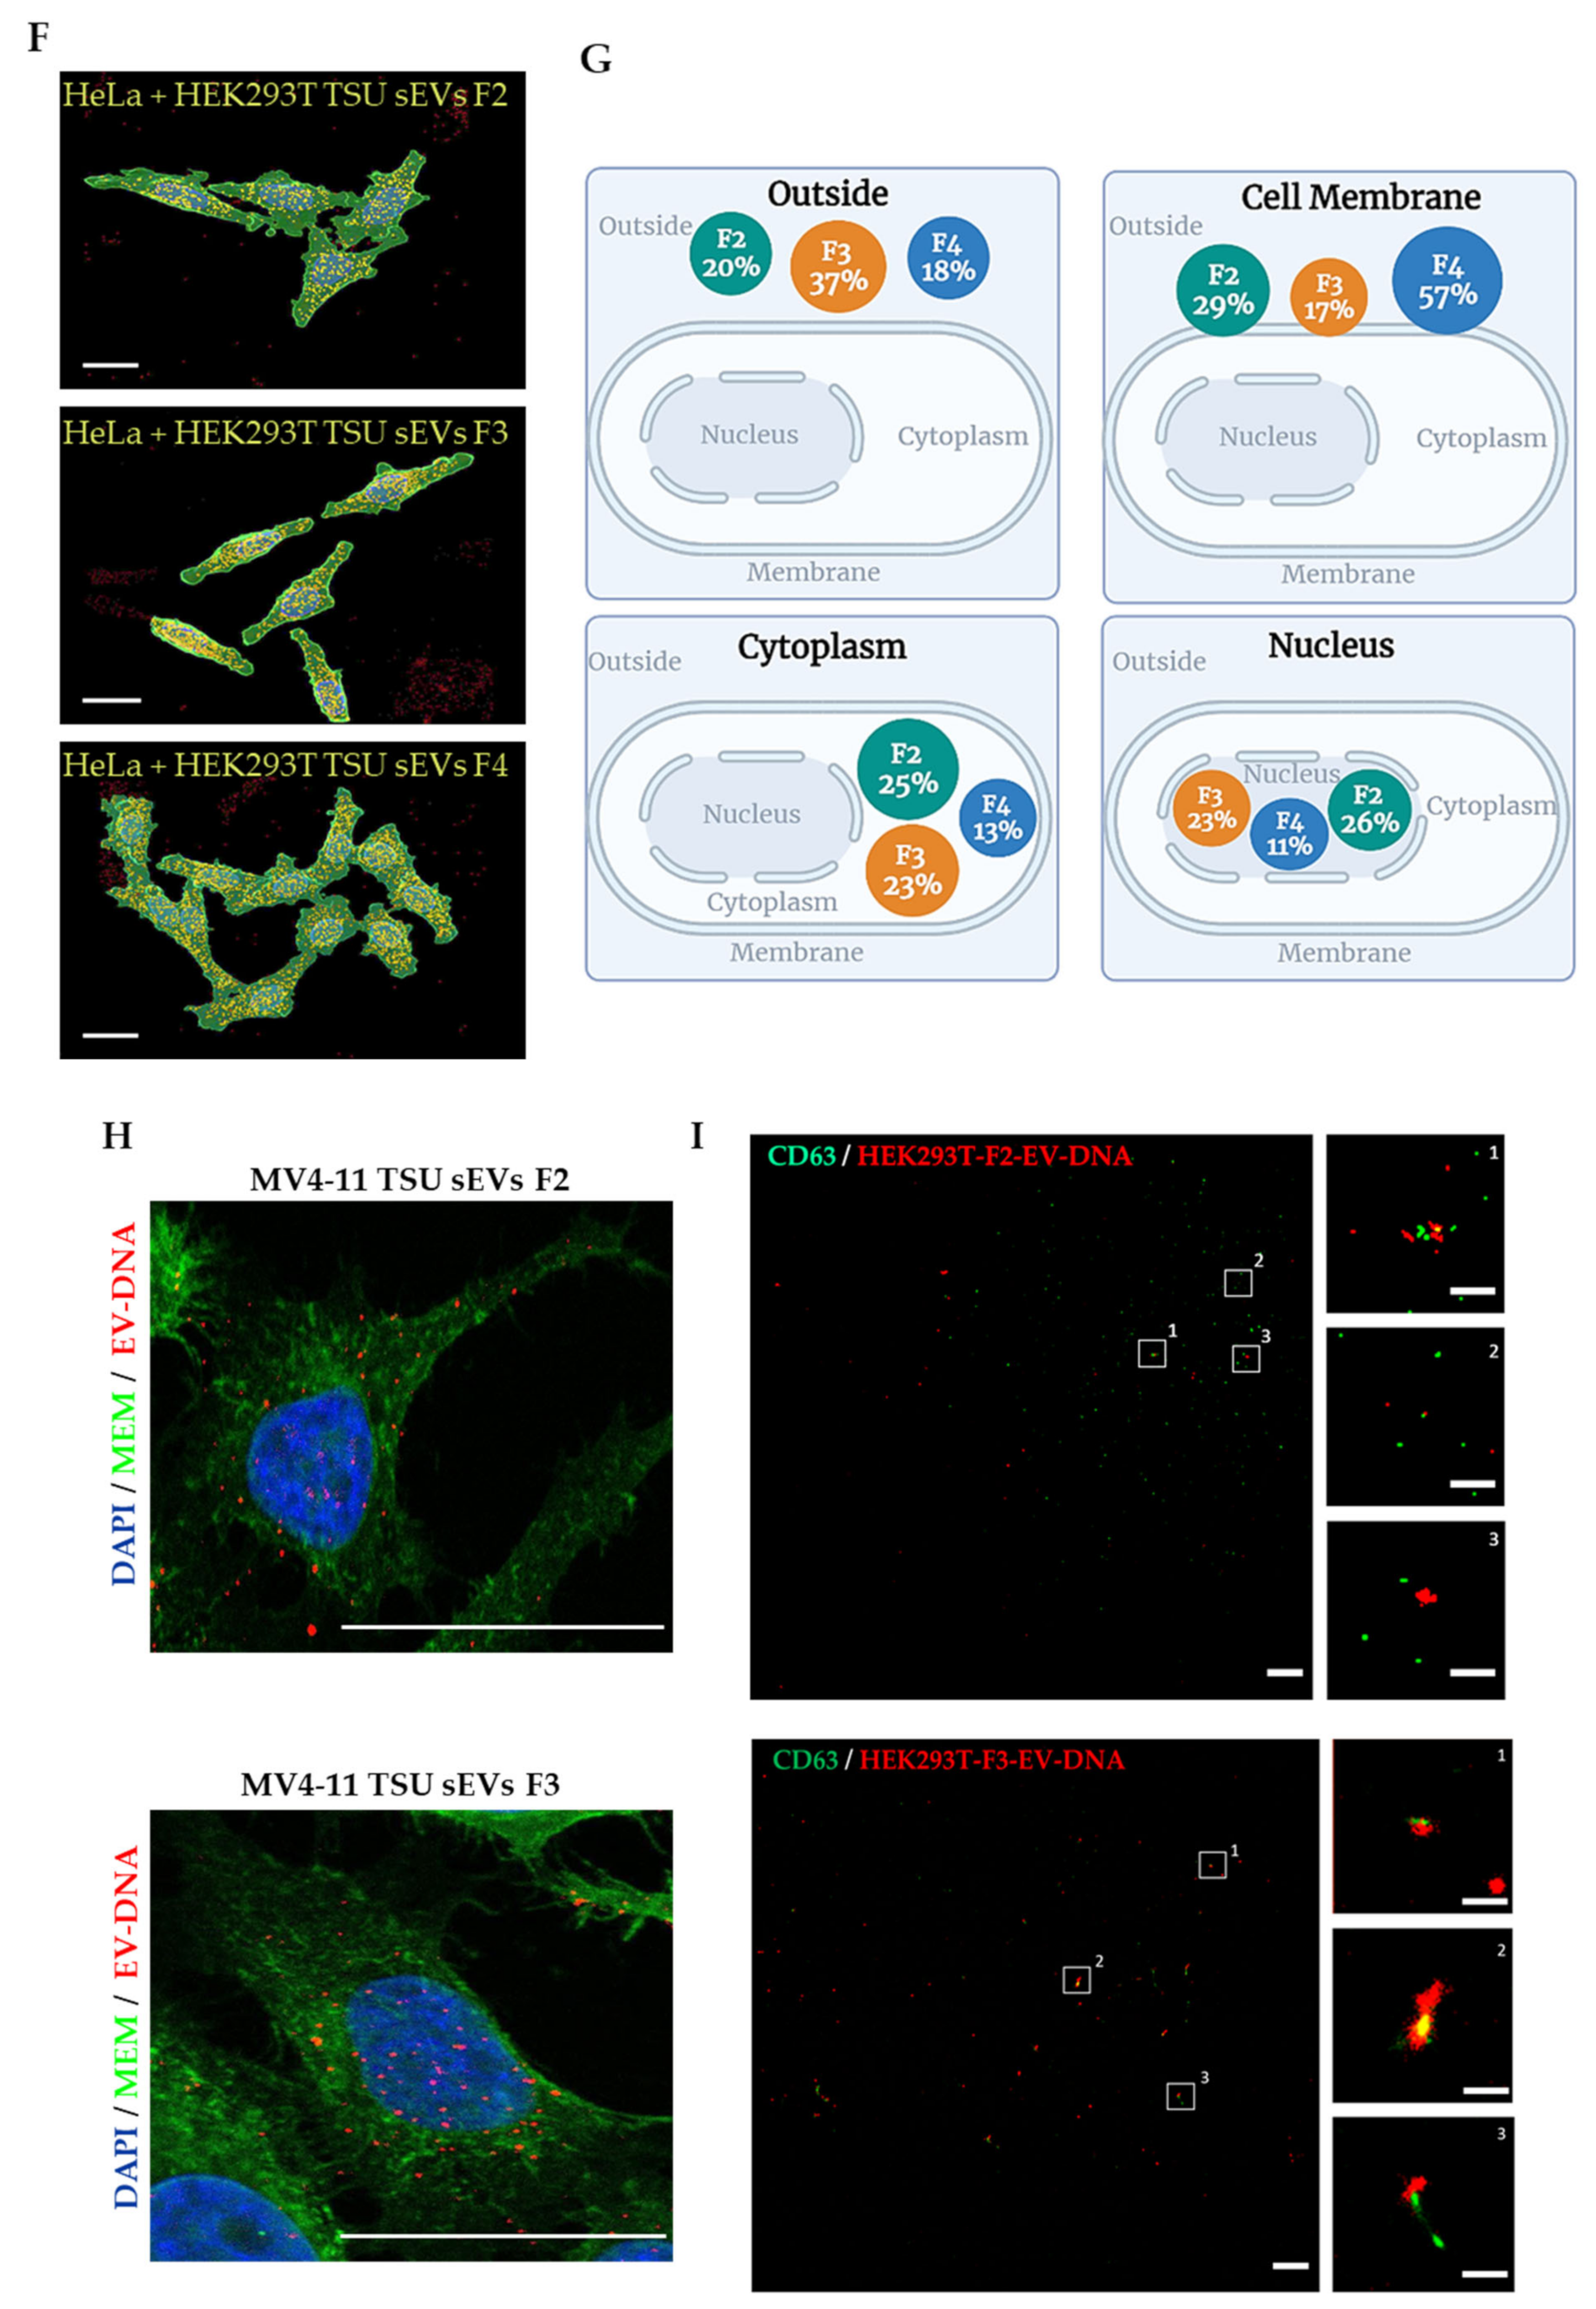
2.5.3. Three-Dimensional (3D) Image Analysis
2.6. Single EV Imaging
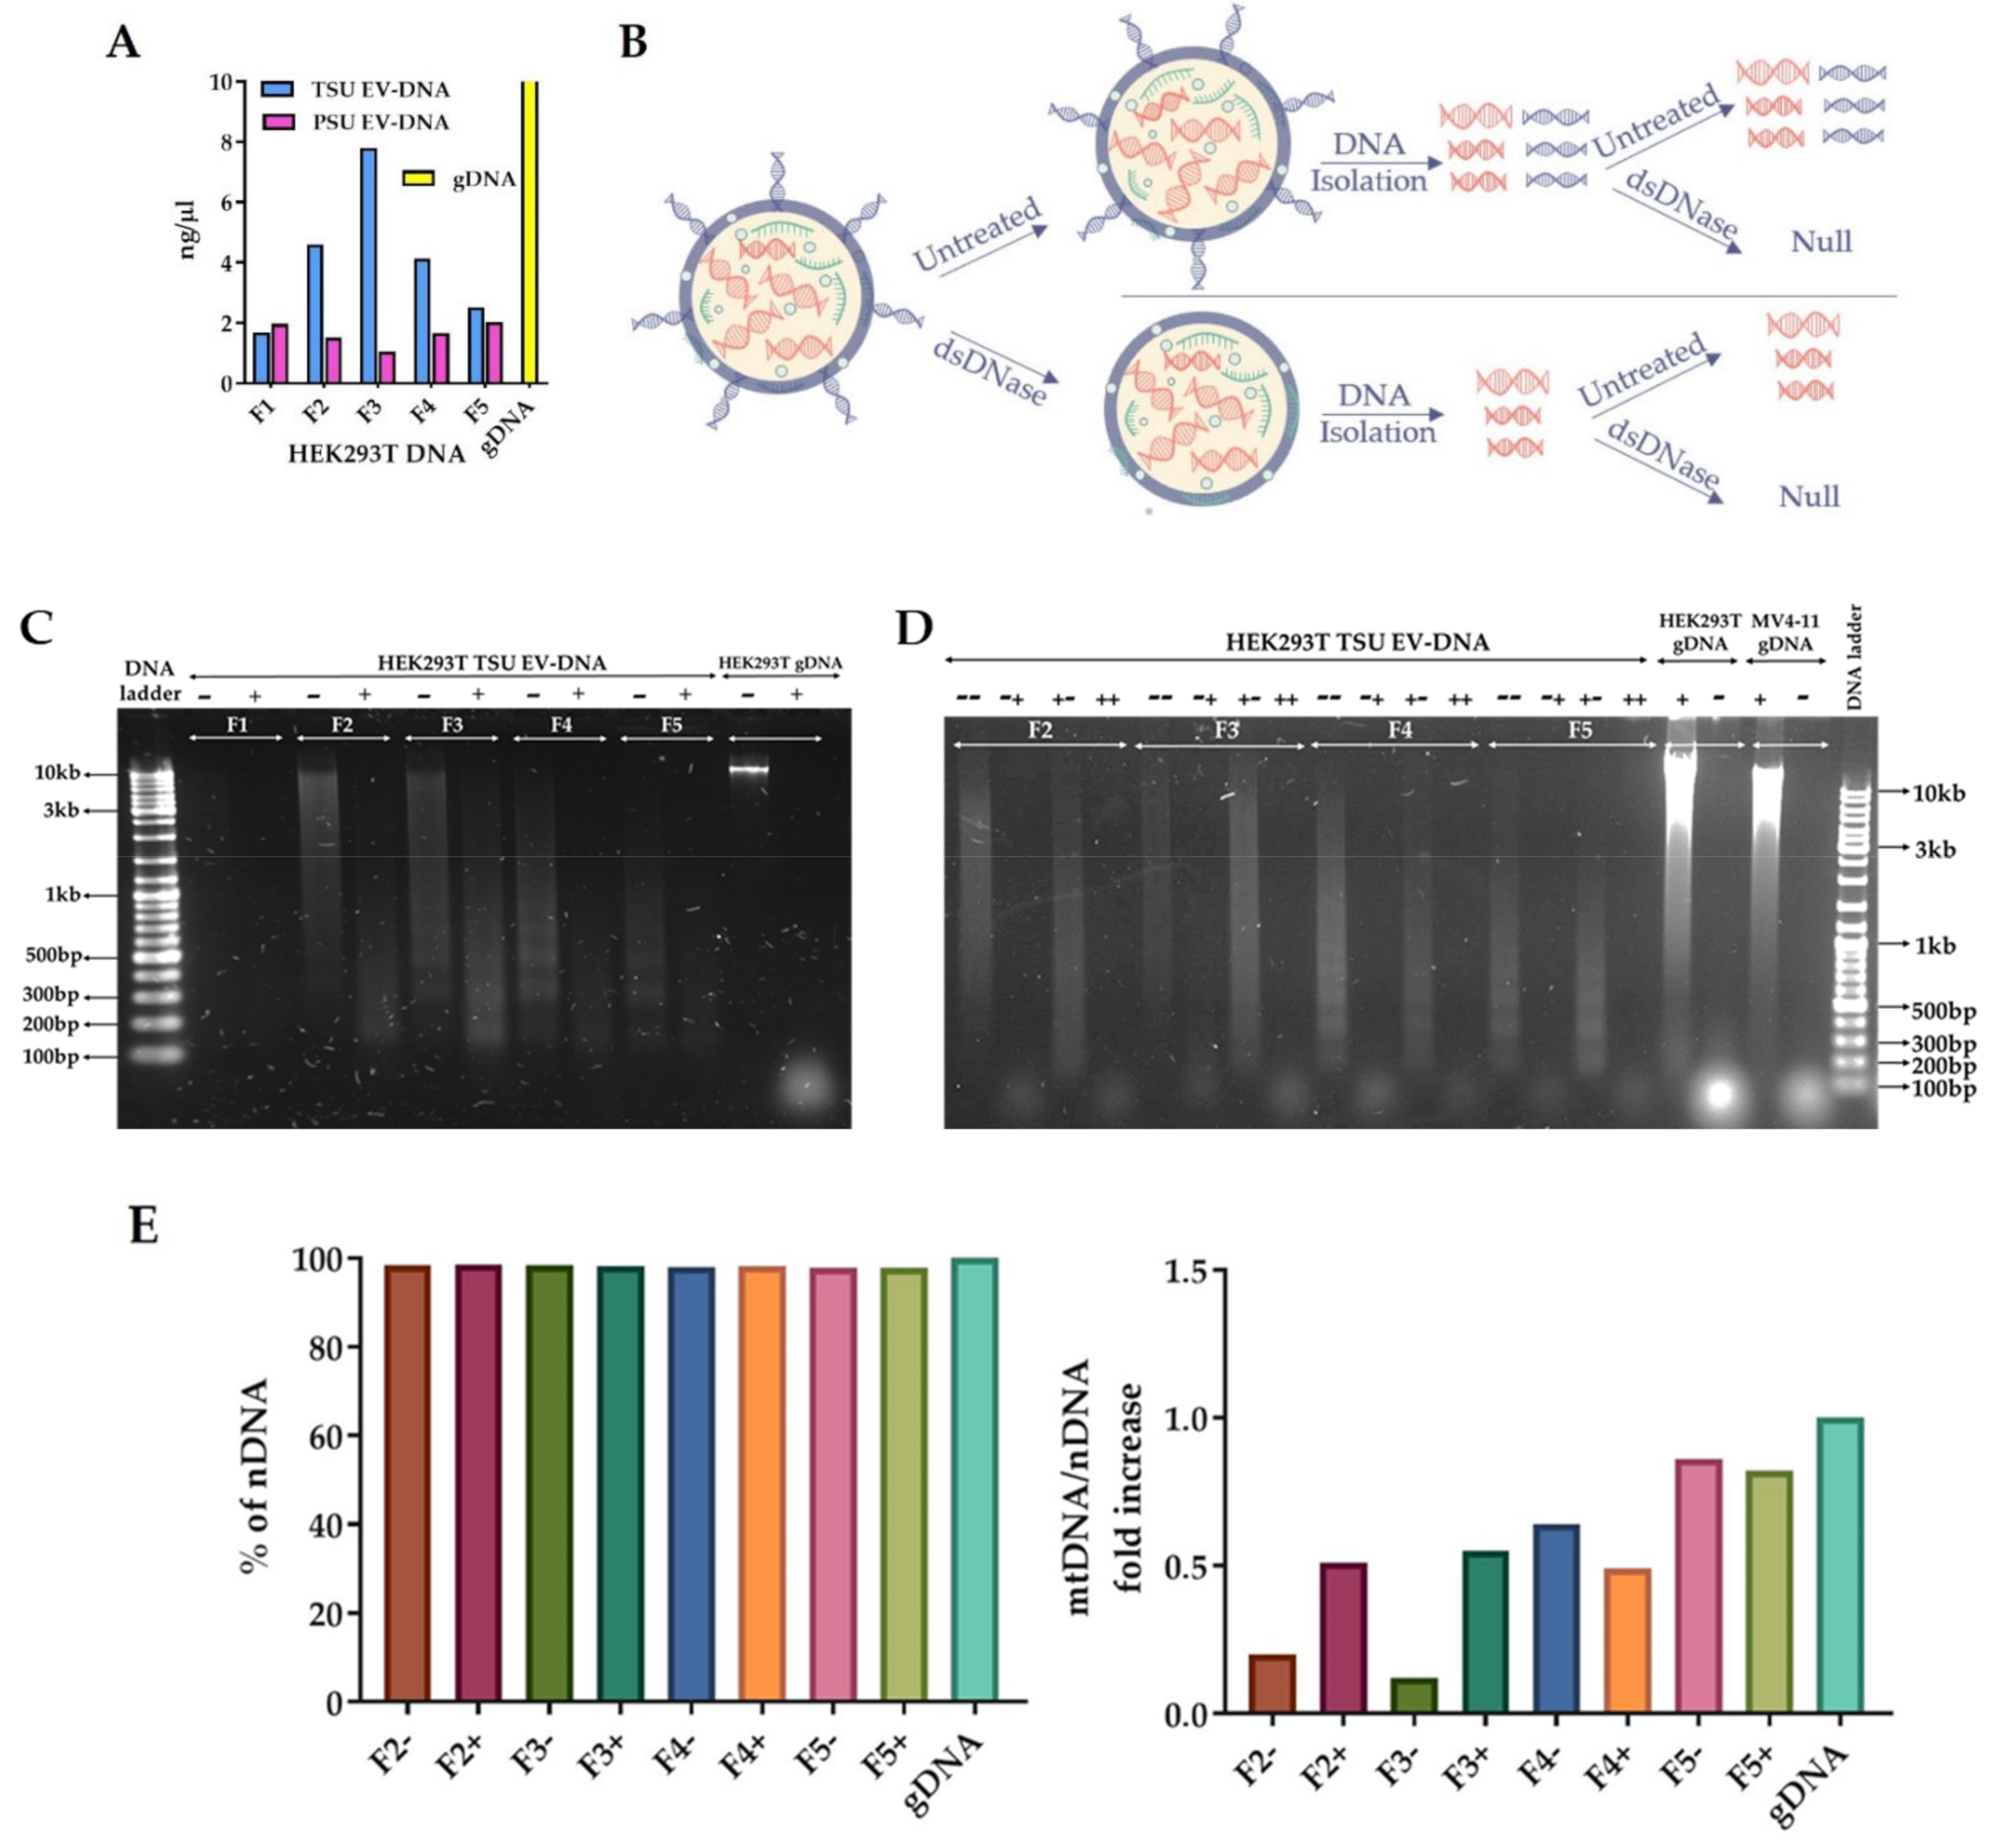
2.7. Detailed Characterization of HEK293T TSU EV-DNA
2.7.1. Isolation of EV-DNA before and after dsDNAse Treatment
2.7.2. Next-Generation Sequencing (NGS)
2.8. Immunofluorescence
2.9. Statistical Analysis
3. Results
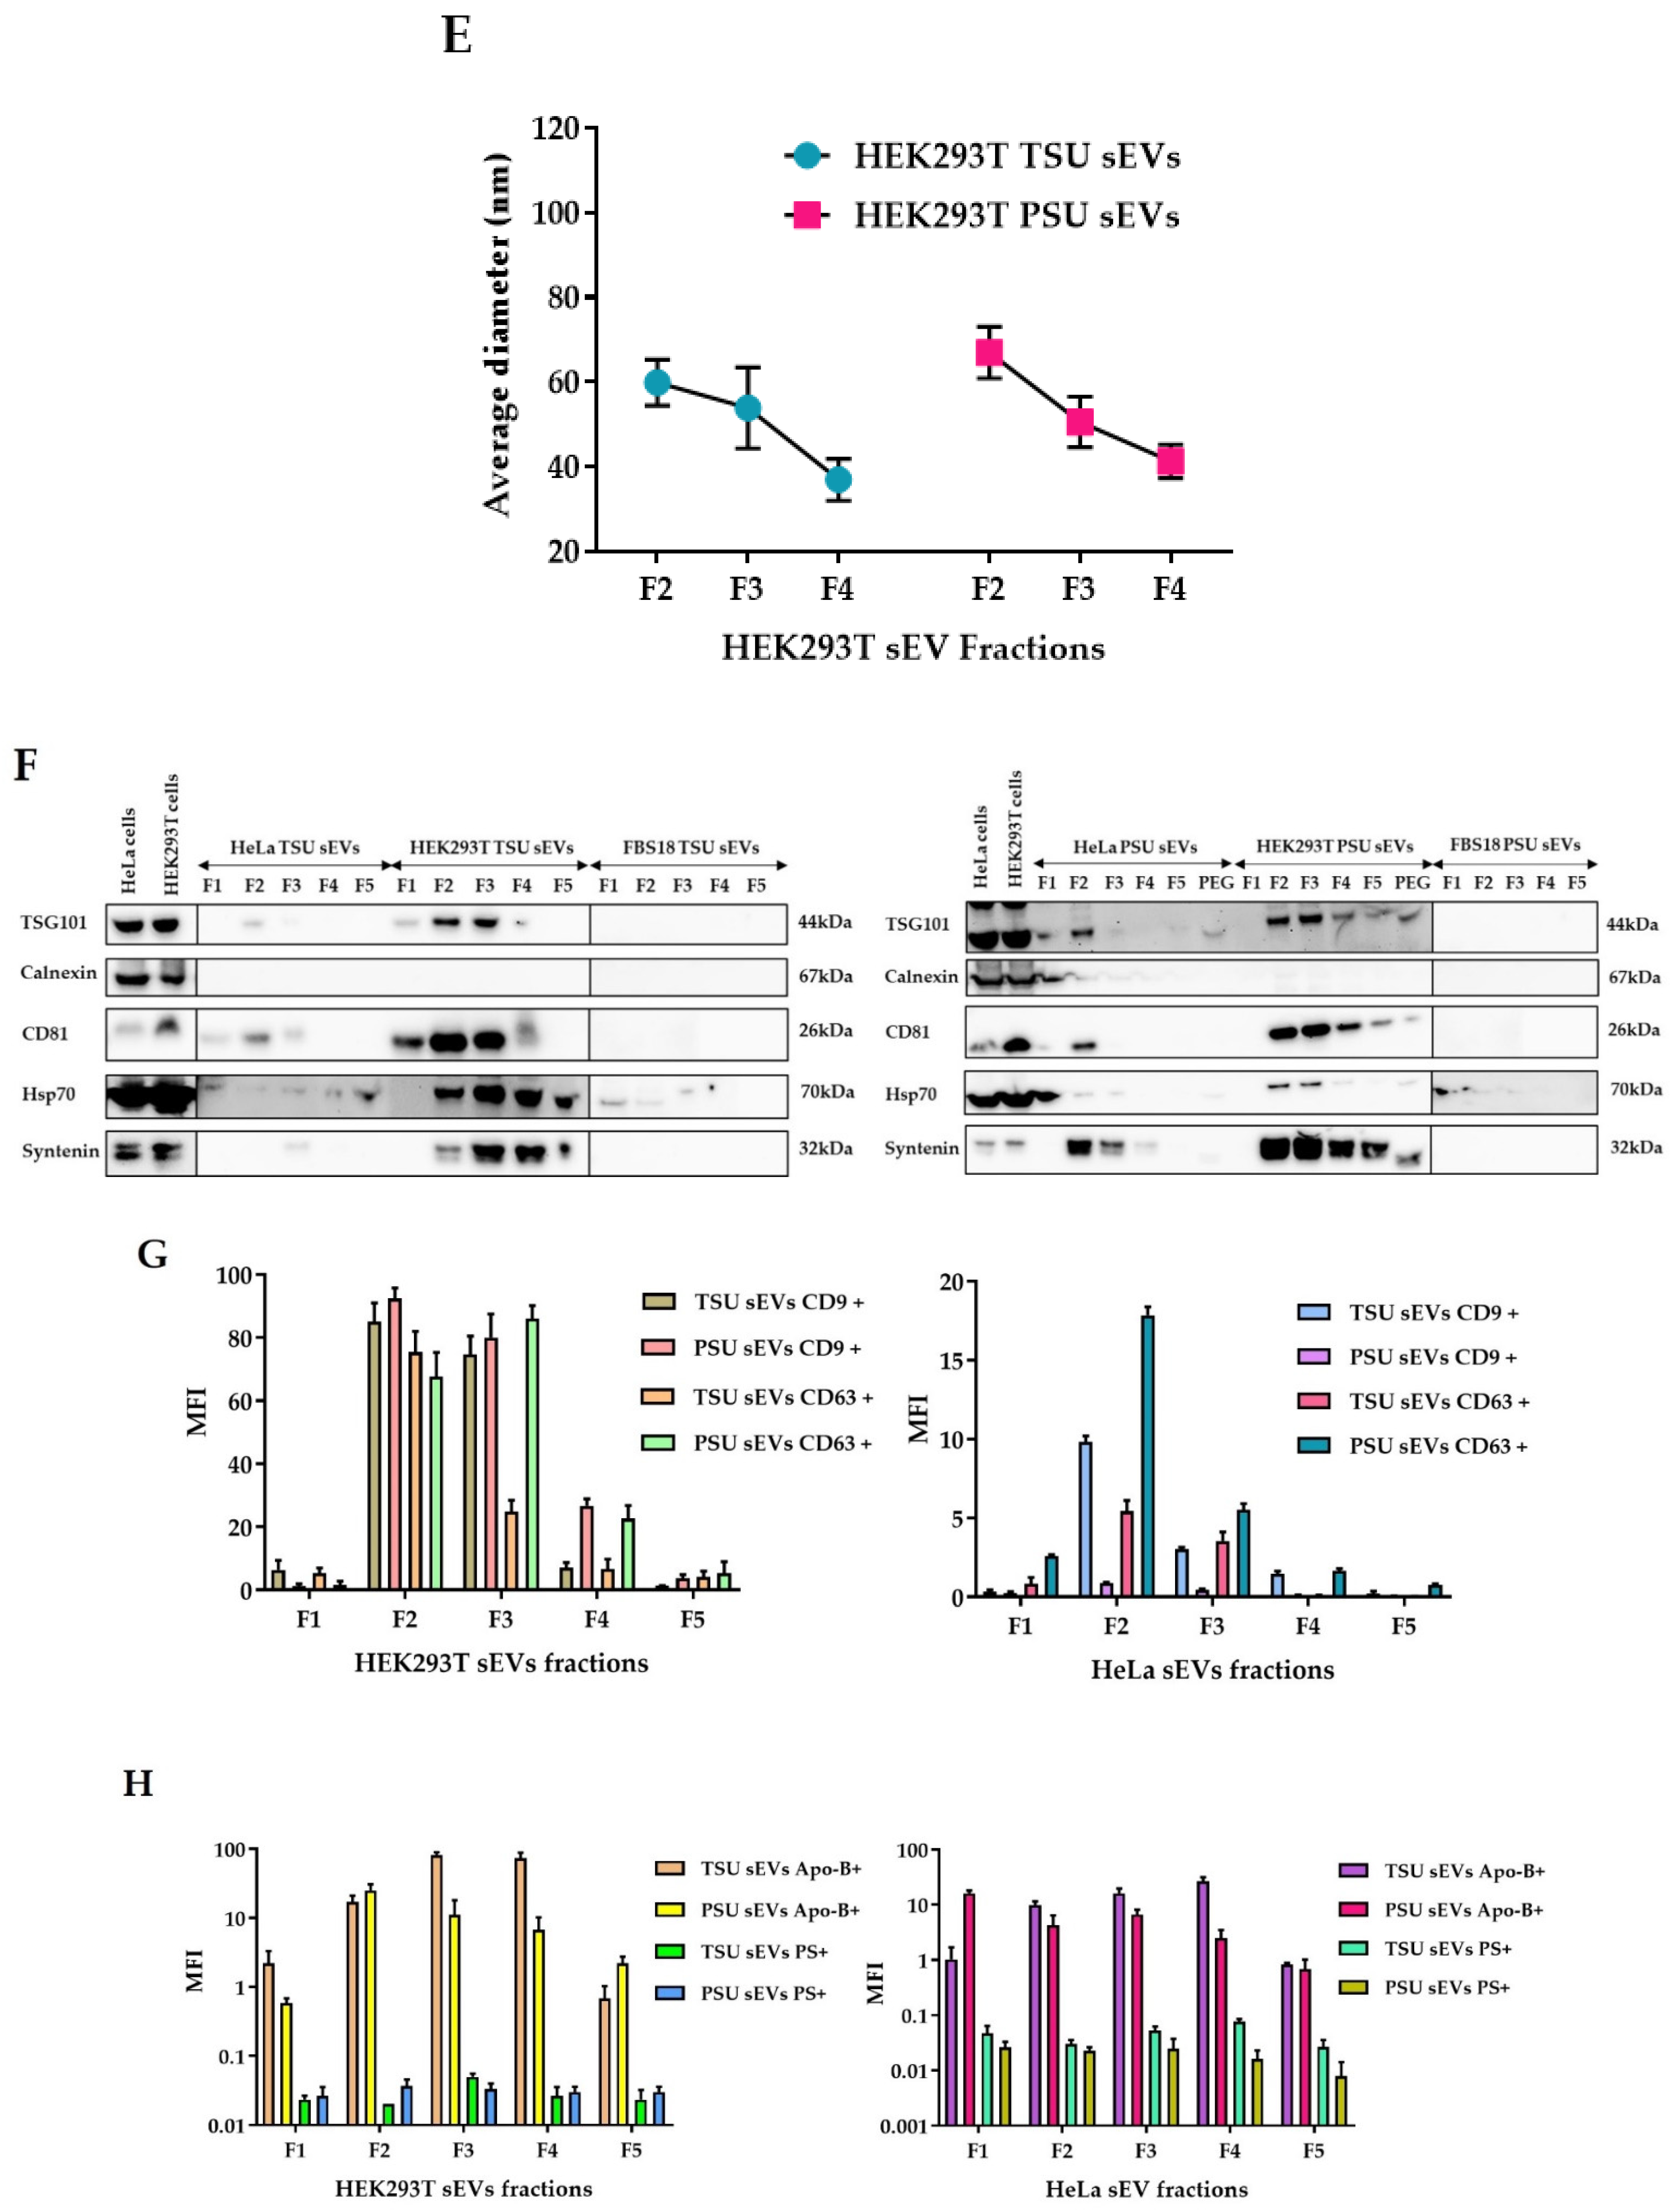
3.1. Isolation and Characterization of HEK293T TSU and PSU sEVs
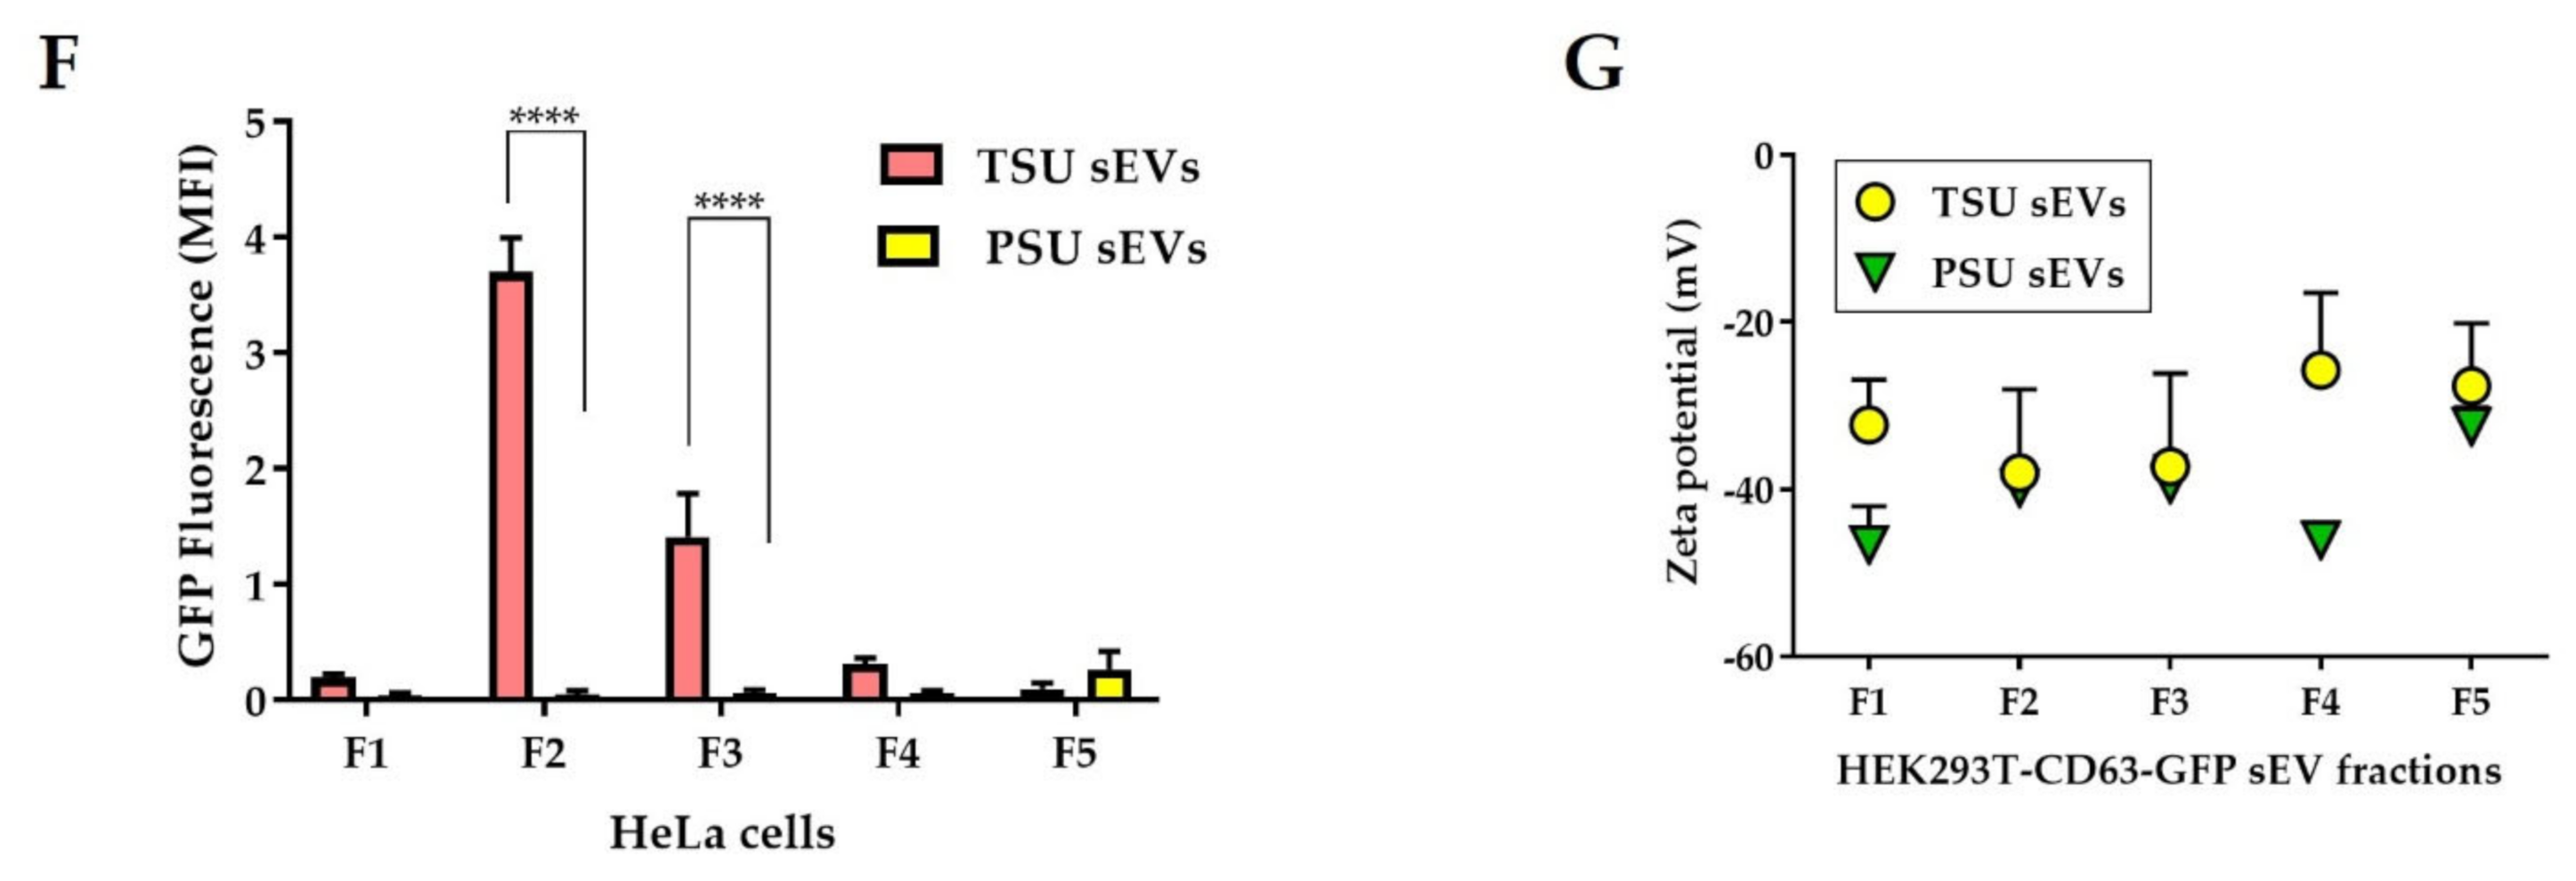
3.2. Assessment of TSU and PSU sEVs for Diagnostic and Functional Studies
3.3. Localization of EV-DNA in the Cell Membrane, Cytoplasm and Nucleus
3.4. Characterization of TSU EV-DNA
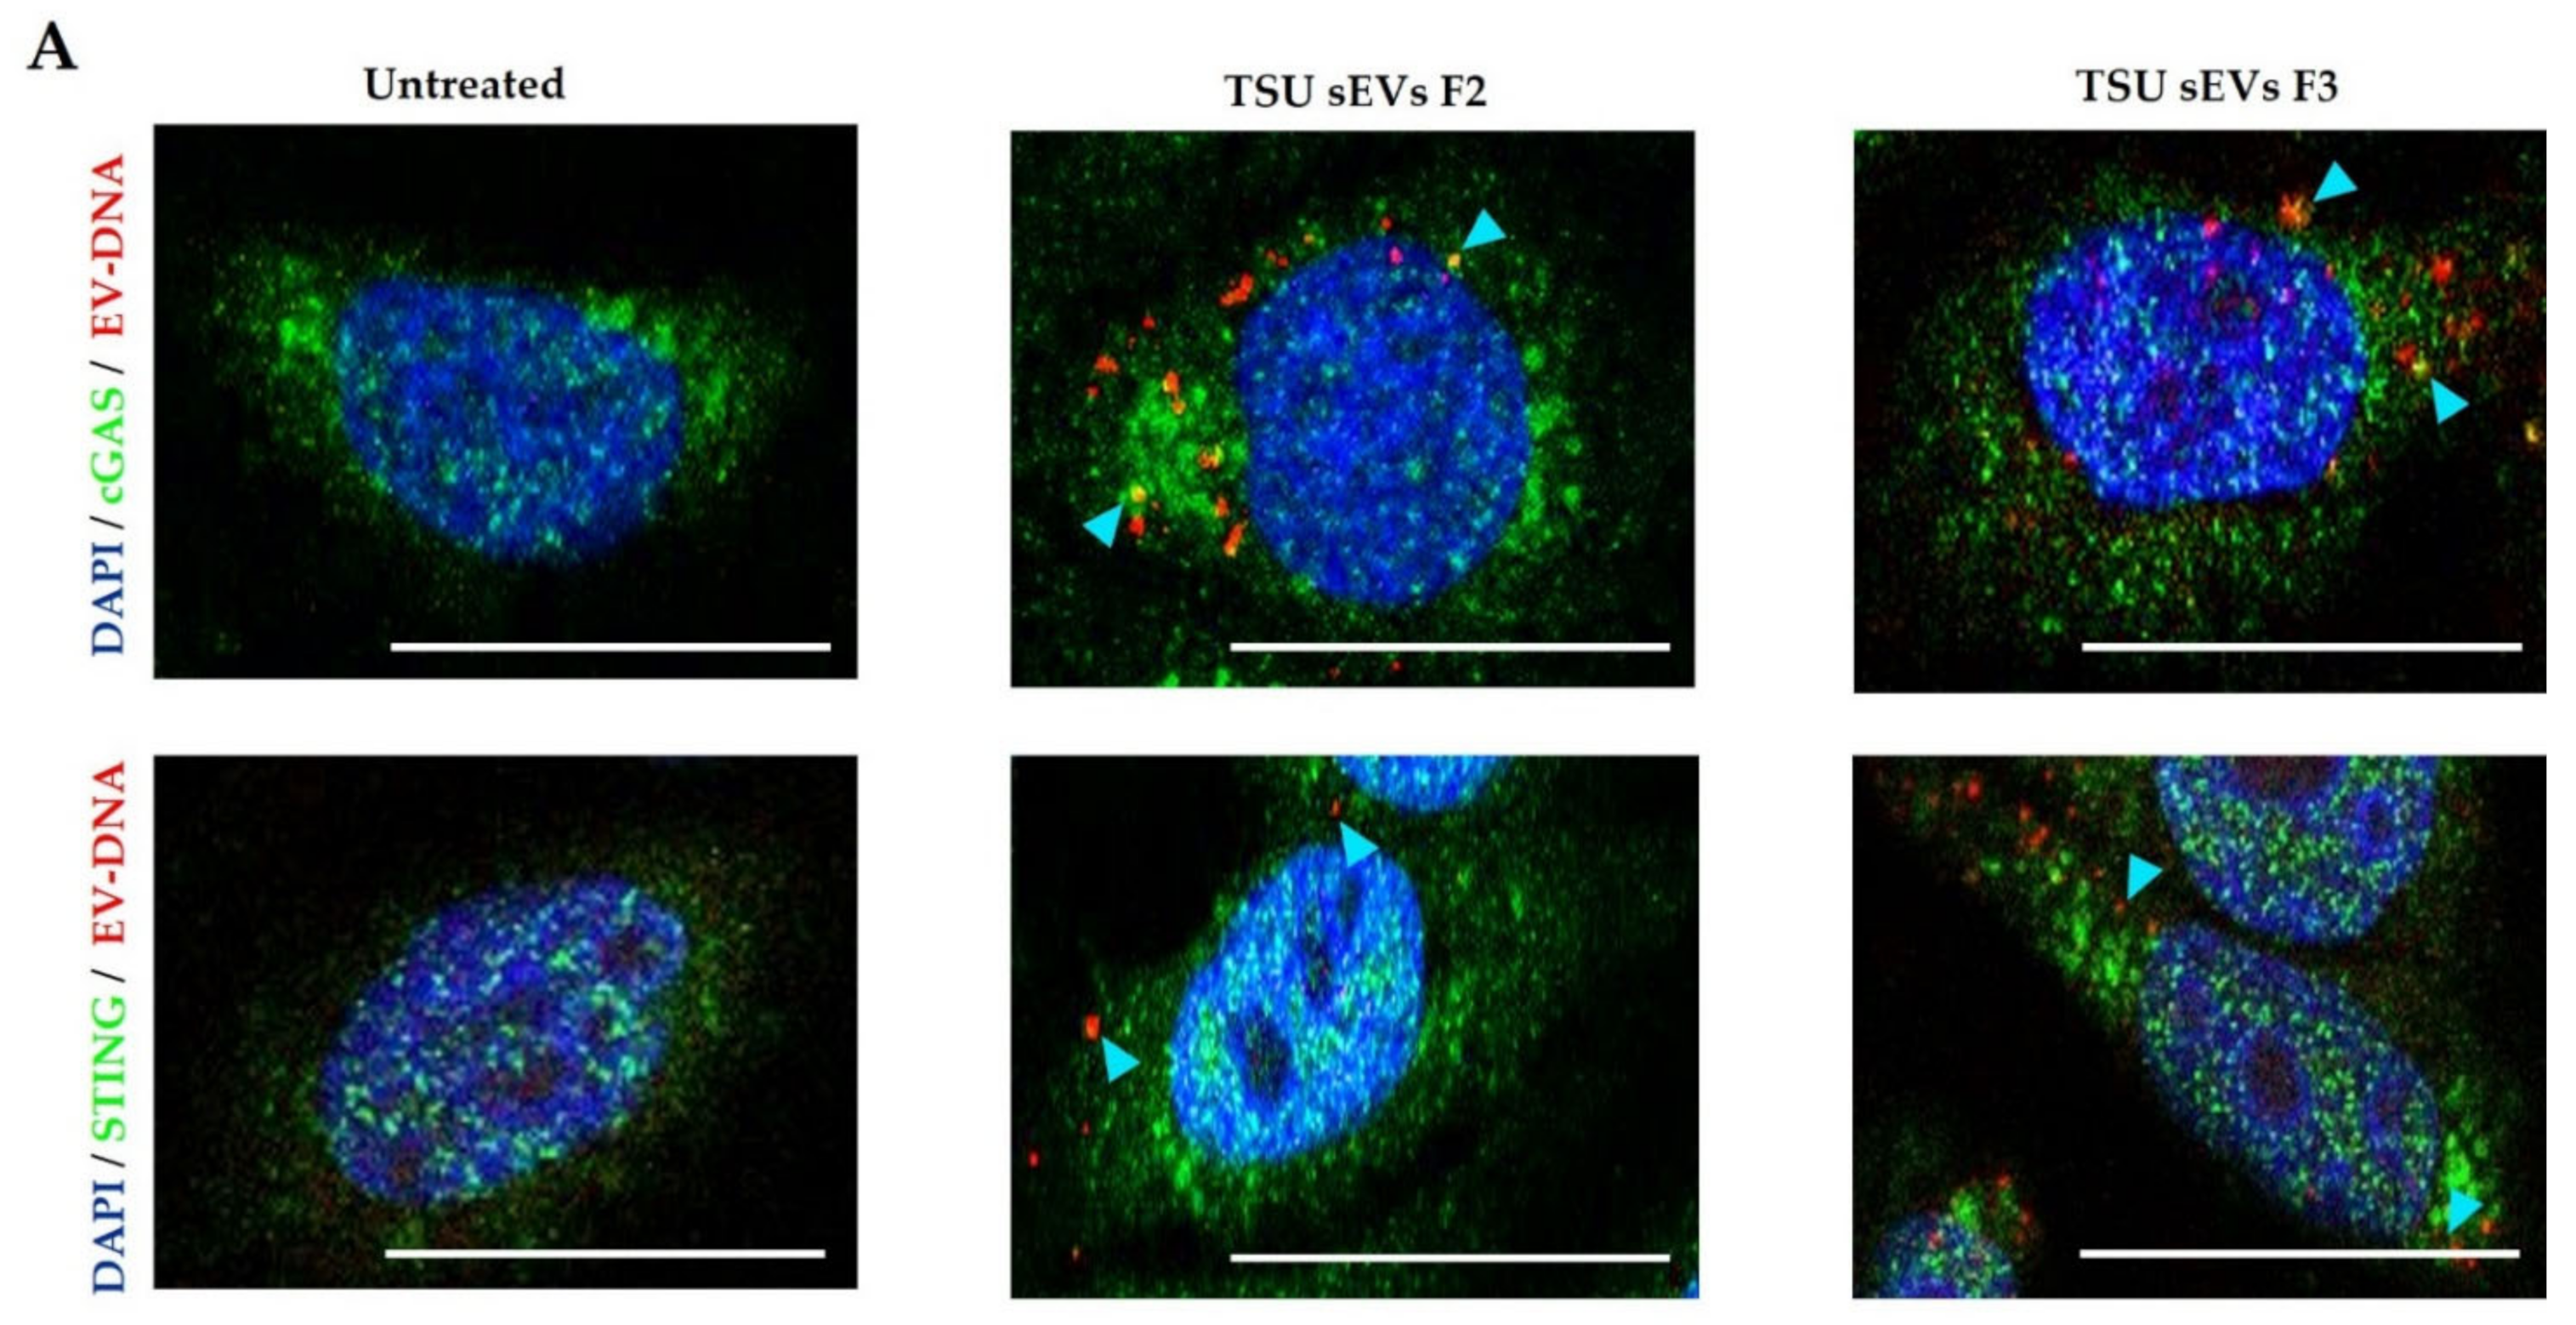
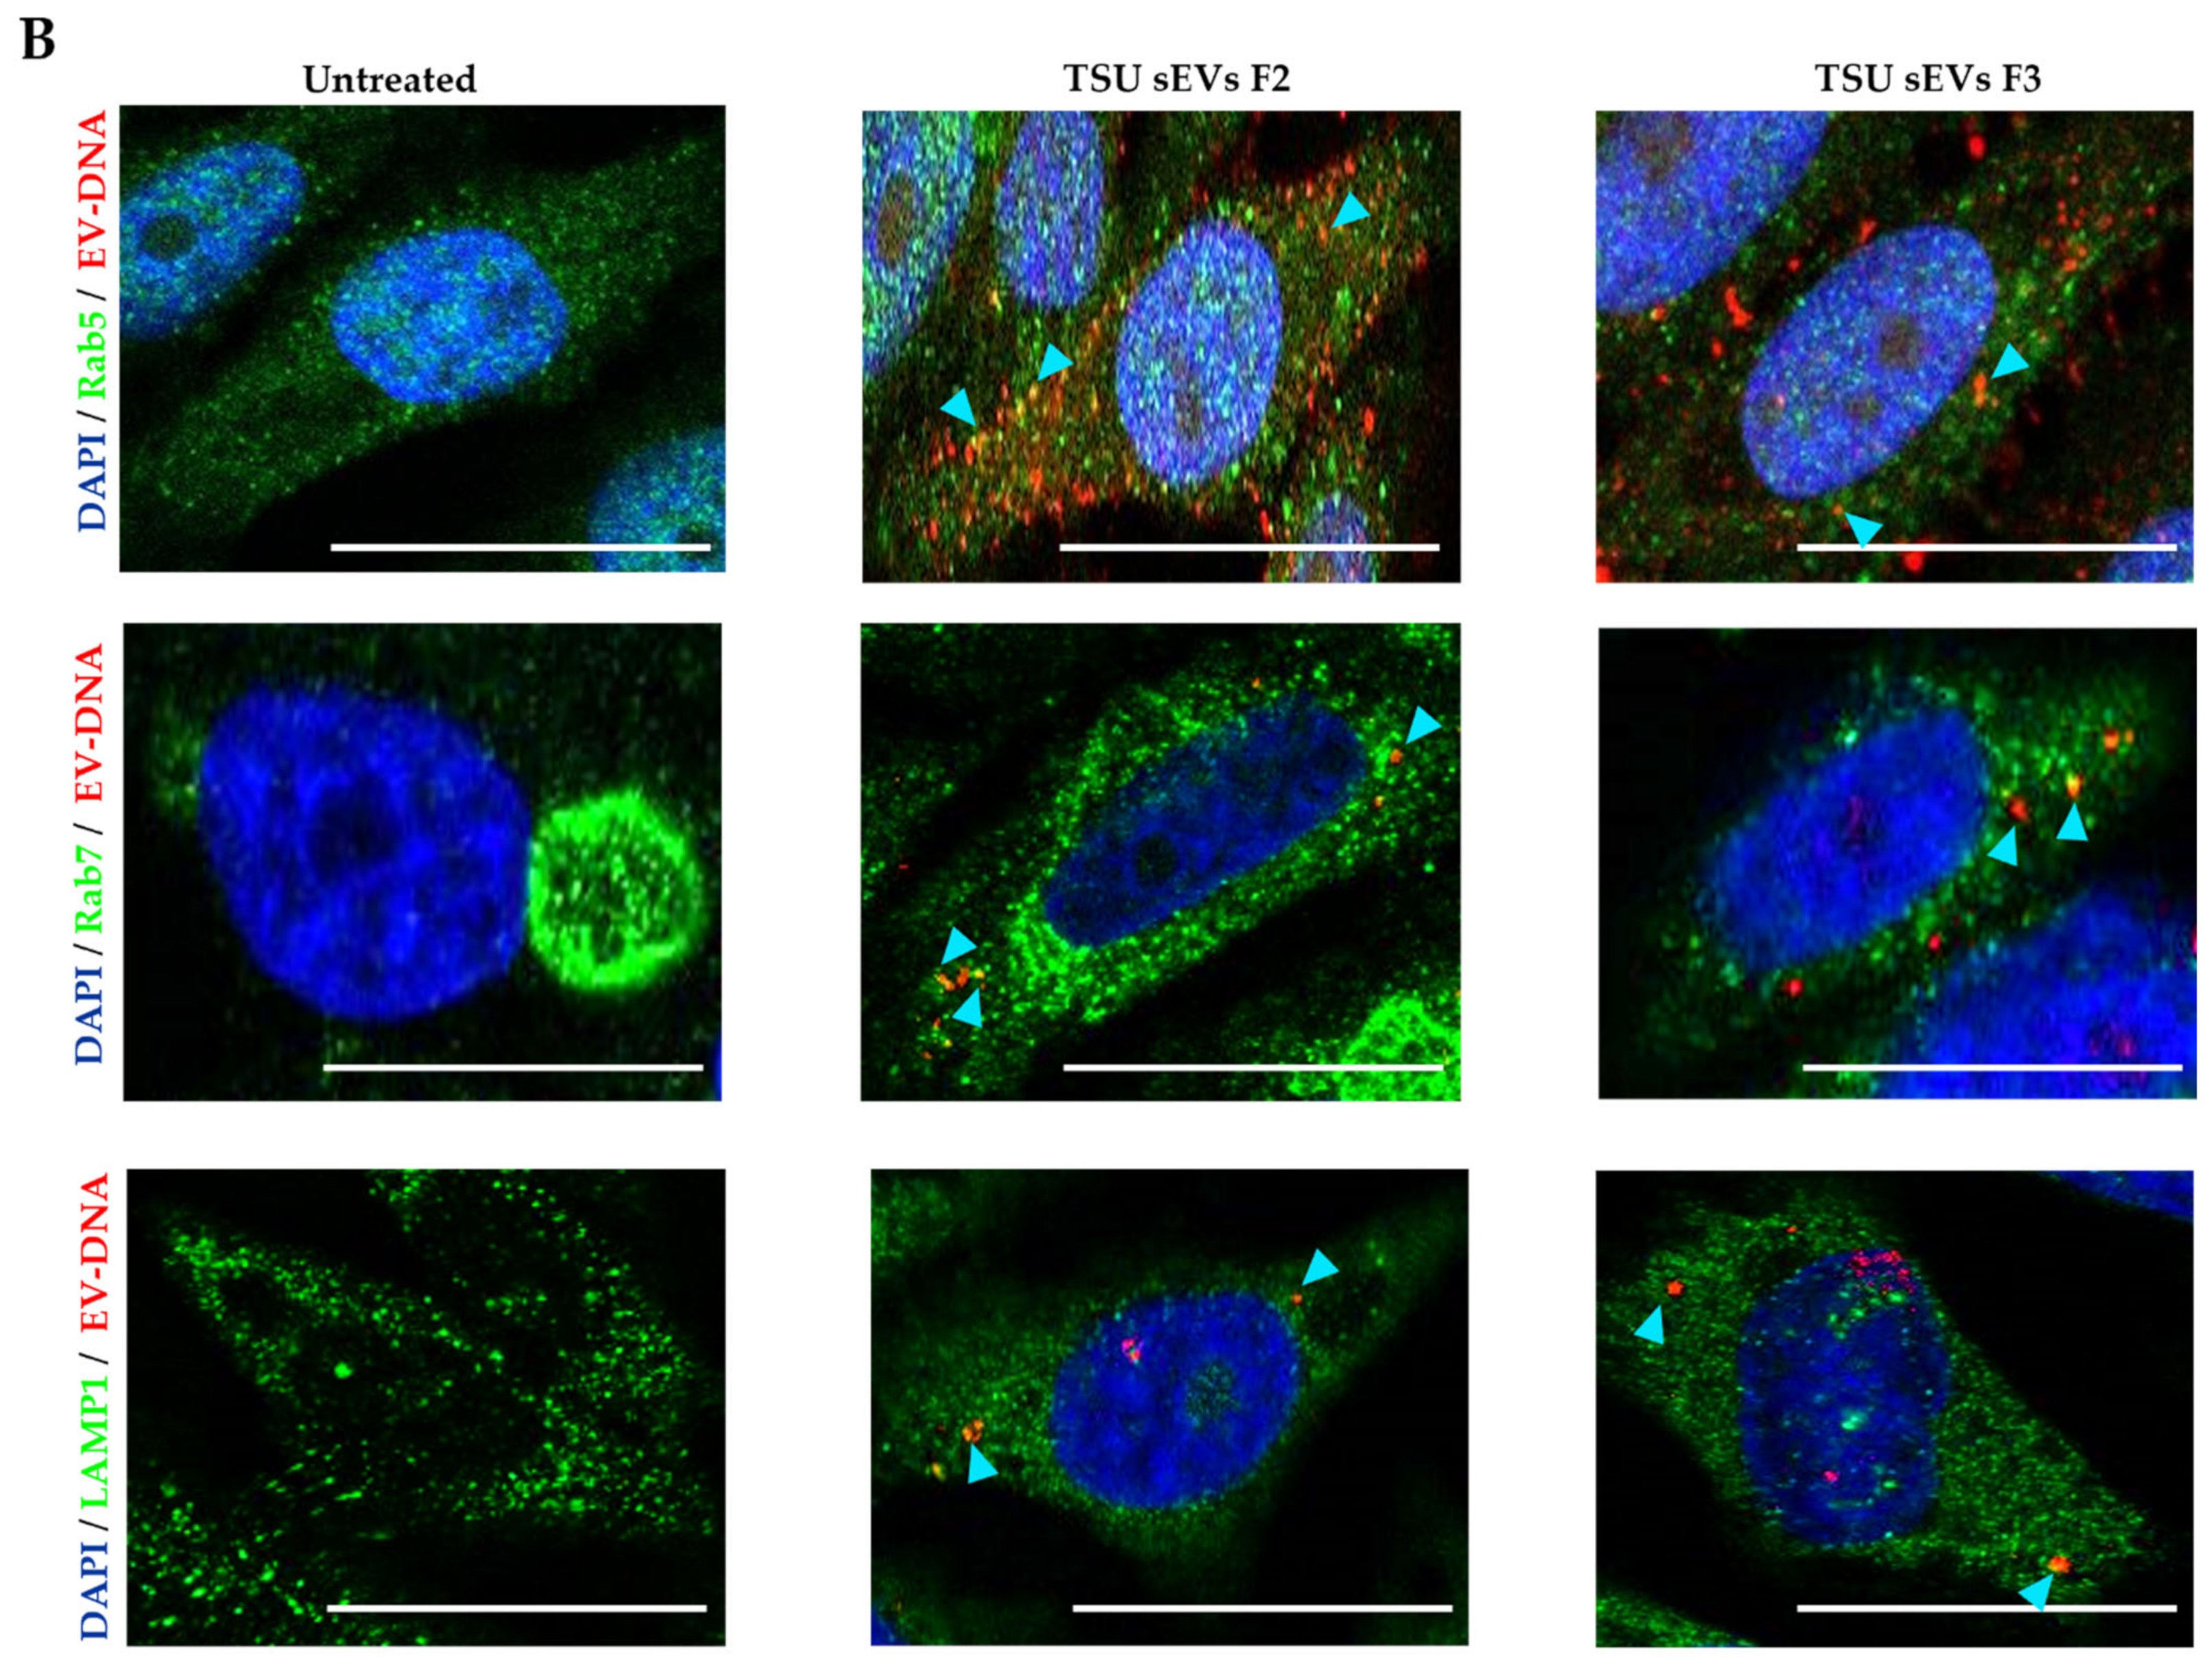
3.5. Association of EV-DNA with Cytoplasmic DNA Sensors and Endosomal Proteins
4. Discussion
5. Conclusions
Supplementary Materials
Author Contributions
Funding
Institutional Review Board Statement
Informed Consent Statement
Data Availability Statement
Acknowledgments
Conflicts of Interest
Abbreviations
| EVs | Extracellular vesicles |
| sEVs | Small extracellular vesicles |
| dsDNA | Double-stranded DNA |
| EV-DNA | Small extracellular vesicles DNA |
| cfDNA | Cell-free DNA |
| TSU | Tangential flow filtration + Size -exclusion chromatography + Ultrafiltration |
| PSU | Polyethylene glycol precipitation + Size-exclusion chromatography + Ultrafiltration |
| MSCs | Mesenchymal stromal cells |
| BM | Bone marrow |
| cGAS | Cyclic GMP-AMP synthase |
| STING | Stimulator of interferon genes |
| UC | Ultracentrifugation |
| SEC | Size-exclusion chromatography |
| UF | Ultrafiltration |
| TFF | Tangential flow filtration |
| PEG | Polyethylene glycol |
| IRF3 | Interferon regulatory factor 3 |
| AML | Acute myeloid leukemia |
| GFP | Green fluorescent protein |
| FBS | Fetal bovine serum |
| CCM | Cell conditioned media |
| NTA | Nanoparticle tracking analysis |
| TEM | Transmission electron microscopy |
| RT | Room temperature |
| MFI | Mean fluorescence intensity |
| FLT3 | Fms-like tyrosine kinase 3 |
| NPM1 | Nucleophosmin 1 |
| EdU | 5-ethynyl-2′-deoxyuridine |
| WGA | Wheat germ agglutinin |
| NGS | Next-generation sequencing |
| SEM | Standard error mean |
| LAMP1 | Lysosomal-associated membrane protein 1 |
| Rab5/7 | Ras-related proteins |
References
- Ghanam, J.; Chetty, V.K.; Barthel, L.; Reinhardt, D.; Hoyer, P.F.; Thakur, B.K. DNA in extracellular vesicles: From evolution to its current application in health and disease. Cell Biosci. 2022, 12, 37. [Google Scholar] [CrossRef]
- Elzanowska, J.; Semira, C.; Costa-Silva, B. DNA in extracellular vesicles: Biological and clinical aspects. Mol. Oncol. 2021, 15, 1701–1714. [Google Scholar] [CrossRef]
- Thery, C.; Witwer, K.W.; Aikawa, E.; Alcaraz, M.J.; Anderson, J.D.; Andriantsitohaina, R.; Antoniou, A.; Arab, T.; Archer, F.; Atkin-Smith, G.K.; et al. Minimal information for studies of extracellular vesicles 2018 (MISEV2018): A position statement of the International Society for Extracellular Vesicles and update of the MISEV2014 guidelines. J. Extracell. Vesicles 2018, 7, 1535750. [Google Scholar] [CrossRef] [Green Version]
- Thery, C.; Amigorena, S.; Raposo, G.; Clayton, A. Isolation and characterization of exosomes from cell culture supernatants and biological fluids. Curr. Protoc. Cell Biol. 2006, 3, 3.22.1–3.22.29. [Google Scholar] [CrossRef]
- Thakur, B.K.; Zhang, H.; Becker, A.; Matei, I.; Huang, Y.; Costa-Silva, B.; Zheng, Y.; Hoshino, A.; Brazier, H.; Xiang, J.; et al. Double-stranded DNA in exosomes: A novel biomarker in cancer detection. Cell Res. 2014, 24, 766–769. [Google Scholar] [CrossRef] [Green Version]
- Valadi, H.; Ekstrom, K.; Bossios, A.; Sjostrand, M.; Lee, J.J.; Lotvall, J.O. Exosome-mediated transfer of mRNAs and microRNAs is a novel mechanism of genetic exchange between cells. Nat. Cell Biol. 2007, 9, 654–659. [Google Scholar] [CrossRef] [Green Version]
- Kahlert, C.; Melo, S.A.; Protopopov, A.; Tang, J.; Seth, S.; Koch, M.; Zhang, J.; Weitz, J.; Chin, L.; Futreal, A.; et al. Identification of double-stranded genomic DNA spanning all chromosomes with mutated KRAS and p53 DNA in the serum exosomes of patients with pancreatic cancer. J. Biol. Chem. 2014, 289, 3869–3875. [Google Scholar] [CrossRef] [Green Version]
- Hoshino, A.; Costa-Silva, B.; Shen, T.L.; Rodrigues, G.; Hashimoto, A.; Tesic Mark, M.; Molina, H.; Kohsaka, S.; Di Giannatale, A.; Ceder, S.; et al. Tumour exosome integrins determine organotropic metastasis. Nature 2015, 527, 329–335. [Google Scholar] [CrossRef] [Green Version]
- Gao, Y.; Qin, Y.; Wan, C.; Sun, Y.; Meng, J.; Huang, J.; Hu, Y.; Jin, H.; Yang, K. Small Extracellular Vesicles: A Novel Avenue for Cancer Management. Front. Oncol. 2021, 11, 638357. [Google Scholar] [CrossRef]
- Droste, M.; Thakur, B.K.; Eliceiri, B.P. Tumor-Derived Extracellular Vesicles and the Immune System-Lessons From Immune-Competent Mouse-Tumor Models. Front. Immunol. 2020, 11, 606859. [Google Scholar] [CrossRef]
- Yanez-Mo, M.; Siljander, P.R.; Andreu, Z.; Zavec, A.B.; Borras, F.E.; Buzas, E.I.; Buzas, K.; Casal, E.; Cappello, F.; Carvalho, J.; et al. Biological properties of extracellular vesicles and their physiological functions. J. Extracell. Vesicles 2015, 4, 27066. [Google Scholar] [CrossRef] [PubMed] [Green Version]
- Admyre, C.; Johansson, S.M.; Qazi, K.R.; Filen, J.J.; Lahesmaa, R.; Norman, M.; Neve, E.P.; Scheynius, A.; Gabrielsson, S. Exosomes with immune modulatory features are present in human breast milk. J. Immunol. 2007, 179, 1969–1978. [Google Scholar] [CrossRef] [PubMed]
- Malkin, E.Z.; Bratman, S.V. Bioactive DNA from extracellular vesicles and particles. Cell Death Dis. 2020, 11, 584. [Google Scholar] [CrossRef]
- Pitt, J.M.; Kroemer, G.; Zitvogel, L. Extracellular vesicles: Masters of intercellular communication and potential clinical interventions. J. Clin. Investig. 2016, 126, 1139–1143. [Google Scholar] [CrossRef] [PubMed] [Green Version]
- Maas, S.L.N.; Breakefield, X.O.; Weaver, A.M. Extracellular Vesicles: Unique Intercellular Delivery Vehicles. Trends Cell Biol. 2017, 27, 172–188. [Google Scholar] [CrossRef] [PubMed] [Green Version]
- Liu, C.; Yu, S.; Zinn, K.; Wang, J.; Zhang, L.; Jia, Y.; Kappes, J.C.; Barnes, S.; Kimberly, R.P.; Grizzle, W.E.; et al. Murine mammary carcinoma exosomes promote tumor growth by suppression of NK cell function. J. Immunol. 2006, 176, 1375–1385. [Google Scholar] [CrossRef] [Green Version]
- Umezu, T.; Tadokoro, H.; Azuma, K.; Yoshizawa, S.; Ohyashiki, K.; Ohyashiki, J.H. Exosomal miR-135b shed from hypoxic multiple myeloma cells enhances angiogenesis by targeting factor-inhibiting HIF-1. Blood 2014, 124, 3748–3757. [Google Scholar] [CrossRef]
- Moore, M.; Davachi, F.; Bongo, L.; Seruvugo, H.; Mushiya, K.; Roy, J.A.; Mambu ma, D. New parameters for evaluating oral rehydration therapy: One year’s experience in a major urban hospital in Zaire. J. Trop. Pediatr. 1989, 35, 179–184. [Google Scholar] [CrossRef]
- Hur, J.Y.; Kim, H.J.; Lee, J.S.; Choi, C.M.; Lee, J.C.; Jung, M.K.; Pack, C.G.; Lee, K.Y. Extracellular vesicle-derived DNA for performing EGFR genotyping of NSCLC patients. Mol. Cancer 2018, 17, 15. [Google Scholar] [CrossRef] [Green Version]
- Klump, J.; Phillipp, U.; Follo, M.; Eremin, A.; Lehmann, H.; Nestel, S.; von Bubnoff, N.; Nazarenko, I. Extracellular vesicles or free circulating DNA: Where to search for BRAF and cKIT mutations? Nanomedicine 2018, 14, 875–882. [Google Scholar] [CrossRef]
- Kontopoulou, E.; Strachan, S.; Reinhardt, K.; Kunz, F.; Walter, C.; Walkenfort, B.; Jastrow, H.; Hasenberg, M.; Giebel, B.; von Neuhoff, N.; et al. Evaluation of dsDNA from extracellular vesicles (EVs) in pediatric AML diagnostics. Ann. Hematol. 2020, 99, 459–475. [Google Scholar] [CrossRef] [PubMed]
- Maire, C.L.; Fuh, M.M.; Kaulich, K.; Fita, K.D.; Stevic, I.; Heiland, D.H.; Welsh, J.A.; Jones, J.C.; Gorgens, A.; Ricklefs, T.; et al. Genome-wide methylation profiling of glioblastoma cell-derived extracellular vesicle DNA allows tumor classification. Neuro-Oncology 2021, 23, 1087–1099. [Google Scholar] [CrossRef] [PubMed]
- Sidhom, K.; Obi, P.O.; Saleem, A. A Review of Exosomal Isolation Methods: Is Size Exclusion Chromatography the Best Option? Int. J. Mol. Sci. 2020, 21, 6466. [Google Scholar] [CrossRef] [PubMed]
- Liangsupree, T.; Multia, E.; Riekkola, M.L. Modern isolation and separation techniques for extracellular vesicles. J. Chromatogr. A 2021, 1636, 461773. [Google Scholar] [CrossRef] [PubMed]
- Furi, I.; Momen-Heravi, F.; Szabo, G. Extracellular vesicle isolation: Present and future. Ann. Transl. Med. 2017, 5, 263. [Google Scholar] [CrossRef] [Green Version]
- Lobb, R.J.; Becker, M.; Wen, S.W.; Wong, C.S.; Wiegmans, A.P.; Leimgruber, A.; Moller, A. Optimized exosome isolation protocol for cell culture supernatant and human plasma. J. Extracell. Vesicles 2015, 4, 27031. [Google Scholar] [CrossRef]
- Lazaro-Ibanez, E.; Lasser, C.; Shelke, G.V.; Crescitelli, R.; Jang, S.C.; Cvjetkovic, A.; Garcia-Rodriguez, A.; Lotvall, J. DNA analysis of low- and high-density fractions defines heterogeneous subpopulations of small extracellular vesicles based on their DNA cargo and topology. J. Extracell. Vesicles 2019, 8, 1656993. [Google Scholar] [CrossRef] [Green Version]
- Tian, T.; Zhu, Y.L.; Zhou, Y.Y.; Liang, G.F.; Wang, Y.Y.; Hu, F.H.; Xiao, Z.D. Exosome uptake through clathrin-mediated endocytosis and macropinocytosis and mediating miR-21 delivery. J. Biol. Chem. 2014, 289, 22258–22267. [Google Scholar] [CrossRef] [Green Version]
- Bakhoum, S.F.; Ngo, B.; Laughney, A.M.; Cavallo, J.A.; Murphy, C.J.; Ly, P.; Shah, P.; Sriram, R.K.; Watkins, T.B.K.; Taunk, N.K.; et al. Chromosomal instability drives metastasis through a cytosolic DNA response. Nature 2018, 553, 467–472. [Google Scholar] [CrossRef] [Green Version]
- Torralba, D.; Baixauli, F.; Villarroya-Beltri, C.; Fernandez-Delgado, I.; Latorre-Pellicer, A.; Acin-Perez, R.; Martin-Cofreces, N.B.; Jaso-Tamame, A.L.; Iborra, S.; Jorge, I.; et al. Priming of dendritic cells by DNA-containing extracellular vesicles from activated T cells through antigen-driven contacts. Nat. Commun. 2018, 9, 2658. [Google Scholar] [CrossRef] [Green Version]
- Ludwig, A.K.; De Miroschedji, K.; Doeppner, T.R.; Borger, V.; Ruesing, J.; Rebmann, V.; Durst, S.; Jansen, S.; Bremer, M.; Behrmann, E.; et al. Precipitation with polyethylene glycol followed by washing and pelleting by ultracentrifugation enriches extracellular vesicles from tissue culture supernatants in small and large scales. J. Extracell. Vesicles 2018, 7, 1528109. [Google Scholar] [CrossRef] [PubMed]
- Chen, S.Y.; Bestvater, F.; Schaufler, W.; Heintzmann, R.; Cremer, C. Patterned illumination single molecule localization microscopy (piSMLM): User defined blinking regions of interest. Opt. Express 2018, 26, 30009–30020. [Google Scholar] [CrossRef] [PubMed]
- Ovesny, M.; Krizek, P.; Borkovec, J.; Svindrych, Z.; Hagen, G.M. ThunderSTORM: A comprehensive ImageJ. plug-in for PALM and STORM data analysis and super-resolution imaging. Bioinformatics 2014, 30, 2389–2390. [Google Scholar] [CrossRef] [PubMed]
- Schindelin, J.; Arganda-Carreras, I.; Frise, E.; Kaynig, V.; Longair, M.; Pietzsch, T.; Preibisch, S.; Rueden, C.; Saalfeld, S.; Schmid, B.; et al. Fiji: An open-source platform for biological-image analysis. Nat. Methods 2012, 9, 676–682. [Google Scholar] [CrossRef] [PubMed] [Green Version]
- Bolger, A.M.; Lohse, M.; Usadel, B. Trimmomatic: A flexible trimmer for Illumina sequence data. Bioinformatics 2014, 30, 2114–2120. [Google Scholar] [CrossRef] [PubMed] [Green Version]
- Li, H. A statistical framework for SNP calling, mutation discovery, association mapping and population genetical parameter estimation from sequencing data. Bioinformatics 2011, 27, 2987–2993. [Google Scholar] [CrossRef] [PubMed] [Green Version]
- Webber, J.; Clayton, A. How pure are your vesicles? J. Extracell. Vesicles 2013, 2, 19861. [Google Scholar] [CrossRef]
- Kornilov, R.; Puhka, M.; Mannerstrom, B.; Hiidenmaa, H.; Peltoniemi, H.; Siljander, P.; Seppanen-Kaijansinkko, R.; Kaur, S. Efficient ultrafiltration-based protocol to deplete extracellular vesicles from fetal bovine serum. J. Extracell. Vesicles 2018, 7, 1422674. [Google Scholar] [CrossRef] [Green Version]
- Suarez, H.; Gamez-Valero, A.; Reyes, R.; Lopez-Martin, S.; Rodriguez, M.J.; Carrascosa, J.L.; Cabanas, C.; Borras, F.E.; Yanez-Mo, M. A bead-assisted flow cytometry method for the semi-quantitative analysis of Extracellular Vesicles. Sci. Rep. 2017, 7, 11271. [Google Scholar] [CrossRef] [Green Version]
- Midekessa, G.; Godakumara, K.; Ord, J.; Viil, J.; Lattekivi, F.; Dissanayake, K.; Kopanchuk, S.; Rinken, A.; Andronowska, A.; Bhattacharjee, S.; et al. Zeta Potential of Extracellular Vesicles: Toward Understanding the Attributes that Determine Colloidal Stability. ACS Omega 2020, 5, 16701–16710. [Google Scholar] [CrossRef]
- Frohlich, E. The role of surface charge in cellular uptake and cytotoxicity of medical nanoparticles. Int. J. Nanomed. 2012, 7, 5577–5591. [Google Scholar] [CrossRef] [PubMed] [Green Version]
- Chen, E.; Cario, C.L.; Leong, L.; Lopez, K.; Marquez, C.P.; Chu, C.; Li, P.S.; Oropeza, E.; Tenggara, I.; Cowan, J.; et al. Cell-free DNA concentration and fragment size as a biomarker for prostate cancer. Sci. Rep. 2021, 11, 5040. [Google Scholar] [CrossRef] [PubMed]
- Alcaide, M.; Cheung, M.; Hillman, J.; Rassekh, S.R.; Deyell, R.J.; Batist, G.; Karsan, A.; Wyatt, A.W.; Johnson, N.; Scott, D.W.; et al. Evaluating the quantity, quality and size distribution of cell-free DNA by multiplex droplet digital PCR. Sci. Rep. 2020, 10, 12564. [Google Scholar] [CrossRef] [PubMed]
- Soltesz, B.; Urbancsek, R.; Pos, O.; Hajas, O.; Forgacs, I.N.; Szilagyi, E.; Nagy-Balo, E.; Szemes, T.; Csanadi, Z.; Nagy, B. Quantification of peripheral whole blood, cell-free plasma and exosome encapsulated mitochondrial DNA copy numbers in patients with atrial fibrillation. J. Biotechnol. 2019, 299, 66–71. [Google Scholar] [CrossRef]
- Keseru, J.S.; Soltesz, B.; Lukacs, J.; Marton, E.; Szilagyi-Bonizs, M.; Penyige, A.; Poka, R.; Nagy, B. Detection of cell-free, exosomal and whole blood mitochondrial DNA copy number in plasma or whole blood of patients with serous epithelial ovarian cancer. J. Biotechnol. 2019, 298, 76–81. [Google Scholar] [CrossRef]
- Guescini, M.; Genedani, S.; Stocchi, V.; Agnati, L.F. Astrocytes and Glioblastoma cells release exosomes carrying mtDNA. J. Neural Transm. 2010, 117, 1. [Google Scholar] [CrossRef]
- Sansone, P.; Savini, C.; Kurelac, I.; Chang, Q.; Amato, L.B.; Strillacci, A.; Stepanova, A.; Iommarini, L.; Mastroleo, C.; Daly, L.; et al. Packaging and transfer of mitochondrial DNA via exosomes regulate escape from dormancy in hormonal therapy-resistant breast cancer. Proc. Natl. Acad. Sci. USA 2017, 114, E9066–E9075. [Google Scholar] [CrossRef] [Green Version]
- Motwani, M.; Pesiridis, S.; Fitzgerald, K.A. DNA sensing by the cGAS-STING pathway in health and disease. Nat. Rev. Genet. 2019, 20, 657–674. [Google Scholar] [CrossRef]
- Rappa, G.; Santos, M.F.; Green, T.M.; Karbanova, J.; Hassler, J.; Bai, Y.; Barsky, S.H.; Corbeil, D.; Lorico, A. Nuclear transport of cancer extracellular vesicle-derived biomaterials through nuclear envelope invagination-associated late endosomes. Oncotarget 2017, 8, 14443–14461. [Google Scholar] [CrossRef] [Green Version]
- Cambier, L.; Stachelek, K.; Triska, M.; Jubran, R.; Huang, M.; Li, W.; Zhang, J.; Li, J.; Cobrinik, D. Extracellular vesicle-associated repetitive element DNAs as candidate osteosarcoma biomarkers. Sci. Rep. 2021, 11, 94. [Google Scholar] [CrossRef]
- Vaidya, M.; Bacchus, M.; Sugaya, K. Differential sequences of exosomal NANOG DNA as a potential diagnostic cancer marker. PLoS ONE 2018, 13, e0197782. [Google Scholar] [CrossRef] [PubMed]
- Cai, J.; Han, Y.; Ren, H.; Chen, C.; He, D.; Zhou, L.; Eisner, G.M.; Asico, L.D.; Jose, P.A.; Zeng, C. Extracellular vesicle-mediated transfer of donor genomic DNA to recipient cells is a novel mechanism for genetic influence between cells. J. Mol. Cell Biol. 2013, 5, 227–238. [Google Scholar] [CrossRef] [PubMed] [Green Version]
- Gamez-Valero, A.; Monguio-Tortajada, M.; Carreras-Planella, L.; Franquesa, M.; Beyer, K.; Borras, F.E. Size-Exclusion Chromatography-based isolation minimally alters Extracellular Vesicles’ characteristics compared to precipitating agents. Sci. Rep. 2016, 6, 33641. [Google Scholar] [CrossRef] [PubMed] [Green Version]
- Gautier, M.K.; Ginsberg, S.D. A method for quantification of vesicular compartments within cells using 3D reconstructed confocal z-stacks: Comparison of ImageJ. and Imaris to count early endosomes within basal forebrain cholinergic neurons. J. Neurosci. Methods 2021, 350, 109038. [Google Scholar] [CrossRef]
- Vagner, T.; Spinelli, C.; Minciacchi, V.R.; Balaj, L.; Zandian, M.; Conley, A.; Zijlstra, A.; Freeman, M.R.; Demichelis, F.; De, S.; et al. Large extracellular vesicles carry most of the tumour DNA circulating in prostate cancer patient plasma. J. Extracell. Vesicles 2018, 7, 1505403. [Google Scholar] [CrossRef] [Green Version]
- Shlomai, A.; Schwartz, R.E.; Ramanan, V.; Bhatta, A.; de Jong, Y.P.; Bhatia, S.N.; Rice, C.M. Modeling host interactions with hepatitis B virus using primary and induced pluripotent stem cell-derived hepatocellular systems. Proc. Natl. Acad. Sci. USA 2014, 111, 12193–12198. [Google Scholar] [CrossRef] [Green Version]
- Morissette, G.; Flamand, L. Herpesviruses and chromosomal integration. J. Virol. 2010, 84, 12100–12109. [Google Scholar] [CrossRef] [Green Version]


Publisher’s Note: MDPI stays neutral with regard to jurisdictional claims in published maps and institutional affiliations. |
© 2022 by the authors. Licensee MDPI, Basel, Switzerland. This article is an open access article distributed under the terms and conditions of the Creative Commons Attribution (CC BY) license (https://creativecommons.org/licenses/by/4.0/).
Share and Cite
Chetty, V.K.; Ghanam, J.; Anchan, S.; Reinhardt, K.; Brenzel, A.; Gelléri, M.; Cremer, C.; Grueso-Navarro, E.; Schneider, M.; von Neuhoff, N.; et al. Efficient Small Extracellular Vesicles (EV) Isolation Method and Evaluation of EV-Associated DNA Role in Cell–Cell Communication in Cancer. Cancers 2022, 14, 2068. https://doi.org/10.3390/cancers14092068
Chetty VK, Ghanam J, Anchan S, Reinhardt K, Brenzel A, Gelléri M, Cremer C, Grueso-Navarro E, Schneider M, von Neuhoff N, et al. Efficient Small Extracellular Vesicles (EV) Isolation Method and Evaluation of EV-Associated DNA Role in Cell–Cell Communication in Cancer. Cancers. 2022; 14(9):2068. https://doi.org/10.3390/cancers14092068
Chicago/Turabian StyleChetty, Venkatesh Kumar, Jamal Ghanam, Srishti Anchan, Katarina Reinhardt, Alexandra Brenzel, Márton Gelléri, Christoph Cremer, Elena Grueso-Navarro, Markus Schneider, Nils von Neuhoff, and et al. 2022. "Efficient Small Extracellular Vesicles (EV) Isolation Method and Evaluation of EV-Associated DNA Role in Cell–Cell Communication in Cancer" Cancers 14, no. 9: 2068. https://doi.org/10.3390/cancers14092068