
Evaluation of Microscopic Tumour Extension in Localized Stage Non-Small-Cell Lung Cancer for Stereotactic Radiotherapy Planning

 , , and
Abstract
:Simple Summary
Abstract
1. Introduction
2. Materials and Methods
2.1. Ethical Approval
2.2. Patients
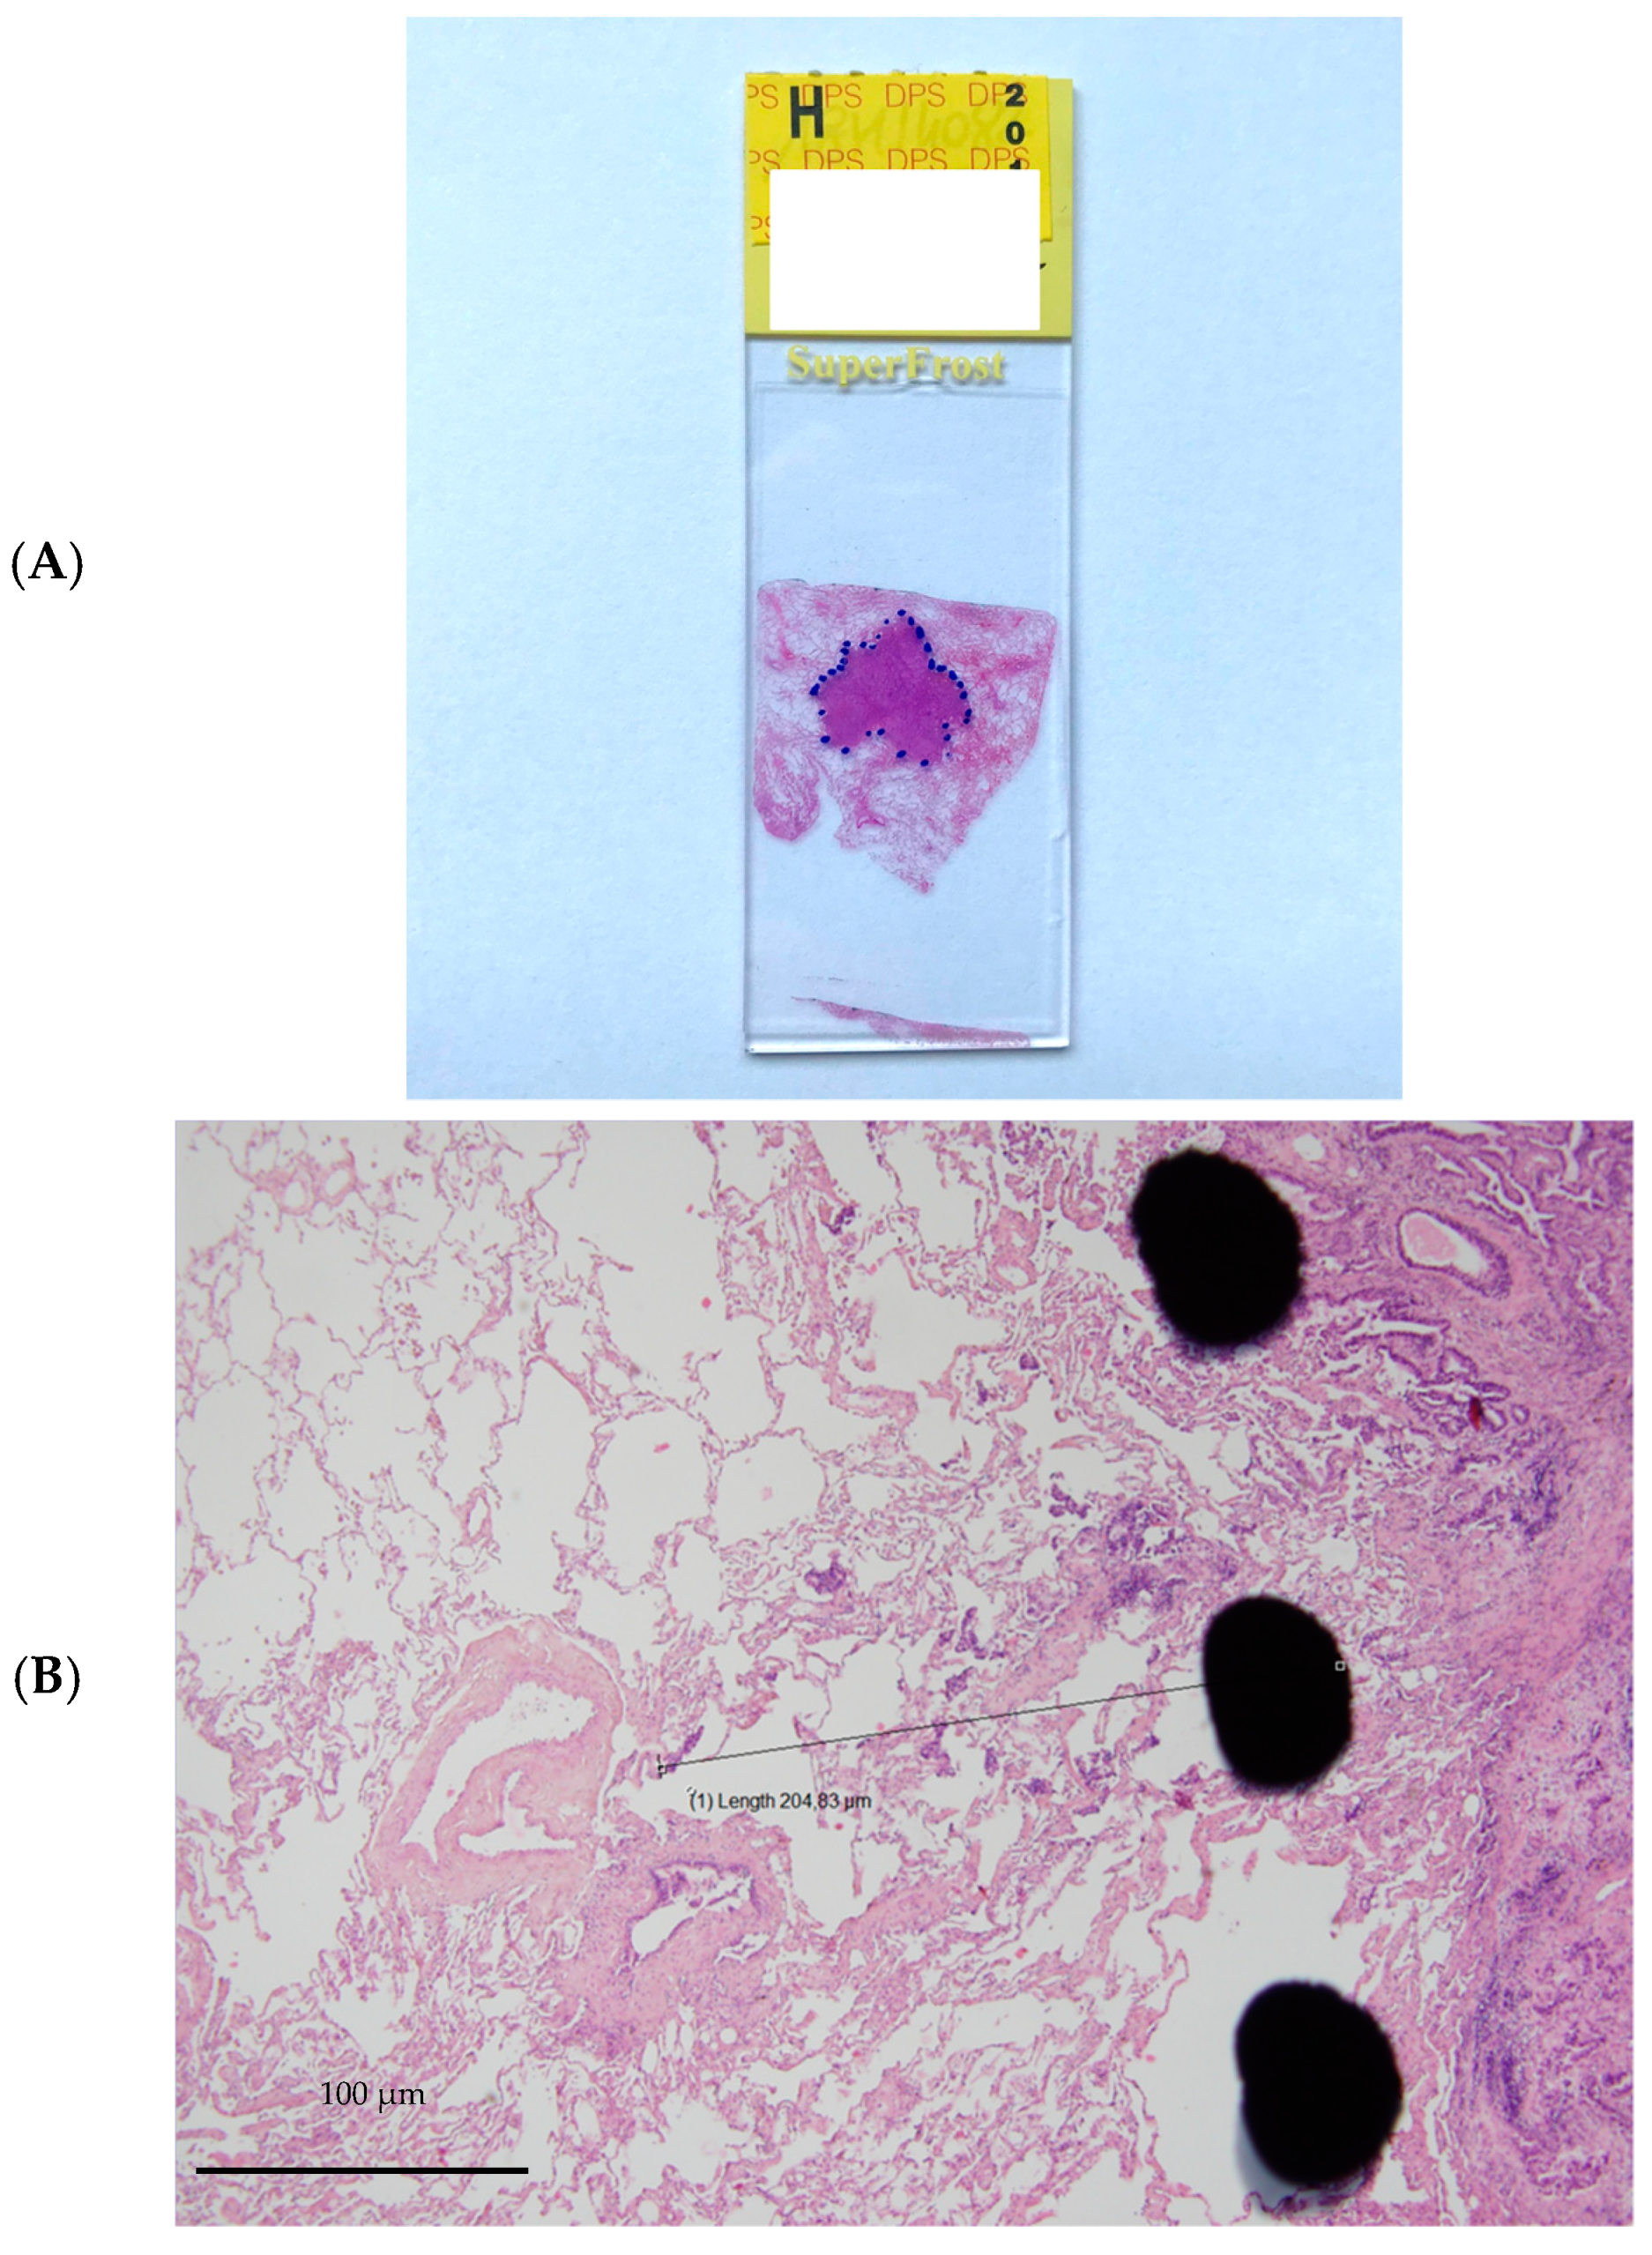
2.3. Histology
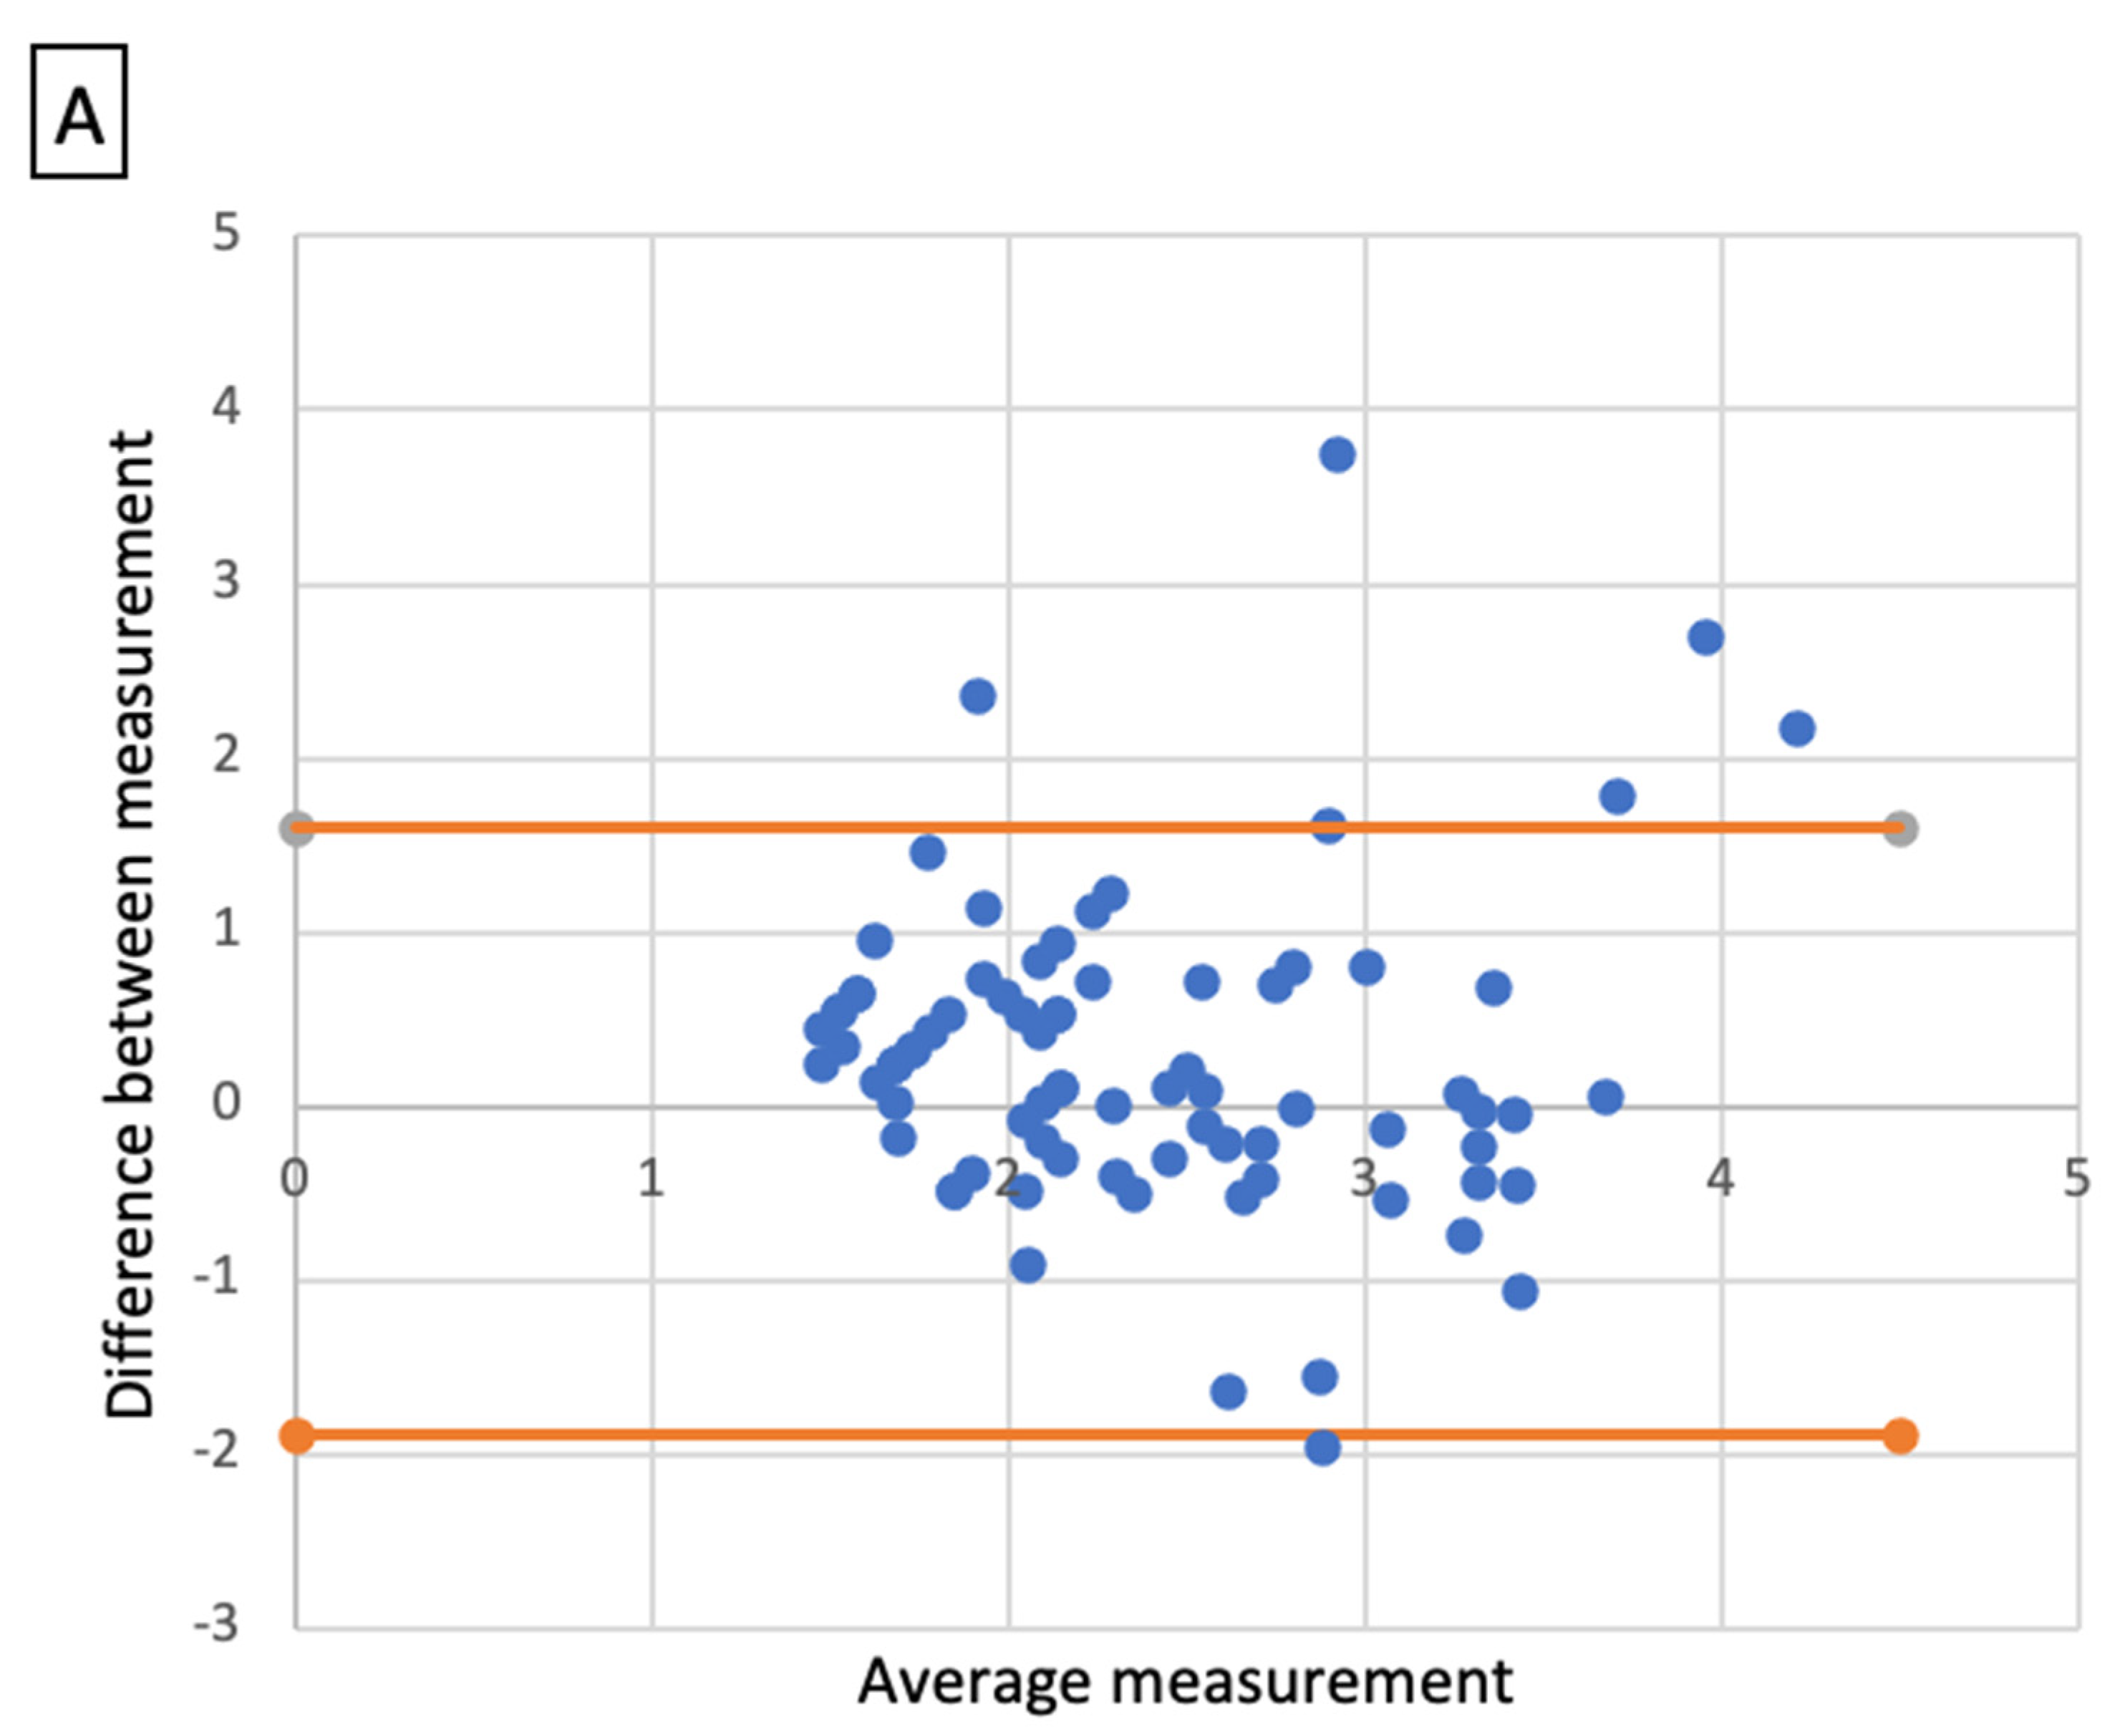
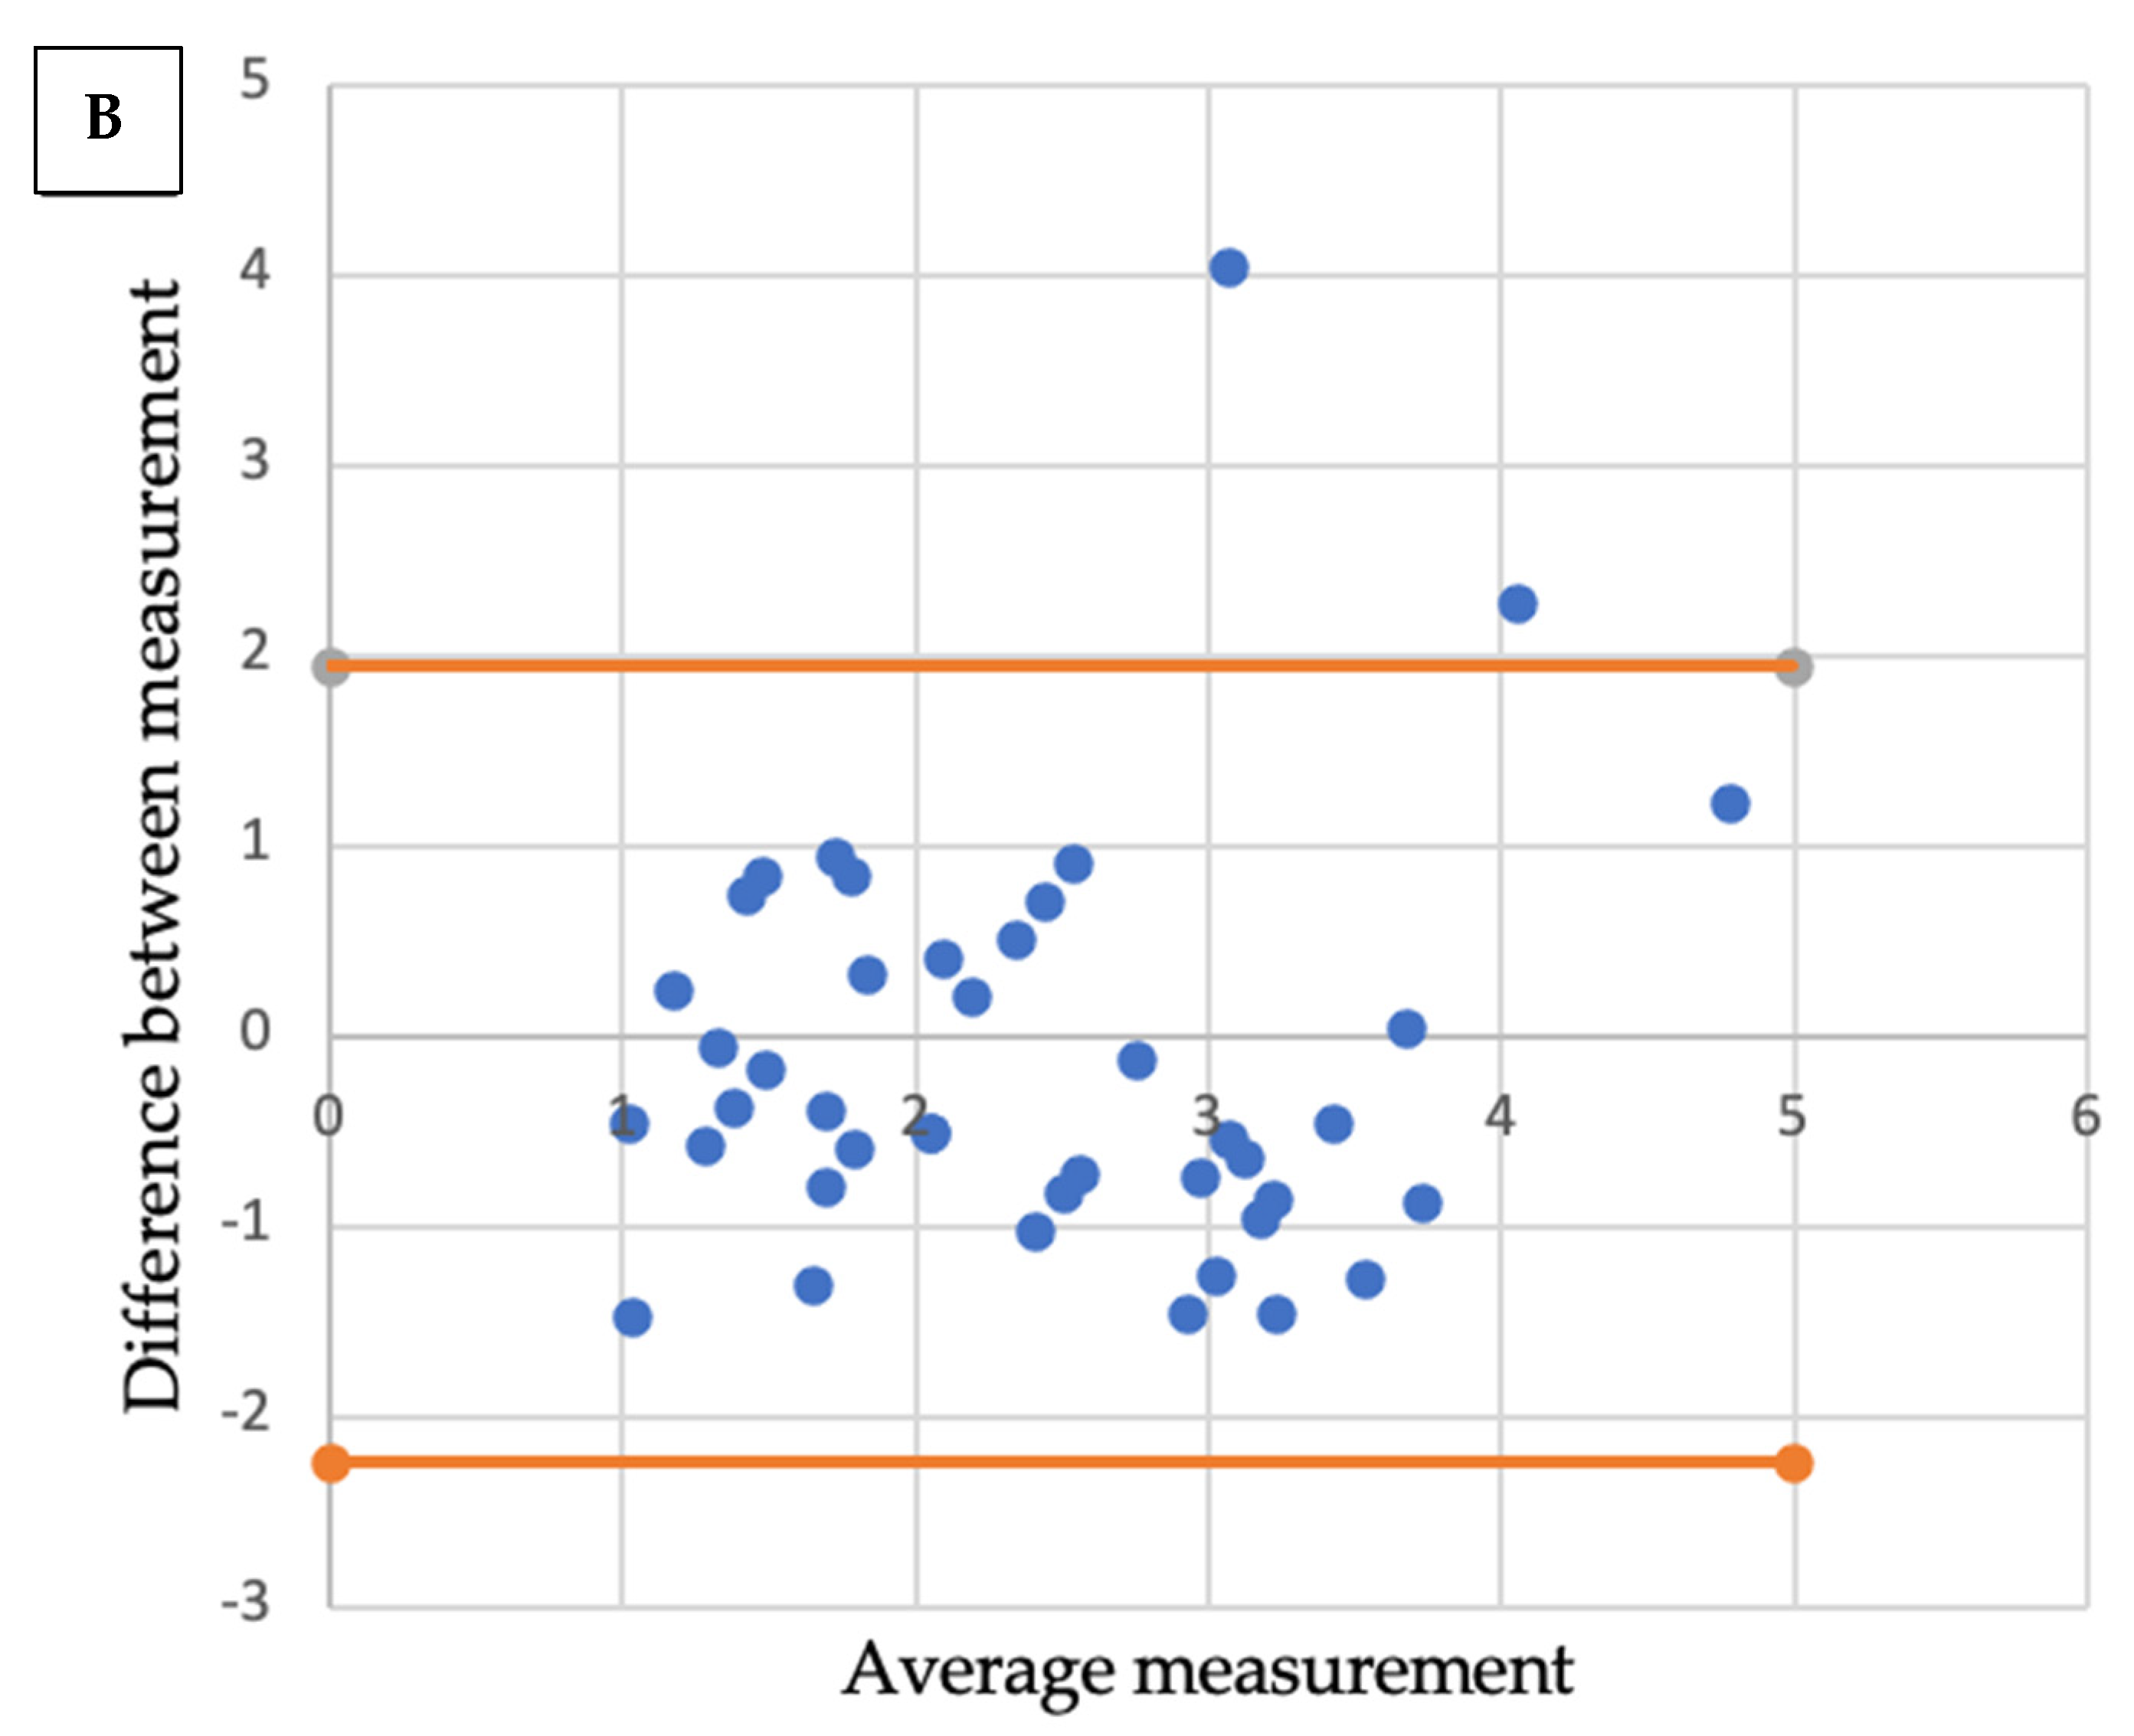
2.4. Statistical Analysis
3. Results
3.1. Patient and Tumour Characteristics
3.2. Radio-Histologic Correlations
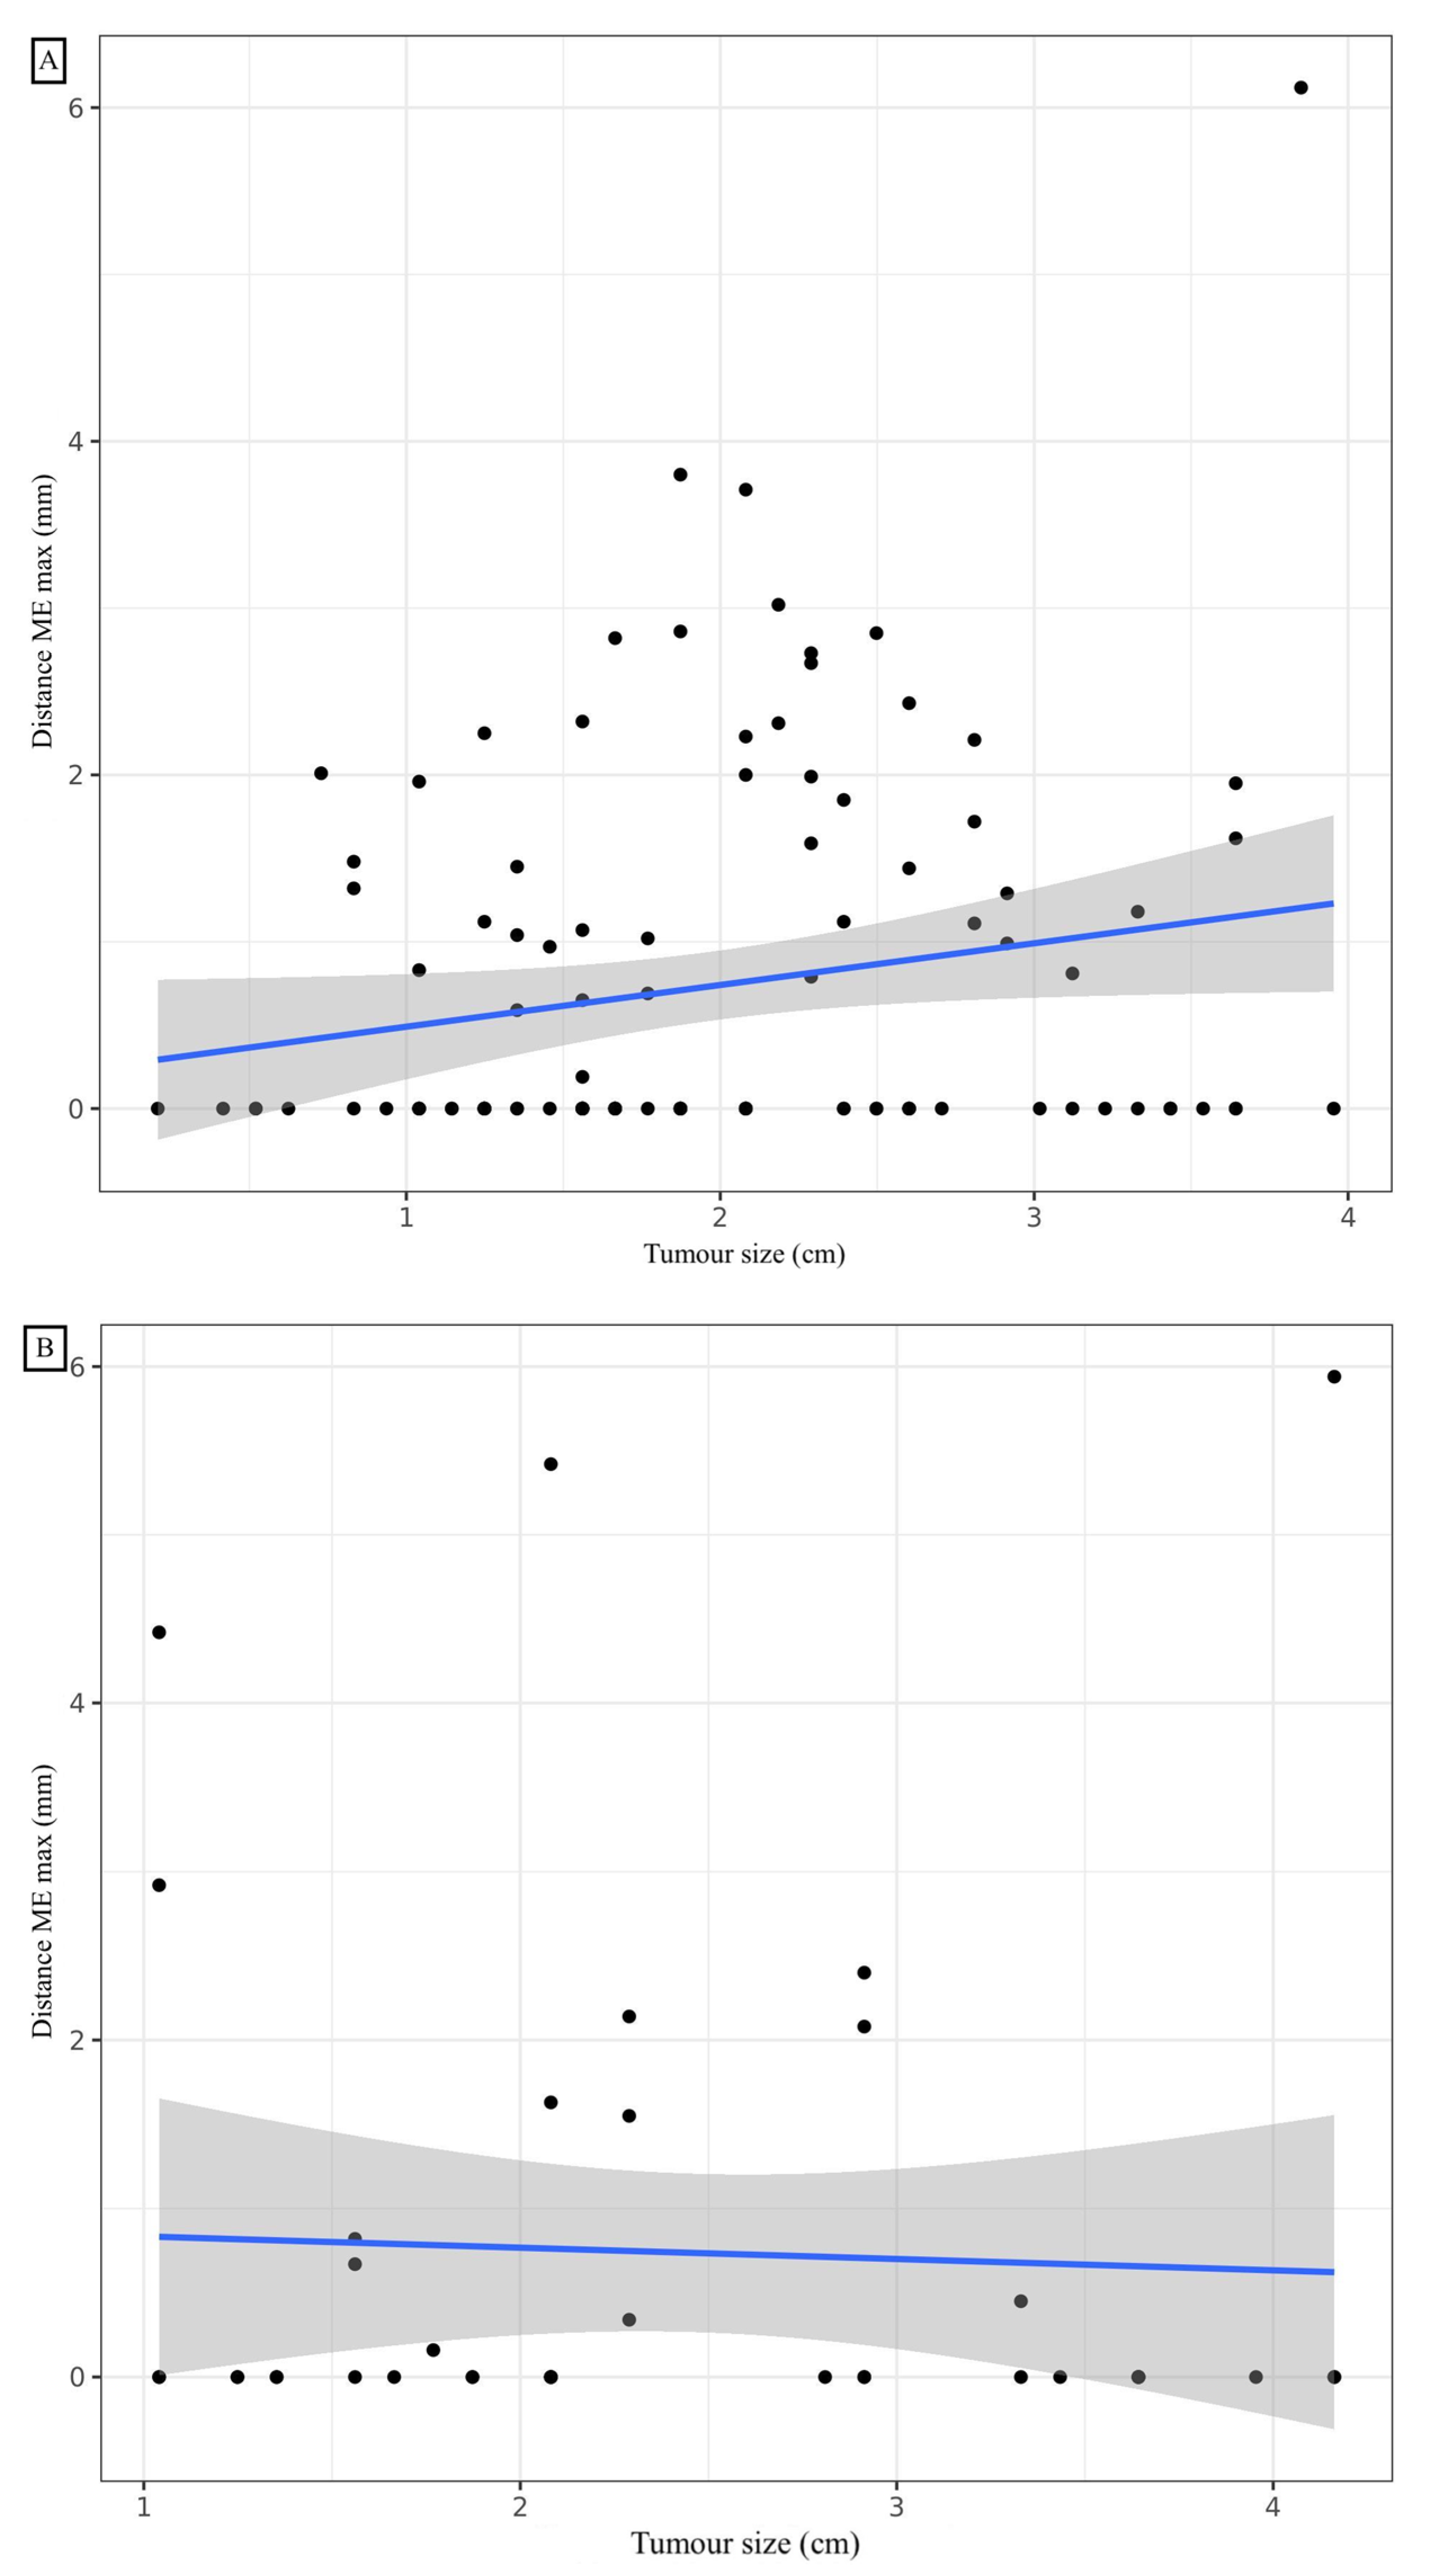
3.3. Adenocarcinoma
3.4. Squamous Cell Carcinoma
4. Discussion
5. Conclusions
Author Contributions
Funding
Institutional Review Board Statement
Informed Consent Statement
Data Availability Statement
Conflicts of Interest
Abbreviations
| ADC | adenocarcinoma |
| BED | Biological Equivalent Dose |
| COPD | Chronic Obstructive Pulmonary Disease |
| CT | Computed Tomographic |
| CTV | Clinical Target Volume |
| DIAMIC | computerized database of anatomoclinical reports |
| ECE | Extra Capsular Extension |
| ESTRO | European Society of Radiation Oncology |
| GTV | Gross Tumour Volume |
| ICRU | International Commission on Radiation Units and Measurements |
| ITV | internal target volume |
| ME | microscopic tumour extension |
| NSCLC | Non-Small-Cell Lung Cancer |
| PTV | Planning Target Volume |
| SBRT | Stereotactic Body Radiation Therapy |
| SCC | Squamous Cell Carcinoma |
| TILs | Tumour-infiltrating Lymphocytes |
| WHO | World Health Organization |
References
- Herbst, R.S.; Heymach, J.V.; Lippman, S.M. Lung Cancer. N. Engl. J. Med. 2008, 359, 1367–1380. [Google Scholar] [CrossRef] [PubMed] [Green Version]
- Girard, N.; Mornex, F. Stereotactic radiotherapy for non-small cell lung cancer: From concept to clinical reality. 2011 update. Cancer Radiother. 2011, 15, 522–526. [Google Scholar] [CrossRef] [PubMed]
- Scott, W.J.; Howington, J.; Feigenberg, S.; Movsas, B.; Pisters, K. American College of Chest Physicians Treatment of Non-Small Cell Lung Cancer Stage I and Stage II: ACCP Evidence-Based Clinical Practice Guidelines (2nd Edition). Chest 2007, 132, 234S–242S. [Google Scholar] [CrossRef] [PubMed] [Green Version]
- Chang, J.Y.; Mehran, R.J.; Feng, L.; Verma, V.; Liao, Z.; Welsh, J.W.; Lin, S.H.; O’Reilly, M.S.; Jeter, M.D.; Balter, P.A.; et al. Stereotactic Ablative Radiotherapy for Operable Stage I Non-Small-Cell Lung Cancer (Revised STARS): Long-Term Results of a Single-Arm, Prospective Trial with Prespecified Comparison to Surgery. Lancet Oncol. 2021, 22, 1448–1457. [Google Scholar] [CrossRef]
- Chang, J.Y.; Senan, S.; Paul, M.A.; Mehran, R.J.; Louie, A.V.; Balter, P.; Groen, H.J.M.; McRae, S.E.; Widder, J.; Feng, L.; et al. Stereotactic Ablative Radiotherapy versus Lobectomy for Operable Stage I Non-Small-Cell Lung Cancer: A Pooled Analysis of Two Randomised Trials. Lancet Oncol. 2015, 16, 630–637. [Google Scholar] [CrossRef] [Green Version]
- Zheng, X.; Schipper, M.; Kidwell, K.; Lin, J.; Reddy, R.; Ren, Y.; Chang, A.; Lv, F.; Orringer, M.; Kong, S.F.-M. Survival Outcome after Stereotactic Body Radiation Therapy and Surgery for Stage I Non-Small Cell Lung Cancer: A Meta-Analysis. Int. J. Radiat. Oncol. Biol. Phys. 2014, 90, 603–611. [Google Scholar] [CrossRef]
- Giraud, P.; Lacornerie, T.; Mornex, F. Radiotherapy for primary lung carcinoma. Cancer Radiother. 2016, 20, S147–S156. [Google Scholar] [CrossRef]
- Fakiris, A.J.; McGarry, R.C.; Yiannoutsos, C.T.; Papiez, L.; Williams, M.; Henderson, M.A.; Timmerman, R. Stereotactic Body Radiation Therapy for Early-Stage Non-Small-Cell Lung Carcinoma: Four-Year Results of a Prospective Phase II Study. Int. J. Radiat. Oncol. Biol. Phys. 2009, 75, 677–682. [Google Scholar] [CrossRef]
- Ricardi, U.; Filippi, A.R.; Guarneri, A.; Giglioli, F.R.; Ciammella, P.; Franco, P.; Mantovani, C.; Borasio, P.; Scagliotti, G.V.; Ragona, R. Stereotactic Body Radiation Therapy for Early Stage Non-Small Cell Lung Cancer: Results of a Prospective Trial. Lung Cancer 2010, 68, 72–77. [Google Scholar] [CrossRef]
- Vansteenkiste, J.; Crinò, L.; Dooms, C.; Douillard, J.Y.; Faivre-Finn, C.; Lim, E.; Rocco, G.; Senan, S.; Van Schil, P.; Veronesi, G.; et al. 2nd ESMO Consensus Conference on Lung Cancer: Early-Stage Non-Small-Cell Lung Cancer Consensus on Diagnosis, Treatment and Follow-Up. Ann. Oncol. 2014, 25, 1462–1474. [Google Scholar] [CrossRef]
- Timmerman, R.; Paulus, R.; Galvin, J.; Michalski, J.; Straube, W.; Bradley, J.; Fakiris, A.; Bezjak, A.; Videtic, G.; Johnstone, D.; et al. Stereotactic Body Radiation Therapy for Inoperable Early Stage Lung Cancer. JAMA 2010, 303, 1070–1076. [Google Scholar] [CrossRef] [PubMed] [Green Version]
- Giraud, P.; Antoine, M.; Larrouy, A.; Milleron, B.; Callard, P.; De Rycke, Y.; Carette, M.F.; Rosenwald, J.C.; Cosset, J.M.; Housset, M.; et al. Evaluation of Microscopic Tumor Extension in Non-Small-Cell Lung Cancer for Three-Dimensional Conformal Radiotherapy Planning. Int. J. Radiat. Oncol. Biol. Phys. 2000, 48, 1015–1024. [Google Scholar] [CrossRef]
- Antoni, D.; Srour, I.; Mornex, F. Lung cancer: Stereotactic body radiation therapy and surgery. Cancer Radiother. 2015, 19, 371–376. [Google Scholar] [CrossRef] [PubMed]
- Waissi, W.; Noël, G.; Giraud, P. Follow-up after lung stereotactic radiotherapy. Cancer Radiother. 2015, 19, 566–572. [Google Scholar] [CrossRef]
- Park, H.S.; Lee, S.; Haam, S.; Lee, G.D. Effect of Formalin Fixation and Tumour Size in Small-Sized Non-Small-Cell Lung Cancer: A Prospective, Single-Centre Study. Histopathology 2017, 71, 437–445. [Google Scholar] [CrossRef]
- Travis, W.D.; Brambilla, E.; Nicholson, A.G.; Yatabe, Y.; Austin, J.H.M.; Beasley, M.B.; Chirieac, L.R.; Dacic, S.; Duhig, E.; Flieder, D.B.; et al. The 2015 World Health Organization Classification of Lung Tumors. J. Thorac. Oncol. 2015, 10, 1243–1260. [Google Scholar] [CrossRef] [Green Version]
- Hendry, S.; Salgado, R.; Gevaert, T.; Russell, P.A.; John, T.; Thapa, B.; Christie, M.; van de Vijver, K.; Estrada, M.V.; Gonzalez-Ericsson, P.I.; et al. Assessing Tumor Infiltrating Lymphocytes in Solid Tumors: A Practical Review for Pathologists and Proposal for a Standardized Method from the International Immuno-Oncology Biomarkers Working Group. Adv. Anat. Pathol. 2017, 24, 311–335. [Google Scholar] [CrossRef]
- Li, W.; Jm, Y.; Gh, L.; Wx, Z.; Ww, L.; Bj, Z. A Comparative Study on Radiology and Pathology Target Volume in Non-Small-Cell Lung Cancer. Zhonghua Zhong Liu Za Zhi 2003, 25, 566–568. [Google Scholar]
- Chan, R.; He, Y.; Haque, A.; Zwischenberger, J. Computed Tomographic-Pathologic Correlation of Gross Tumor Volume and Clinical Target Volume in Non-Small Cell Lung Cancer: A Pilot Experience. Arch. Pathol. Lab. Med. 2001, 125, 1469–1472. [Google Scholar] [CrossRef]
- Yuan, S.; Meng, X.; Yu, J.; Mu, D.; Chao, K.S.C.; Zhang, J.; Zhong, W.; Yu, Y.; Wang, J.; Sun, X.; et al. Determining Optimal Clinical Target Volume Margins on the Basis of Microscopic Extracapsular Extension of Metastatic Nodes in Patients with Non-Small-Cell Lung Cancer. Int. J. Radiat. Oncol. Biol. Phys. 2007, 67, 727–734. [Google Scholar] [CrossRef]
- Loon, J.V.; Blauwgeers, H.; Rossi, M.; Klomp, H.; Gilhuijs, K. Microscopic Disease Extension in Three Dimensions for Non-Small-Cell Lung Cancer: Development of a Prediction Model Using Pathology-Validated Positron Emission Tomography and Computed Tomography Features. Int. J. Radiat. Oncol. Biol. Phys. 2012, 82, 448–456. [Google Scholar] [CrossRef] [PubMed]
- Grills, I.S.; Fitch, D.L.; Goldstein, N.S.; Yan, D.; Chmielewski, G.W.; Welsh, R.J.; Kestin, L.L. Clinicopathologic Analysis of Microscopic Extension in Lung Adenocarcinoma: Defining Clinical Target Volume for Radiotherapy. Int. J. Radiat. Oncol. Biol. Phys. 2007, 69, 334–341. [Google Scholar] [CrossRef] [PubMed]
- Guckenberger, M.; Andratschke, N.; Dieckmann, K.; Hoogeman, M.S.; Hoyer, M.; Hurkmans, C.; Tanadini-Lang, S.; Lartigau, E.; Romero, A.M.; Senan, S.; et al. ESTRO ACROP Consensus Guideline on Implementation and Practice of Stereotactic Body Radiotherapy for Peripherally Located Early Stage Non-Small Cell Lung Cancer. Radiother. Oncol. 2017, 124, 11–17. [Google Scholar] [CrossRef] [PubMed] [Green Version]
- Senthi, S.; Haasbeek, C.J.A.; Slotman, B.J.; Senan, S. Outcomes of Stereotactic Ablative Radiotherapy for Central Lung Tumours: A Systematic Review. Radiother. Oncol. 2013, 106, 276–282. [Google Scholar] [CrossRef] [Green Version]
- Trémolières, P.; Gonzalez-Moya, A.; Paumier, A.; Mege, M.; Blanchecotte, J.; Theotime, C.; Autret, D.; Dufreneix, S. Lung Stereotactic Body Radiation Therapy: Personalized PTV Margins According to Tumor Location and Number of Four-Dimensional CT Scans. Radiat. Oncol. 2022, 17, 5. [Google Scholar] [CrossRef]
- Chi, A.; Liao, Z.; Nguyen, N.P.; Xu, J.; Stea, B.; Komaki, R. Systemic Review of the Patterns of Failure Following Stereotactic Body Radiation Therapy in Early-Stage Non-Small-Cell Lung Cancer: Clinical Implications. Radiother. Oncol. 2010, 94, 1–11. [Google Scholar] [CrossRef]
- Wulf, J.; Baier, K.; Mueller, G.; Flentje, M.P. Dose-Response in Stereotactic Irradiation of Lung Tumors. Radiother. Oncol. 2005, 77, 83–87. [Google Scholar] [CrossRef]
- Klement, R.J.; Sonke, J.-J.; Allgäuer, M.; Andratschke, N.; Appold, S.; Belderbos, J.; Belka, C.; Blanck, O.; Dieckmann, K.; Eich, H.T.; et al. Correlating Dose Variables with Local Tumor Control in Stereotactic Body Radiation Therapy for Early-Stage Non-Small Cell Lung Cancer: A Modeling Study on 1500 Individual Treatments. Int. J. Radiat. Oncol. Biol. Phys. 2020, 107, 579–586. [Google Scholar] [CrossRef]
- Wilke, L.; Andratschke, N.; Blanck, O.; Brunner, T.B.; Combs, S.E.; Grosu, A.-L.; Moustakis, C.; Schmitt, D.; Baus, W.W.; Guckenberger, M. ICRU Report 91 on Prescribing, Recording, and Reporting of Stereotactic Treatments with Small Photon Beams: Statement from the DEGRO/DGMP Working Group Stereotactic Radiotherapy and Radiosurgery. Strahlenther. Onkol. 2019, 195, 193–198. [Google Scholar] [CrossRef]
- Pagès, F.; Berger, A.; Camus, M.; Sanchez-Cabo, F.; Costes, A.; Molidor, R.; Mlecnik, B.; Kirilovsky, A.; Nilsson, M.; Damotte, D.; et al. Effector Memory T Cells, Early Metastasis, and Survival in Colorectal Cancer. N. Engl. J. Med. 2005, 353, 2654–2666. [Google Scholar] [CrossRef]
- Angell, H.; Galon, J. From the Immune Contexture to the Immunoscore: The Role of Prognostic and Predictive Immune Markers in Cancer. Curr. Opin. Immunol. 2013, 25, 261–267. [Google Scholar] [CrossRef] [PubMed]
- Fridman, W.H.; Pagès, F.; Sautès-Fridman, C.; Galon, J. The Immune Contexture in Human Tumours: Impact on Clinical Outcome. Nat. Rev. Cancer 2012, 12, 298–306. [Google Scholar] [CrossRef] [PubMed]
- Galon, J.; Costes, A.; Sanchez-Cabo, F.; Kirilovsky, A.; Mlecnik, B.; Lagorce-Pagès, C.; Tosolini, M.; Camus, M.; Berger, A.; Wind, P.; et al. Type, Density, and Location of Immune Cells within Human Colorectal Tumors Predict Clinical Outcome. Science 2006, 313, 1960–1964. [Google Scholar] [CrossRef] [Green Version]
- Donnem, T.; Hald, S.M.; Paulsen, E.-E.; Richardsen, E.; Al-Saad, S.; Kilvaer, T.K.; Brustugun, O.T.; Helland, A.; Lund-Iversen, M.; Poehl, M.; et al. Stromal CD8+ T-Cell Density—A Promising Supplement to TNM Staging in Non-Small Cell Lung Cancer. Clin. Cancer Res. 2015, 21, 2635–2643. [Google Scholar] [CrossRef] [PubMed] [Green Version]
- Geng, Y.; Shao, Y.; He, W.; Hu, W.; Xu, Y.; Chen, J.; Wu, C.; Jiang, J. Prognostic Role of Tumor-Infiltrating Lymphocytes in Lung Cancer: A Meta-Analysis. CPB 2015, 37, 1560–1571. [Google Scholar] [CrossRef] [PubMed]
- Buisseret, L.; Desmedt, C.; Garaud, S.; Fornili, M.; Wang, X.; Van den Eyden, G.; de Wind, A.; Duquenne, S.; Boisson, A.; Naveaux, C.; et al. Reliability of Tumor-Infiltrating Lymphocyte and Tertiary Lymphoid Structure Assessment in Human Breast Cancer. Mod. Pathol. 2017, 30, 1204–1212. [Google Scholar] [CrossRef]
- Mani, N.L.; Schalper, K.A.; Hatzis, C.; Saglam, O.; Tavassoli, F.; Butler, M.; Chagpar, A.B.; Pusztai, L.; Rimm, D.L. Quantitative Assessment of the Spatial Heterogeneity of Tumor-Infiltrating Lymphocytes in Breast Cancer. Breast Cancer Res. 2016, 18, 78. [Google Scholar] [CrossRef] [Green Version]
- Bohan, P.M.K.; Chick, R.C.; Hickerson, A.T.; Messersmith, L.M.; Williams, G.M.; Cindass, J.L.; Lombardo, J.; Collins, R.; Brady, R.O.; Hale, D.F.; et al. Correlation of Tumor Microenvironment from Biopsy and Resection Specimens in Untreated Colorectal Cancer Patients: A Surprising Lack of Agreement. Cancer Immunol. Immunother. 2020, 70, 1465–1474. [Google Scholar] [CrossRef]
- Nakahara, Y.; Mochiduki, Y.; Miyamoto, Y.; Nakahara, Y.; Katsura, Y. Prognostic Significance of the Lymphocyte-to-Neutrophil Ratio in Percutaneous Fine-Needle Aspiration Biopsy Specimens of Advanced Nonsmall Cell Lung Carcinoma. Cancer 2005, 104, 1271–1280. [Google Scholar] [CrossRef]
- Yoon, H.J.; Kang, J.; Park, H.; Sohn, I.; Lee, S.-H.; Lee, H.Y. Deciphering the Tumor Microenvironment through Radiomics in Non-Small Cell Lung Cancer: Correlation with Immune Profiles. PLoS ONE 2020, 15, e0231227. [Google Scholar] [CrossRef] [Green Version]
- Sun, R.; Limkin, E.J.; Vakalopoulou, M.; Dercle, L.; Champiat, S.; Han, S.R.; Verlingue, L.; Brandao, D.; Lancia, A.; Ammari, S.; et al. A Radiomics Approach to Assess Tumour-Infiltrating CD8 Cells and Response to Anti-PD-1 or Anti-PD-L1 Immunotherapy: An Imaging Biomarker, Retrospective Multicohort Study. Lancet Oncol. 2018, 19, 1180–1191. [Google Scholar] [CrossRef]
- Tang, C.; Hobbs, B.; Amer, A.; Li, X.; Behrens, C.; Canales, J.R.; Cuentas, E.P.; Villalobos, P.; Fried, D.; Chang, J.Y.; et al. Development of an Immune-Pathology Informed Radiomics Model for Non-Small Cell Lung Cancer. Sci. Rep. 2018, 8, 1922. [Google Scholar] [CrossRef] [PubMed]
- Maeda, R.; Tomita, M.; Usuda, K.; Uramoto, H. Clinicopathologic Characteristics of Non-Small Cell Lung Cancer in Patients with Smoking-Related Chronic Obstructive Pulmonary Disease. Gen. Thorac. Cardiovasc. Surg. 2019, 67, 239–246. [Google Scholar] [CrossRef] [PubMed]
- Riquet, M.; Foucault, C.; Berna, P.; Assouad, J.; Dujon, A.; Danel, C. Prognostic Value of Histology in Resected Lung Cancer with Emphasis on the Relevance of the Adenocarcinoma Subtyping. Ann. Thorac. Surg. 2006, 81, 1988–1995. [Google Scholar] [CrossRef]
- Barletta, J.A.; Yeap, B.Y.; Chirieac, L.R. Prognostic Significance of Grading in Lung Adenocarcinoma. Cancer 2010, 116, 659–669. [Google Scholar] [CrossRef] [PubMed] [Green Version]
- Brusselle, G.G.; Joos, G.F.; Bracke, K.R. New Insights into the Immunology of Chronic Obstructive Pulmonary Disease. Lancet 2011, 378, 1015–1026. [Google Scholar] [CrossRef]
- Biton, J.; Ouakrim, H.; Dechartres, A.; Alifano, M.; Mansuet-Lupo, A.; Si, H.; Halpin, R.; Creasy, T.; Bantsimba-Malanda, C.; Arrondeau, J.; et al. Impaired Tumor-Infiltrating T Cells in Patients with Chronic Obstructive Pulmonary Disease Impact Lung Cancer Response to PD-1 Blockade. Am. J. Respir. Crit. Care Med. 2018, 198, 928–940. [Google Scholar] [CrossRef] [PubMed]
- Chen, C.-H.; Hsu, M.-Y.; Jiang, R.-S.; Wu, S.-H.; Chen, F.-J.; Liu, S.-A. Shrinkage of Head and Neck Cancer Specimens after Formalin Fixation. J. Chin. Med. Assoc. 2012, 75, 109–113. [Google Scholar] [CrossRef]
- Horn, C.L.; Naugler, C. Breast Specimen Shrinkage Following Formalin Fixation. Pathol. Lab. Med. Int. 2014, 6, 11–14. [Google Scholar] [CrossRef] [Green Version]
- Hsu, P.-K.; Huang, H.-C.; Hsieh, C.-C.; Hsu, H.-S.; Wu, Y.-C.; Huang, M.-H.; Hsu, W.-H. Effect of Formalin Fixation on Tumor Size Determination in Stage I Non-Small Cell Lung Cancer. Ann. Thorac. Surg. 2007, 84, 1825–1829. [Google Scholar] [CrossRef]
- Timmerman, R.D.; Paulus, R.; Pass, H.I.; Gore, E.M.; Edelman, M.J.; Galvin, J.; Straube, W.L.; Nedzi, L.A.; McGarry, R.C.; Robinson, C.G.; et al. Stereotactic Body Radiation Therapy for Operable Early-Stage Lung Cancer: Findings from the NRG Oncology RTOG 0618 Trial. JAMA Oncol. 2018, 4, 1263–1266. [Google Scholar] [CrossRef] [PubMed]
- Videtic, G.M.; Paulus, R.; Singh, A.K.; Chang, J.Y.; Parker, W.; Olivier, K.R.; Timmerman, R.D.; Komaki, R.R.; Urbanic, J.J.; Stephans, K.L.; et al. Long-Term Follow-up on NRG Oncology RTOG 0915 (NCCTG N0927): A Randomized Phase 2 Study Comparing 2 Stereotactic Body Radiation Therapy Schedules for Medically Inoperable Patients with Stage I Peripheral Non-Small Cell Lung Cancer. Int. J. Radiat. Oncol. Biol. Phys. 2019, 103, 1077–1084. [Google Scholar] [CrossRef] [PubMed]


| Adenocarcinoma | Squamous Cell Carcinoma | Total | ||||
|---|---|---|---|---|---|---|
| n | % | n | % | n | % | |
| Patients | 112 | 72 | 42 | 28 | 154 | |
| Slides | 341 | 73 | 127 | 27 | 468 | |
| Age (mean, in years) | 65.5 | 65.8 | ||||
| Gender | ||||||
| Male | 52 | 46 | 33 | 79 | 85 | 55 |
| Female | 60 | 54 | 9 | 21 | 69 | 45 |
| pTNM 2017 | ||||||
| pT1mi N0 | 7 | 6 | 0 | 0 | 7 | 4 |
| pT1a N0 | 7 | 6 | 8 | 19 | 15 | 10 |
| pT1b N0 | 43 | 39 | 13 | 31 | 56 | 36 |
| pT1c N0 | 28 | 25 | 7 | 17 | 35 | 22 |
| pT2a N0 | 27 | 24 | 14 | 33 | 44 | 28 |
| Architecture | ||||||
| Acinar | 60 | 54 | ||||
| Lepidic | 18 | 16 | ||||
| Mucinous | 12 | 11 | ||||
| Solid | 10 | 9 | ||||
| Papillary | 7 | 6 | ||||
| Micropapillary | 3 | 3 | ||||
| No Other Specified | 1 | 1 | ||||
| Atelectasis | ||||||
| Yes | 13 | 12 | 9 | 21 | 22 | 15 |
| No | 98 | 88 | 33 | 79 | 131 | 85 |
| Site | ||||||
| Proximal | 16 | 14 | 8 | 19 | 24 | 16 |
| Peripheral | 95 | 85 | 34 | 81 | 129 | 84 |
| Margins | ||||||
| Nodular | 32 | 29 | 16 | 38 | 48 | 31 |
| Spiculated | 79 | 71 | 26 | 62 | 105 | 62 |
| Insufflation quality | ||||||
| Good | 55 | 49 | 24 | 57 | ||
| Medium | 47 | 42 | 17 | 40 | ||
| Poor | 10 | 9 | 1 | 3 | ||
| Angioinvasion | ||||||
| Yes | 10 | 8.9 | 7 | 17 | ||
| No | 101 | 90 | 34 | 81 | ||
| Lymphatic invasion | ||||||
| Yes | 2 | 2 | 1 | 2 | ||
| No | 109 | 97 | 41 | 98 | ||
| Fibrosis | ||||||
| Yes | 34 | 30 | 13 | 31 | ||
| No | 78 | 70 | 29 | 69 | ||
| Haemorrhage | ||||||
| Yes | 44 | 39 | 17 | 40 | ||
| No | 68 | 61 | 25 | 60 | ||
| Inflammation | ||||||
| Yes | 16 | 14 | 11 | 26 | ||
| No | 96 | 86 | 31 | 74 | ||
| Mode of extension | ||||||
| AIL | 2 | 2 | 1 | 2 | 3 | 2 |
| AIV | 1 | 1 | 1 | 2 | 2 | 1 |
| STAS | 24 | 21 | 10 | 24 | 34 | 22 |
| Interstitial | 31 | 28 | 4 | 10 | 35 | 22 |
| Tabacco | ||||||
| Yes | 87 | 78 | 39 | 93 | 126 | 82 |
| No | 24 | 21 | 3 | 7 | 27 | 18 |
| COPD | ||||||
| Yes | 34 | 30 | 19 | 45 | 53 | 46 |
| No | 78 | 70 | 23 | 55 | 101 | 64 |
| TILs | ||||||
| 0–10% | 79 | 71 | 10 | 24 | 89 | 59 |
| 20–40% | 27 | 24 | 25 | 60 | 52 | 33 |
| 50–90% | 6 | 5 | 7 | 17 | 13 | 8 |
| Mean (Standard Deviation) | Median (Q25–75) | Min | Max | n | |
|---|---|---|---|---|---|
| ADC size (cm) | 1.97 (0.848) | 1.87 (1.35; 2.52) | 0.21 | 3.95 | 112 |
| ADC radiologic size (cm) | 2.15 (0.909) | 2.00 (1.50; 2.60) | 0.80 | 5.30 | 112 |
| SCC size (cm) | 2.46 (1.00) | 2.19 (1.50; 3.41) | 1.04 | 4.16 | 42 |
| SCC radiologic size (cm) | 2.33 (1.10) | 2.20 (1.57; 2.80) | 0.30 | 5.40 | 42 |
| ADC ME (mm) | 0.734 (1.12) | 0 (0; 1.30) | 0 | 6.12 | 112 |
| SCC ME (mm) | 0.737 (1.49) | 0 (0; 0.615) | 0 | 5.94 | 42 |
| Coefficients | p | p Global | ||
|---|---|---|---|---|
| Tumour size (mm) | 0.0209 (−0.00802; 0.0595) | 0.16 | 0.16 | |
| COPD | 1 vs. 0 | 0.434 (−0.0260; 1.00) | 0.065 | 0.065 |
| Number of slides | 0.166 (−0.0575; 0.504) | 0.15 | 0.15 | |
| TILs (%) | 20–40 vs. 0–10 | 0.0757 (−0.418; 0.517) | 0.74 | 0.69 |
| 50–90 vs. 0–10 | −0.340 (−0.965; 0.377) | 0.45 | - | |
| GTV volume (cm3) | −0.0304 (−0.0813; 0.0101) | 0.21 | 0.21 |
| Coefficients | p | p Global | ||
|---|---|---|---|---|
| Tumour size (mm) | −0.0461 (−0.0681; −0.0170) | <0.01 | <0.01 | |
| TILs (%) | 0–10 vs. 20–40 | 0.979 (0.159; 2.41) | 0.015 | 0.015 |
| 50–90 vs. 20–40 | −0.524 (−1.04; −0.172) | 0.25 | - | |
| COPD | 1 vs. 0 | 0.125 (−0.584; 1.08) | 0.79 | |
| Number of slides | −0.264 (−0.976; 0.287) | 0.3 | ||
| GTV volume (cm3) | 0.109 (0.0647; 0.169) | <0.001 |
Publisher’s Note: MDPI stays neutral with regard to jurisdictional claims in published maps and institutional affiliations. |
© 2022 by the authors. Licensee MDPI, Basel, Switzerland. This article is an open access article distributed under the terms and conditions of the Creative Commons Attribution (CC BY) license (https://creativecommons.org/licenses/by/4.0/).
Share and Cite
Schmitt, M.; Aussenac, L.; Seitlinger, J.; Lindner, V.; Noël, G.; Antoni, D. Evaluation of Microscopic Tumour Extension in Localized Stage Non-Small-Cell Lung Cancer for Stereotactic Radiotherapy Planning. Cancers 2022, 14, 1282. https://doi.org/10.3390/cancers14051282
Schmitt M, Aussenac L, Seitlinger J, Lindner V, Noël G, Antoni D. Evaluation of Microscopic Tumour Extension in Localized Stage Non-Small-Cell Lung Cancer for Stereotactic Radiotherapy Planning. Cancers. 2022; 14(5):1282. https://doi.org/10.3390/cancers14051282
Chicago/Turabian StyleSchmitt, Martin, Lucie Aussenac, Joseph Seitlinger, Véronique Lindner, Georges Noël, and Delphine Antoni. 2022. "Evaluation of Microscopic Tumour Extension in Localized Stage Non-Small-Cell Lung Cancer for Stereotactic Radiotherapy Planning" Cancers 14, no. 5: 1282. https://doi.org/10.3390/cancers14051282