

Impact of Tumour Segmentation Accuracy on Efficacy of Quantitative MRI Biomarkers of Radiotherapy Outcome in Brain Metastasis

Abstract
:Simple Summary
Abstract
1. Introduction
2. Materials and Methods
2.1. Data Acquisition
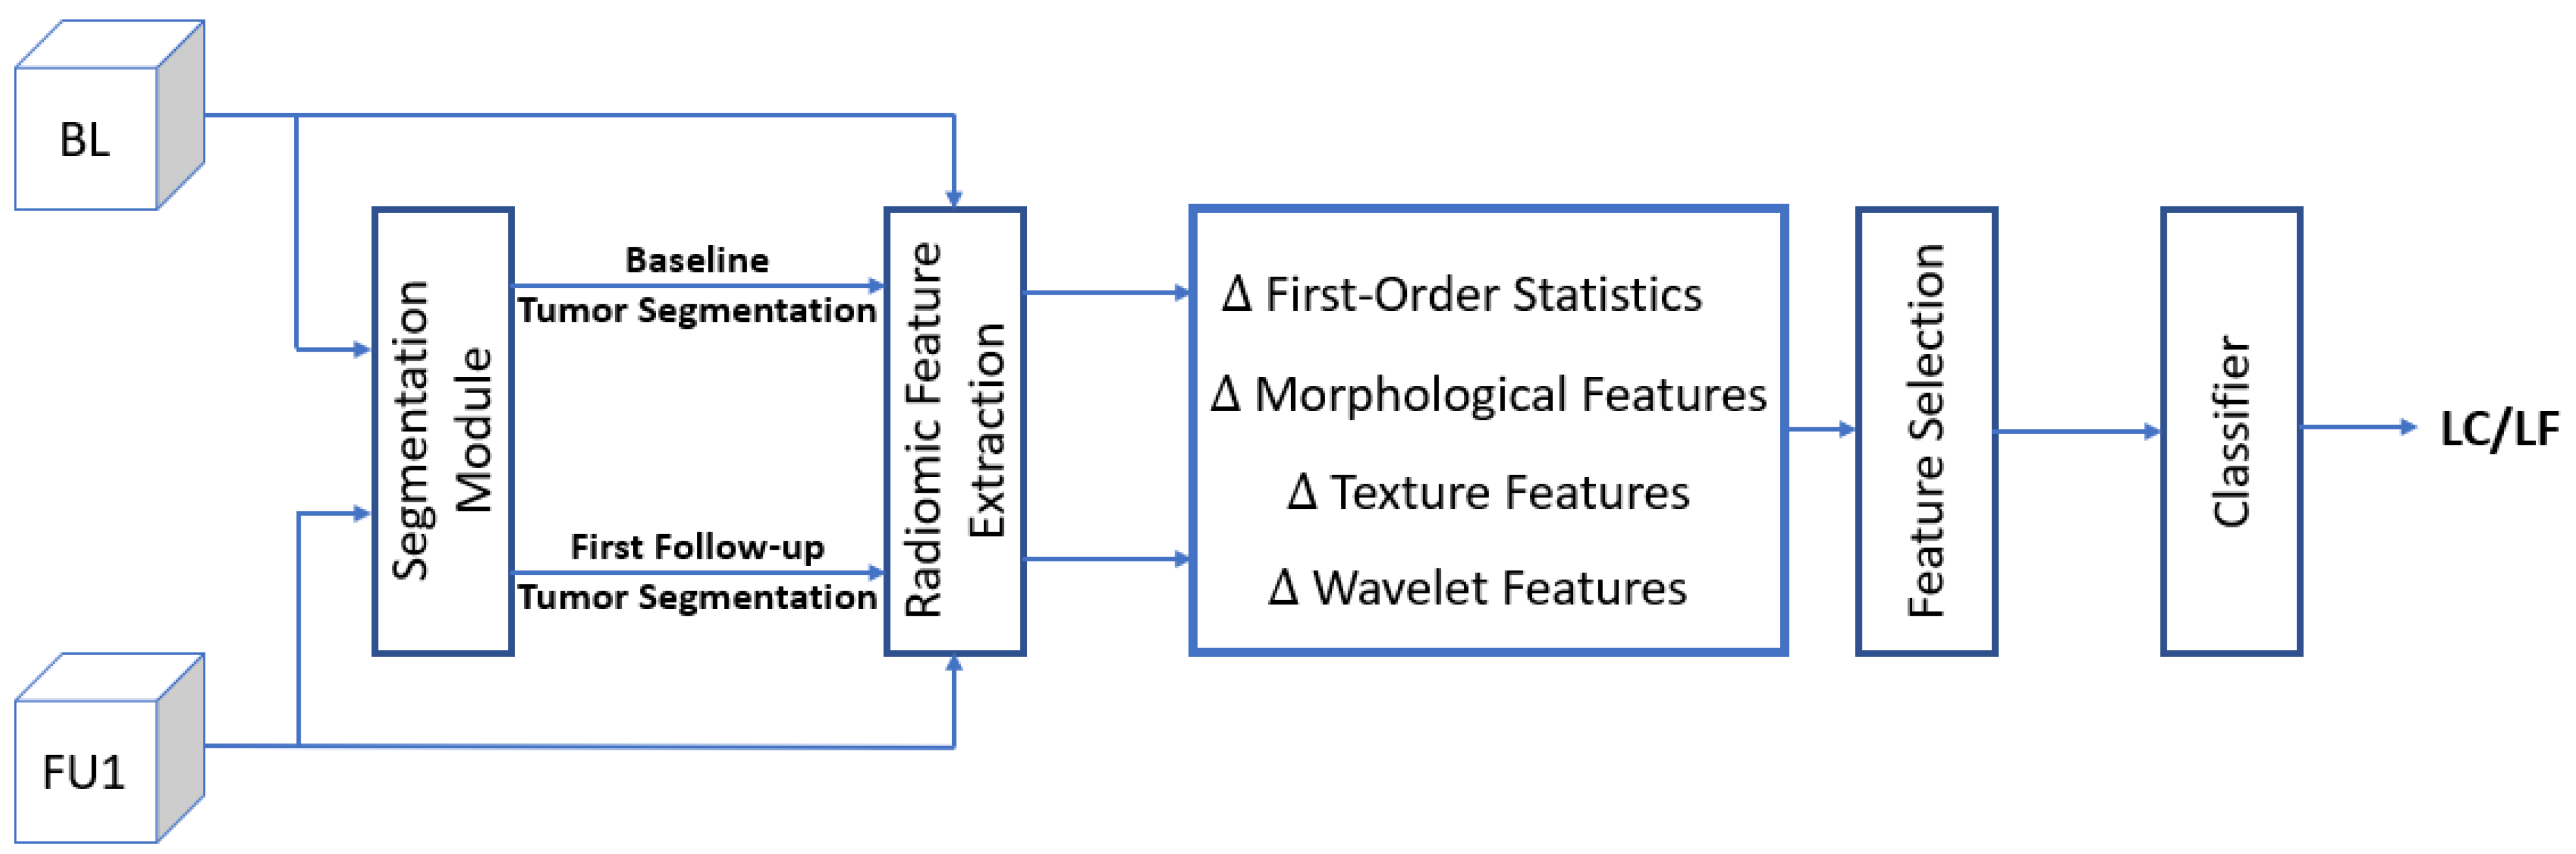
2.2. System Overview
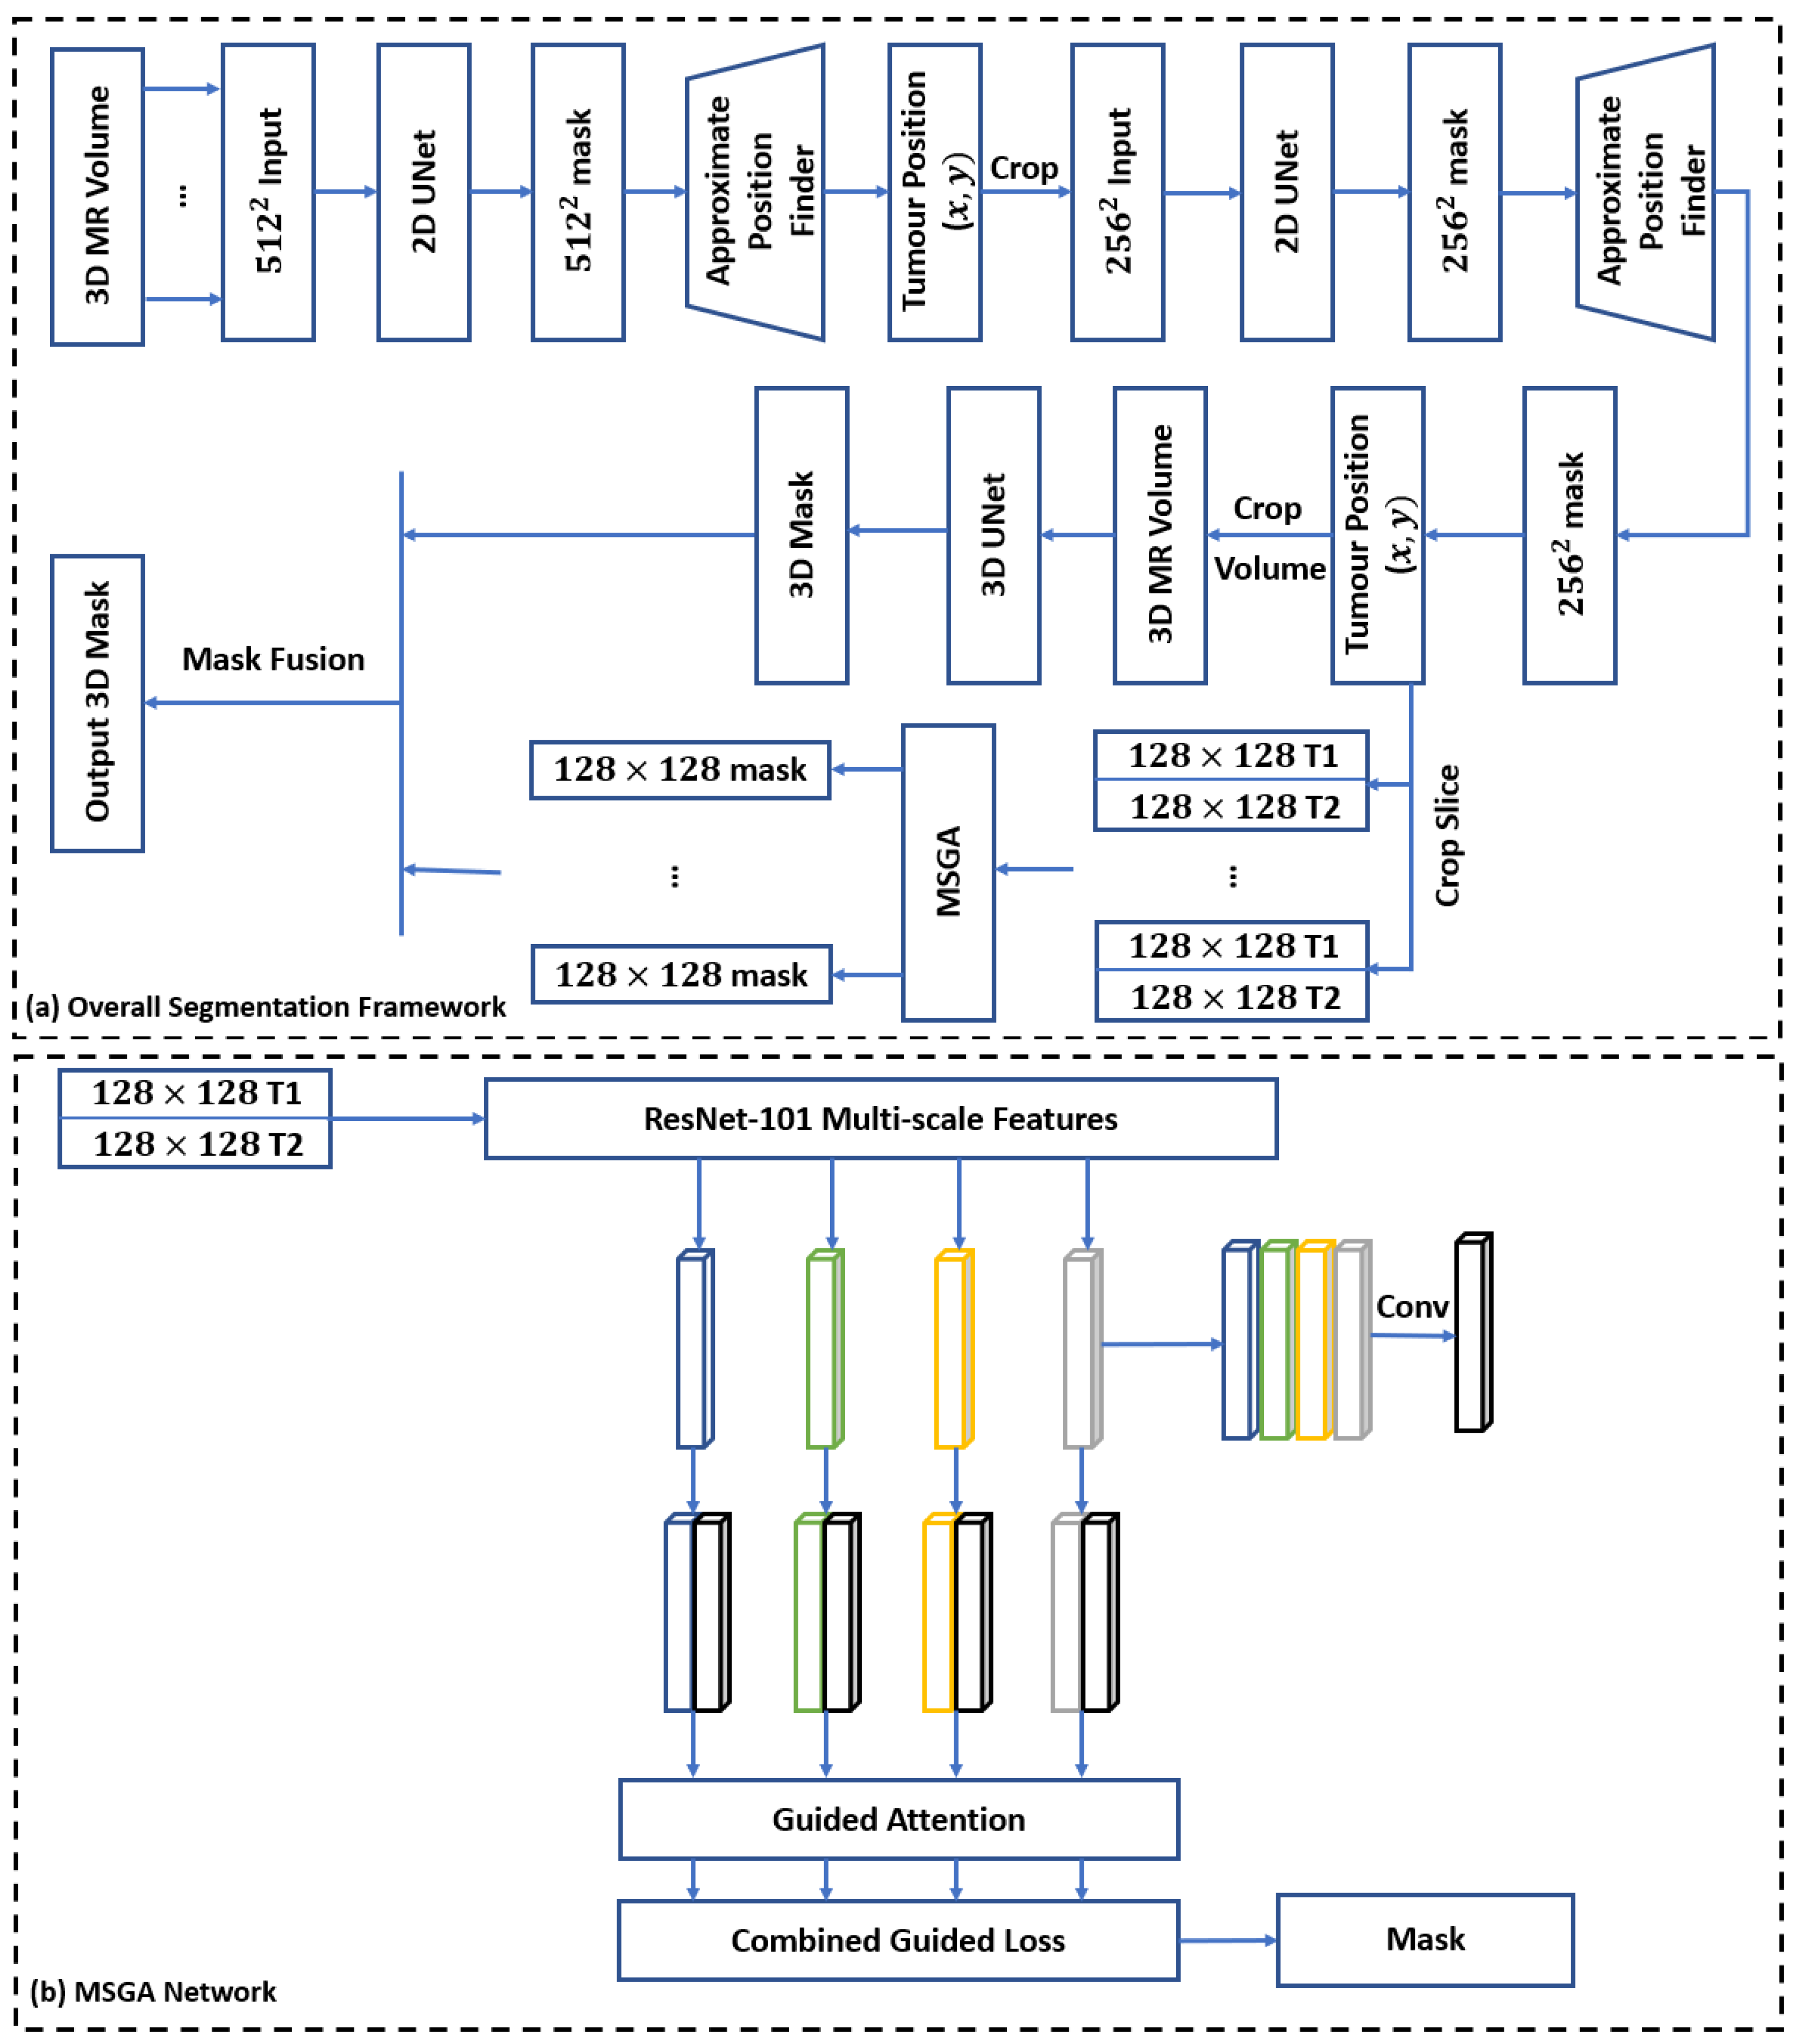
2.3. Segmentation Module
2.4. Radiomic Feature Extraction
2.5. Feature Selection
2.6. Classifier
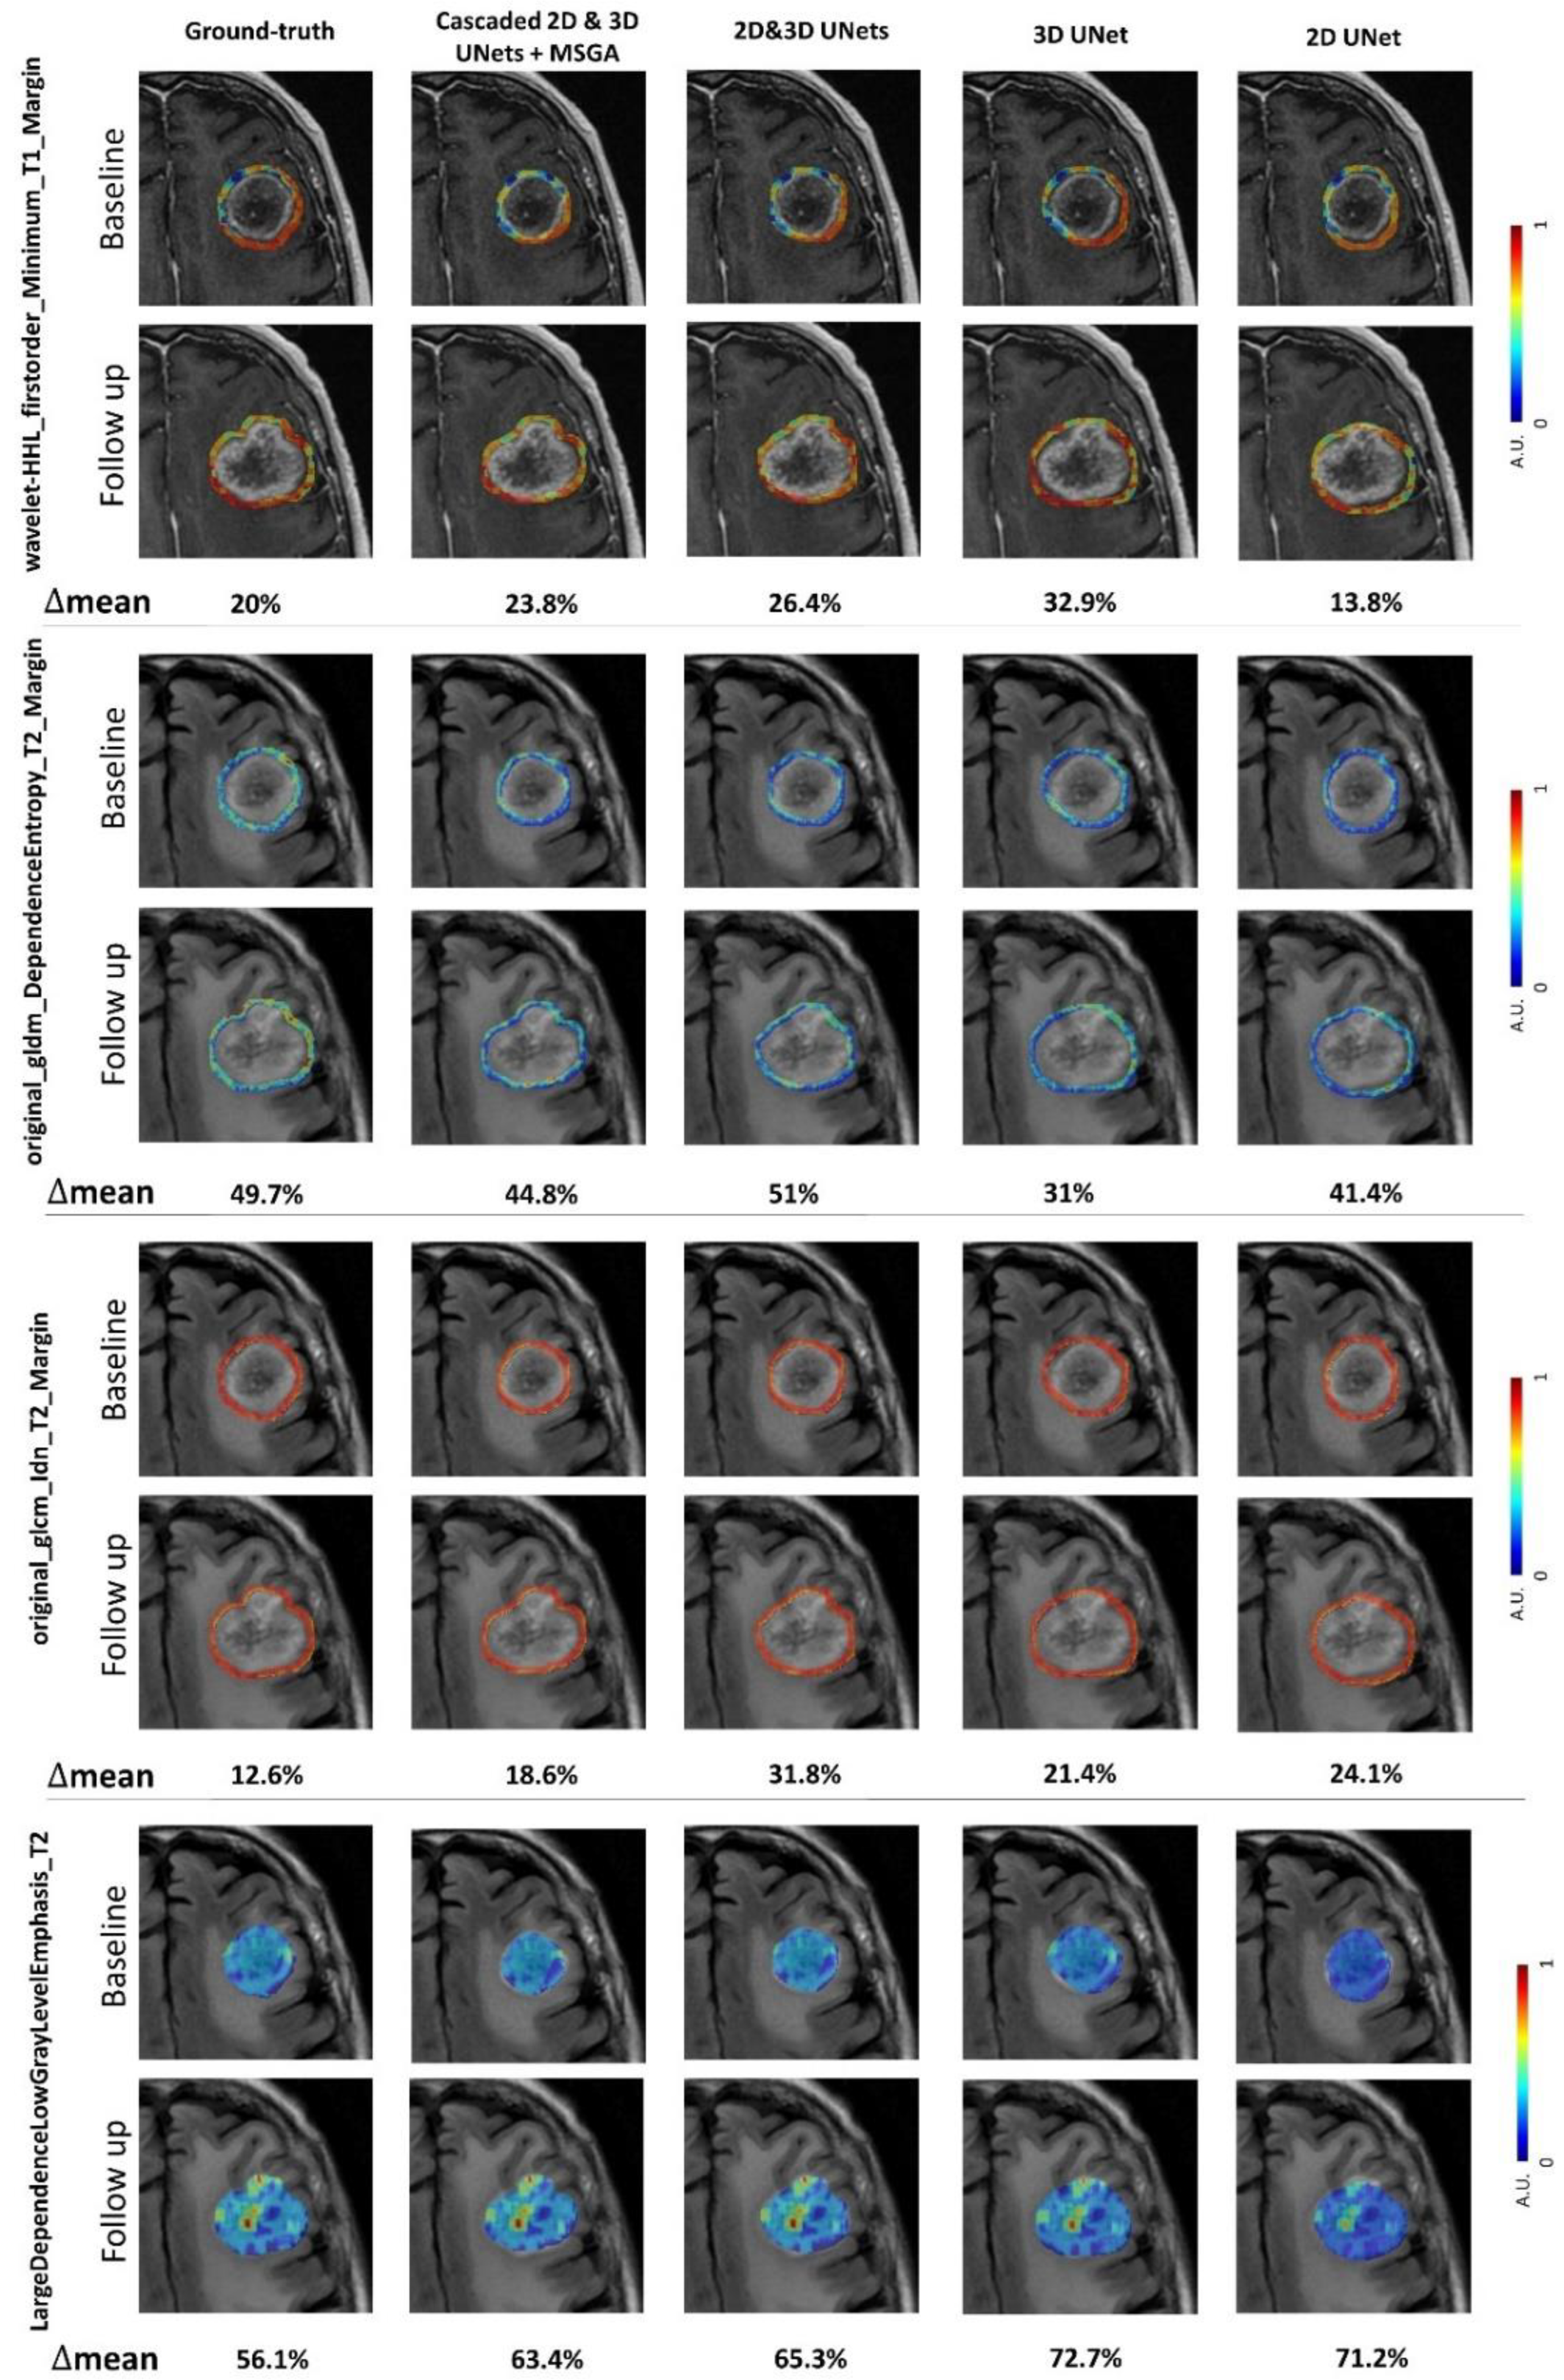
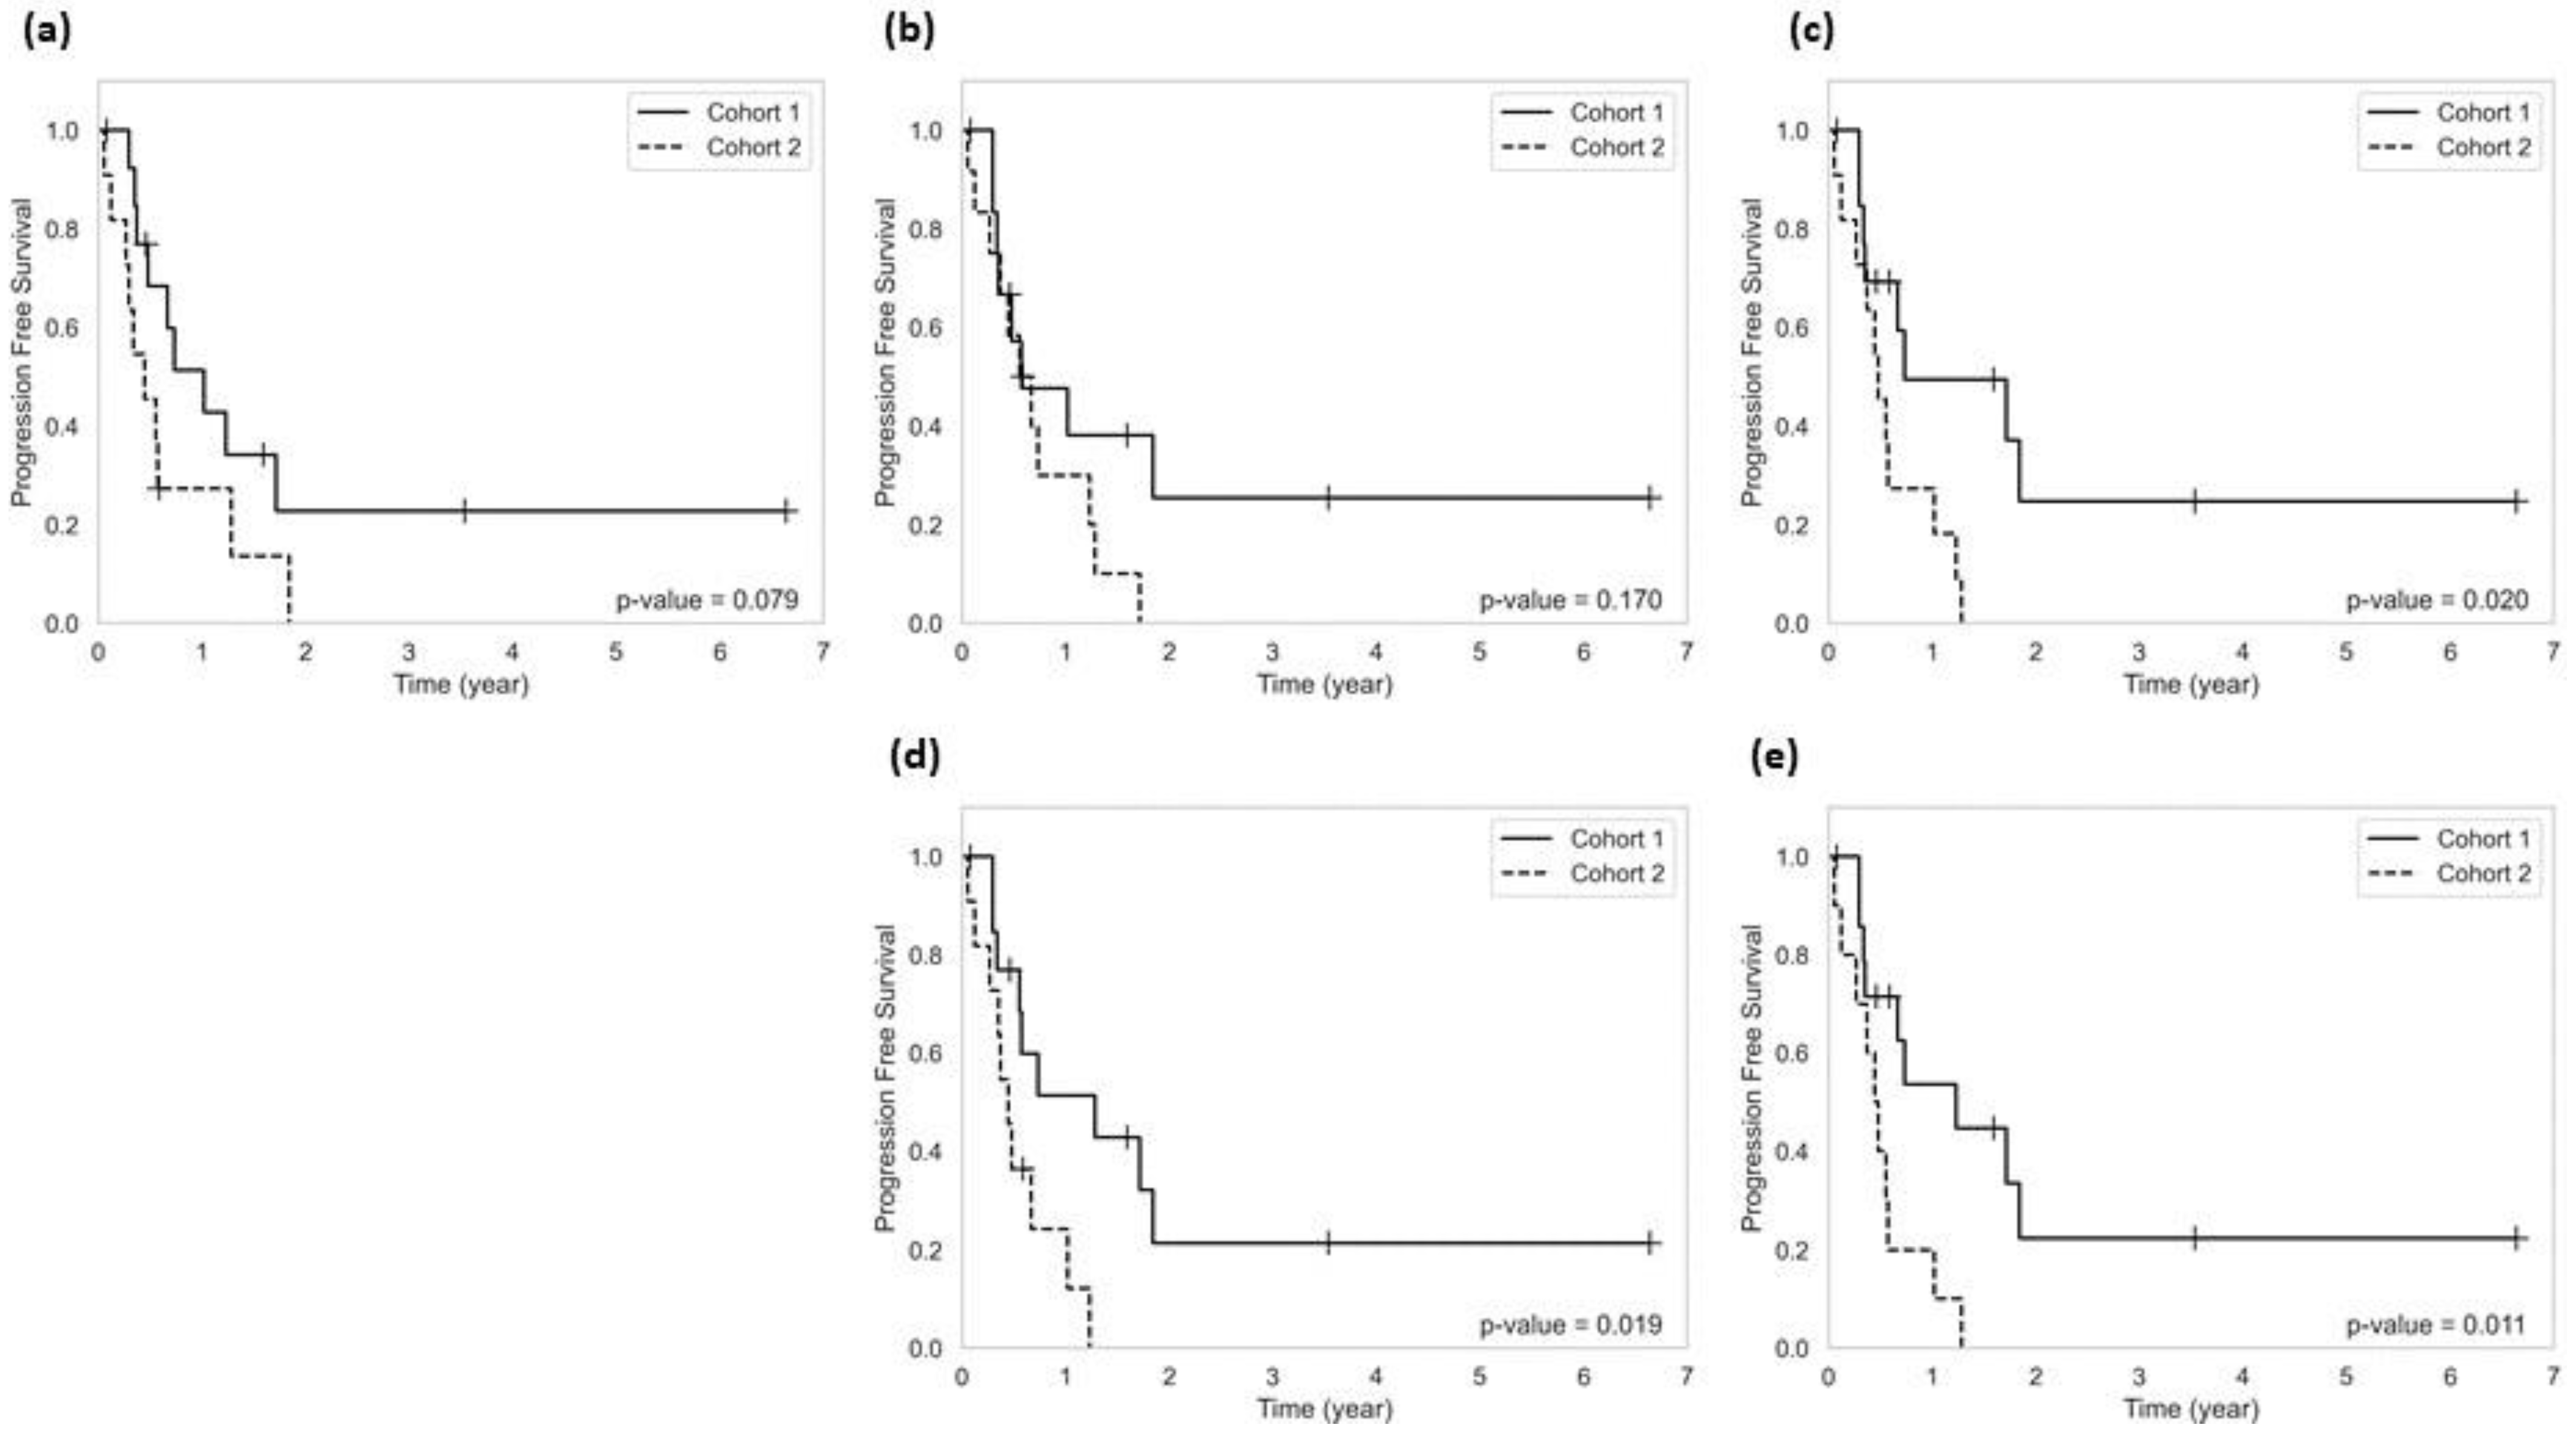
3. Results
4. Discussion
5. Conclusions
Author Contributions
Funding
Institutional Review Board Statement
Informed Consent Statement
Data Availability Statement
Conflicts of Interest
References
- Lamba, N.; Wen, P.Y.; Aizer, A.A. Epidemiology of brain metastases and leptomeningeal disease. Neuro. Oncol. 2021, 23, 1447–1456. [Google Scholar] [CrossRef] [PubMed]
- Ostrom, Q.T.; Wright, C.H.; Barnholtz-Sloan, J.S. Brain metastases: Epidemiology. Handb. Clin. Neurol. 2018, 149, 27–42. [Google Scholar] [PubMed]
- Lamba, N.; Mehanna, E.; Kearney, R.B.; Catalano, P.J.; Haas-Kogan, D.A.; Alexander, B.M.; Cagney, D.N.; Lee, K.A.; Aizer, A.A. Racial disparities in supportive medication use among older patients with brain metastases: A population-based analysis. Neuro Oncol. 2020, 22, 1339–1347. [Google Scholar] [CrossRef]
- Muldoon, L.L.; Soussain, C.; Jahnke, K.; Johanson, C.; Siegal, T.; Smith, Q.R.; Hall, W.A.; Hynynen, K.; Senter, P.D.; Peereboom, D.M.; et al. Chemotherapy Delivery Issues in Central Nervous System Malignancy: A Reality Check. J. Clin. Oncol. 2007, 25, 2295–2305. [Google Scholar] [CrossRef] [PubMed] [Green Version]
- Venur, V.A.; Karivedu, V.; Ahluwalia, M.S. Systemic therapy for brain metastases. Handb. Clin. Neurol. 2018, 149, 137–153. [Google Scholar] [PubMed]
- Amin, S.; Baine, M.J.; Meza, J.L.; Lin, C. Association of Immunotherapy With Survival Among Patients With Brain Metastases Whose Cancer Was Managed With Definitive Surgery of the Primary Tumor. JAMA Netw. Open 2020, 3, e2015444. [Google Scholar] [CrossRef]
- Berghoff, A.S.; Venur, V.A.; Preusser, M.; Ahluwalia, M.S. Immune Checkpoint Inhibitors in Brain Metastases: From Biology to Treatment. Am. Soc. Clin. Oncol. Educ. B. 2016, 36, e116–e122. [Google Scholar] [CrossRef] [PubMed]
- Xiao, G.; Liu, Z.; Gao, X.; Wang, H.; Peng, H.; Li, J.; Yang, L.; Duan, H.; Zhou, R. Immune checkpoint inhibitors for brain metastases in non-small-cell lung cancer: From rationale to clinical application. Immunotherapy 2021, 13, 1031–1051. [Google Scholar] [CrossRef]
- Lin, N.U.; Lee, E.Q.; Aoyama, H.; Barani, I.J.; Barboriak, D.P.; Baumert, B.G.; Bendszus, M.; Brown, P.D.; Camidge, D.R.; Chang, S.M.; et al. Response assessment criteria for brain metastases: Proposal from the RANO group. Lancet Oncol. 2015, 16, e270–e278. [Google Scholar] [CrossRef]
- Okada, H.; Weller, M.; Huang, R.; Finocchiaro, G.; Gilbert, M.R.; Wick, W.; Ellingson, B.M.; Hashimoto, N.; Pollack, I.F.; Brandes, A.A.; et al. Immunotherapy response assessment in neuro-oncology: A report of the RANO working group. Lancet Oncol. 2015, 16, e534–e542. [Google Scholar] [CrossRef]
- Sneed, P.K.; Mendez, J.; Vemer-van den Hoek, J.G.; Seymour, Z.A.; Ma, L.; Molinaro, A.M.; Fogh, S.E.; Nakamura, J.L.; McDermott, M.W. Adverse radiation effect after stereotactic radiosurgery for brain metastases: Incidence, time course, and risk factors. J. Neurosurg. 2015, 123, 373–386. [Google Scholar] [CrossRef] [PubMed] [Green Version]
- Sperduto, P.W.; Kased, N.; Roberge, D.; Xu, Z.; Shanley, R.; Luo, X.; Sneed, P.K.; Chao, S.T.; Weil, R.J.; Suh, J.; et al. Summary Report on the Graded Prognostic Assessment: An Accurate and Facile Diagnosis-Specific Tool to Estimate Survival for Patients With Brain Metastases. J. Clin. Oncol. 2012, 30, 419–425. [Google Scholar] [CrossRef] [PubMed] [Green Version]
- Saito, E.Y.; Viani, G.A.; Ferrigno, R.; Nakamura, R.A.; Novaes, P.E.; Pellizzon, C.A.; Fogaroli, R.C.; Conte, M.A.; Salvajoli, J.V. Whole brain radiation therapy in management of brain metastasis: Results and prognostic factors. Radiat. Oncol. 2006, 1, 20. [Google Scholar] [CrossRef] [PubMed] [Green Version]
- Nieder, C.; Mehta, M.P. Prognostic indices for brain metastases—Usefulness and challenges. Radiat. Oncol. 2009, 4, 10. [Google Scholar] [CrossRef] [PubMed] [Green Version]
- Nieder, C.; Spanne, O.; Mehta, M.P.; Grosu, A.L.; Geinitz, H. Presentation, patterns of care, and survival in patients with brain metastases. Cancer 2011, 117, 2505–2512. [Google Scholar] [CrossRef] [PubMed]
- Soliman, H.; Das, S.; Larson, D.A.; Sahgal, A. Stereotactic radiosurgery (SRS) in the modern management of patients with brain metastases. Oncotarget 2016, 7, 12318–12330. [Google Scholar] [CrossRef] [Green Version]
- Gillies, R.J.; Kinahan, P.E.; Hricak, H. Radiomics: Images Are More than Pictures, They Are Data. Radiology 2016, 278, 563–577. [Google Scholar] [CrossRef] [Green Version]
- Rizzo, S.; Botta, F.; Raimondi, S.; Origgi, D.; Fanciullo, C.; Morganti, A.G.; Bellomi, M. Radiomics: The facts and the challenges of image analysis. Eur. Radiol. Exp. 2018, 2, 36. [Google Scholar] [CrossRef]
- Aerts, H.J.; Velazquez, E.R.; Leijenaar, R.T.; Parmar, C.; Grossmann, P.; Carvalho, S.; Bussink, J.; Monshouwer, R.; Haibe-Kains, B.; Rietveld, D.; et al. Decoding tumour phenotype by noninvasive imaging using a quantitative radiomics approach. Nat. Commun. 2014, 5, 4006. [Google Scholar] [CrossRef] [Green Version]
- Bodalal, Z.; Trebeschi, S.; Nguyen-Kim, T.D.L.; Schats, W.; Beets-Tan, R. Radiogenomics: Bridging imaging and genomics. Abdom. Radiol. 2019, 44, 1960–1984. [Google Scholar] [CrossRef]
- Diehn, M.; Nardini, C.; Wang, D.S.; McGovern, S.; Jayaraman, M.; Liang, Y.; Aldape, K.; Cha, S.; Kuo, M.D. Identification of noninvasive imaging surrogates for brain tumor gene-expression modules. Proc. Natl. Acad. Sci. USA 2008, 105, 5213–5218. [Google Scholar] [CrossRef] [PubMed] [Green Version]
- Zinn, P.O.; Majadan, B.; Sathyan, P.; Singh, S.K.; Majumder, S.; Jolesz, F.A.; Colen, R.R. Radiogenomic Mapping of Edema/Cellular Invasion MRI-Phenotypes in Glioblastoma Multiforme. PLoS ONE 2011, 6, e25451. [Google Scholar] [CrossRef] [PubMed]
- Karami, E.; Soliman, H.; Ruschin, M.; Sahgal, A.; Myrehaug, S.; Tseng, C.L.; Czarnota, G.J.; Jabehdar-Maralani, P.; Chugh, B.; Lau, A.; et al. Quantitative MRI Biomarkers of Stereotactic Radiotherapy Outcome in Brain Metastasis. Sci. Rep. 2019, 9, 19830. [Google Scholar] [CrossRef] [PubMed] [Green Version]
- Mouraviev, A.; Detsky, J.; Sahgal, A.; Ruschin, M.; Lee, Y.K.; Karam, I.; Heyn, C.; Stanisz, G.J.; Martel, A.L. Use of radiomics for the prediction of local control of brain metastases after stereotactic radiosurgery. Neuro Oncol. 2022, 22, 797–805. [Google Scholar] [CrossRef]
- Truong, M.T.; St Clair, E.G.; Donahue, B.R.; Rush, S.C.; Miller, D.C.; Formenti, S.C.; Knopp, E.A.; Han, K.; Golfinos, J.G. Results of surgical resection for progression of brain metastases previously treated by gamma knife radiosurgery. Neurosurgery 2006, 59, 86–97. [Google Scholar] [CrossRef]
- Ronneberger, O.; Fischer, P.; Brox, T. U-Net: Convolutional Networks for Biomedical Image Segmentation. arXiv 2015, arXiv:1505.04597. [Google Scholar]
- Çiçek, Ö.; Abdulkadir, A.; Lienkamp, S.S.; Brox, T.; Ronneberger, O. 3D U-Net: Learning Dense Volumetric Segmentation from Sparse Annotation. arXiv 2016, arXiv:1606.06650. [Google Scholar]
- Sinha, A.; Dolz, J. Multi-scale guided attention for medical image segmentation. arXiv 2019, arXiv:1906.02849. [Google Scholar] [CrossRef] [Green Version]
- Van Griethuysen, J.J.; Fedorov, A.; Parmar, C.; Hosny, A.; Aucoin, N.; Narayan, V.; Beets-Tan, R.G.; Fillion-Robin, J.C.; Pieper, S.; Aerts, H.J. Computational Radiomics System to Decode the Radiographic Phenotype. Cancer Res. 2017, 77, e104–e107. [Google Scholar] [CrossRef] [Green Version]
- Chandrashekar, G.; Sahin, F. A survey on feature selection methods. Comput. Electr. Eng. 2014, 40, 16–28. [Google Scholar] [CrossRef]
- Ding, C.; Peng, H. Minimum Redundancy Feature Selection from Microarray Gene Expression Data. J. Bioinform. Comput. Biol. 2005, 03, 185–205. [Google Scholar] [CrossRef] [PubMed]
- Liao, C.Y.; Lee, C.C.; Yang, H.C.; Chen, C.J.; Chung, W.Y.; Wu, H.M.; Guo, W.Y.; Liu, R.S.; Lu, C.F. Enhancement of Radiosurgical Treatment Outcome Prediction Using MRI Radiomics in Patients with Non-Small Cell Lung Cancer Brain Metastases. Cancers 2021, 13, 4030. [Google Scholar] [CrossRef] [PubMed]
- Jin, J.; Zhu, H.; Teng, Y.; Ai, Y.; Xie, C.; Jin, X. The Accuracy and Radiomics Feature Effects of Multiple U-net-Based Automatic Segmentation Models for Transvaginal Ultrasound Images of Cervical Cancer. J. Digit. Imaging 2022, 35, 983–992. [Google Scholar] [CrossRef] [PubMed]
- Teng, Y.; Ai, Y.; Liang, T.; Yu, B.; Jin, J.; Xie, C.; Jin, X. The Effects of Automatic Segmentations on Preoperative Lymph Node Status Prediction Models With Ultrasound Radiomics for Patients With Early Stage Cervical Cancer. Technol. Cancer Res. Treat. 2022, 21, 153303382210993. [Google Scholar] [CrossRef] [PubMed]


| Segmentation Model | Baseline | First Follow-Up | |||
|---|---|---|---|---|---|
| Training Set | Test Set | Training Set Patients | Test Set Patients | ||
| Cascaded 2D UNets | DSC | 0.85 ± 0.05 | 0.85 ± 0.06 | 0.82 ± 0.05 | 0.81 ± 0.07 |
| HD | 3 ± 0.6 mm | 3.4 ± 0.7 mm | 3.46 ± 0.6 mm | 3.7 ± 0.5 mm | |
| VEE | 0.63 ± 0.44 cc 17.2% ± 6.1% | 0.71 ± 0.47 cc 19.4% ± 8.3% | 0.75 ± 0.5 cc 20.6% ± 8.5% | 0.77 ± 0.51 cc 21.5% ± 9% | |
| 3D UNet | DSC | 0.87 ± 0.06 | 0.85 ± 0.06 | 0.85 ± 0.05 | 0.82 ± 0.06 |
| HD | 2.9 ± 0.8 mm | 3.1 ± 0.82 mm | 3.2 ± 0.85 mm | 3.5 ± 0.6 mm | |
| VEE | 0.6 ± 0.42 cc 15.8% ± 5.4% | 0.7 ± 0.45 cc 17% ± 7% | 0.72 ± 0.47 cc 18% ± 7.3% | 0.75 ± 0.53 cc 18.9% ± 9.5% | |
| Cascaded 2D and 3D UNets | DSC | 0.89 ± 0.05 | 0.88 ± 0.05 | 0.86 ± 0.05 | 0.83 ± 0.05 |
| HD | 2.45 ± 0.6 mm | 2.65 ± 0.63 mm | 2.8 ± 0.6 mm | 3.1 ± 0.5 mm | |
| VEE | 0.55 ± 0.35 cc 13.1% ± 4.2% | 0.61 ± 0.4 cc 15.8% ± 6.5% | 0.64 ± 0.43 cc 16.6% ± 6.8% | 0.68 ± 0.5 cc 17.9% ± 7.7% | |
| Cascaded 2D and 3D UNets + MSGA | DSC | 0.91 ± 0.03 | 0.90 ± 0.04 | 0.89 ± 0.04 | 0.87 ± 0.05 |
| HD | 2.1 ± 0.45 mm | 2.3 ± 0.55 mm | 2.21 ± 0.5 mm | 2.74 ± 0.49 mm | |
| VEE | 0.42 ± 0.3 cc 11.2% ± 3.9% | 0.53 ± 0.36 cc 12.8% ± 5.1% | 0.57 ± 0.38 cc 14.7% ± 4.7% | 0.61 ± 0.48 cc 15.9% ± 5.1% | |
| Segmentation Model | Selected Features |
|---|---|
| Cascaded 2D UNets | wavelet-LLH_glcm_Correlation_T2_Margin |
| wavelet-LHH_glrlm_RunVariance_T2 | |
| original_gldm_DependenceVariance_T2_Margin | |
| wavelet-HLH_glcm_Imc2_T2_Margin | |
| wavelet-LHH_glcm_Idm_T2_Margin | |
| wavelet-LHL_gldm_SmallDependenceHighGrayLevelEmphasis_T1 | |
| wavelet-HHH_glszm_ZonePercentage_T1_Margin | |
| 3D UNet | wavelet-HLH_gldm_LargeDependenceLowGrayLevelEmphasis_T2 |
| original_gldm_DependenceEntropy_T2_Margin | |
| wavelet-LHL_gldm_SmallDependenceHighGrayLevelEmphasis_T1 | |
| wavelet-HLH_gldm_SmallDependenceLowGrayLevelEmphasis_T2 | |
| wavelet-HHL_ngtdm_Contrast_T2 | |
| wavelet-HLH_glcm_Imc2_T2_Margin | |
| original_gldm_DependenceVariance_T2_Margin | |
| Cascaded 2D and 3D UNets | wavelet-HHL_firstorder_Minimum_T1_Margin |
| original_gldm_DependenceEntropy_T2_Margin | |
| original_glcm_Idn_T2_Margin | |
| wavelet-HLH_gldm_LargeDependenceLowGrayLevelEmphasis_T2 | |
| wavelet-LHL_glcm_Contrast_T1 | |
| wavelet-HHH_gldm_DependenceVariance_T1_Margin | |
| wavelet-LHL_gldm_SmallDependenceHighGrayLevelEmphasis_T1 | |
| Cascaded 2D and 3D UNets + MSGA | wavelet-HHL_firstorder_Minimum_T1_Margin |
| original_gldm_DependenceEntropy_T2_Margin | |
| original_glcm_Idn_T2_Margin | |
| wavelet-HLH_gldm_LargeDependenceLowGrayLevelEmphasis_T2 | |
| wavelet-LLL_ngtdm_Strength_T1_Margin | |
| wavelet-HLL_glcm_Idn_T1_Margin | |
| wavelet-HHL_firstorder_Skewness_T1 | |
| Ground-Truth | wavelet-HHL_firstorder_Minimum_T1_Margin |
| original_gldm_DependenceEntropy_T2_Margin | |
| original_glcm_Idn_T2_Margin | |
| wavelet-HLH_gldm_LargeDependenceLowGrayLevelEmphasis_T2 | |
| wavelet-LLL_ngtdm_Strength_T1_Margin | |
| wavelet-HLL_glcm_Idn_T1_Margin | |
| wavelet-LHH_glszm_SizeZoneNonUniformityNormalized_T1_Margin |
| Segmentation Model | Independent Test Set | ||||
|---|---|---|---|---|---|
| Accuracy | Sensitivity | Specificity | AUC | F1-Score | |
| Cascaded 2D UNets | 72.5% | 70.6% | 74% | 0.62 | 68.5% |
| 3D UNet | 72.5% | 70.6% | 74.% | 0.67 | 68.5% |
| Cascaded 2D and 3D UNets | 77.5% | 76.5% | 78.2% | 0.72 | 74.3% |
| Cascaded 2D and 3D UNets + MSGA | 80% | 76.5% | 82.6% | 0.78 | 76.5% |
| Ground-Truth | 80% | 82.5% | 78.2% | 0.81 | 77.8% |
Publisher’s Note: MDPI stays neutral with regard to jurisdictional claims in published maps and institutional affiliations. |
© 2022 by the authors. Licensee MDPI, Basel, Switzerland. This article is an open access article distributed under the terms and conditions of the Creative Commons Attribution (CC BY) license (https://creativecommons.org/licenses/by/4.0/).
Share and Cite
Jalalifar, S.A.; Soliman, H.; Sahgal, A.; Sadeghi-Naini, A. Impact of Tumour Segmentation Accuracy on Efficacy of Quantitative MRI Biomarkers of Radiotherapy Outcome in Brain Metastasis. Cancers 2022, 14, 5133. https://doi.org/10.3390/cancers14205133
Jalalifar SA, Soliman H, Sahgal A, Sadeghi-Naini A. Impact of Tumour Segmentation Accuracy on Efficacy of Quantitative MRI Biomarkers of Radiotherapy Outcome in Brain Metastasis. Cancers. 2022; 14(20):5133. https://doi.org/10.3390/cancers14205133
Chicago/Turabian StyleJalalifar, Seyed Ali, Hany Soliman, Arjun Sahgal, and Ali Sadeghi-Naini. 2022. "Impact of Tumour Segmentation Accuracy on Efficacy of Quantitative MRI Biomarkers of Radiotherapy Outcome in Brain Metastasis" Cancers 14, no. 20: 5133. https://doi.org/10.3390/cancers14205133