

Measurement Accuracy and Repeatability of RECIST-Defined Pulmonary Lesions and Lymph Nodes in Ultra-Low-Dose CT Based on Deep Learning Image Reconstruction

Abstract
:Simple Summary
Abstract
1. Introduction
2. Materials and Methods
2.1. Patients
2.2. CT Acquisition
2.3. Image Reconstruction and Deep Learning Image Reconstruction
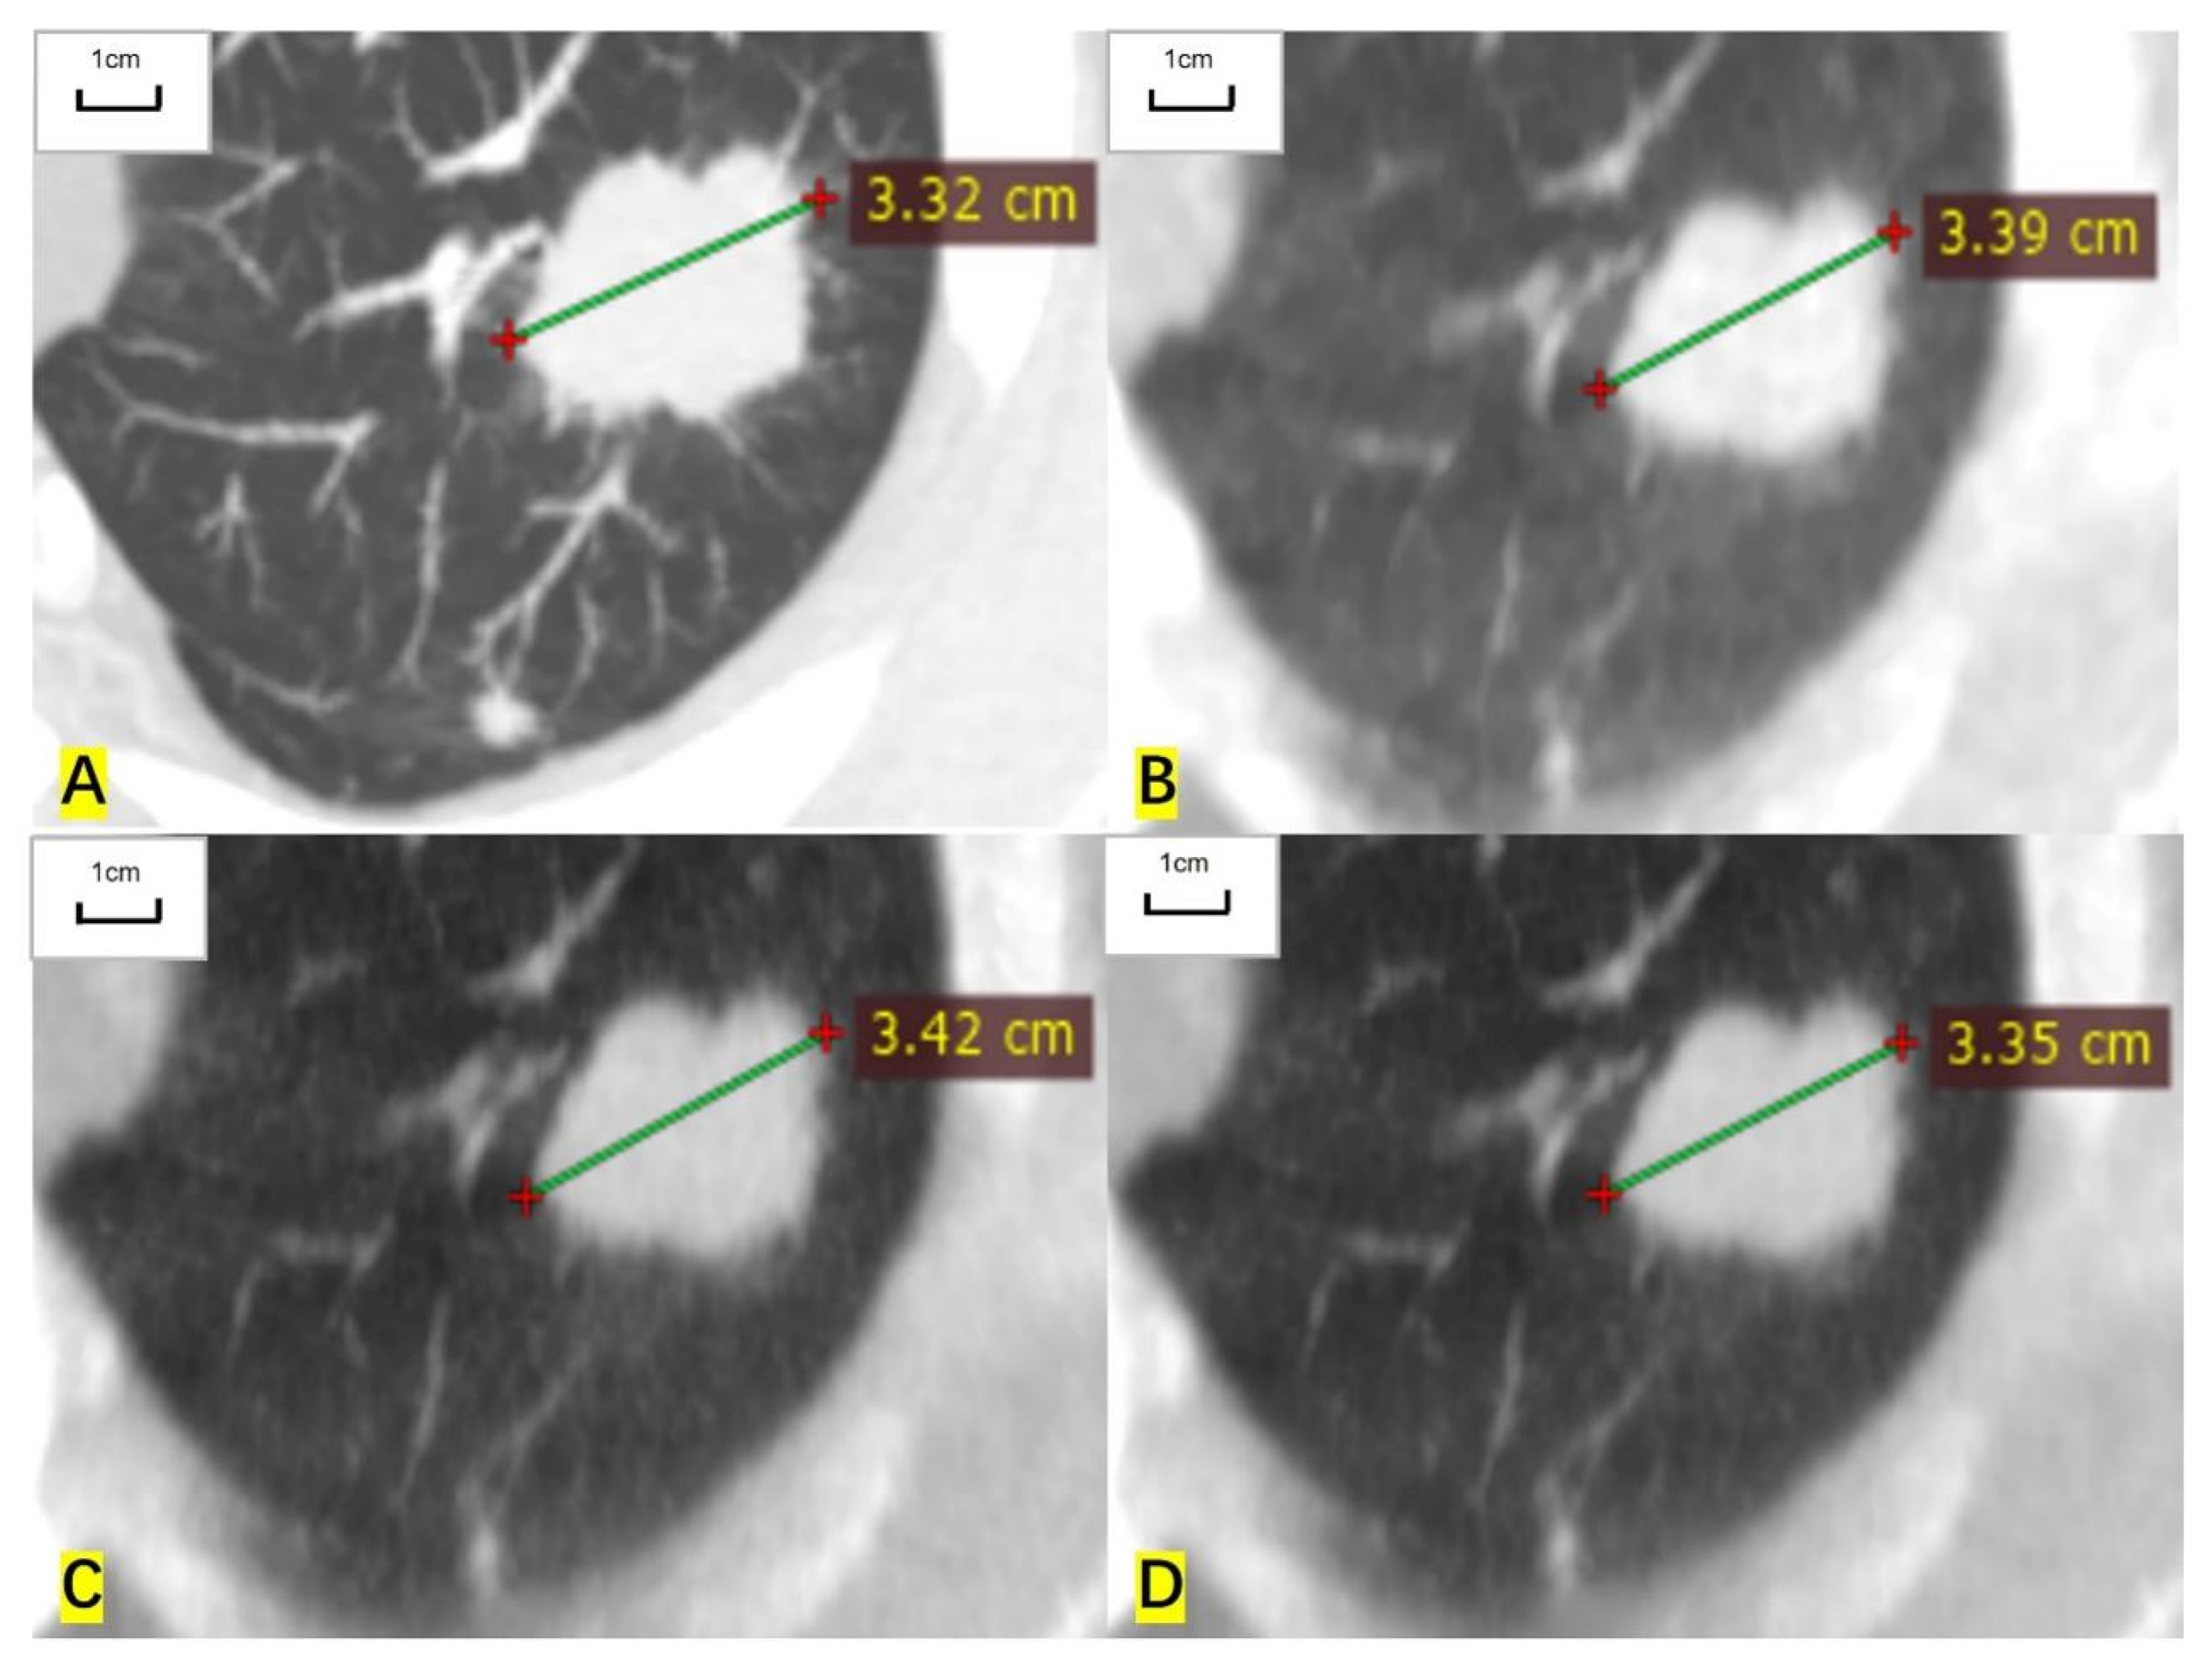
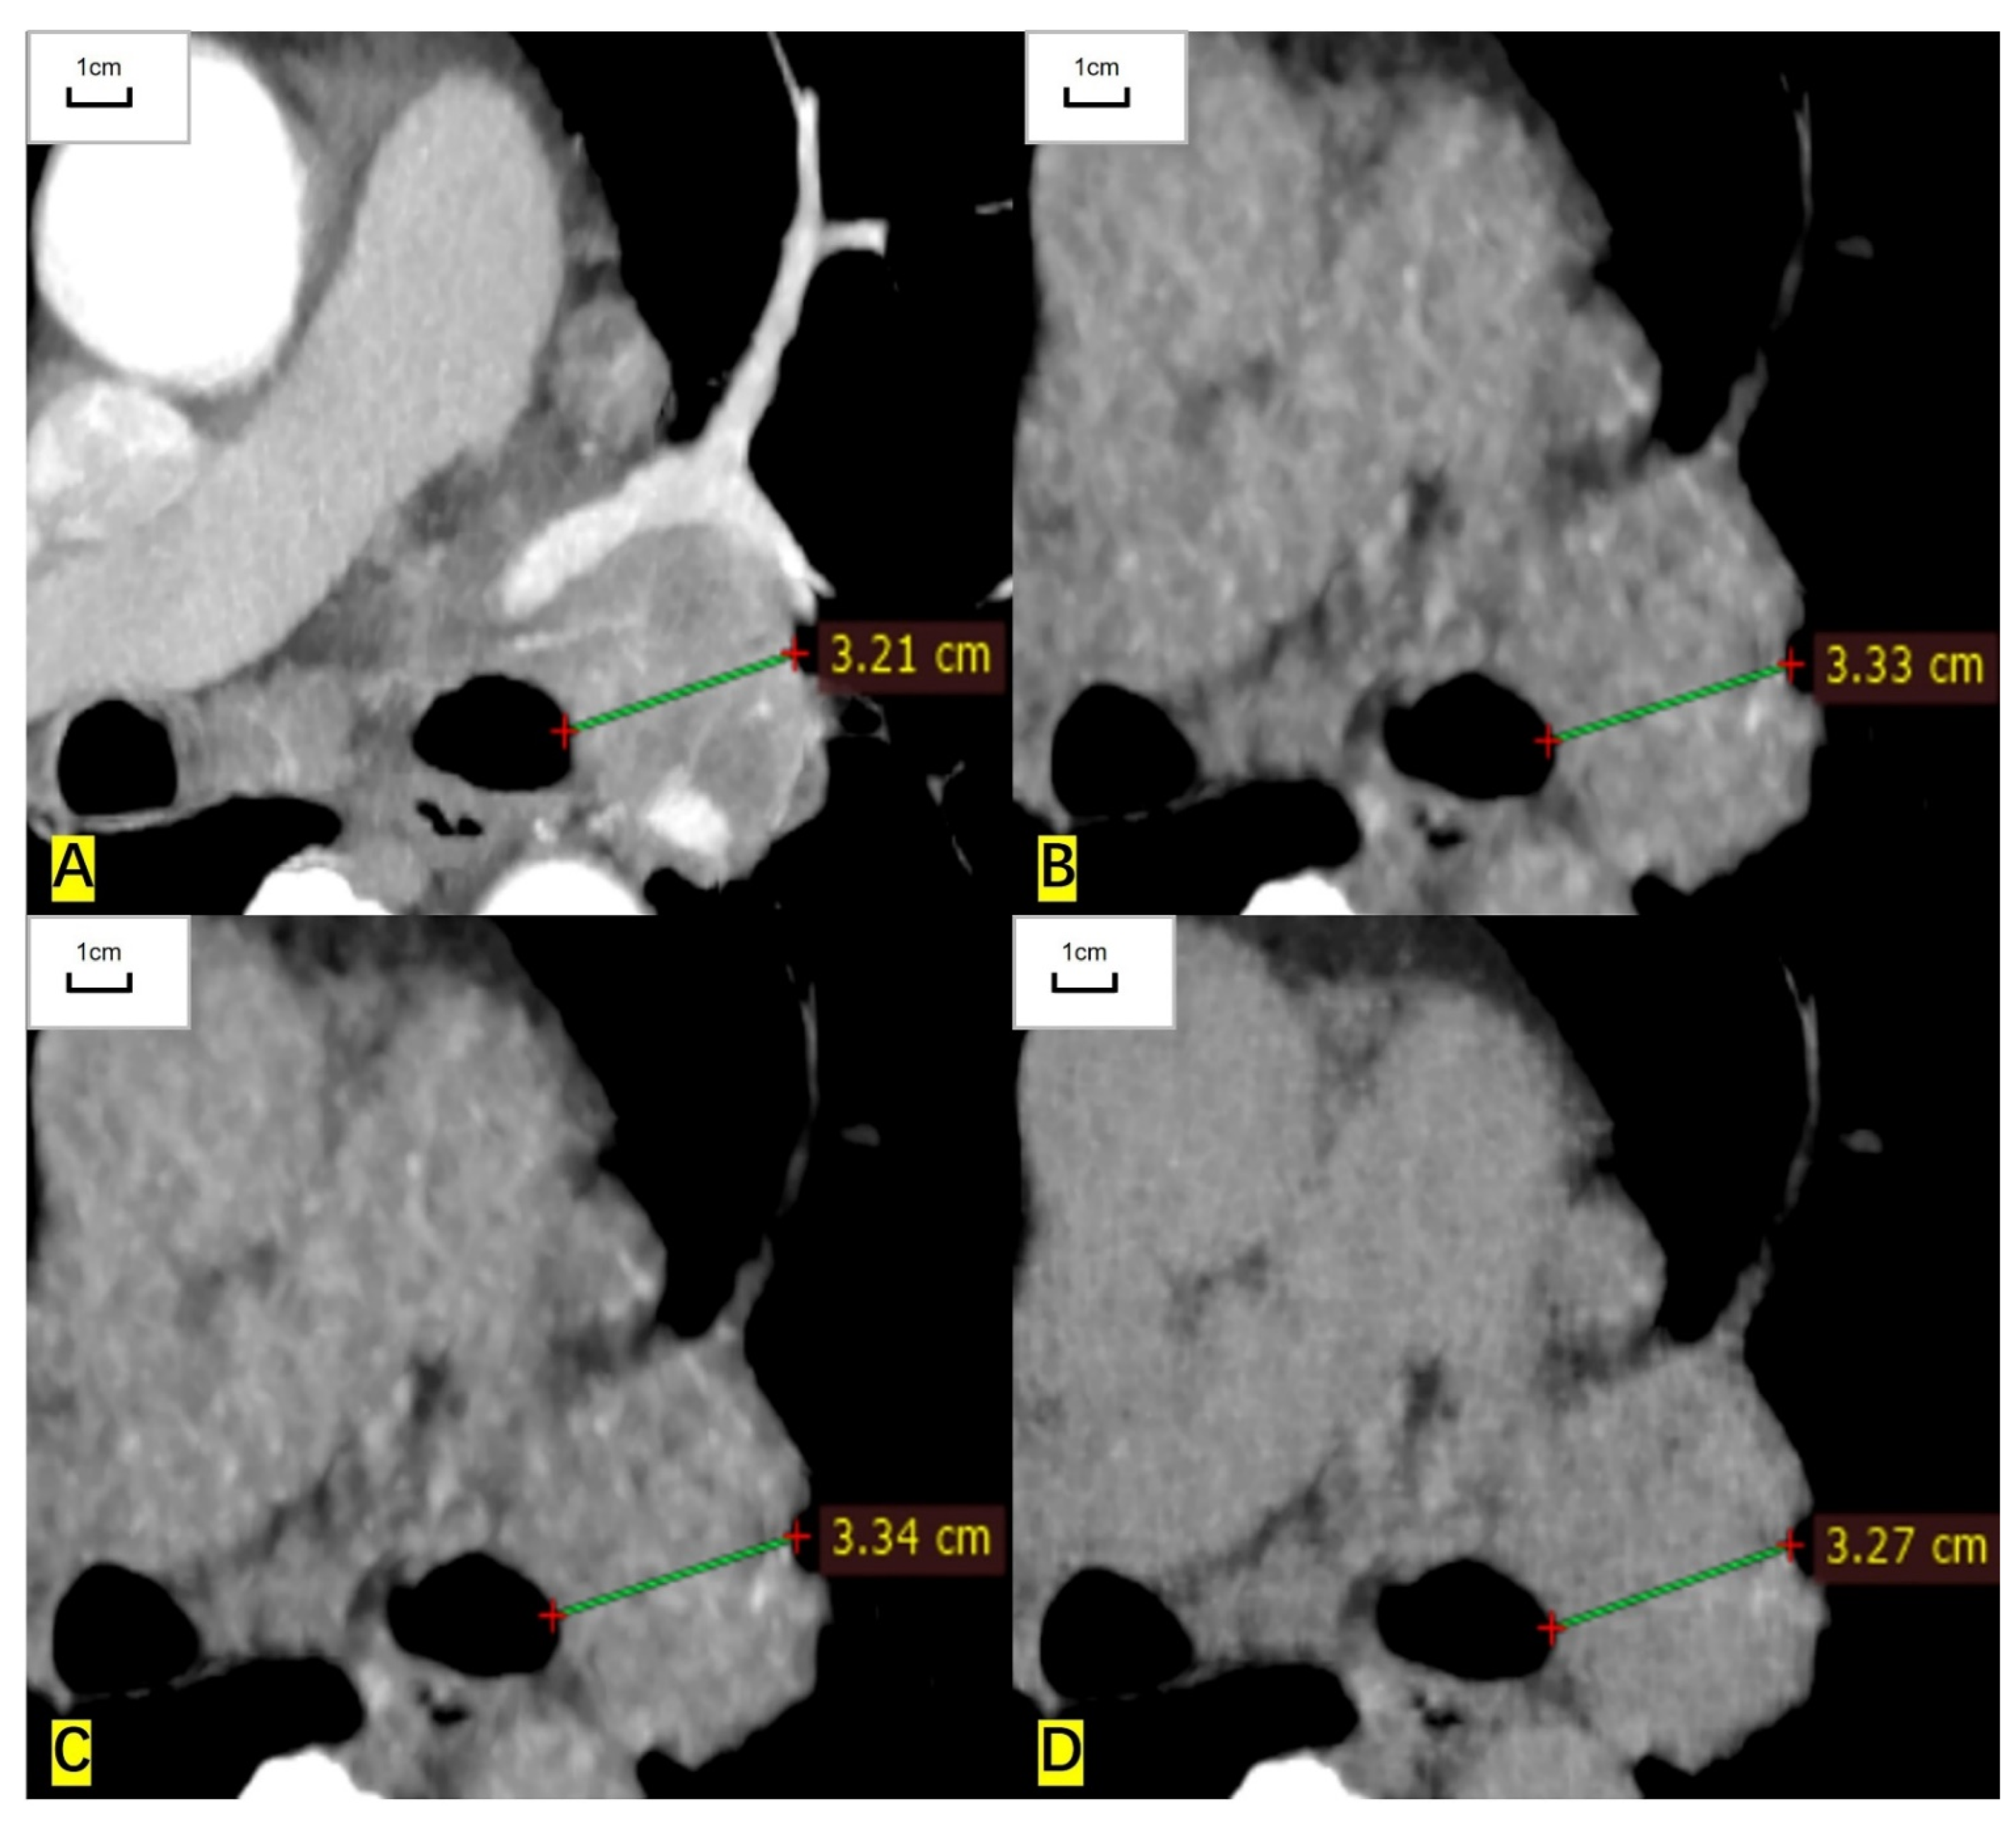
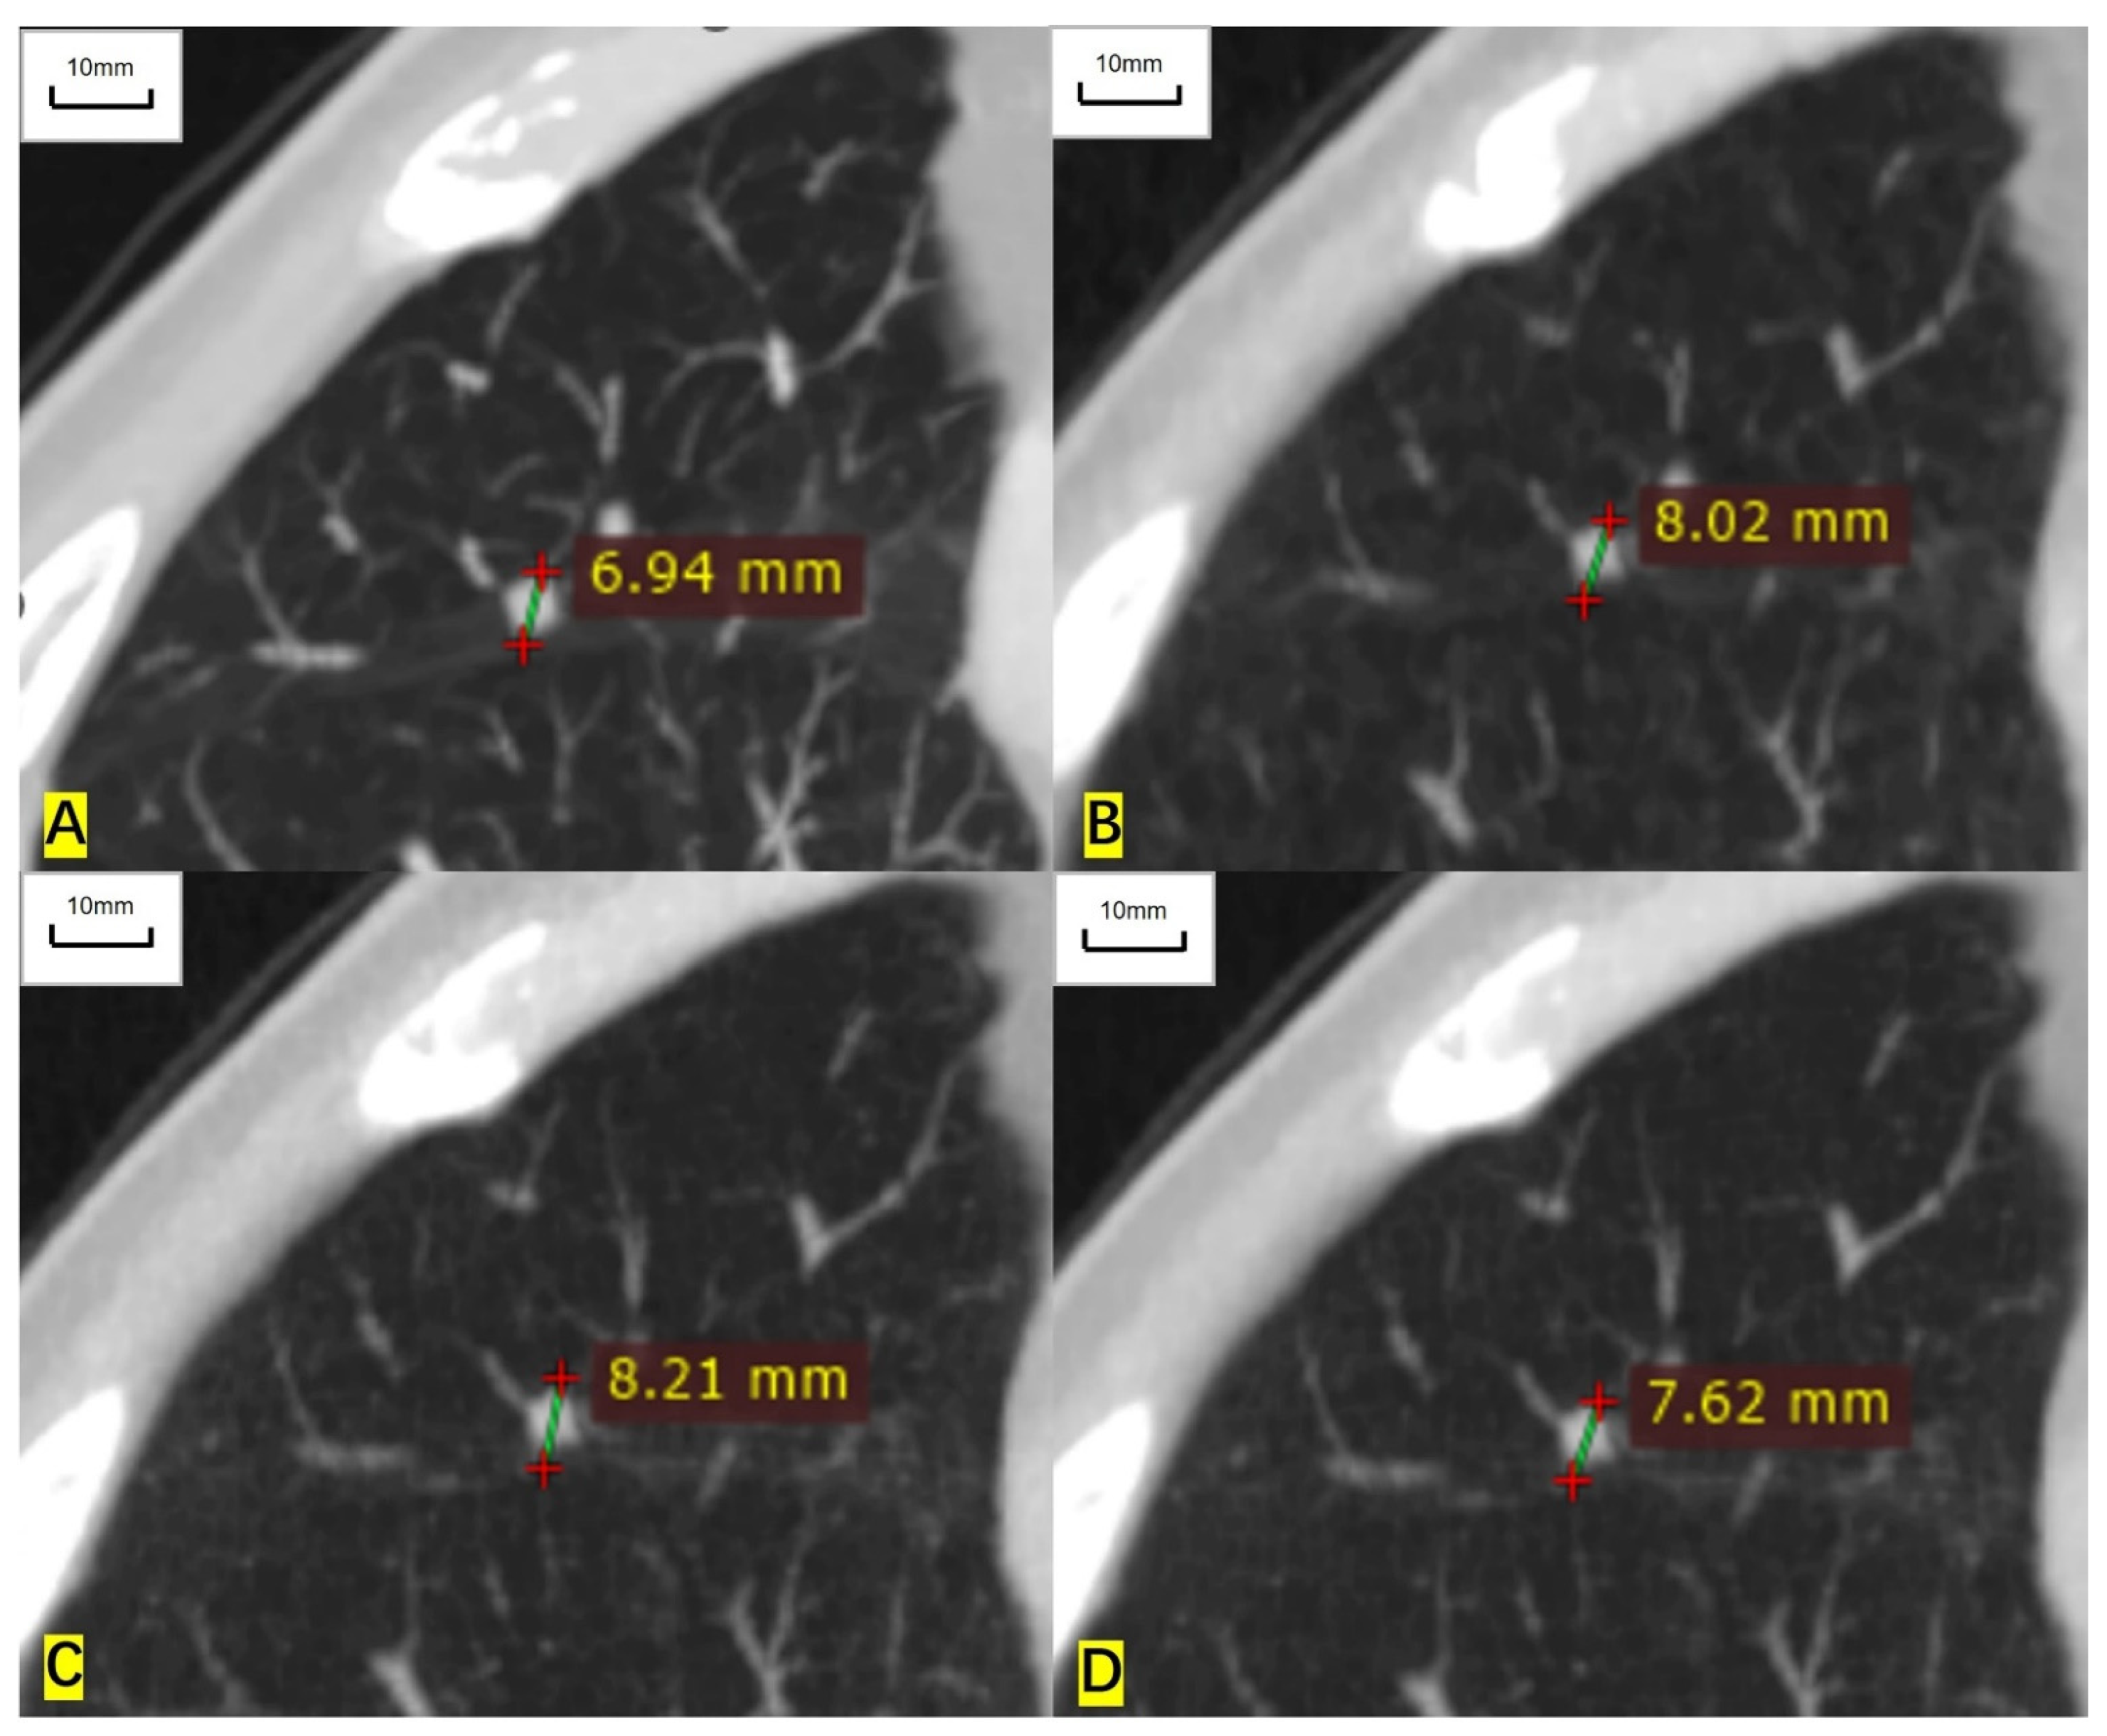
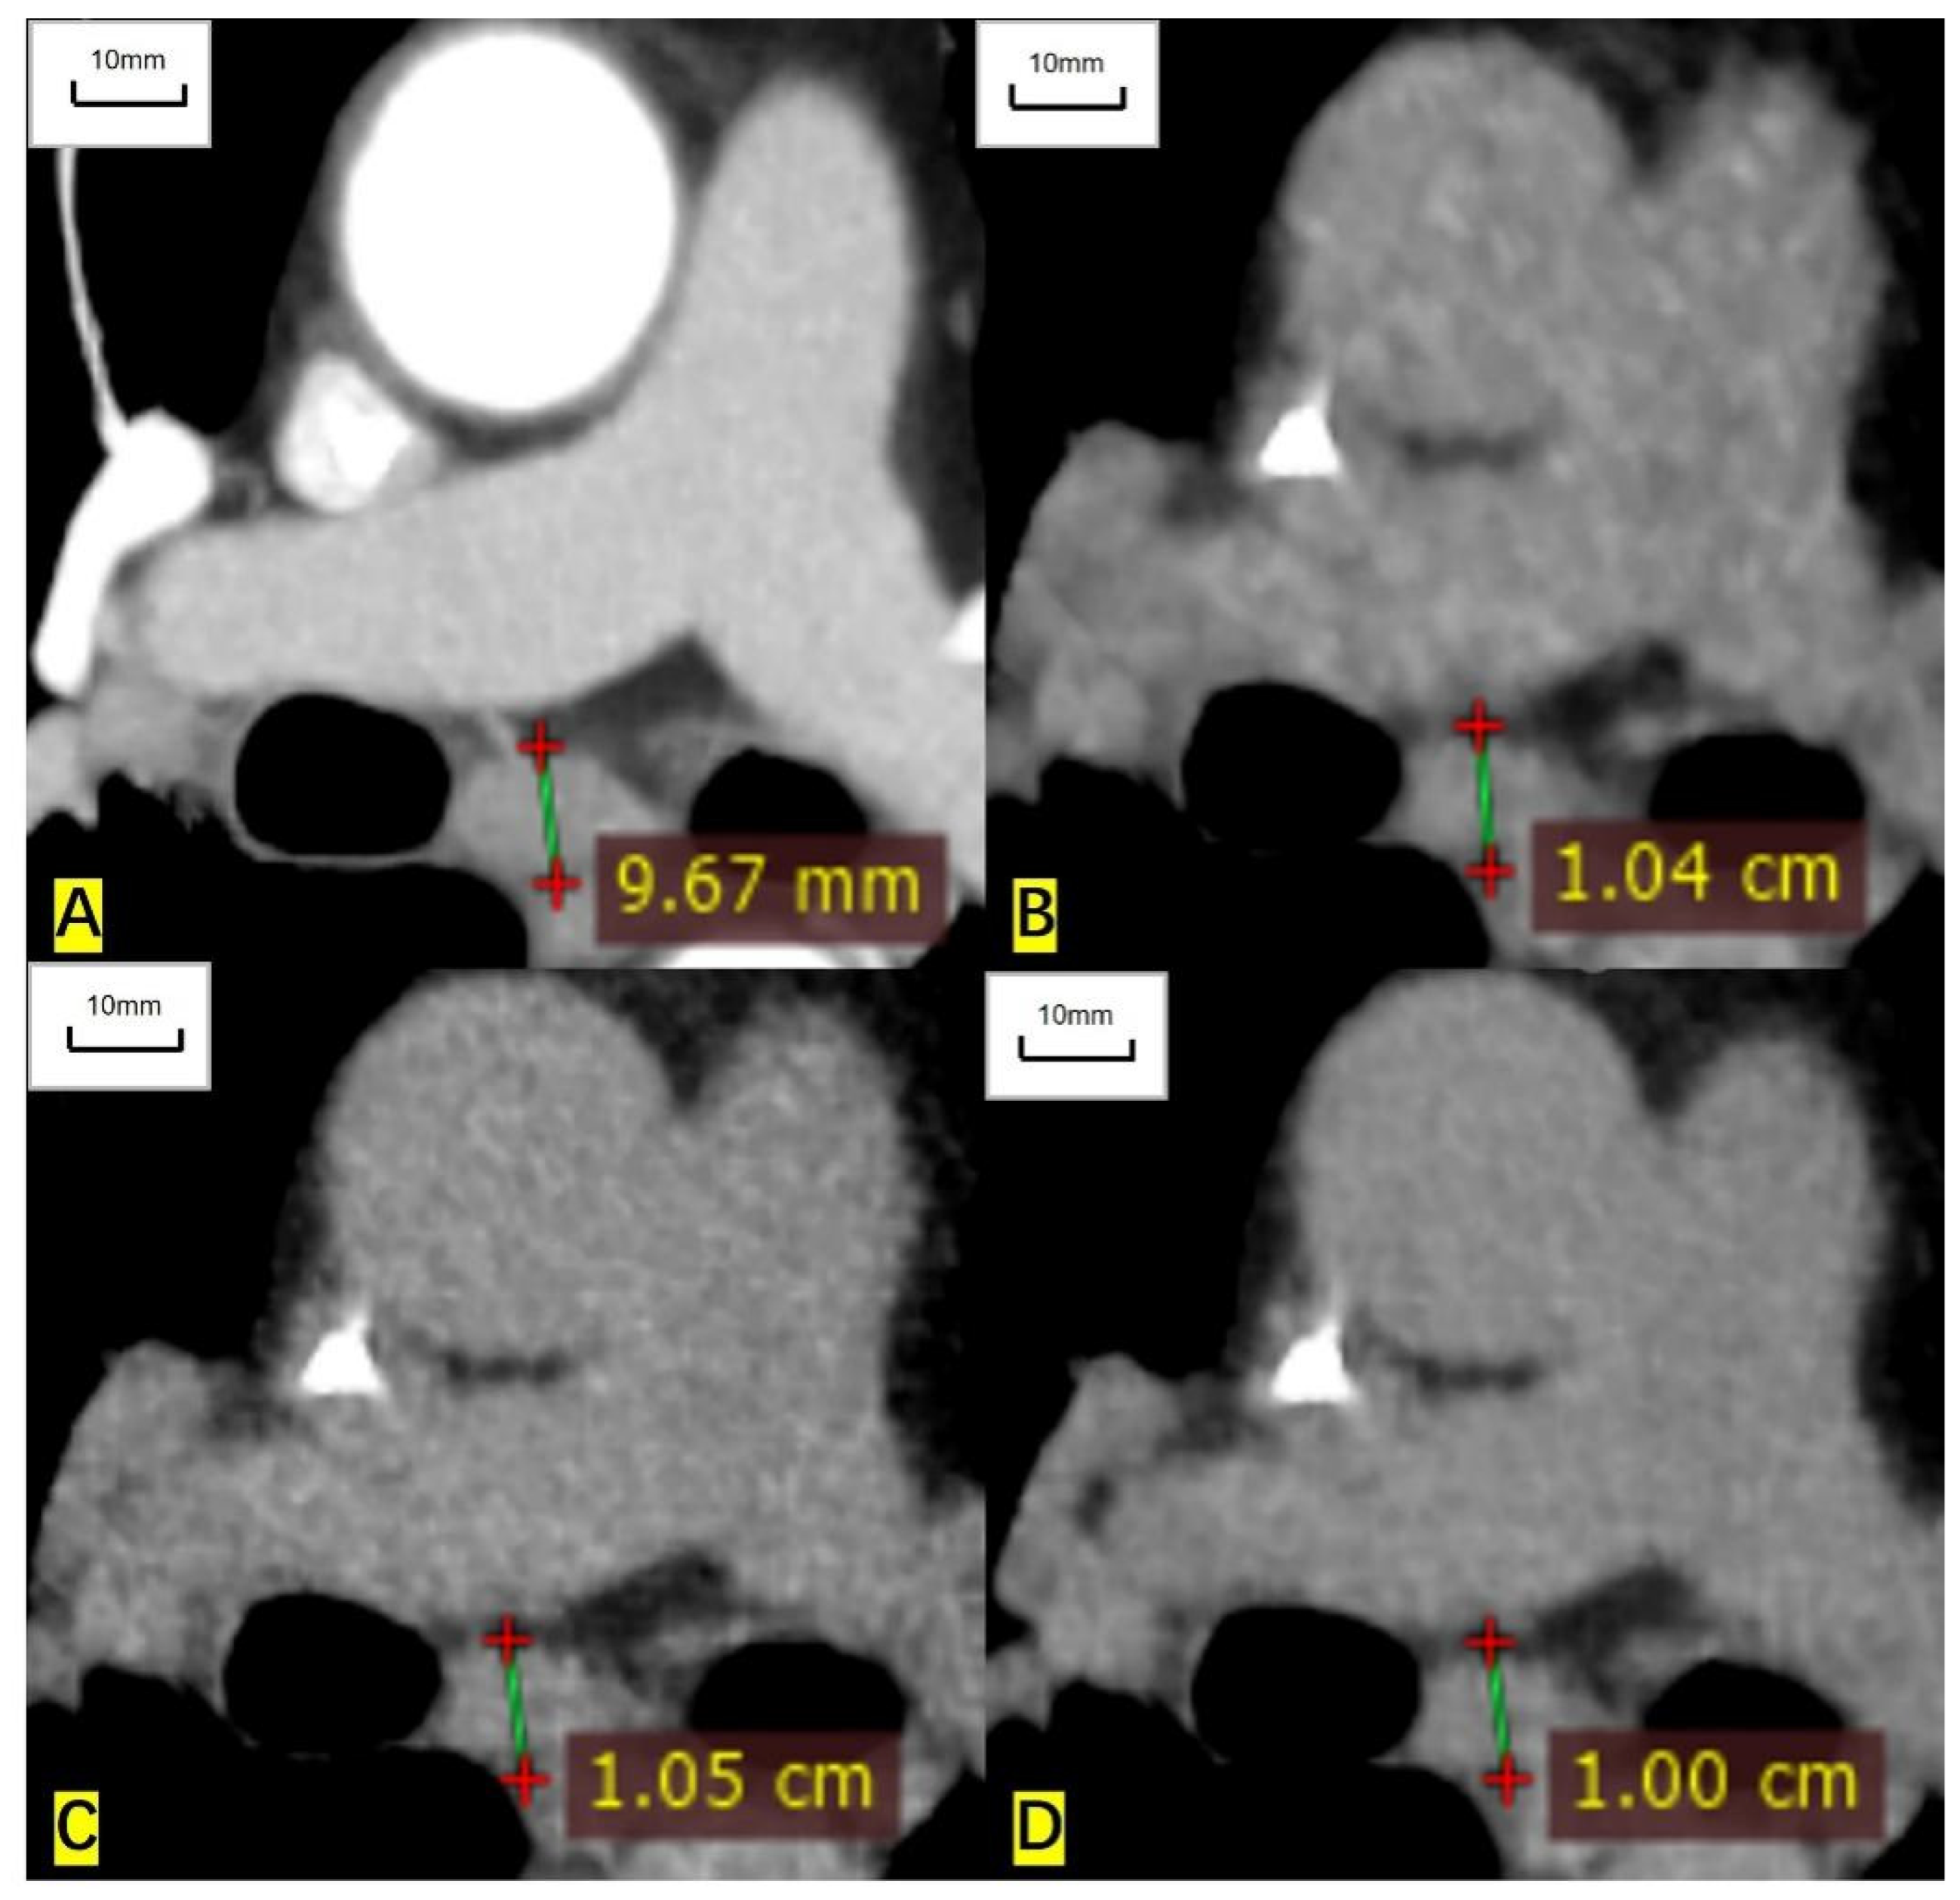
2.4. Image Quality, RECIST-Defined Target Lesions, and Image Reading
2.5. Statistics
3. Results
3.1. Patients
3.2. Image Quality, Lesion Measurement, and Measurement Repeatability
3.3. Association with Influential Factors
4. Discussion
5. Conclusions
Supplementary Materials
Author Contributions
Funding
Institutional Review Board Statement
Informed Consent Statement
Data Availability Statement
Conflicts of Interest
References
- Siegel, R.L.; Miller, K.D.; Jemal, A. Cancer statistics. CA: A Cancer J. Clin. 2016, 66, 7–30. [Google Scholar] [CrossRef] [Green Version]
- Denisenko, T.V.; Budkevich, I.N.; Zhivotovsky, B. Cell death-based treatment of lung adenocarcinoma. Cell Death Dis. 2018, 9, 117. [Google Scholar] [CrossRef] [Green Version]
- Zappa, C.; Mousa, S.A. Non-small cell lung cancer: Current treatment and future advances. Transl. Lung Cancer Res. 2016, 5, 288–300. [Google Scholar] [CrossRef] [PubMed] [Green Version]
- De Koning, H.J.; van der Aalst, C.M.; de Jong, P.A.; Scholten, E.T.; Nackaerts, K.; Heuvelmans, M.A.; Lammers, J.J.; Weenink, C.; Yousaf-Khan, U.; Horeweg, N.; et al. Reduced Lung-Cancer Mortality with Volume CT Screening in a Randomized Trial. New Engl. J. Med. 2020, 382, 503–513. [Google Scholar] [CrossRef] [PubMed]
- Cooper, A.J.; Sequist, L.V.; Lin, J.J. Third-generation EGFR and ALK inhibitors: Mechanisms of resistance and management. Nat. Rev. Clin. Oncol. 2022. [Google Scholar] [CrossRef]
- Morgan, R.L.; Camidge, D.R. Reviewing RECIST in the Era of Prolonged and Targeted Therapy. J. Thorac. Oncol. Off. Publ. Int. Assoc. Study Lung Cancer 2018, 13, 154–164. [Google Scholar] [CrossRef] [Green Version]
- Eisenhauer, E.A.; Therasse, P.; Bogaerts, J.; Schwartz, L.H.; Sargent, D.; Ford, R.; Dancey, J.; Arbuck, S.; Gwyther, S.; Mooney, M.; et al. New response evaluation criteria in solid tumours: Revised RECIST guideline (version 1.1). Eur. J. Cancer 2009, 45, 228–247. [Google Scholar] [CrossRef]
- Cong, M.; Feng, H.; Ren, J.L.; Xu, Q.; Cong, L.; Hou, Z.; Wang, Y.Y.; Shi, G. Development of a predictive radiomics model for lymph node metastases in pre-surgical CT-based stage IA non-small cell lung cancer. Lung Cancer (Amst. Neth. ) 2020, 139, 73–79. [Google Scholar] [CrossRef] [Green Version]
- Bach, P.B.; Mirkin, J.N.; Oliver, T.K.; Azzoli, C.G.; Berry, D.A.; Brawley, O.W.; Byers, T.; Colditz, G.A.; Gould, M.K.; Jett, J.R.; et al. Benefits and harms of CT screening for lung cancer: A systematic review. Jama 2012, 307, 2418–2429. [Google Scholar] [CrossRef] [Green Version]
- Vulli, A.; Srinivasu, P.N.; Sashank, M.S.K.; Shafi, J.; Choi, J.; Ijaz, M.F. Fine-Tuned DenseNet-169 for Breast Cancer Metastasis Prediction Using FastAI and 1-Cycle Policy. Sensors 2022, 22, 2988. [Google Scholar] [CrossRef]
- Ali, F.; Khan, P.; Riaz, K.; Kwak, D.; Abuhmed, T.; Park, D.; Kwak, K.S. A Fuzzy Ontology and SVM–Based Web Content Classification System. IEEE Access 2017, 5, 25781–25797. [Google Scholar] [CrossRef]
- Jiang, B.; Zhang, Y.; Zhang, L.; Geertruida, H.d.B.; Vliegenthart, R.; Xie, X. Human-recognizable CT image features of subsolid lung nodules associated with diagnosis and classification by convolutional neural networks. Eur. Radiol. 2021, 31, 7303–7315. [Google Scholar] [CrossRef]
- Zhang, T.; Xu, Z.; Liu, G.; Jiang, B.; de Bock, G.H.; Groen, H.J.M.; Vliegenthart, R.; Xie, X. Simultaneous Identification of EGFR, KRAS, ERBB2, and TP53 Mutations in Patients with Non-Small Cell Lung Cancer by Machine Learning-Derived Three-Dimensional Radiomics. Cancers 2021, 13, 1814. [Google Scholar] [CrossRef] [PubMed]
- Liu, G.; Xu, Z.; Zhang, Y.; Jiang, B.; Zhang, L.; Wang, L.; de Bock, G.H.; Vliegenthart, R.; Xie, X. Machine-Learning-Derived Nomogram Based on 3D Radiomic Features and Clinical Factors Predicts Progression-Free Survival in Lung Adenocarcinoma. Front. Oncol. 2021, 11, 692329. [Google Scholar] [CrossRef] [PubMed]
- Yao, Y.; Guo, B.; Li, J.; Yang, Q.; Li, X.; Deng, L. The influence of a deep learning image reconstruction algorithm on the image quality and auto-analysis of pulmonary nodules at ultra-low dose chest CT: A phantom study. Quant. Imaging Med. Surg. 2022, 12, 2777–2791. [Google Scholar] [CrossRef]
- Greffier, J.; Frandon, J.; Larbi, A.; Beregi, J.P.; Pereira, F. CT iterative reconstruction algorithms: A task-based image quality assessment. Eur. Radiol. 2020, 30, 487–500. [Google Scholar] [CrossRef]
- Greffier, J.; Frandon, J.; Pereira, F.; Hamard, A.; Beregi, J.P.; Larbi, A.; Omoumi, P. Optimization of radiation dose for CT detection of lytic and sclerotic bone lesions: A phantom study. Eur. Radiol. 2020, 30, 1075–1078. [Google Scholar] [CrossRef]
- Geyer, L.L.; Schoepf, U.J.; Meinel, F.G.; Nance, J.W., Jr.; Bastarrika, G.; Leipsic, J.A.; Paul, N.S.; Rengo, M.; Laghi, A.; De Cecco, C.N. State of the Art: Iterative CT Reconstruction Techniques. Radiology 2015, 276, 339–357. [Google Scholar] [CrossRef]
- Szczykutowicz, T.P.; Nett, B.; Cherkezyan, L.; Pozniak, M.; Tang, J.; Lubner, M.G.; Hsieh, J. Protocol Optimization Considerations for Implementing Deep Learning CT Reconstruction. AJR. Am. J. Roentgenol. 2021, 216, 1668–1677. [Google Scholar] [CrossRef]
- Zhao, T.; McNitt-Gray, M.; Ruan, D. A convolutional neural network for ultra-low-dose CT denoising and emphysema screening. Med. Phys. 2019, 46, 3941–3950. [Google Scholar] [CrossRef]
- Jensen, C.T.; Liu, X.; Tamm, E.P.; Chandler, A.G.; Sun, J.; Morani, A.C.; Javadi, S.; Wagner-Bartak, N.A. Image Quality Assessment of Abdominal CT by Use of New Deep Learning Image Reconstruction: Initial Experience. AJR. Am. J. Roentgenol. 2020, 215, 50–57. [Google Scholar] [CrossRef] [PubMed]
- Nam, J.G.; Ahn, C.; Choi, H.; Hong, W.; Park, J.; Kim, J.H.; Goo, J.M. Image quality of ultralow-dose chest CT using deep learning techniques: Potential superiority of vendor-agnostic post-processing over vendor-specific techniques. Eur. Radiol. 2021, 31, 5139–5147. [Google Scholar] [CrossRef]
- Jiang, B.; Li, N.; Shi, X.; Zhang, S.; Li, J.; de Bock, G.H.; Vliegenthart, R.; Xie, X. Deep Learning Reconstruction Shows Better Lung Nodule Detection for Ultra-Low-Dose Chest CT. Radiology 2022, 303, 202–212. [Google Scholar] [CrossRef] [PubMed]
- Mukhopadhyay, S. Utility of small biopsies for diagnosis of lung nodules: Doing more with less. Mod. Pathol. Off. J. United States Can. Acad. Pathol. Inc 2012, 25 (Suppl. S1), S43–S57. [Google Scholar] [CrossRef] [Green Version]
- Hashimoto, T.; Osoegawa, A.; Takumi, Y.; Abe, M.; Kobayashi, R.; Miyawaki, M.; Takeuchi, H.; Okamoto, T.; Sugio, K. Intratumoral heterogeneity of copy number variation in lung cancer harboring L858R via immunohistochemical heterogeneous staining. Lung Cancer 2018, 124, 241–247. [Google Scholar] [CrossRef] [PubMed]
- Raman, S.P.; Johnson, P.T.; Deshmukh, S.; Mahesh, M.; Grant, K.L.; Fishman, E.K. CT dose reduction applications: Available tools on the latest generation of CT scanners. J. Am. Coll. Radiol. JACR 2013, 10, 37–41. [Google Scholar] [CrossRef] [PubMed]
- Bae, K.T.; Seeck, B.A.; Hildebolt, C.F.; Tao, C.; Zhu, F.; Kanematsu, M.; Woodard, P.K. Contrast enhancement in cardiovascular MDCT: Effect of body weight, height, body surface area, body mass index, and obesity. AJR. Am. J. Roentgenol. 2008, 190, 777–784. [Google Scholar] [CrossRef]
- Xie, X.; Willemink, M.J.; de Jong, P.A.; van Ooijen, P.M.; Oudkerk, M.; Vliegenthart, R.; Greuter, M.J. Small irregular pulmonary nodules in low-dose CT: Observer detection sensitivity and volumetry accuracy. AJR. Am. J. Roentgenol. 2014, 202, W202–W209. [Google Scholar] [CrossRef]
- Wood, D.E.; Kazerooni, E.A.; Baum, S.L.; Eapen, G.A.; Ettinger, D.S.; Hou, L.; Jackman, D.M.; Klippenstein, D.; Kumar, R.; Lackner, R.P.; et al. Lung Cancer Screening, Version 3.2018, NCCN Clinical Practice Guidelines in Oncology. J. Natl. Compr. Cancer Netw. JNCCN 2018, 16, 412–441. [Google Scholar] [CrossRef]
- Rampinelli, C.; De Marco, P.; Origgi, D.; Maisonneuve, P.; Casiraghi, M.; Veronesi, G.; Spaggiari, L.; Bellomi, M. Exposure to low dose computed tomography for lung cancer screening and risk of cancer: Secondary analysis of trial data and risk-benefit analysis. BMJ 2017, 356, j347. [Google Scholar] [CrossRef]
- Svahn, T.M.; Sjöberg, T.; Ast, J.C. Dose estimation of ultra-low-dose chest CT to different sized adult patients. Eur. Radiol. 2019, 29, 4315–4323. [Google Scholar] [CrossRef] [PubMed]
- Sanaat, A.; Shiri, I.; Arabi, H.; Mainta, I.; Nkoulou, R.; Zaidi, H. Deep learning-assisted ultra-fast/low-dose whole-body PET/CT imaging. Eur. J. Nucl. Med. Mol. Imaging 2021, 48, 2405–2415. [Google Scholar] [CrossRef] [PubMed]
- Shiri, I.; Akhavanallaf, A.; Sanaat, A.; Salimi, Y.; Askari, D.; Mansouri, Z.; Shayesteh, S.P.; Hasanian, M.; Rezaei-Kalantari, K.; Salahshour, A.; et al. Ultra-low-dose chest CT imaging of COVID-19 patients using a deep residual neural network. Eur. Radiol. 2021, 31, 1420–1431. [Google Scholar] [CrossRef] [PubMed]
- Parakh, A.; Cao, J.; Pierce, T.T.; Blake, M.A.; Savage, C.A.; Kambadakone, A.R. Sinogram-based deep learning image reconstruction technique in abdominal CT: Image quality considerations. Eur. Radiol. 2021, 31, 8342–8353. [Google Scholar] [CrossRef]
- Noda, Y.; Kaga, T.; Kawai, N.; Miyoshi, T.; Kawada, H.; Hyodo, F.; Kambadakone, A.; Matsuo, M. Low-dose whole-body CT using deep learning image reconstruction: Image quality and lesion detection. Br. J. Radiol. 2021, 94, 20201329. [Google Scholar] [CrossRef]
- Kim, J.H.; Yoon, H.J.; Lee, E.; Kim, I.; Cha, Y.K.; Bak, S.H. Validation of Deep-Learning Image Reconstruction for Low-Dose Chest Computed Tomography Scan: Emphasis on Image Quality and Noise. Korean J. Radiol. 2021, 22, 131–138. [Google Scholar] [CrossRef]
- Sone, S.; Higashihara, T.; Morimoto, S.; Ikezoe, J.; Arisawa, J.; Monden, Y.; Nahakara, K. CT anatomy of hilar lymphadenopathy. AJR. Am. J. Roentgenol. 1983, 140, 887–892. [Google Scholar] [CrossRef]
- Hata, A.; Yanagawa, M.; Yoshida, Y.; Miyata, T.; Kikuchi, N.; Honda, O.; Tomiyama, N. The image quality of deep-learning image reconstruction of chest CT images on a mediastinal window setting. Clin. Radiol. 2021, 76, 155.e115–155.e123. [Google Scholar] [CrossRef]
- Nam, J.G.; Hong, J.H.; Kim, D.S.; Oh, J.; Goo, J.M. Deep learning reconstruction for contrast-enhanced CT of the upper abdomen: Similar image quality with lower radiation dose in direct comparison with iterative reconstruction. Eur. Radiol. 2021, 31, 5533–5543. [Google Scholar] [CrossRef]


| Variable | Ultra-Low Dose CT | p Value | ||
|---|---|---|---|---|
| Contrast-Enhanced CT (n = 141) | At 0.07 mSv (n = 75) | At 0.14 mSv (n = 66) | ||
| Age/year | 62 ± 12 | 62 ± 11 | 62 ± 13 | 0.704 |
| Gender/n (%) | ||||
| Male Female | 90 (63.9%) 51 (36.2%) | 47 (33.3%) 28 (19.9%) | 43 (30.5%) 23 (16.3%) | 0.759 |
| BMI/(kg·m2) | 22.79 ± 2.94 | 23.02 ± 3.07 | 22.51 ± 2.78 | 0.362 |
| <18.5 | 9 | 5 | 4 | 0.367 |
| ≥18.5 and <25 | 106 | 53 | 53 | |
| ≥25 | 26 | 17 | 9 | |
| Measurable pulmonary lesions | ||||
| Malignant | 30 | 15 | 15 | 0.821 |
| Benign or no histological result | 59 | 31 | 28 | |
| Measurable lymph nodes | ||||
| Malignant | 21 | 14 | 7 | 0.534 |
| Benign or no histological result | 41 | 24 | 17 | |
| Nonmeasurable pulmonary lesions | ||||
| Malignant | 7 | 4 | 3 | 0.994 |
| Benign or no histological result | 199 | 114 | 85 | |
| Nonmeasurable lymph nodes | ||||
| Malignant | 10 | 3 | 7 | 0.025 |
| Benign or no histological result | 61 | 41 | 20 | |
| Correlation Coefficient (95% CI) | |||
|---|---|---|---|
| ASIR-V-80% and Enhanced CT | DLIR-M and Enhanced CT | DLIR-H and Enhanced CT | |
| All pulmonary target lesions | 0.999 (0.998 to 0.999) | 0.998 (0.997 to 0.999) | 0.999 (0.999 to 1.000) |
| Malignant | 0.998 (0.997 to 0.999) | 0.998 (0.995 to 0.999) | 0.999 (0.999 to 1.000) |
| Benign or no histological result | 0.999 (0.998 to 0.999) | 0.998 (0.997 to 0.999) | 0.999 (0.999 to 1.000) |
| Mediastinal lymph nodes | 0.997 (0.995 to 0.999) | 0.997 (0.995 to 0.998) | 0.999 (0.998 to 1.000) |
| Malignant | 0.998 (0.991 to 0.999) | 0.991 (0.968 to 0.998) | 0.997 (0.989 to 0.999) |
| Benign or no histological result | 0.997 (0.995 to 0.999) | 0.998 (0.996 to 0.999) | 1.000 (0.999 to 1.000) |
| Hilar lymph nodes | 0.993 (0.979 to 0.997) | 0.995 (0.984 to 0.998) | 0.997 (0.991 to 0.998) |
| Arithmetic Mean (95% CI) | |||
|---|---|---|---|
| ASIR-V-80% and Enhanced CT | DLIR-M and Enhanced CT | DLIR-H and Enhanced CT | |
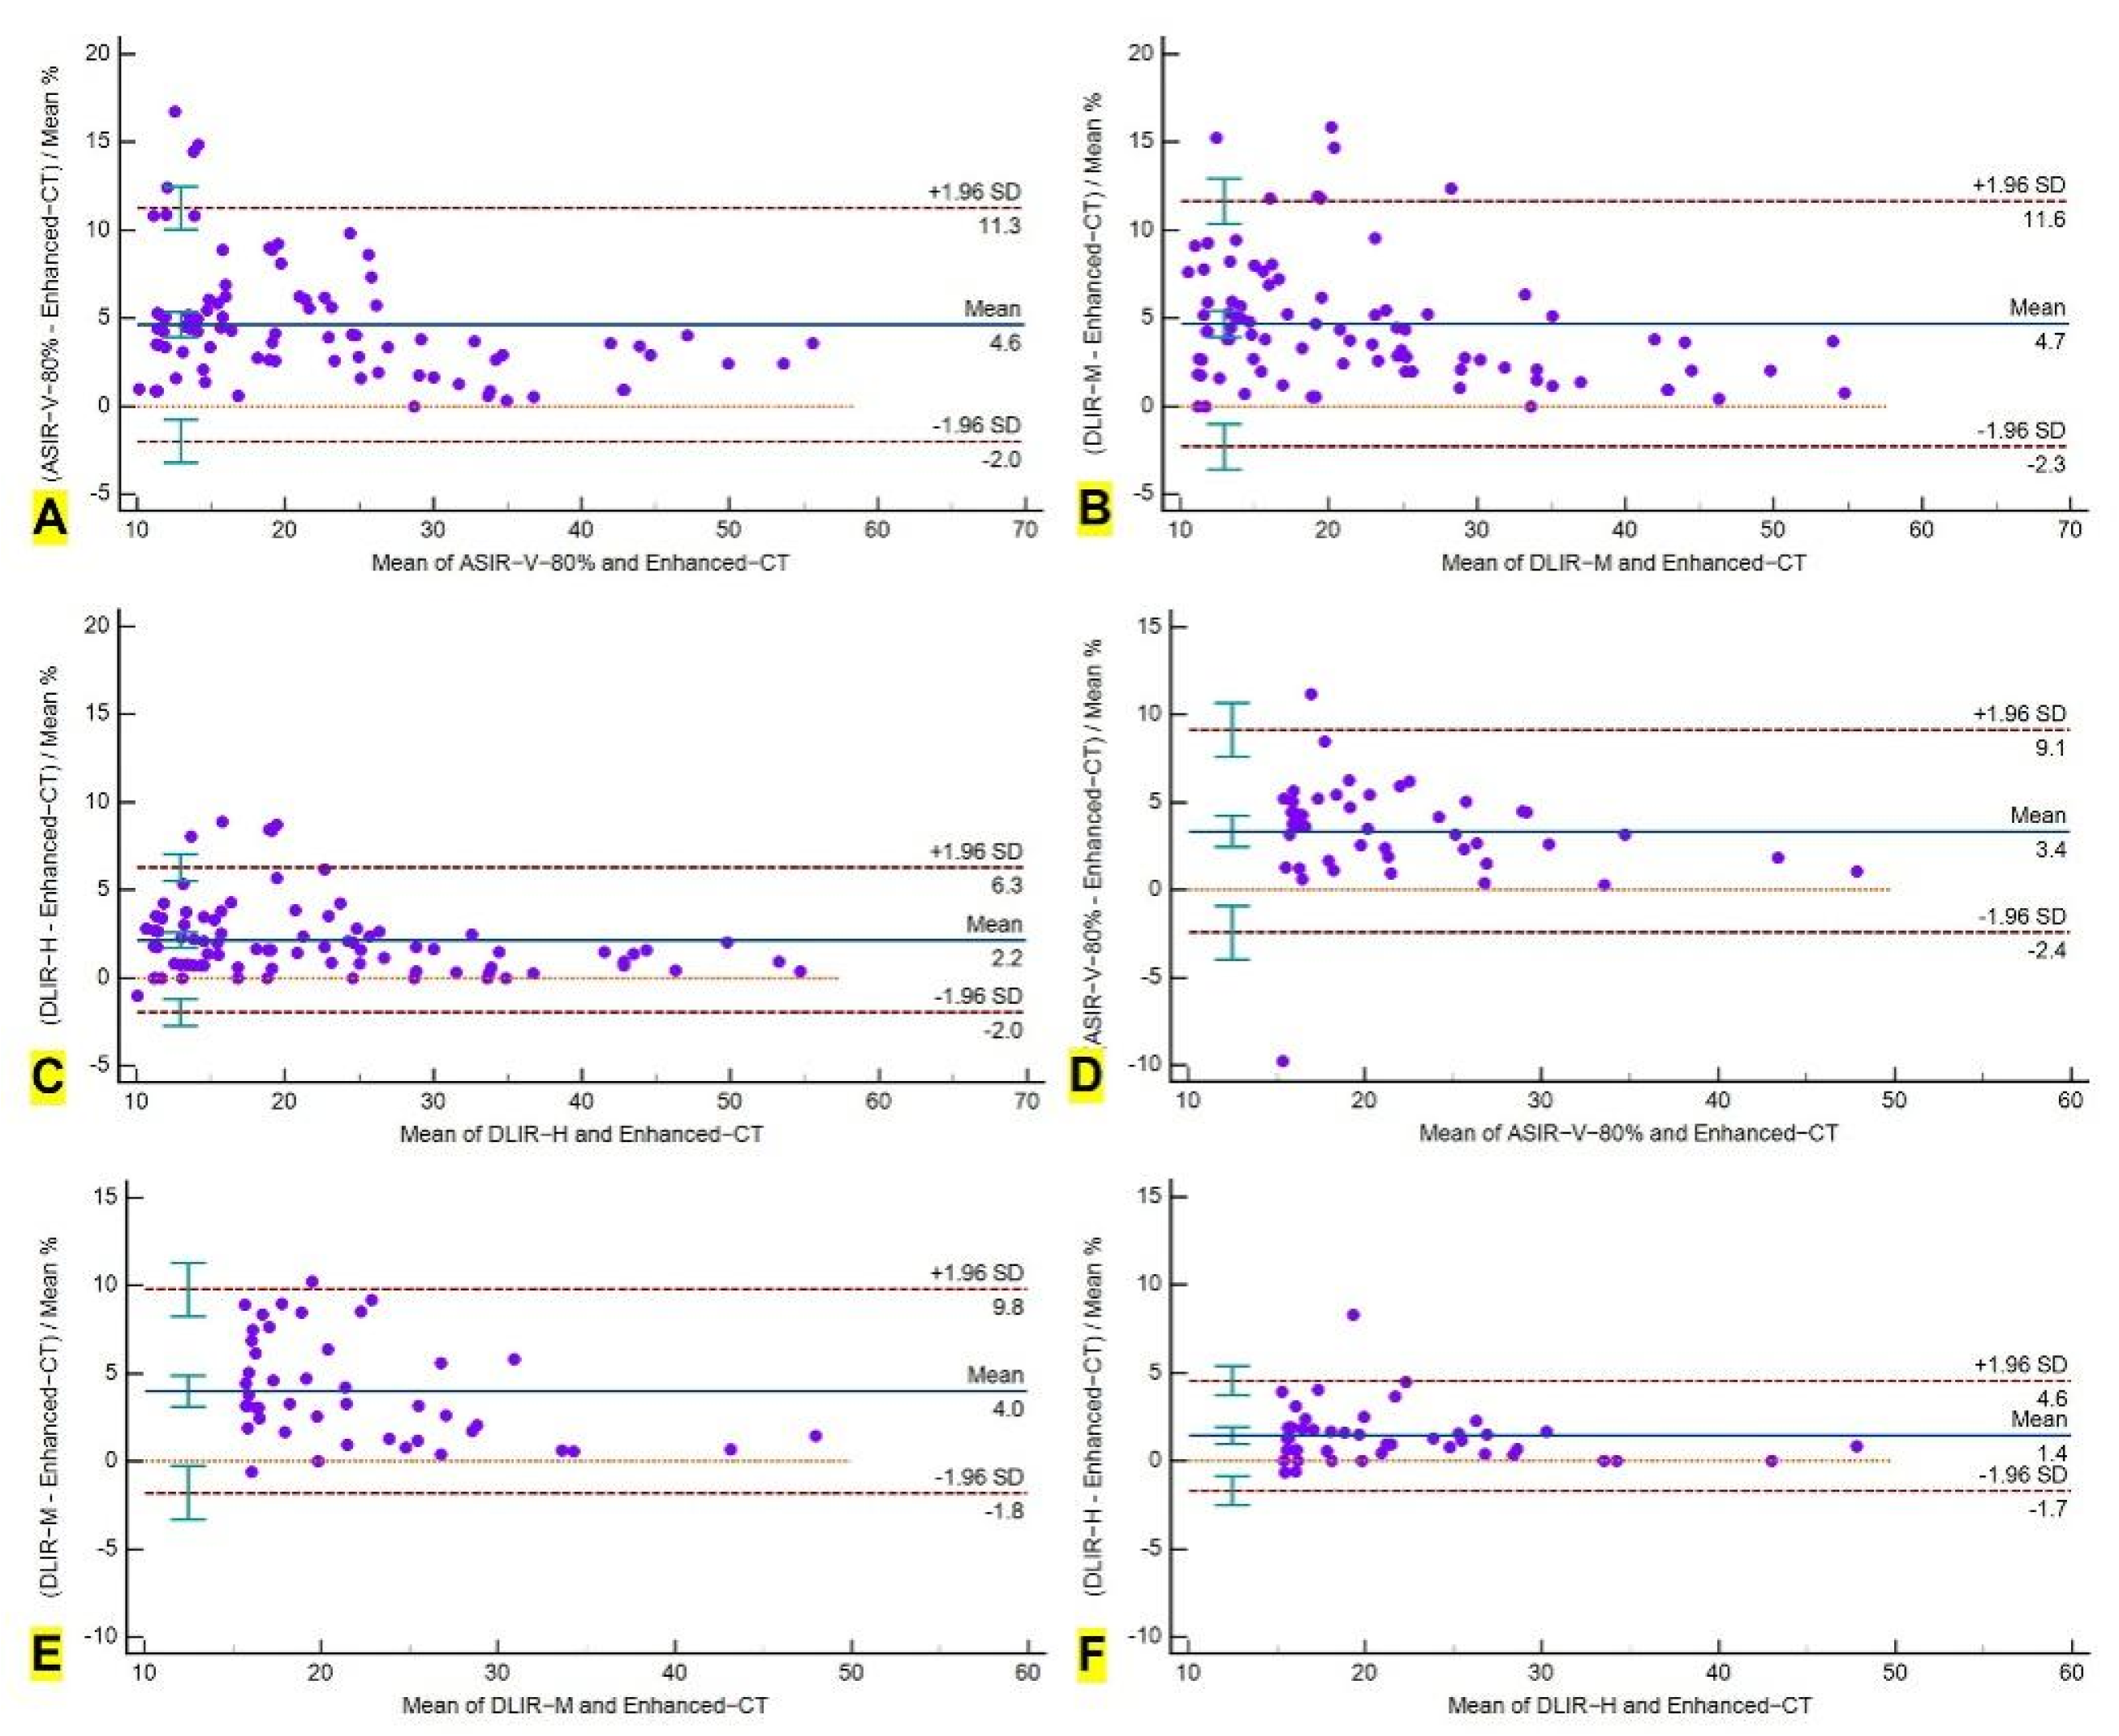
| All pulmonary target lesions | 4.6% (3.9–5.3%) | 4.7% (3.9–5.4%) | 2.2% (1.7–2.6%) |
| Malignant | 3.5% (2.6–4.4%) | 4.0% (2.8–5.1%) | 1.7% (1.1–2.4%) |
| Benign or no histological result | 5.2% (4.3–6.2%) | 5.0% (4.0–6.0%) | 2.4% (1.8–2.9%) |
| Mediastinal lymph nodes | 3.4% (2.5–4.2%) | 4.0% (3.1–4.9%) | 1.4% (1.0–1.9%) |
| Malignant | 3.5% (2.3–4.7%) | 4.1% (2.0–6.2%) | 2.1% (0.7–3.5%) |
| Benign or no histological result | 3.3% (2.1–4.5%) | 4.0% (3.0–5.0%) | 1.2% (0.8–1.7%) |
| Hilar lymph nodes | 5.0% (2.5–7.4%) | 3.9% (1.8–6.0%) | 2.3% (0.6–3.9%) |
| Correlation Coefficient (95% CI) | |||
|---|---|---|---|
| ASIR-V-80% and Enhanced CT | DLIR-M and Enhanced CT | DLIR-H and Enhanced CT | |
| All pulmonary target lesions | 0.977 (0.970 to 0.982) | 0.987 (0.983 to 0.990) | 0.995 (0.994 to 0.996) |
| Malignant | 0.997 (0.981 to 1.000) | 0.999 (0.991 to 1.000) | 0.997 (0.980 to 1.000) |
| Benign or no histological result | 0.976 (0.968 to 0.982) | 0.987 (0.982 to 0.990) | 0.995 (0.993 to 0.996) |
| Solid nodules | 0.961 (0.942 to 0.974) | 0.987 (0.980 to 0.991) | 0.996 (0.993 to 0.997) |
| Subsolid nodules | 0.990 (0.984 to 0.993) | 0.987 (0.980 to 0.992) | 0.996 (0.993 to 0.997) |
| Ground glass nodules | 0.987 (0.974 to 0.994) | 0.986 (0.971 to 0.993) | 0.993 (0.986 to 0.997) |
| Mediastinal lymph nodes | 0.937 (0.898 to 0.962) | 0.939 (0.901 to 0.963) | 0.970 (0.951 to 0.982) |
| Malignant | 0.960 (0.816 to 0.992) | 0.965 (0.836 to 0.993) | 0.974 (0.879 to 0.995) |
| Benign or no histological result | 0.934 (0.888 to 0.961) | 0.939 (0.897 to 0.965) | 0.968 (0.946 to 0.982) |
| Hilar lymph nodes | 0.994 (0.966 to 0.999) | 0.969 (0.835 to 0.995) | 0.997 (0.982 to 0.999) |
| Small lymph nodes (5 mm~10 mm) | 0.945 (0.910 to 0.966) | 0.961 (0.936 to 0.976) | 0.976 (0.960 to 0.985) |
| Arithmetic Mean (95% CI) | |||
|---|---|---|---|
| ASIR-V-80% and Enhanced CT | DLIR-M and Enhanced CT | DLIR-H and Enhanced CT | |
| All pulmonary target lesions | 5.7% (4.7–6.7%) | 5.1% (4.3–5.8%) | 2.2% (1.7–2.6%) |
| Malignant | 4.2% (2.3–6.2%) | 3.0% (1.8–4.2%) | 1.1% (−0.2–2.4%) |
| Benign or no histological result | 5.7% (4.7–6.8%) | 5.1% (4.4–5.9%) | 2.3% (1.7–2.7%) |
| Solid nodules | 5.7% (3.9–7.5%) | 5.0% (3.9–6.1%) | 2.3% (1.6–3.0%) |
| Subsolid nodules | 5.7% (4.6–6.8%) | 5.2% (4.0–6.4%) | 2.1% (1.5–2.7%) |
| Ground glass nodules | 5.8% (3.4–8.2%) | 4.8% (2.6–7.1%) | 2.1% (0.4–3.9%) |
| Mediastinal lymph nodes | 6.1% (5.2–7.1%) | 6.4% (5.4–7.4%) | 2.9% (2.2–3.5%) |
| Malignant | 5.0% (3.2–6.8%) | 4.3% (2.6–6.1%) | 2.6% (1.1–4.0%) |
| Benign or no histological result | 6.3% (5.2–7.4%) | 6.8% (5.7–7.8%) | 2.9% (2.1–3.7%) |
| Hilar lymph nodes | 5.2% (4.3–6.1%) | 6.4% (4.4–8.4%) | 3.2% (2.4–4.0%) |
| Small lymph node (5 mm ≤ d < 10 mm) | 5.7% (4.7–6.8%) | 5.8% (4.9–6.7%) | 2.2% (1.5–2.9%) |
| ASIR−V−80% and Enhanced CT | DLIR−M and Enhanced CT | DLIR−H and Enhanced CT | ||||
|---|---|---|---|---|---|---|
| Factors | B | p-value | B | p-value | B | p-value |
| Age | 0.007 | 0.198 | 0.003 | 0.566 | 0.003 | 0.381 |
| Sex | 0.079 | 0.473 | −0.039 | 0.741 | 0.081 | 0.264 |
| Body mass index | 0.023 | 0.219 | −0.021 | 0.299 | −0.002 | 0.842 |
| CT dose | −0.144 | 0.182 | −0.159 | 0.175 | −0.066 | 0.355 |
| Lesion type | −0.104 | 0.344 | −0.057 | 0.632 | −0.044 | 0.540 |
| Histological result | 0.004 | 0.970 | 0.177 | 0.146 | 0.115 | 0.119 |
| ASIR−V−80% and Enhanced CT | DLIR−M and Enhanced CT | DLIR−H and Enhanced CT | ||||
|---|---|---|---|---|---|---|
| Factors | B | p-value | B | p-value | B | p-value |
| Age | 0.004 | 0.102 | 0.002 | 0.252 | 0.002 | 0.141 |
| Sex | −0.028 | 0.590 | −0.037 | 0.349 | −0.019 | 0.443 |
| Body mass index | −0.005 | 0.528 | 0.003 | 0.669 | 0.002 | 0.553 |
| CT dose | −0.064 | 0.225 | −0.046 | 0.246 | −0.011 | 0.668 |
| Nodule type | 0.002 | 0.958 | 0.018 | 0.912 | 0.004 | 0.930 |
| Histological result | −0.023 | 0.877 | −0.063 | 0.559 | −0.051 | 0.450 |
| ASIR−V−80% and Enhanced CT | DLIR−M and Enhanced CT | DLIR−H and Enhanced CT | ||||
|---|---|---|---|---|---|---|
| Factors | B | p-value | B | p-value | B | p-value |
| Age | 0.004 | 0.522 | 0.009 | 0.110 | 0.002 | 0.574 |
| Sex | −0.006 | 0.964 | −0.020 | 0.889 | 0.022 | 0.817 |
| Body mass index | −0.005 | 0.810 | −0.014 | 0.514 | −0.006 | 0.681 |
| CT dose | −0.071 | 0.598 | −0.129 | 0.348 | −0.134 | 0.145 |
| Histological result | −0.089 | 0.632 | −0.218 | 0.249 | 0.042 | 0.738 |
Publisher’s Note: MDPI stays neutral with regard to jurisdictional claims in published maps and institutional affiliations. |
© 2022 by the authors. Licensee MDPI, Basel, Switzerland. This article is an open access article distributed under the terms and conditions of the Creative Commons Attribution (CC BY) license (https://creativecommons.org/licenses/by/4.0/).
Share and Cite
Zhao, K.; Jiang, B.; Zhang, S.; Zhang, L.; Zhang, L.; Feng, Y.; Li, J.; Zhang, Y.; Xie, X. Measurement Accuracy and Repeatability of RECIST-Defined Pulmonary Lesions and Lymph Nodes in Ultra-Low-Dose CT Based on Deep Learning Image Reconstruction. Cancers 2022, 14, 5016. https://doi.org/10.3390/cancers14205016
Zhao K, Jiang B, Zhang S, Zhang L, Zhang L, Feng Y, Li J, Zhang Y, Xie X. Measurement Accuracy and Repeatability of RECIST-Defined Pulmonary Lesions and Lymph Nodes in Ultra-Low-Dose CT Based on Deep Learning Image Reconstruction. Cancers. 2022; 14(20):5016. https://doi.org/10.3390/cancers14205016
Chicago/Turabian StyleZhao, Keke, Beibei Jiang, Shuai Zhang, Lu Zhang, Lin Zhang, Yan Feng, Jianying Li, Yaping Zhang, and Xueqian Xie. 2022. "Measurement Accuracy and Repeatability of RECIST-Defined Pulmonary Lesions and Lymph Nodes in Ultra-Low-Dose CT Based on Deep Learning Image Reconstruction" Cancers 14, no. 20: 5016. https://doi.org/10.3390/cancers14205016