
Acid Adaptation Promotes TRPC1 Plasma Membrane Localization Leading to Pancreatic Ductal Adenocarcinoma Cell Proliferation and Migration through Ca2+ Entry and Interaction with PI3K/CaM

 , , , , and
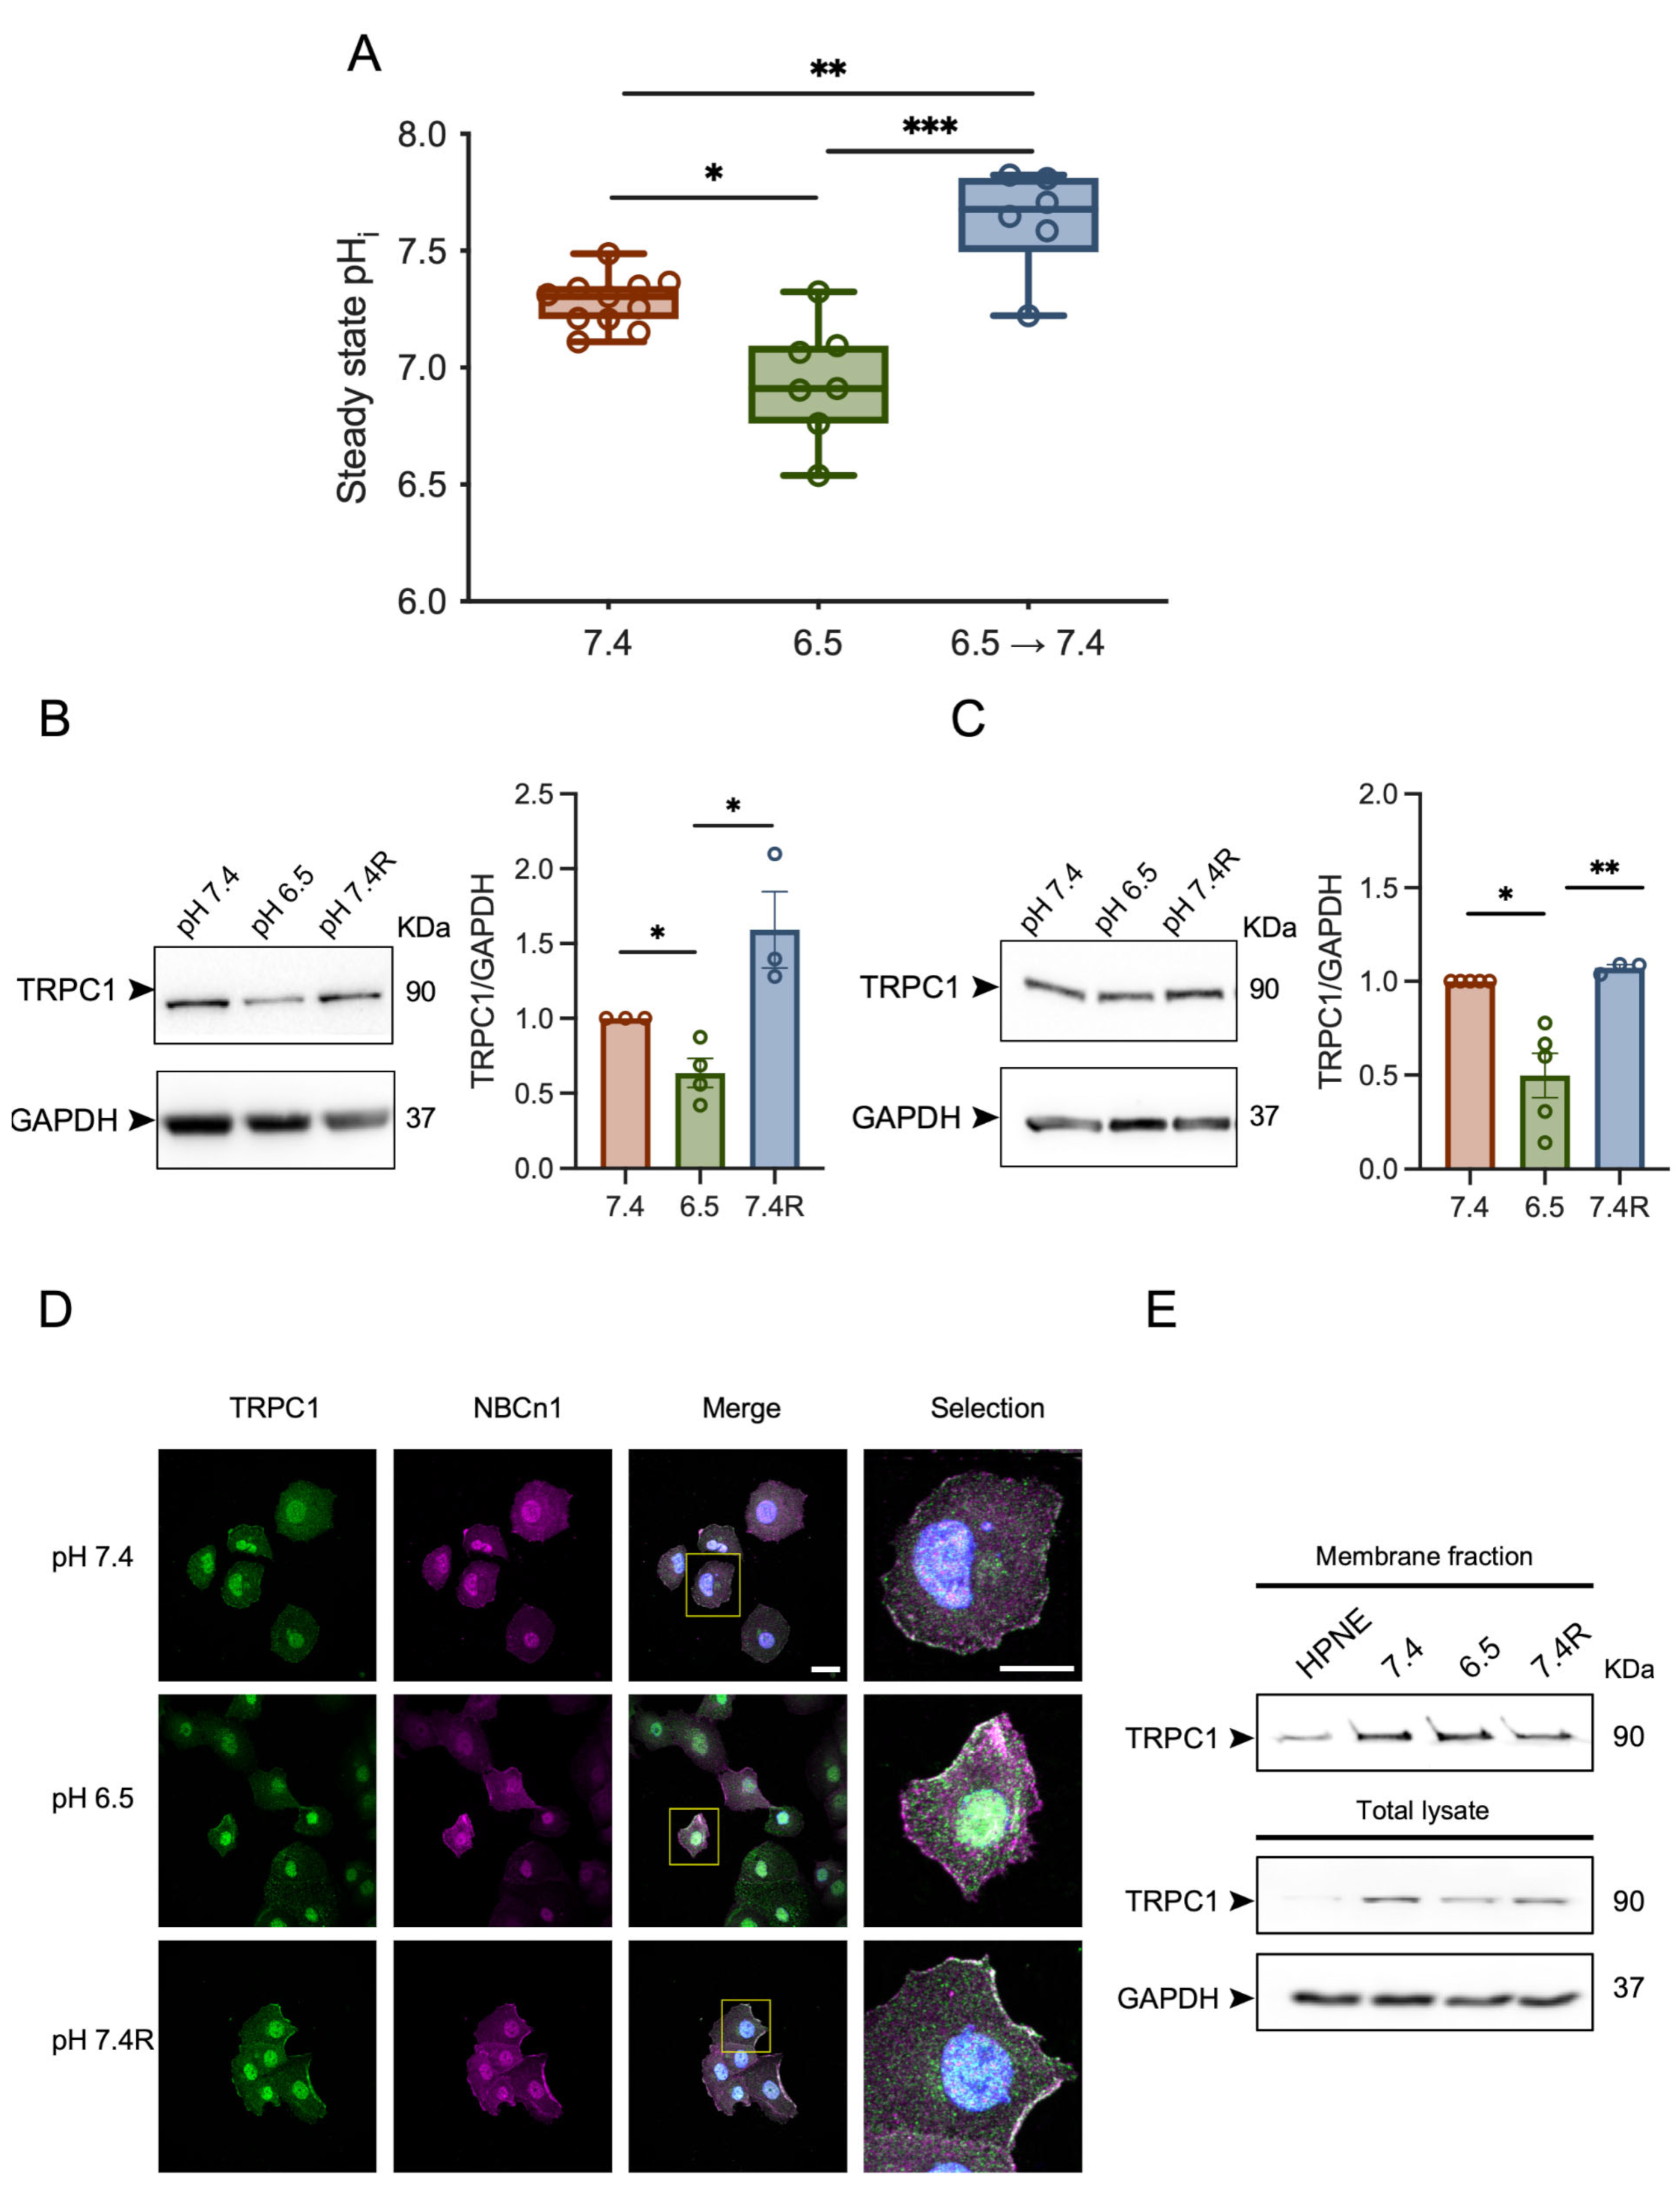
Abstract
:Simple Summary
Abstract
1. Introduction
2. Materials and Methods
2.1. Cell Culture and Experimental pH Setup
2.2. Live Imaging of Intracellular pH
2.3. Transient Transfections
2.4. 3D Spheroid Growth and CellTiter-Glo Assay
2.5. Western Blot Analysis
2.6. Cell Surface Biotinylation Assay
2.7. Co-Immunoprecipitation
2.8. Immunofluorescence Assay and Analysis
2.9. Boyden Chamber Assay
2.10. Trypan Blue Assay
2.11. Flow Cytometry
2.12. Proximity Ligation Assay
2.13. Manganese Quench Assay
2.14. Statistical Analysis
3. Results
3.1. Acid Adaptation Promotes Membrane Localization of TRPC1 in PANC-1 Cells
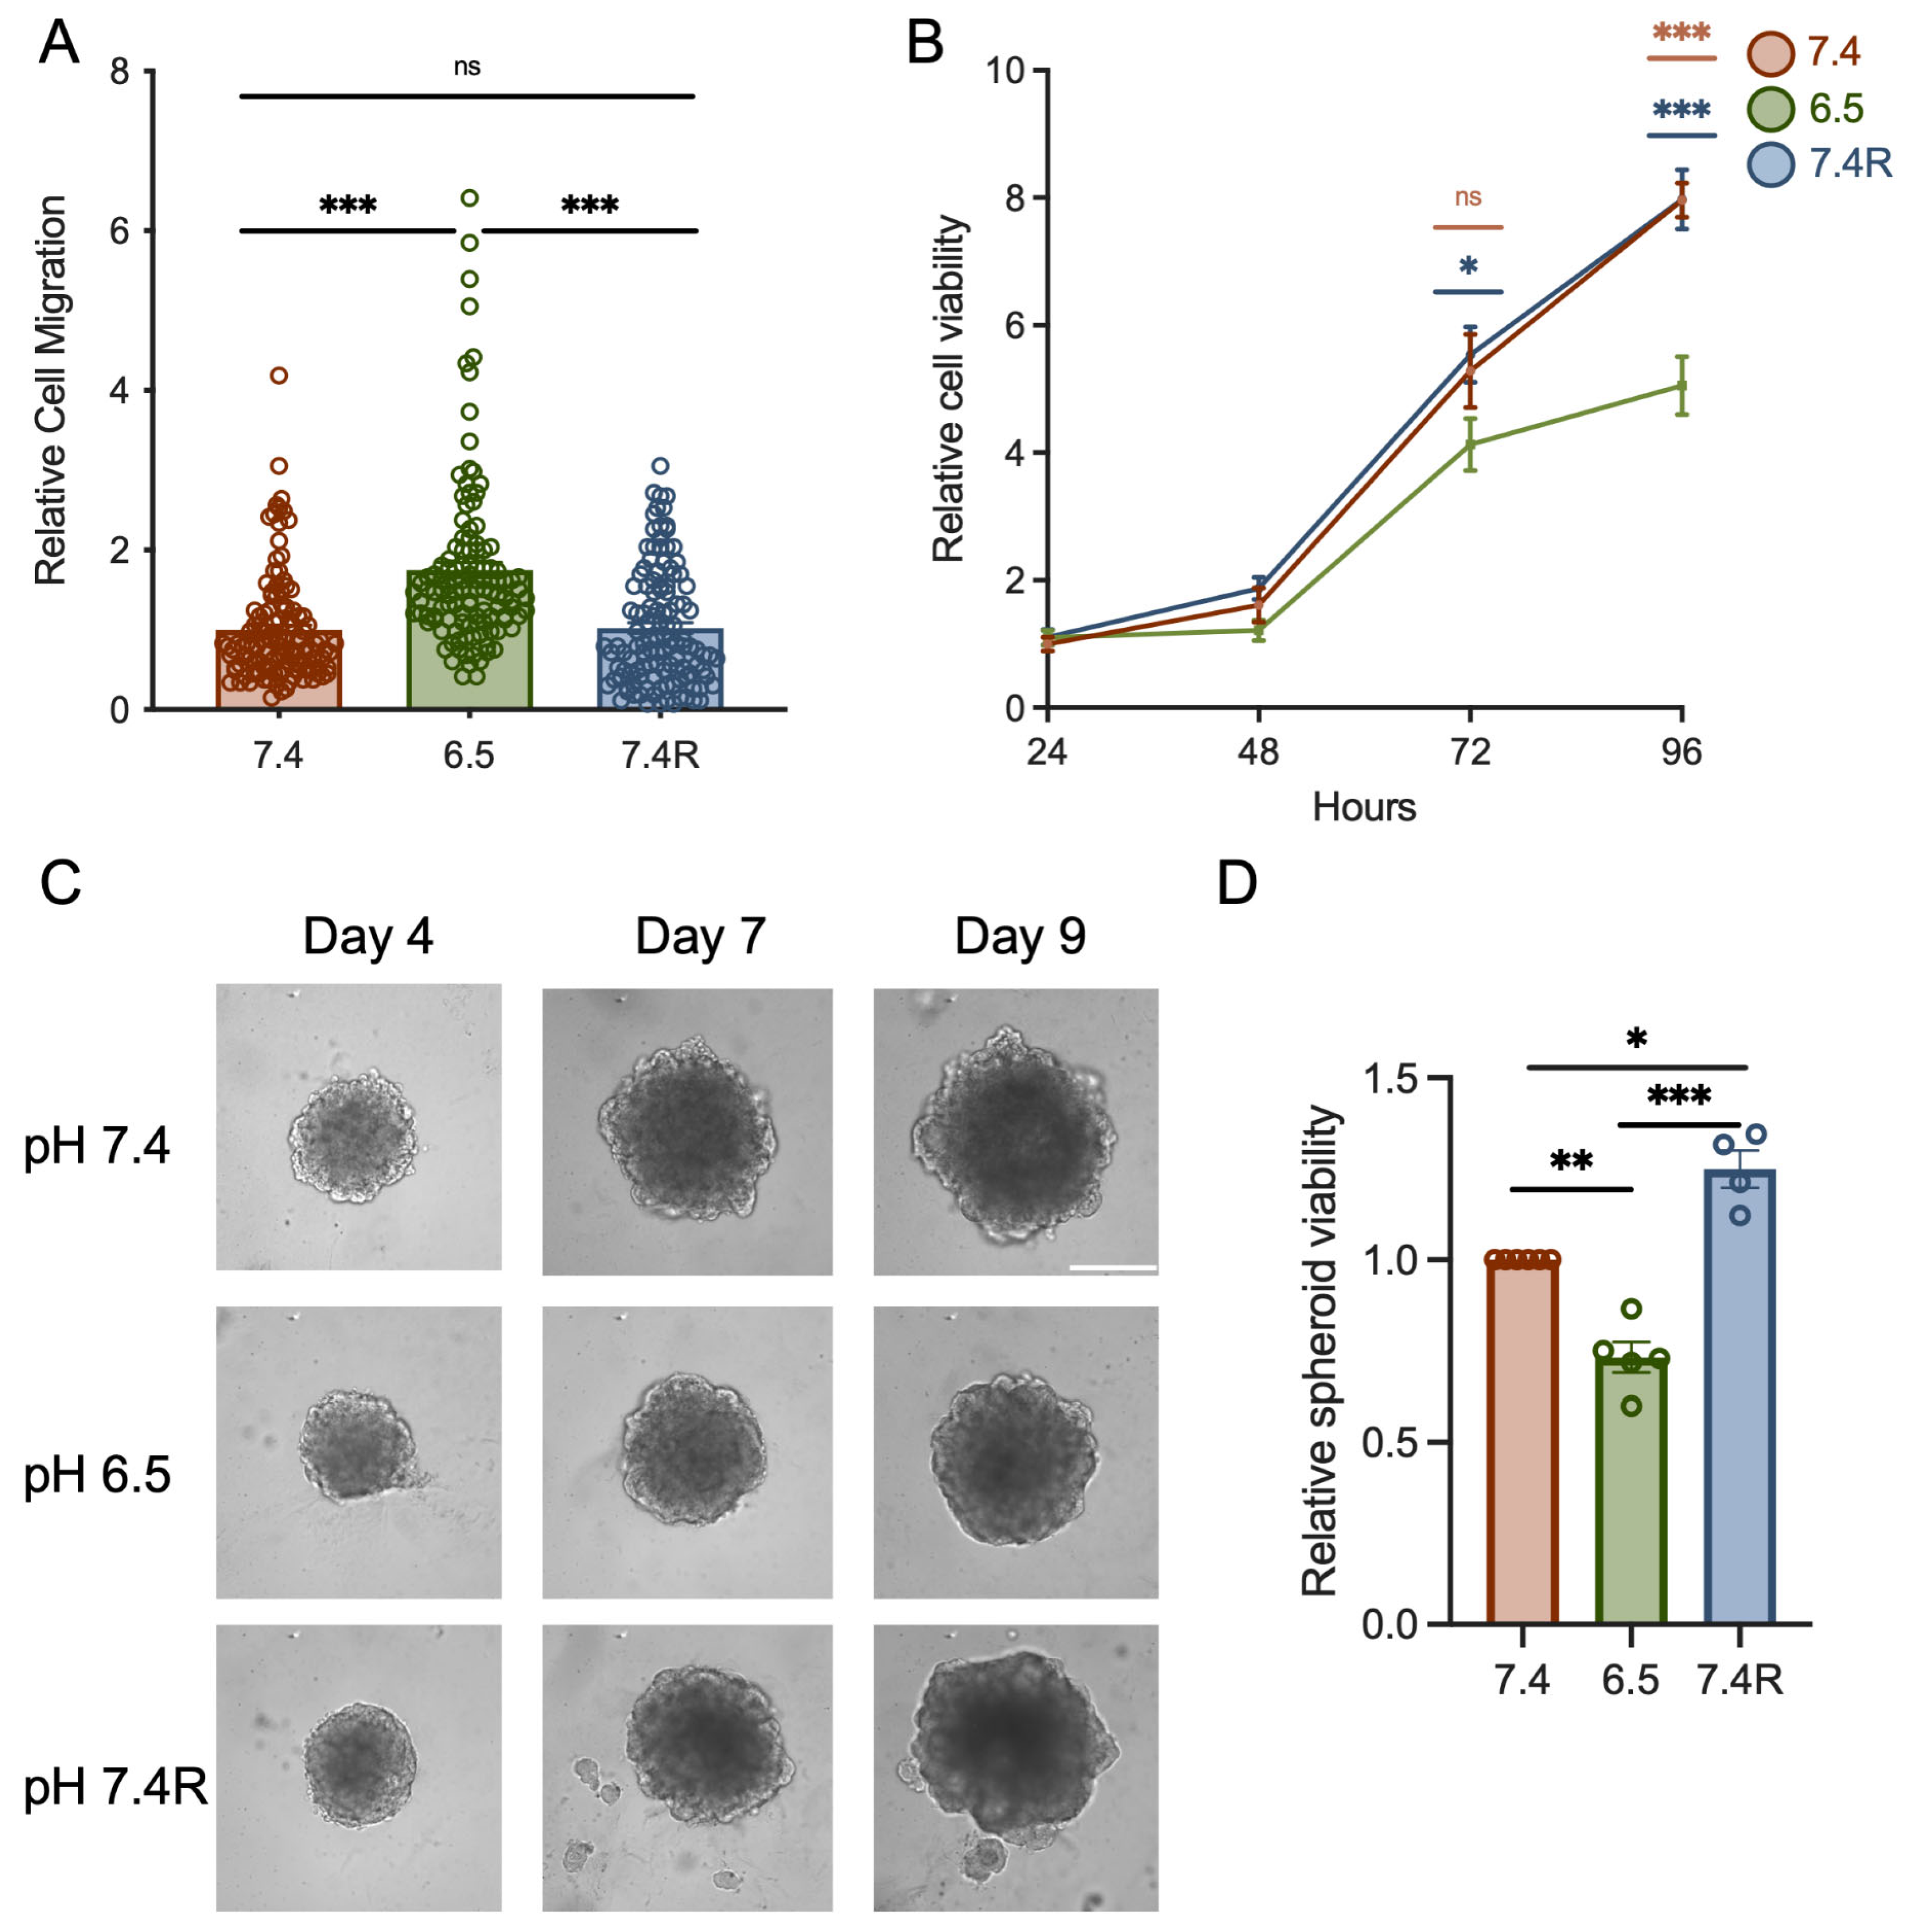
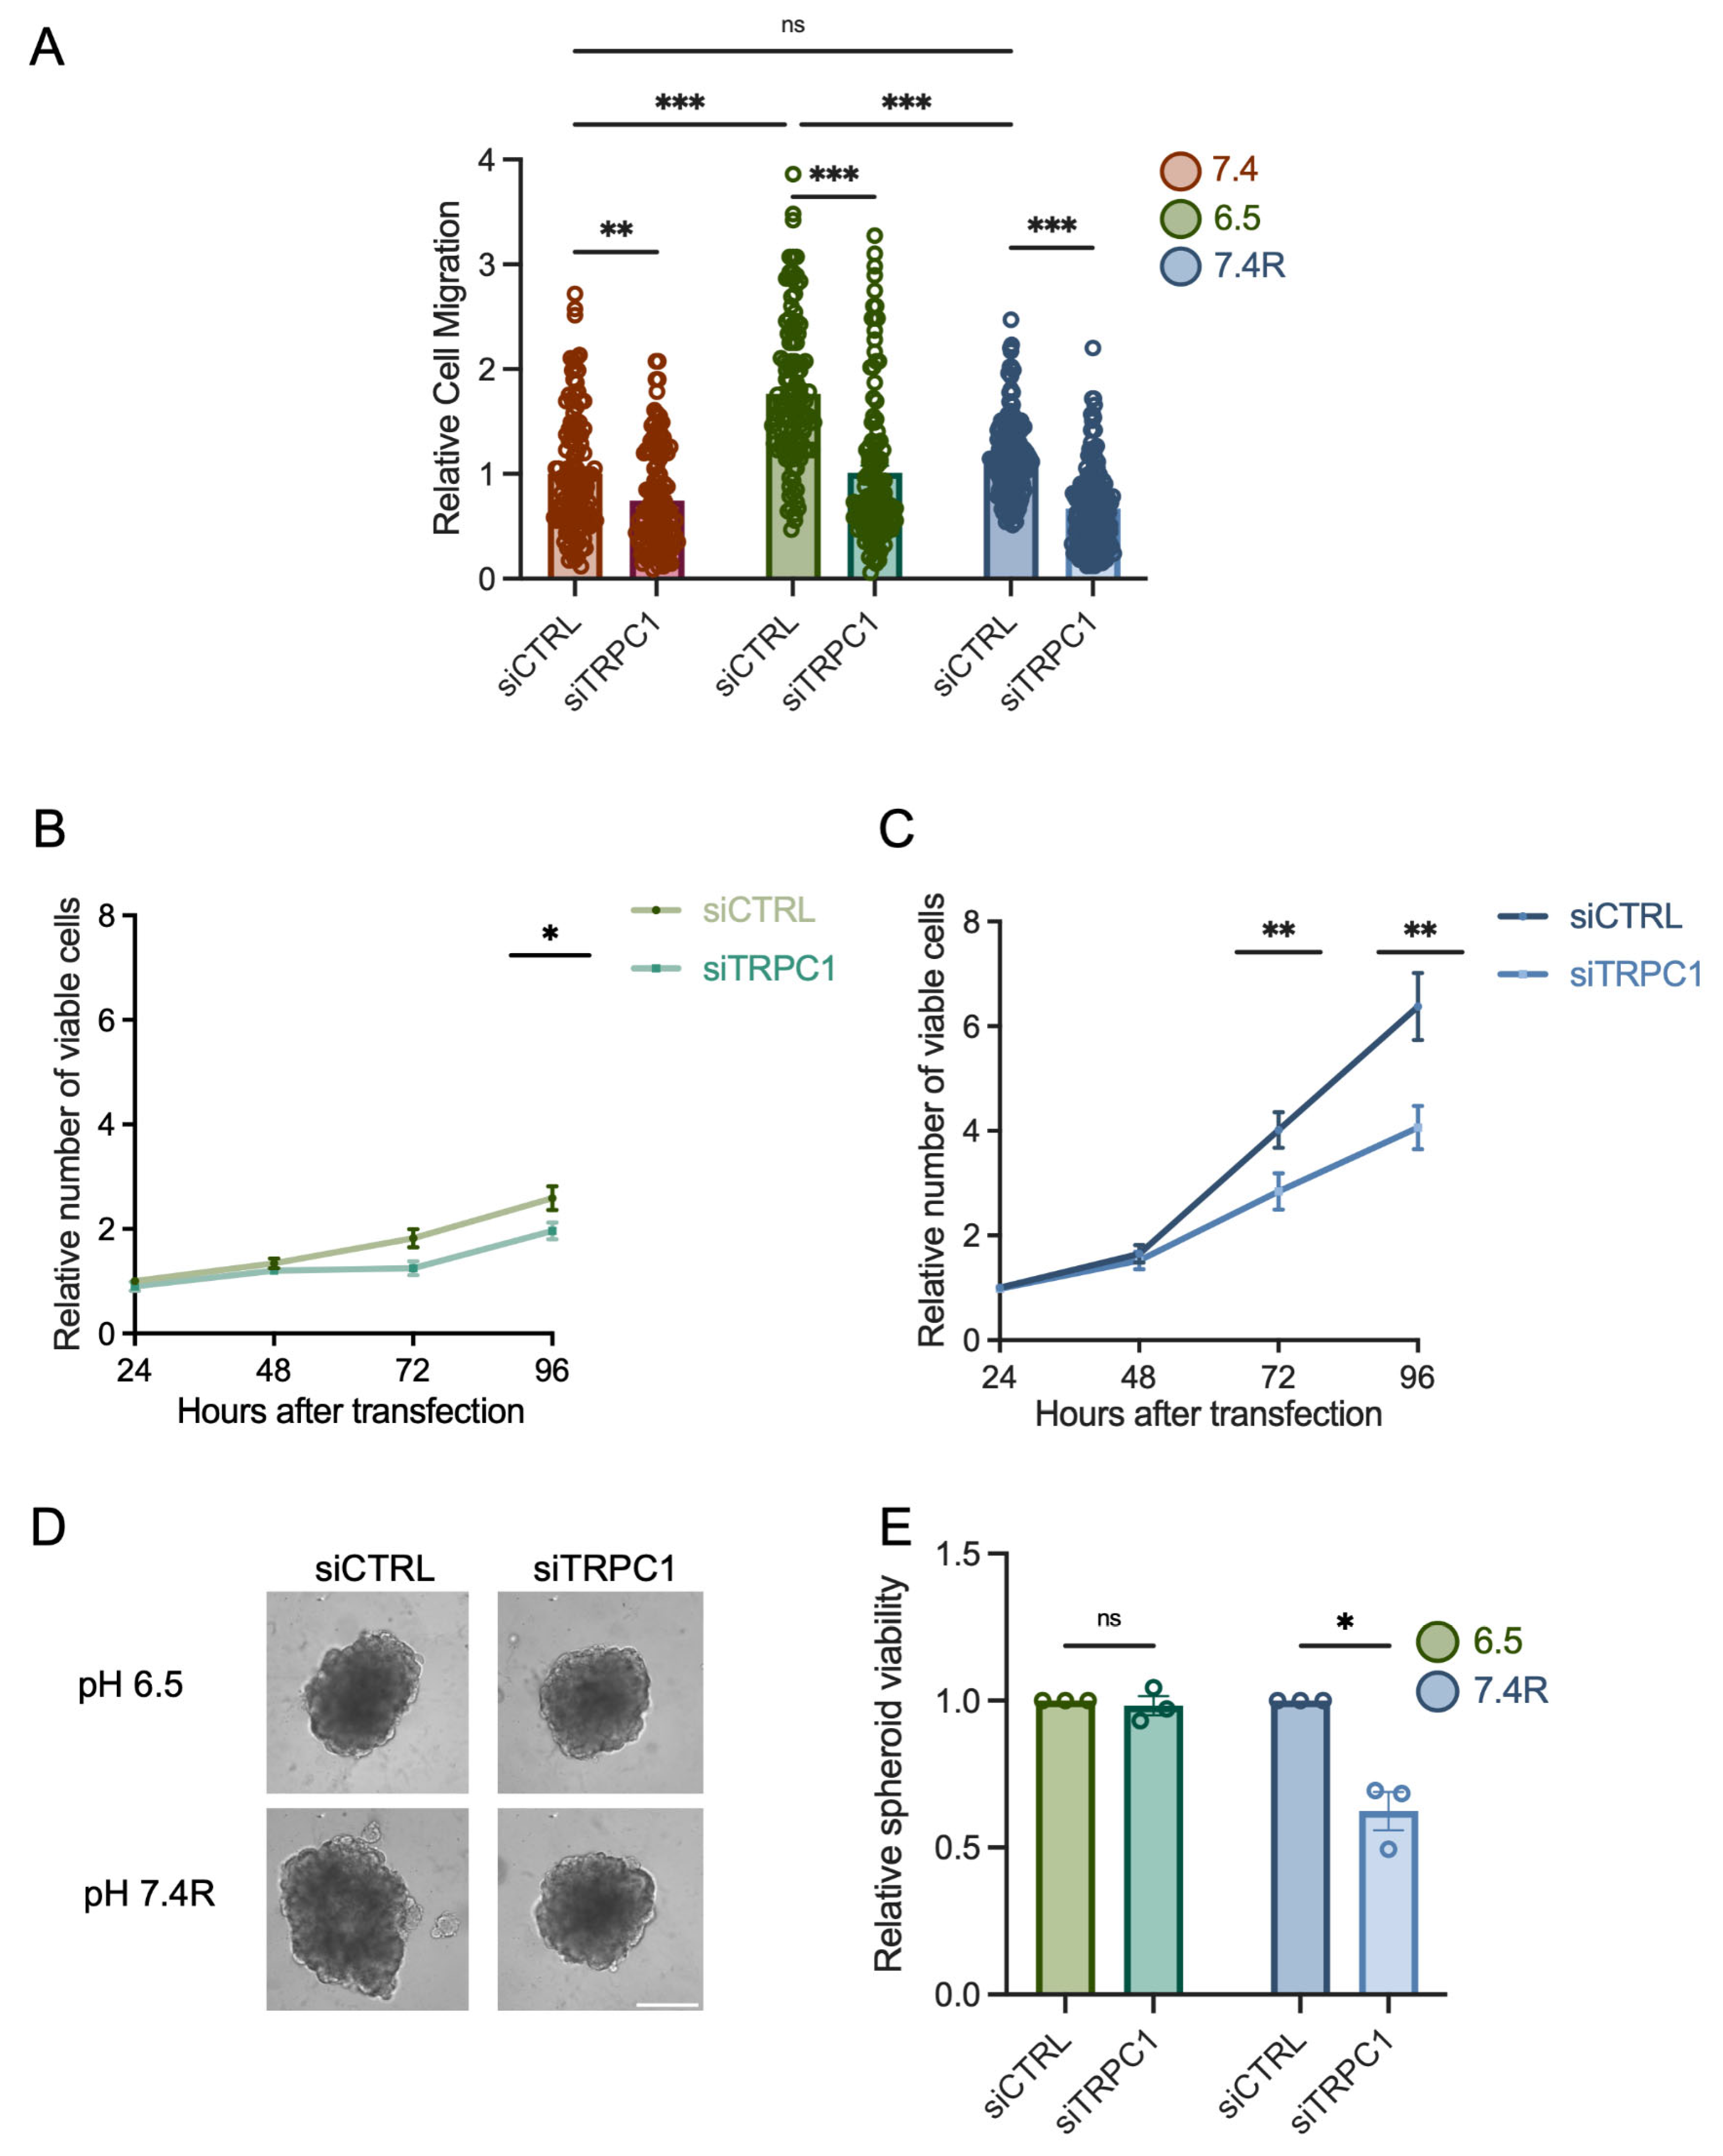
3.2. The Knockdown of TRPC1 Inhibits Cell Migration and the Growth of PANC-1 Cells and Spheroids under Acid Recovery Conditions
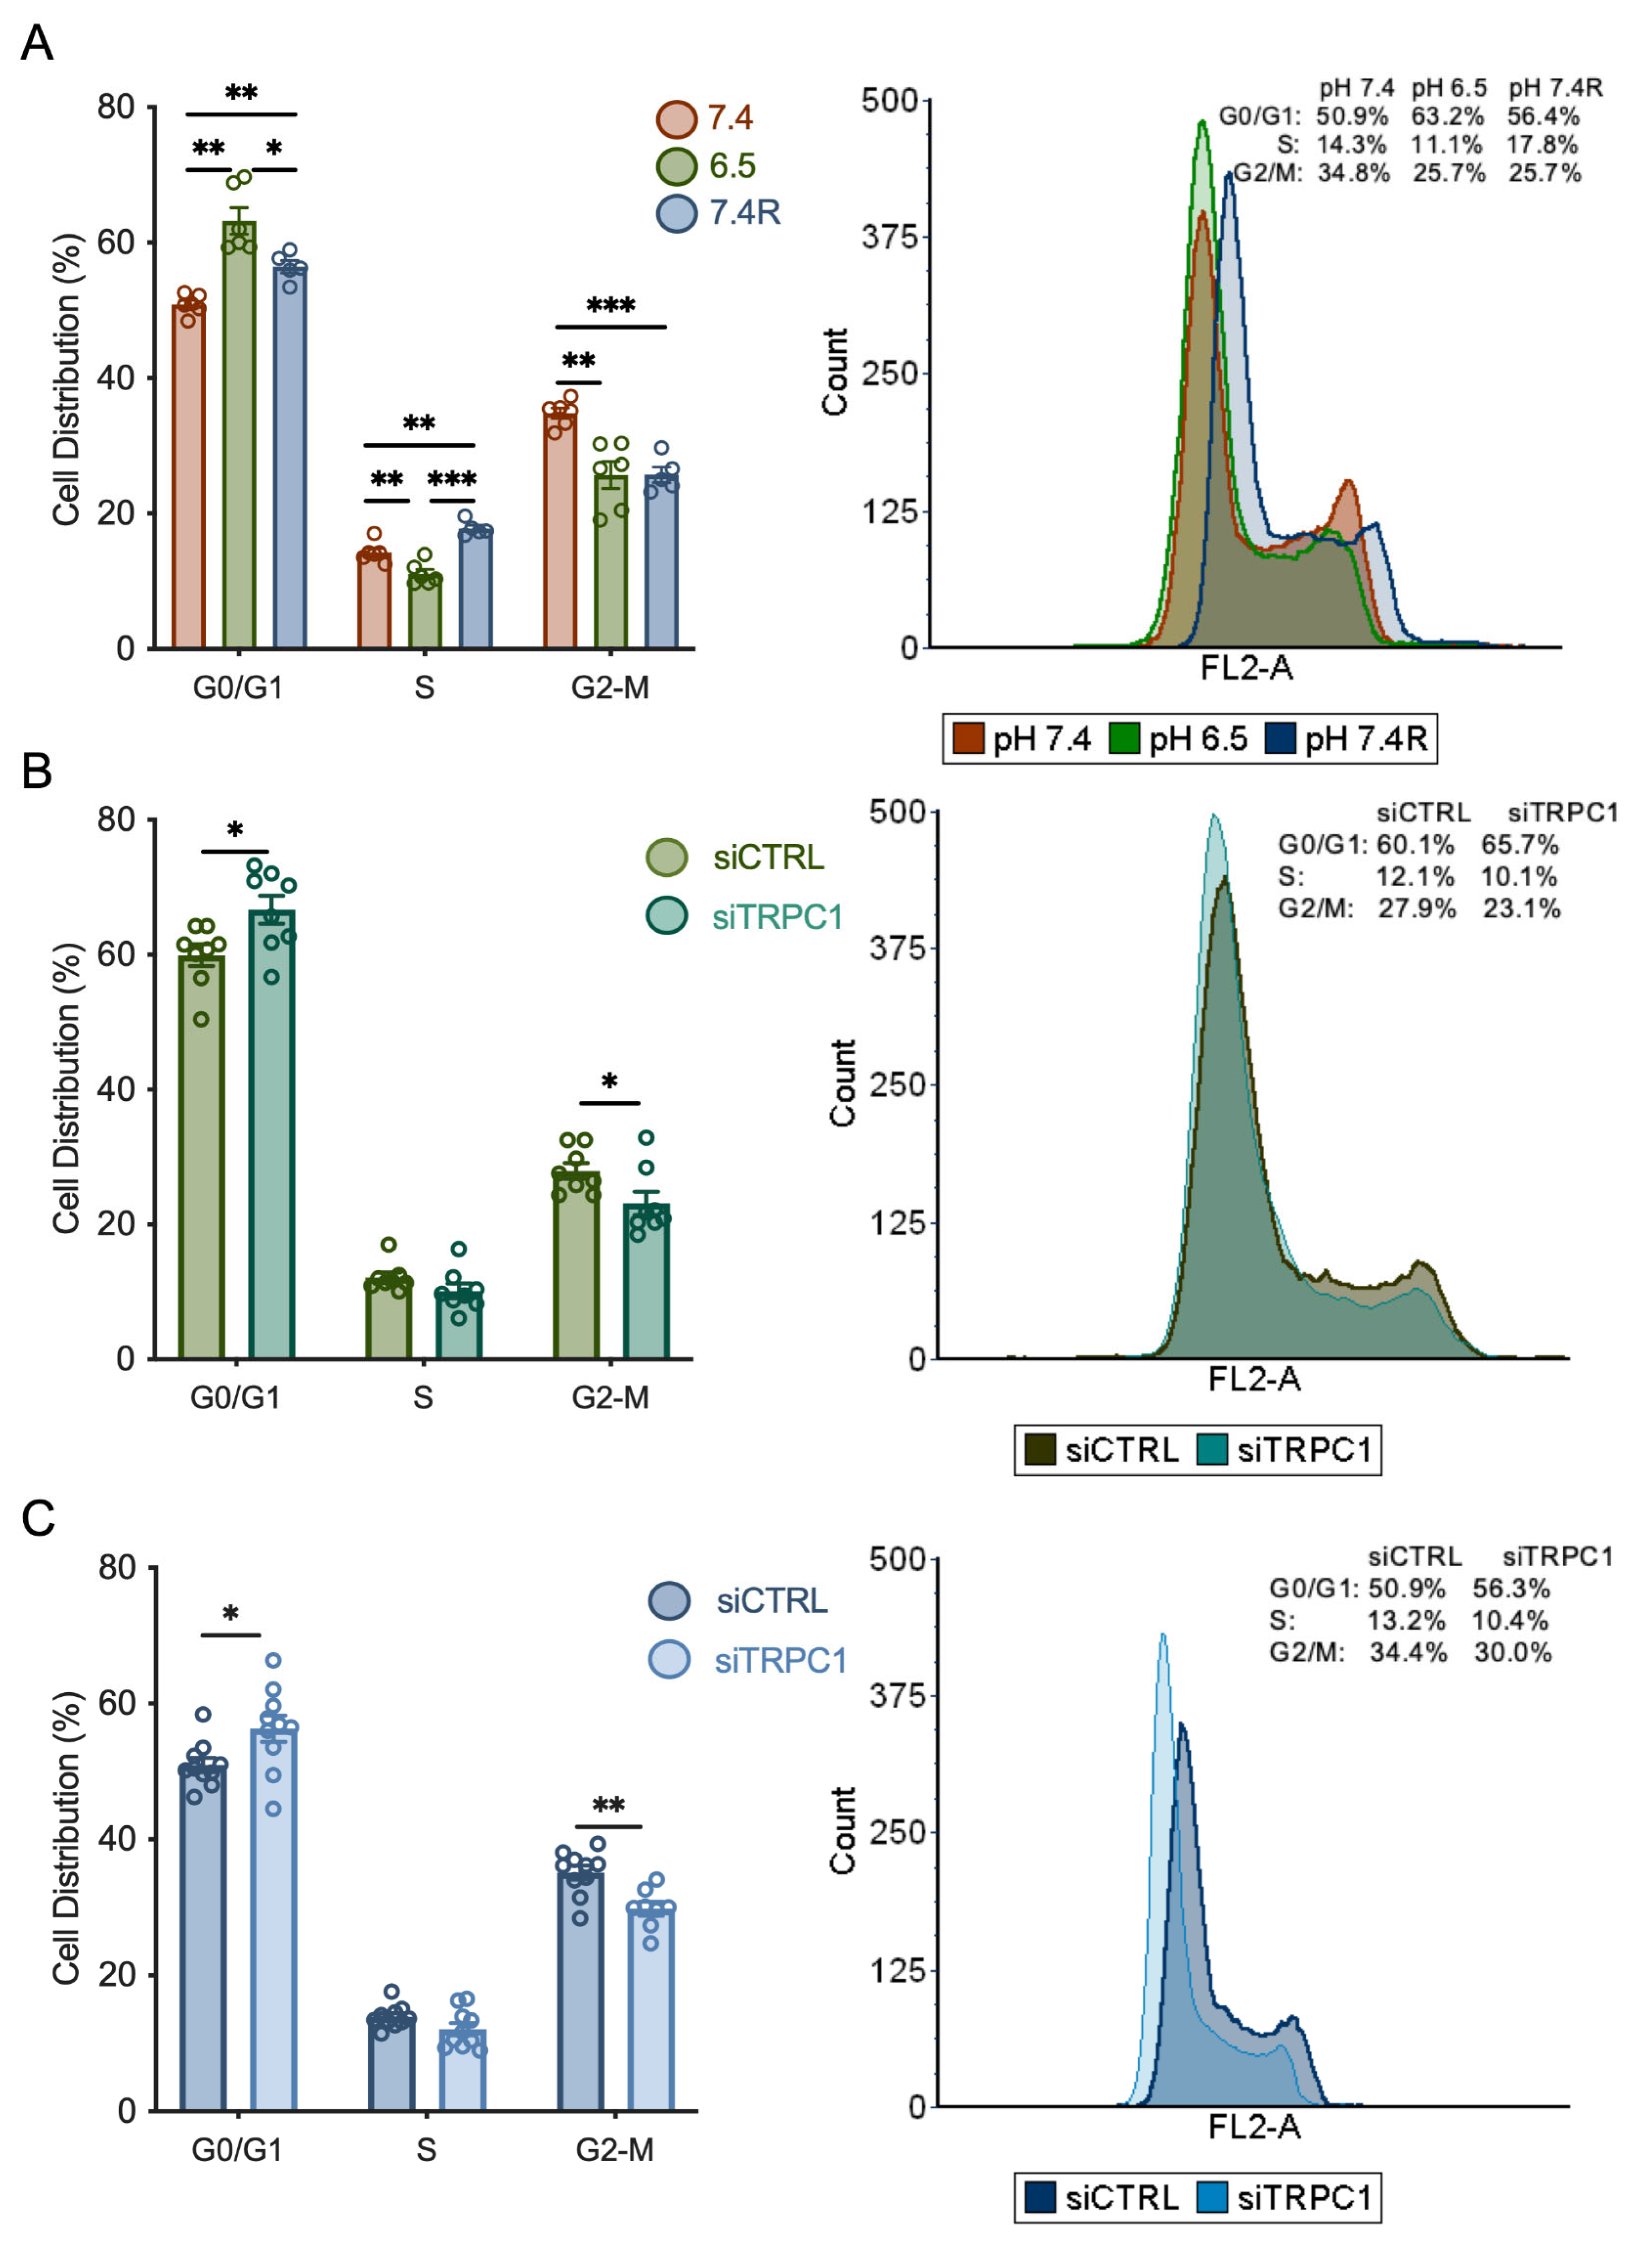
3.3. Knockdown of TRPC1 Accumulates Cells in the G0/G1 Phase and Decreases the Number of Cells in the G2/M Phase
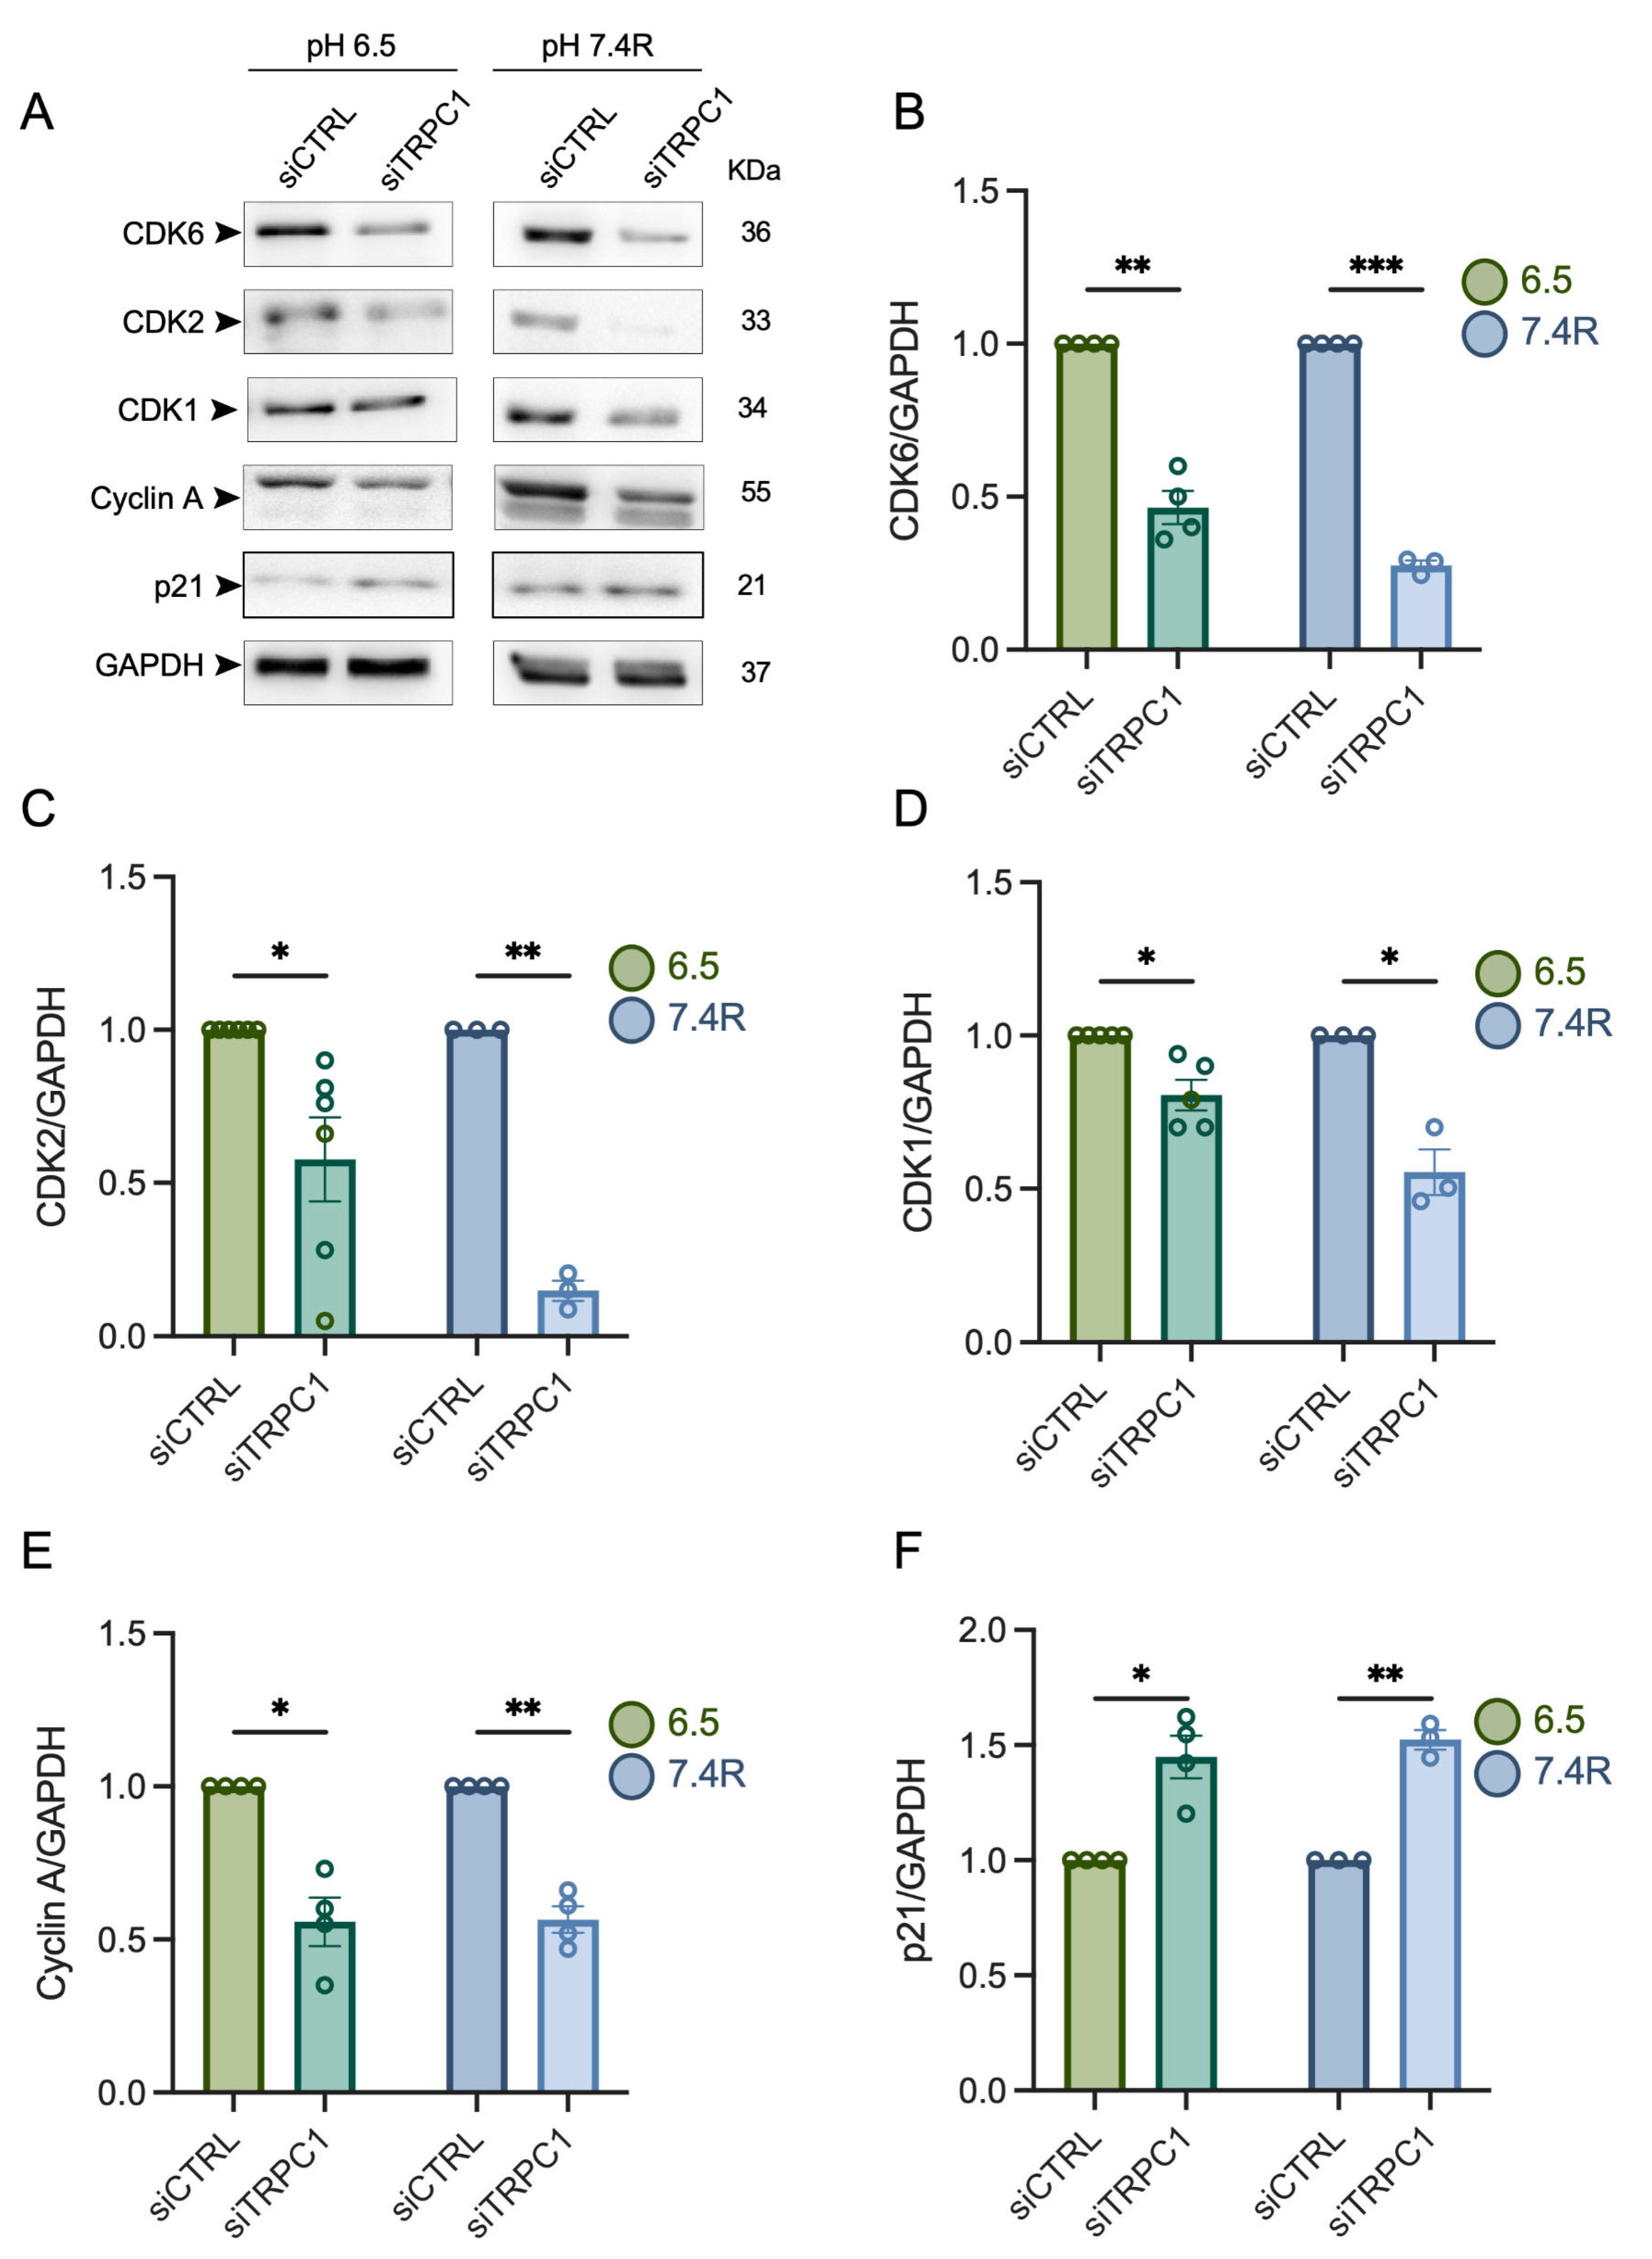
3.4. TRPC1 Strongly Modulates the Expression of CDKs and Cyclin A in Acid Adaptation and Recovery Conditions
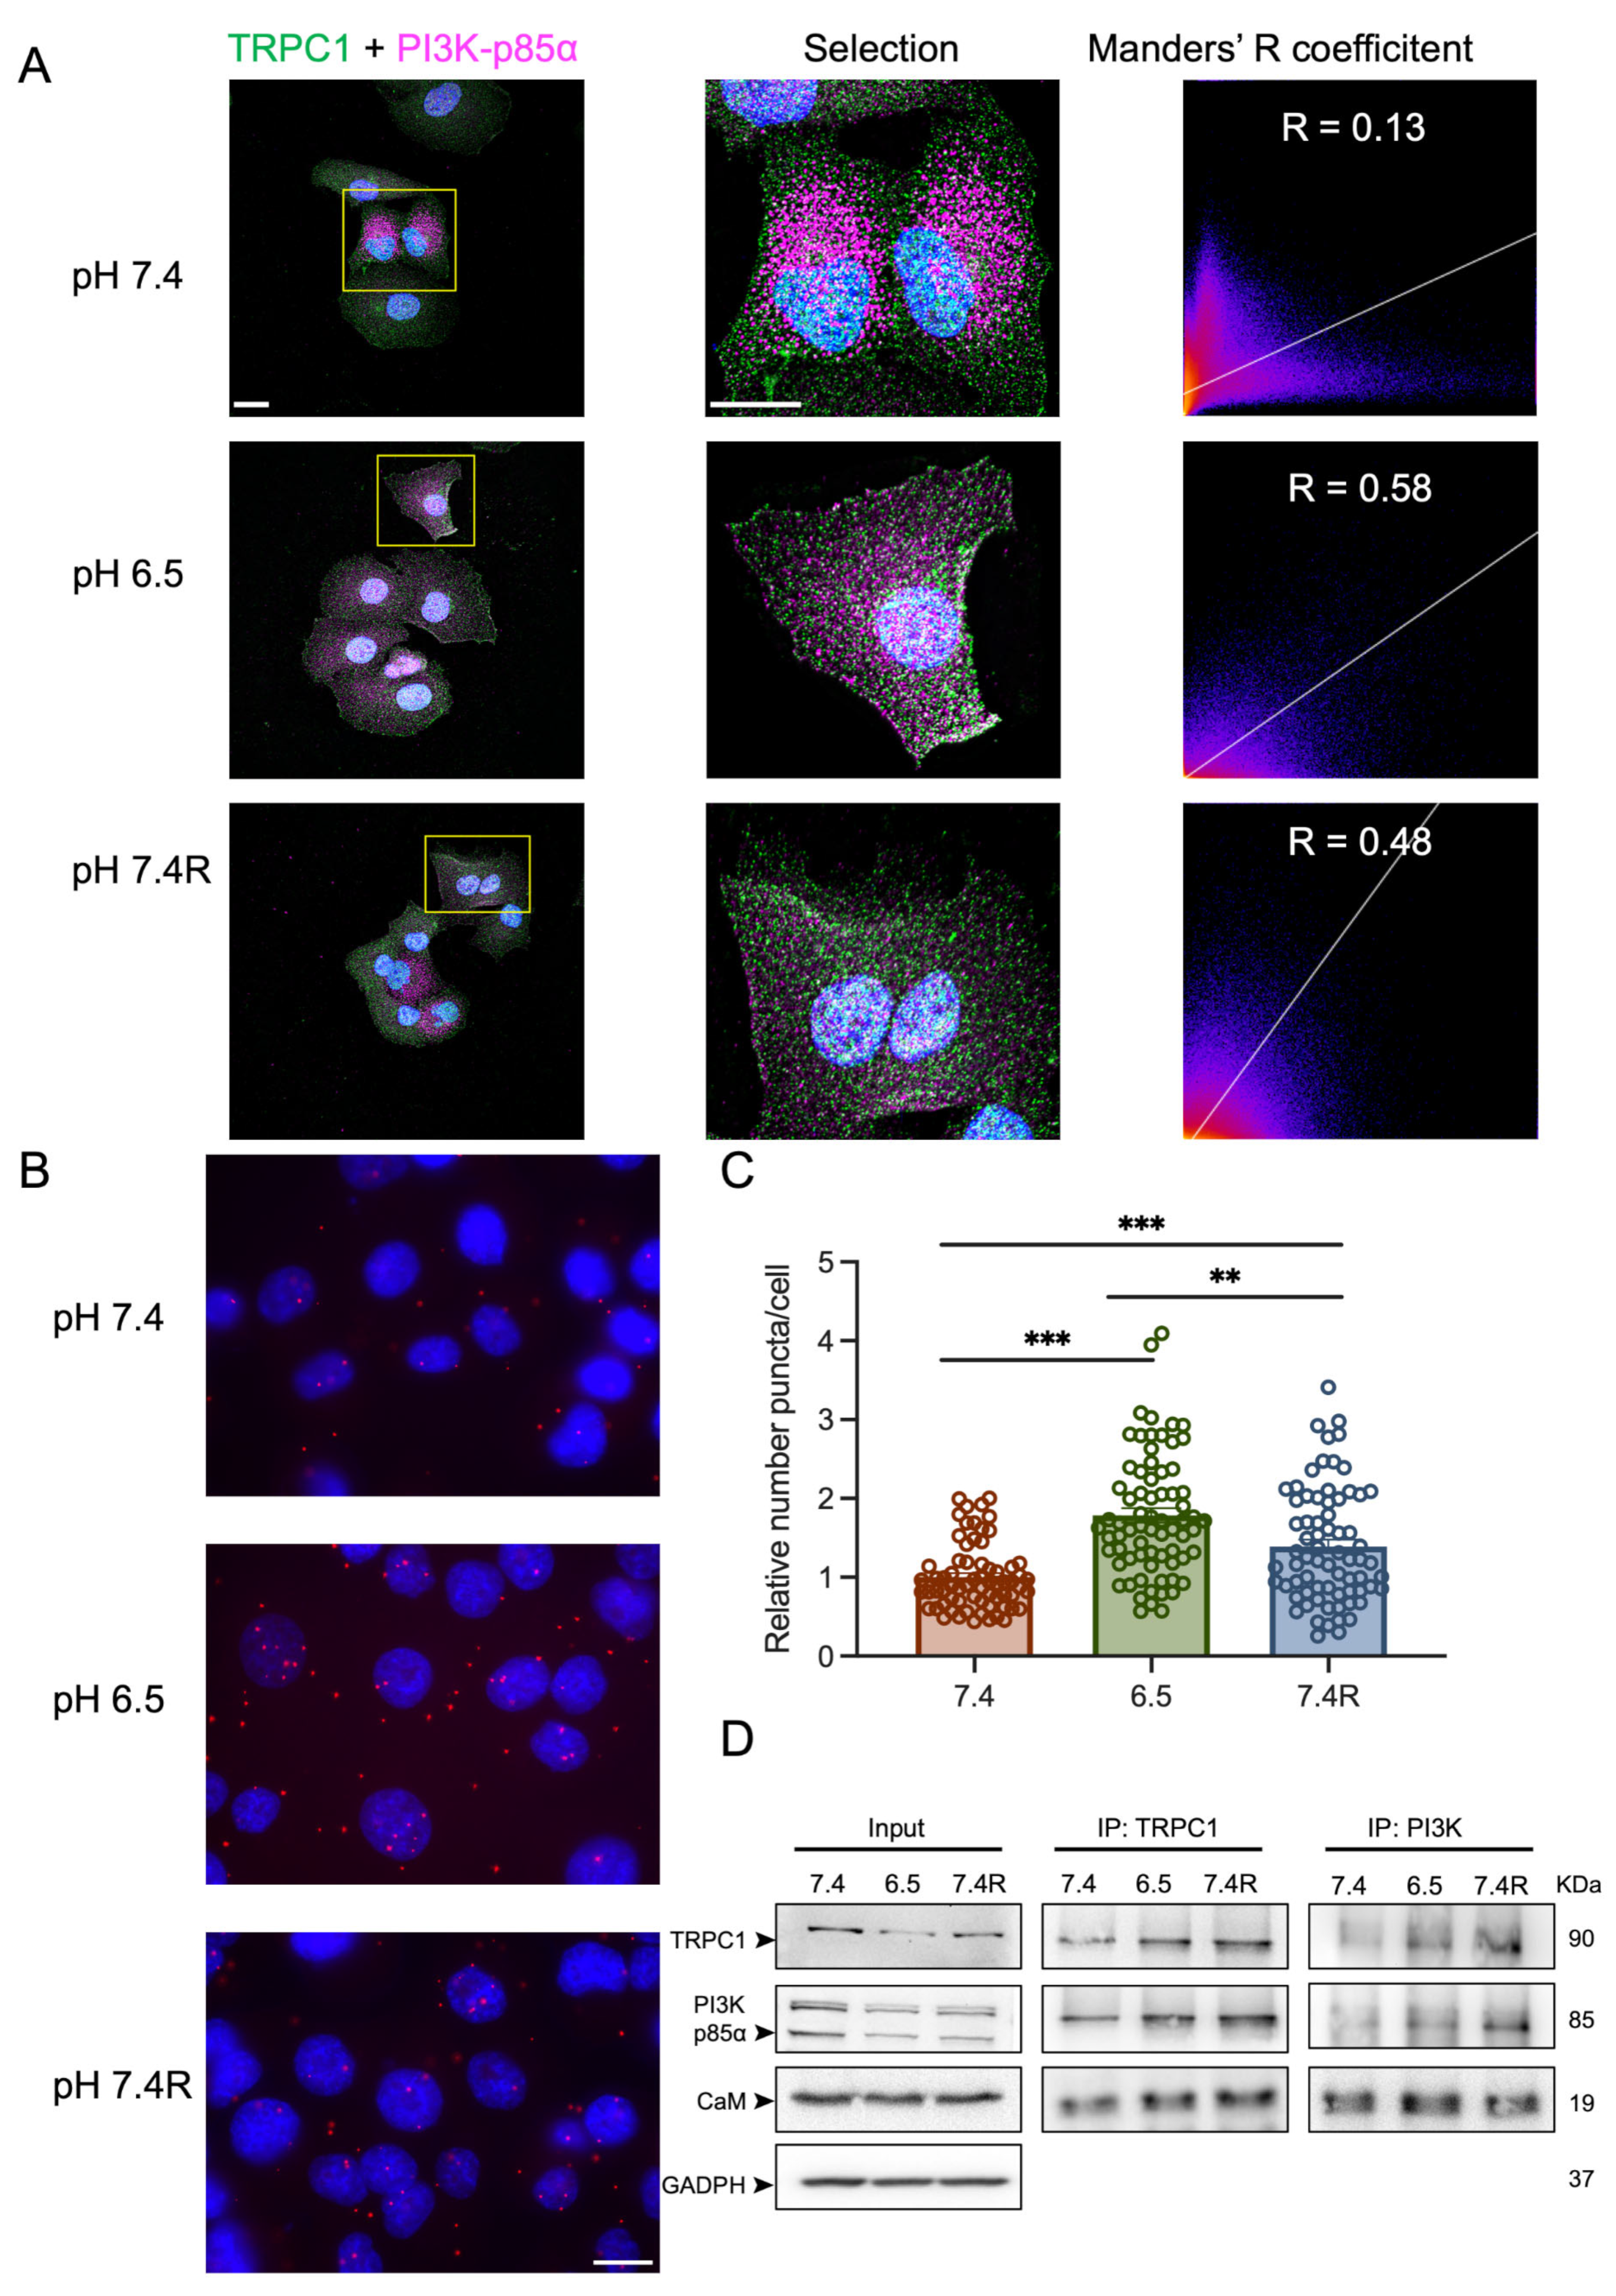
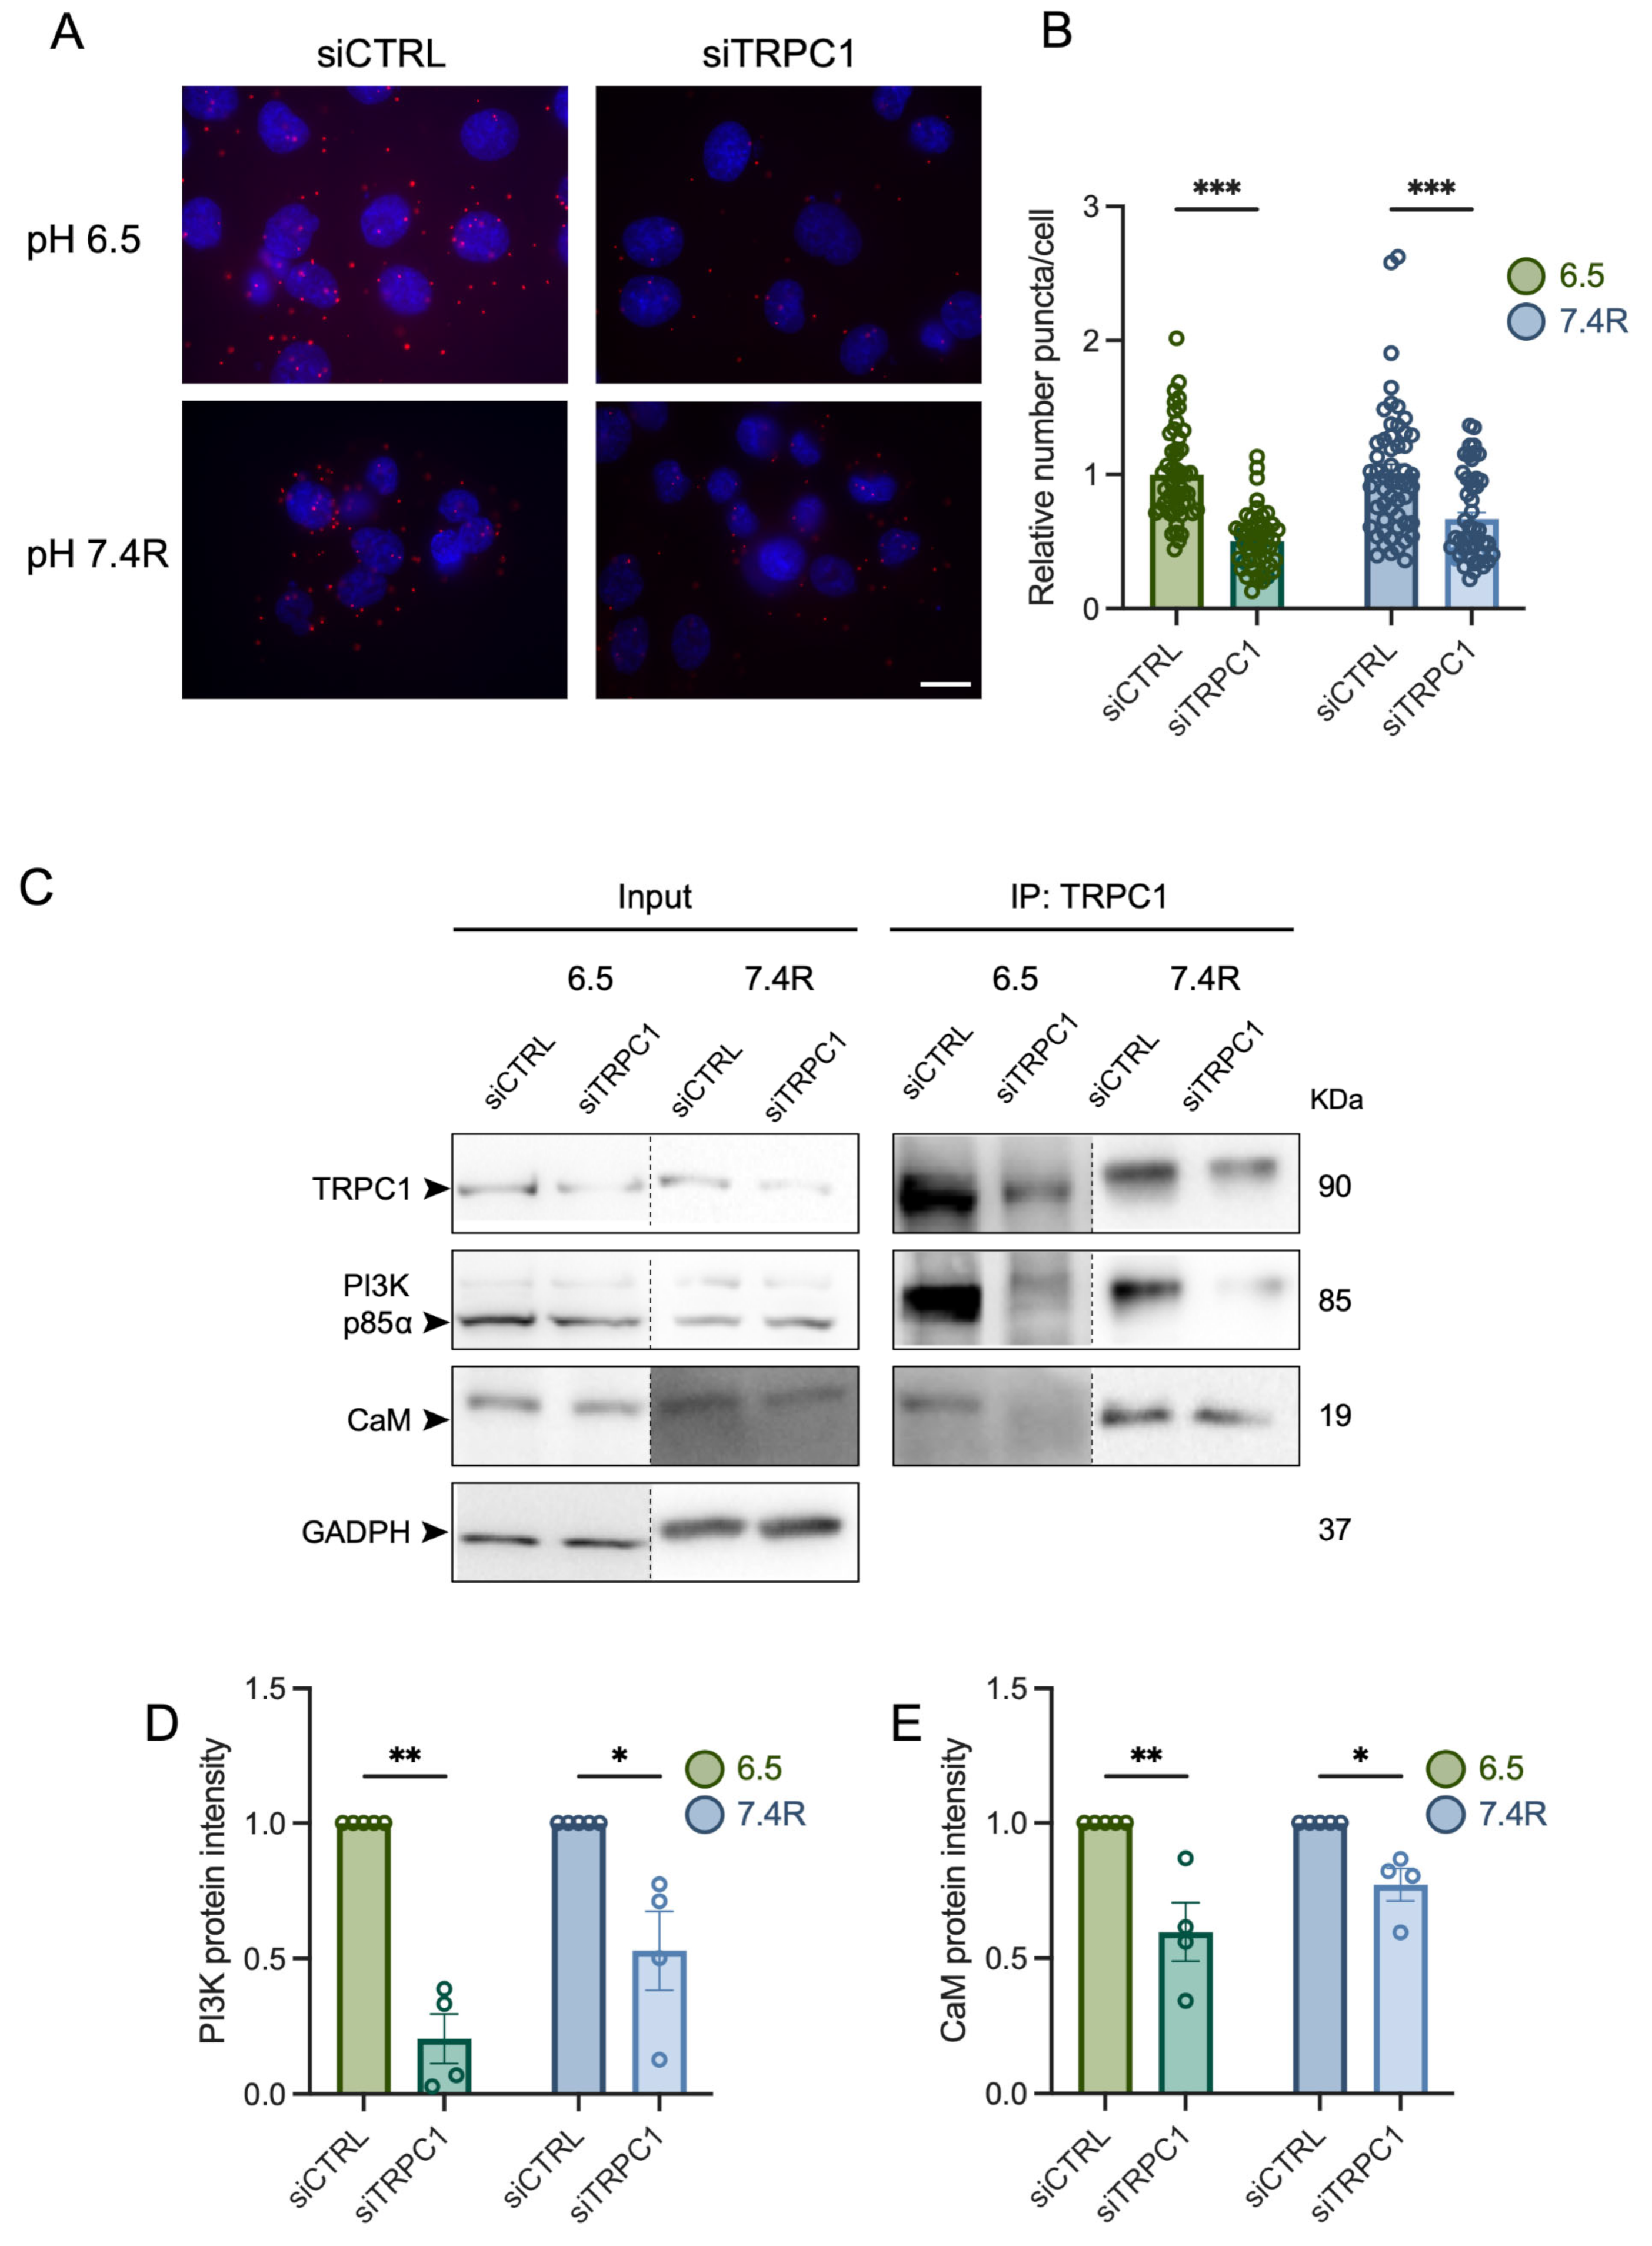
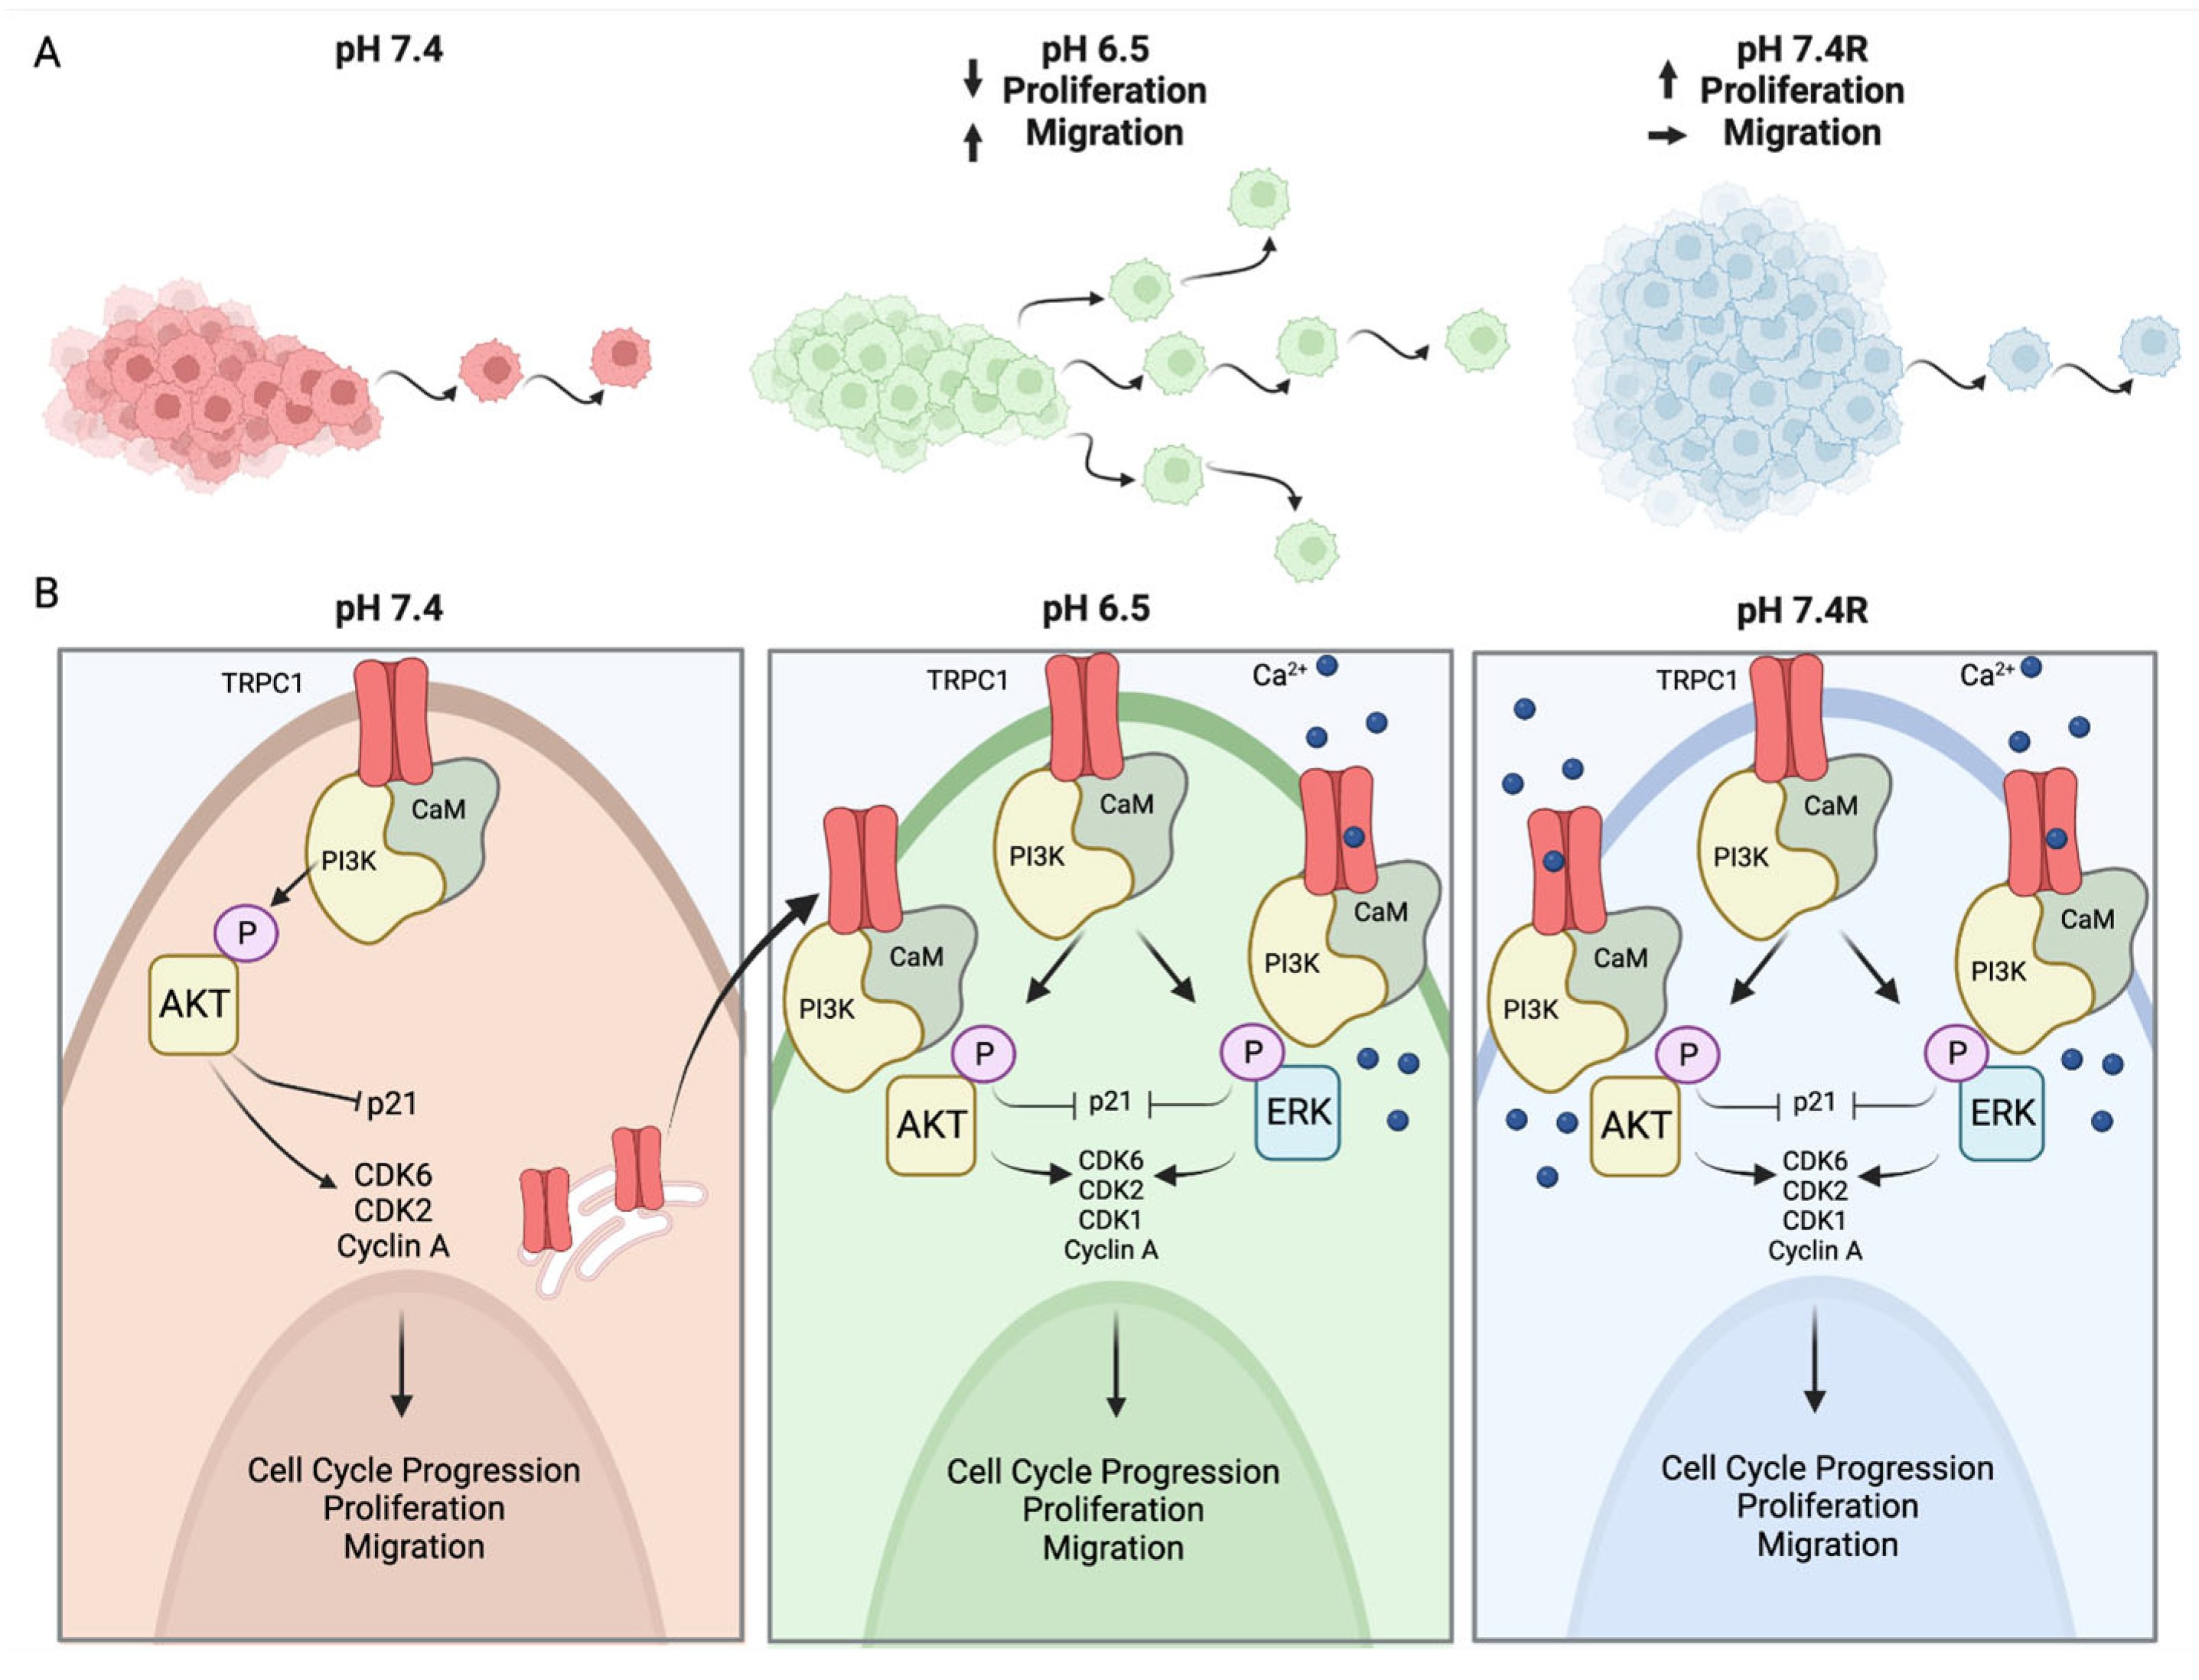
3.5. TRPC1 Interacts Strongly with the PI3K p85α Subunit and CaM under Acid Adaptation and Recovery Conditions
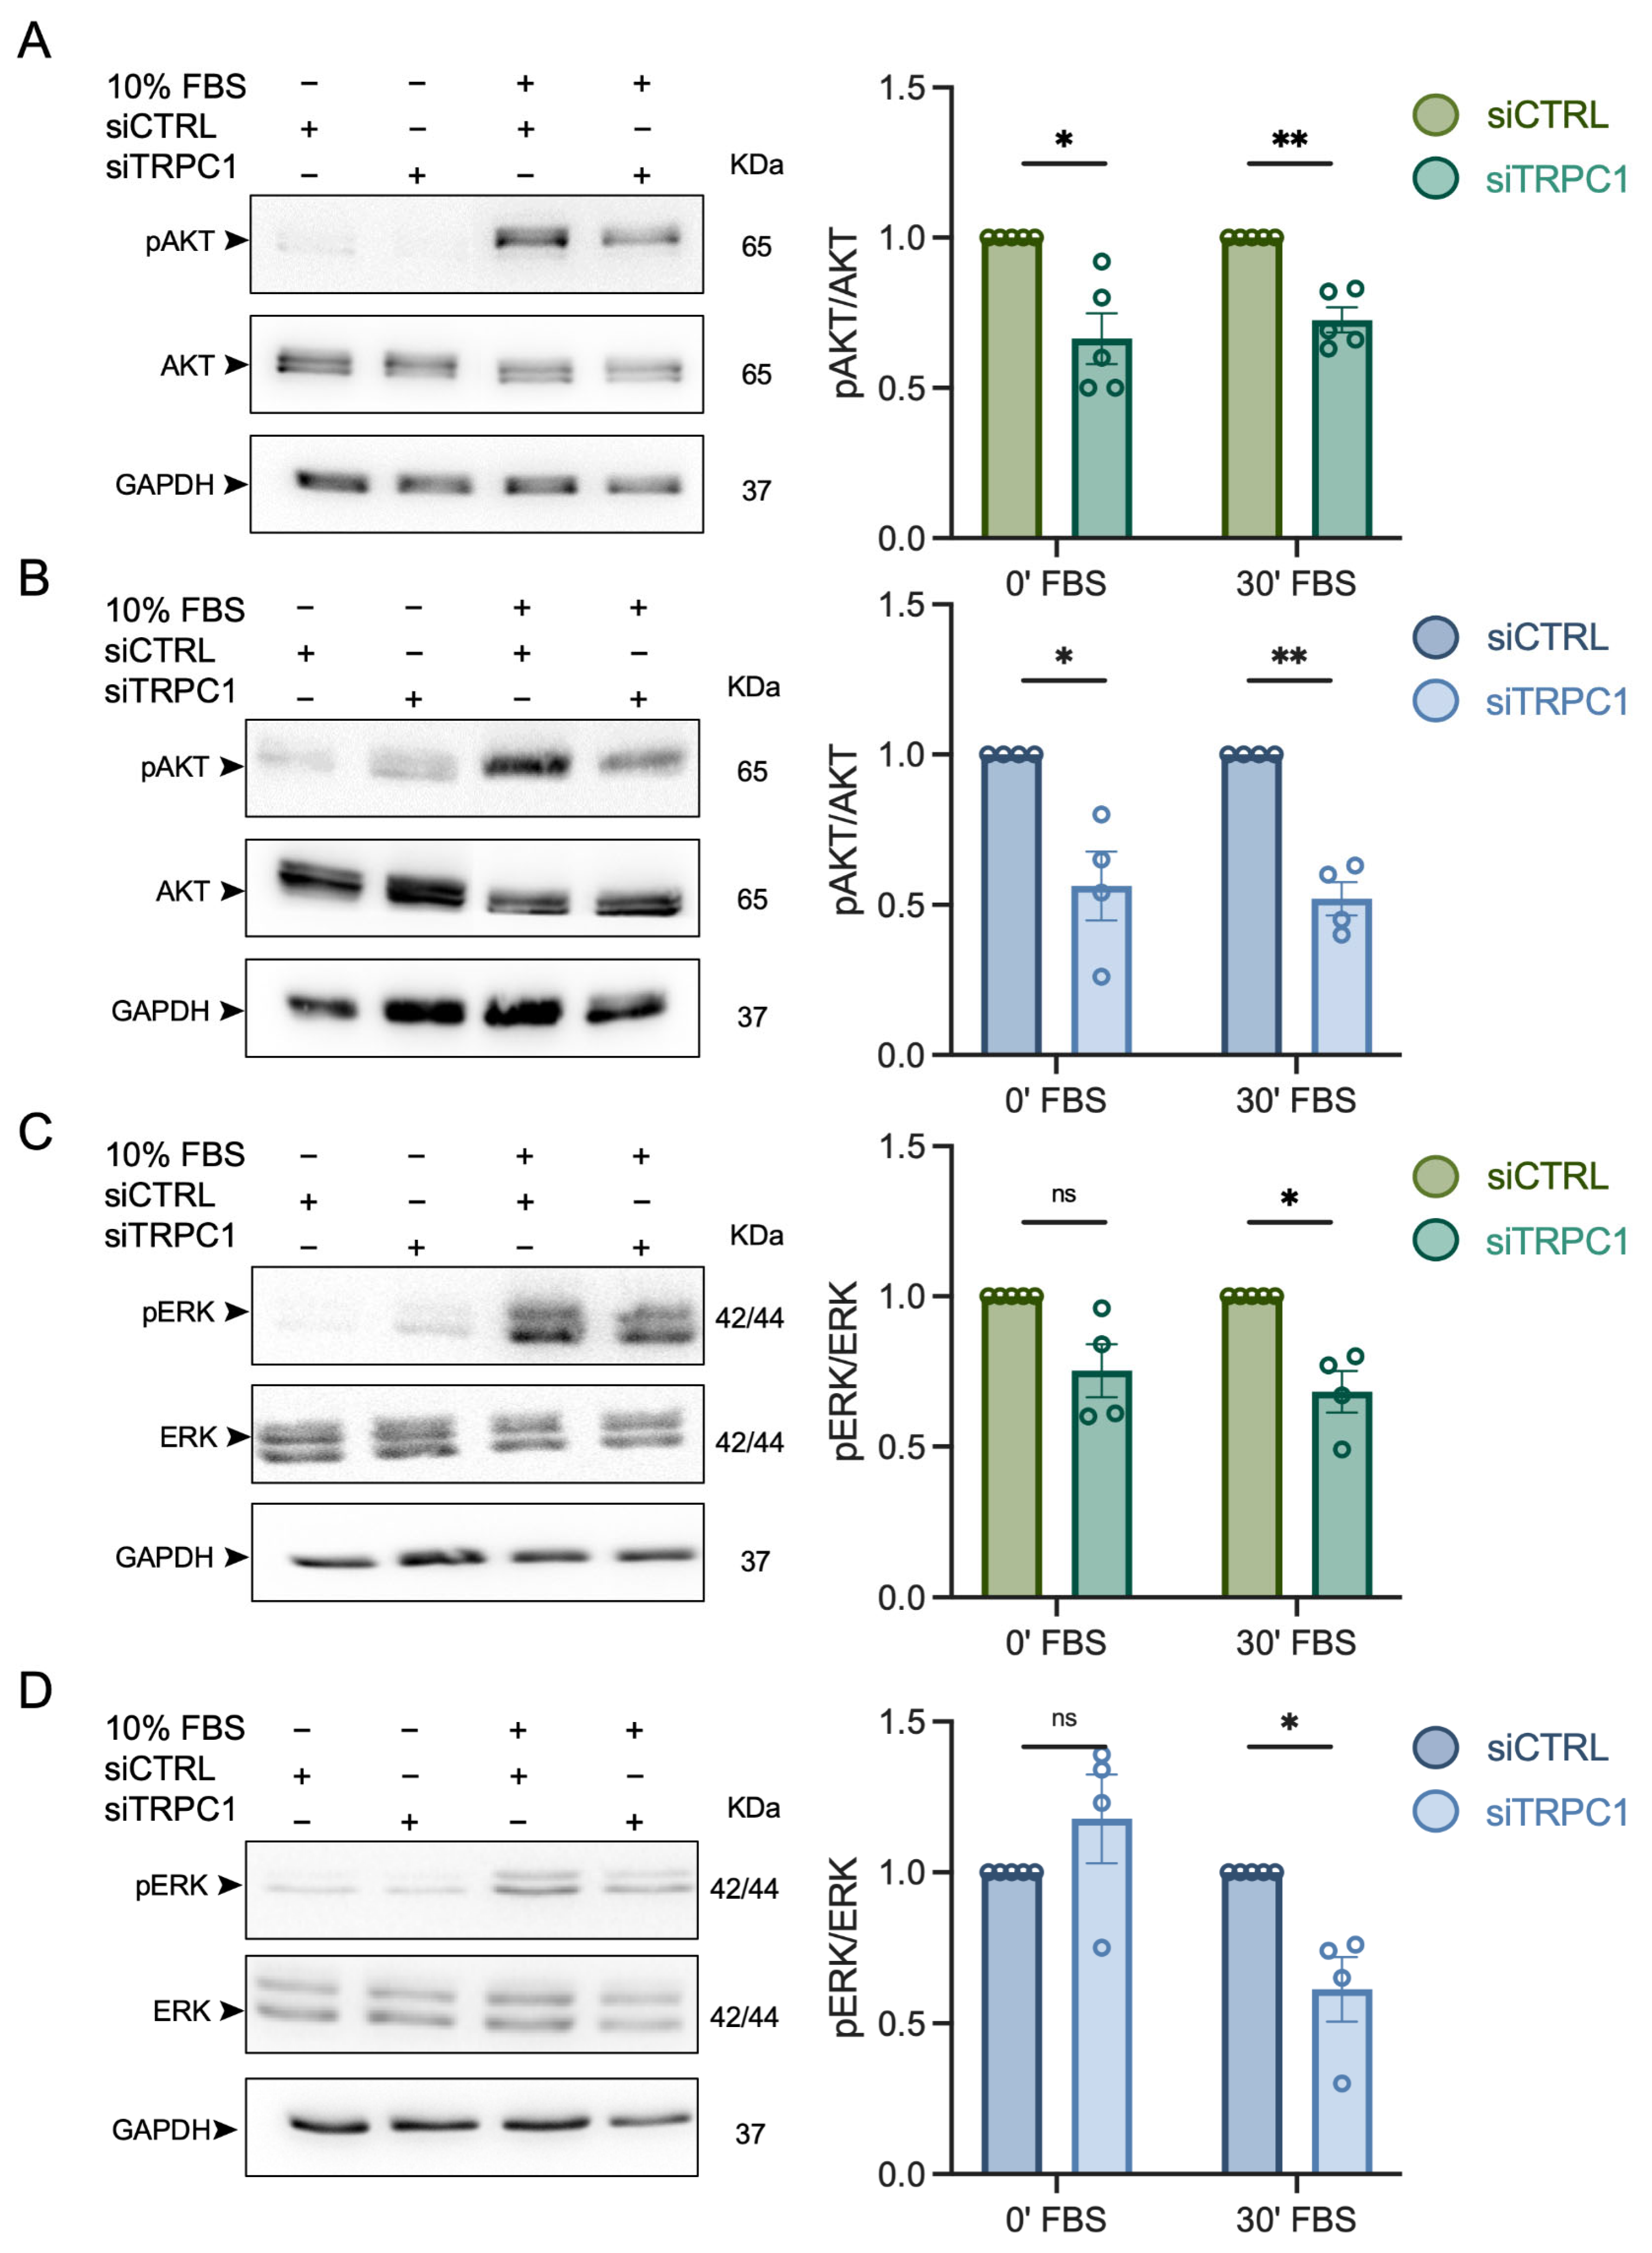
3.6. The Knockdown of TRPC1 Decreases the Phosphorylation of AKT and ERK1/2 in Acid-Recovered PANC-1 Cells
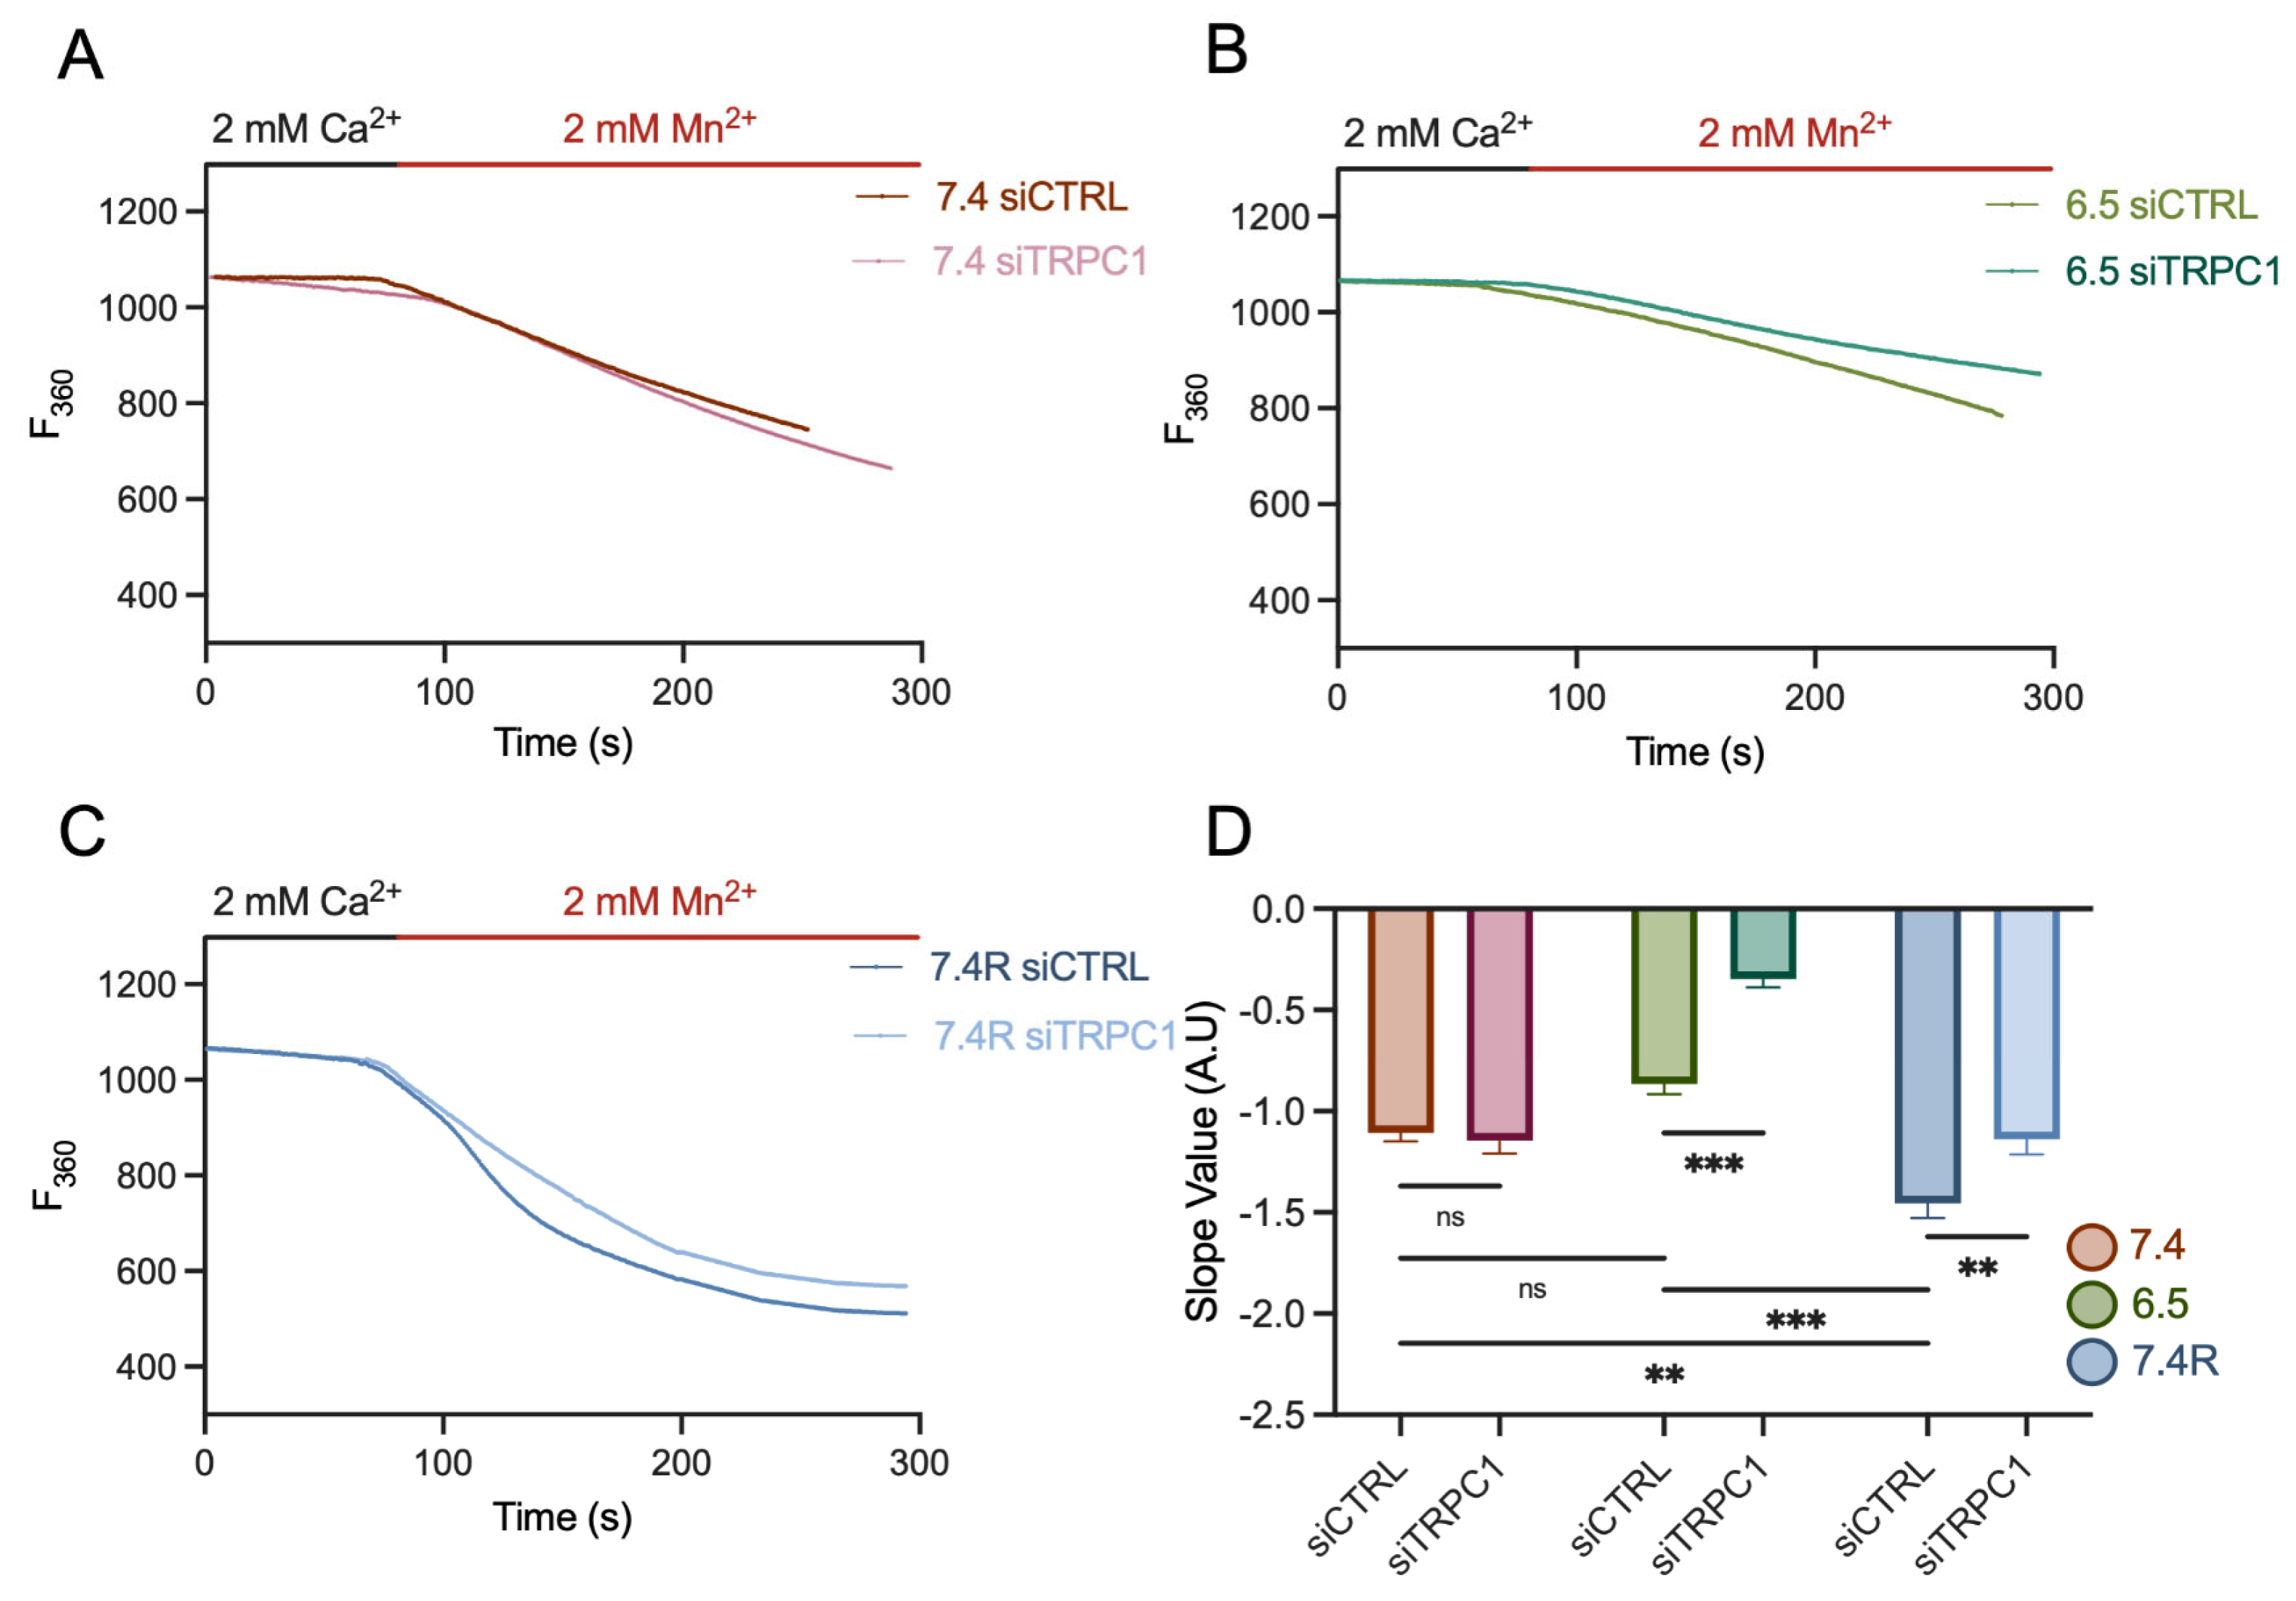
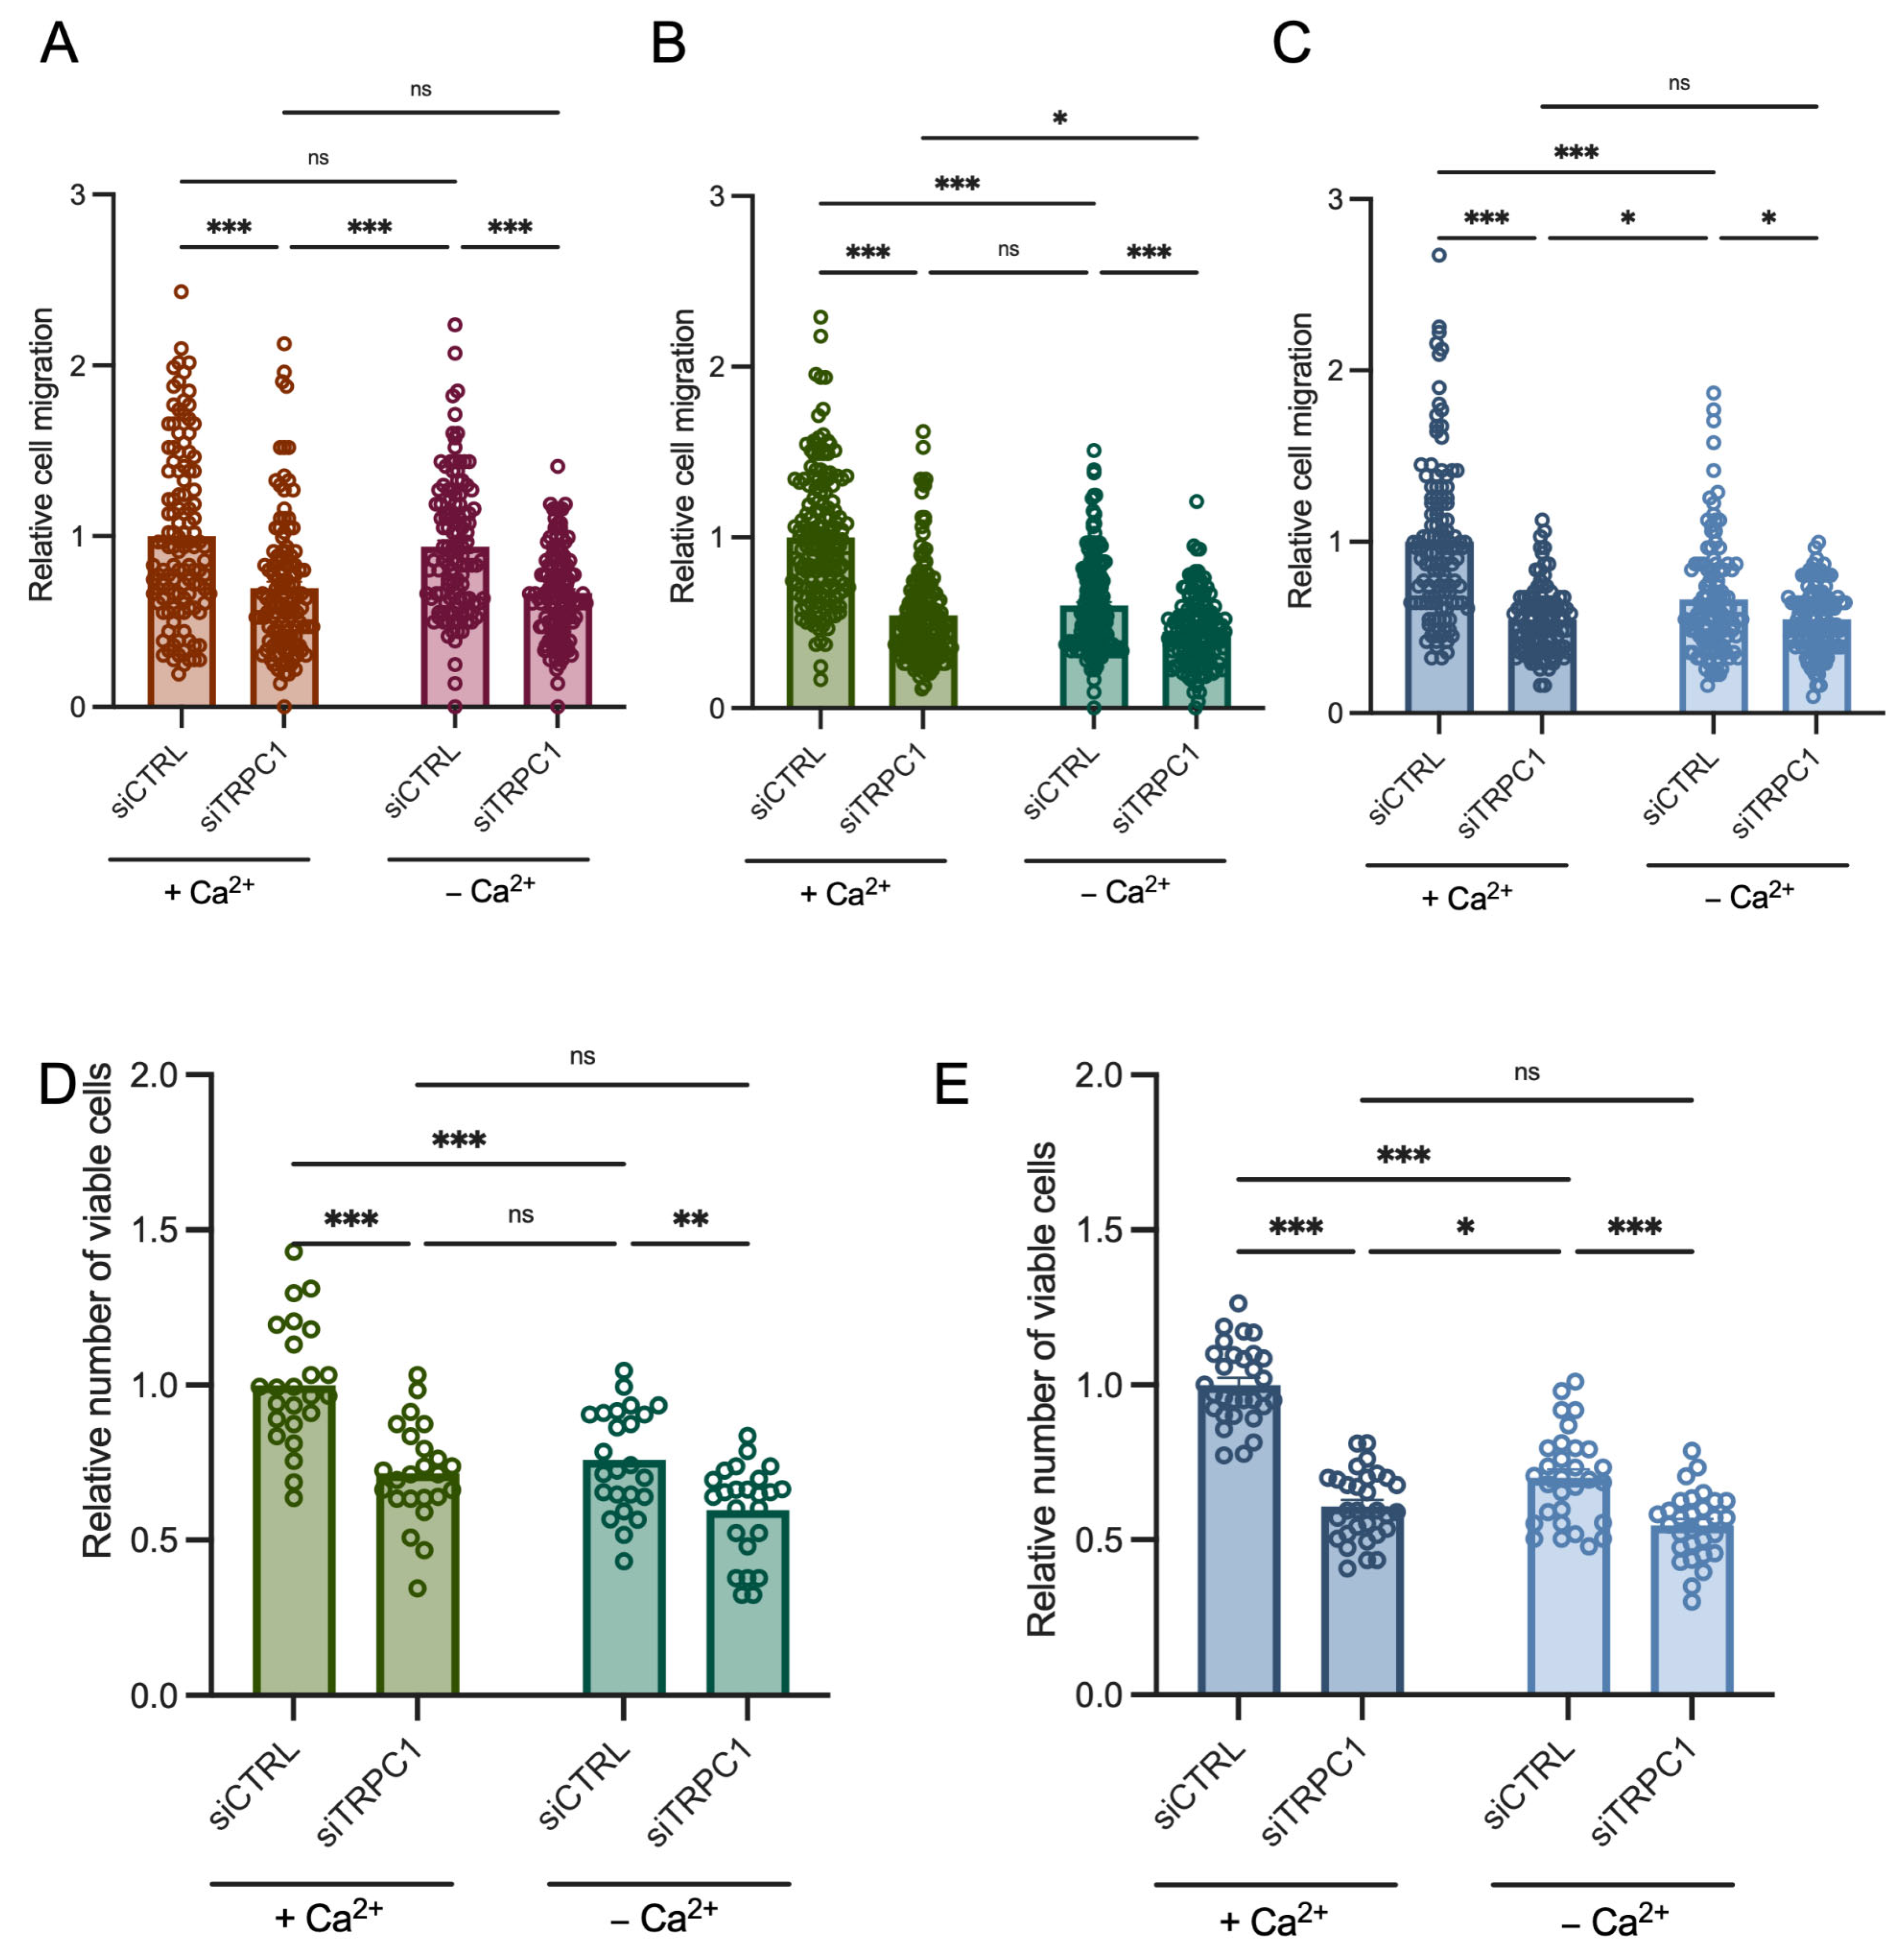
3.7. PANC-1 Cell Migration and Proliferation Depend Mainly on Extracellular Ca2+ Entry, Likely through TRPC1, in Acid-Adapted and -Recovered PANC-1 Cells
4. Discussion
5. Conclusions
Supplementary Materials
Author Contributions
Funding
Institutional Review Board Statement
Informed Consent Statement
Data Availability Statement
Acknowledgments
Conflicts of Interest
References
- Sung, H.; Ferlay, J.; Siegel, R.L.; Laversanne, M.; Soerjomataram, I.; Jemal, A.; Bray, F. Global Cancer Statistics 2020: GLOBOCAN Estimates of Incidence and Mortality Worldwide for 36 Cancers in 185 Countries. CA Cancer J. Clin. 2021, 71, 209–249. [Google Scholar] [CrossRef]
- Wong, M.C.S.; Jiang, J.Y.; Liang, M.; Fang, Y.; Yeung, M.S.; Sung, J.J.Y. Global temporal patterns of pancreatic cancer and association with socioeconomic development. Sci. Rep. 2017, 7, 3165. [Google Scholar] [CrossRef] [PubMed]
- Park, W.; Chawla, A.; O’Reilly, E.M. Pancreatic Cancer: A Review. JAMA 2021, 326, 851–862. [Google Scholar] [CrossRef] [PubMed]
- Ferlay, J.; Soerjomataram, I.; Dikshit, R.; Eser, S.; Mathers, C.; Rebelo, M.; Parkin, D.M.; Forman, D.; Bray, F. Cancer incidence and mortality worldwide: Sources, methods and major patterns in GLOBOCAN 2012. Int. J. Cancer 2015, 136, E359–E386. [Google Scholar] [CrossRef] [PubMed]
- Novak, I.; Haanes, K.A.; Wang, J. Acid-base transport in pancreas-new challenges. Front. Physiol. 2013, 4, 380. [Google Scholar] [CrossRef] [PubMed] [Green Version]
- Pedersen, S.F.; Novak, I.; Alves, F.; Schwab, A.; Pardo, L.A. Alternating pH landscapes shape epithelial cancer initiation and progression: Focus on pancreatic cancer. Bioessays 2017, 39, 1600253. [Google Scholar] [CrossRef] [PubMed]
- Swietach, P.; Vaughan-Jones, R.D.; Harris, A.L.; Hulikova, A. The chemistry, physiology and pathology of pH in cancer. Philos. Trans. R. Soc. Lond. B Biol. Sci. 2014, 369, 20130099. [Google Scholar] [CrossRef] [PubMed] [Green Version]
- Boedtkjer, E.; Pedersen, S.F. The Acidic Tumor Microenvironment as a Driver of Cancer. Annu. Rev. Physiol. 2020, 82, 103–126. [Google Scholar] [CrossRef] [Green Version]
- Andersen, H.B.; Ialchina, R.; Pedersen, S.F.; Czaplinska, D. Metabolic reprogramming by driver mutation-tumor microenvironment interplay in pancreatic cancer: New therapeutic targets. Cancer Metastasis Rev. 2021, 40, 1093–1114. [Google Scholar] [CrossRef]
- Vaupel, P.; Kallinowski, F.; Okunieff, P. Blood flow, oxygen and nutrient supply, and metabolic microenvironment of human tumors: A review. Cancer Res. 1989, 49, 6449–6465. [Google Scholar]
- Rohani, N.; Hao, L.; Alexis, M.S.; Joughin, B.A.; Krismer, K.; Moufarrej, M.N.; Soltis, A.R.; Lauffenburger, D.A.; Yaffe, M.B.; Burge, C.B.; et al. Acidification of Tumor at Stromal Boundaries Drives Transcriptome Alterations Associated with Aggressive Phenotypes. Cancer Res. 2019, 79, 1952–1966. [Google Scholar] [CrossRef]
- Helmlinger, G.; Yuan, F.; Dellian, M.; Jain, R.K. Interstitial pH and pO2 gradients in solid tumors in vivo: High-resolution measurements reveal a lack of correlation. Nat. Med. 1997, 3, 177–182. [Google Scholar] [CrossRef]
- Lee, S.; Axelsen, T.V.; Andersen, A.P.; Vahl, P.; Pedersen, S.F.; Boedtkjer, E. Disrupting Na+, HCO(3)(-)-cotransporter NBCn1 (Slc4a7) delays murine breast cancer development. Oncogene 2016, 35, 2112–2122. [Google Scholar] [CrossRef]
- Lee, S.; Mele, M.; Vahl, P.; Christiansen, P.M.; Jensen, V.E.; Boedtkjer, E. Na+,HCO3- -cotransport is functionally upregulated during human breast carcinogenesis and required for the inverted pH gradient across the plasma membrane. Pflugers Arch. 2015, 467, 367–377. [Google Scholar] [CrossRef]
- Pillai, S.R.; Damaghi, M.; Marunaka, Y.; Spugnini, E.P.; Fais, S.; Gillies, R.J. Causes, consequences, and therapy of tumors acidosis. Cancer Metastasis Rev. 2019, 38, 205–222. [Google Scholar] [CrossRef]
- Martinez-Zaguilan, R.; Seftor, E.A.; Seftor, R.E.; Chu, Y.W.; Gillies, R.J.; Hendrix, M.J. Acidic pH enhances the invasive behavior of human melanoma cells. Clin. Exp. Metastasis 1996, 14, 176–186. [Google Scholar] [CrossRef]
- Corbet, C.; Bastien, E.; Santiago de Jesus, J.P.; Dierge, E.; Martherus, R.; Vander Linden, C.; Doix, B.; Degavre, C.; Guilbaud, C.; Petit, L.; et al. TGFbeta2-induced formation of lipid droplets supports acidosis-driven EMT and the metastatic spreading of cancer cells. Nat. Commun. 2020, 11, 454. [Google Scholar] [CrossRef] [Green Version]
- Peppicelli, S.; Andreucci, E.; Ruzzolini, J.; Laurenzana, A.; Margheri, F.; Fibbi, G.; Del Rosso, M.; Bianchini, F.; Calorini, L. The acidic microenvironment as a possible niche of dormant tumor cells. Cell. Mol. Life Sci. 2017, 74, 2761–2771. [Google Scholar] [CrossRef]
- Petho, Z.; Najder, K.; Carvalho, T.; McMorrow, R.; Todesca, L.M.; Rugi, M.; Bulk, E.; Chan, A.; Lowik, C.; Reshkin, S.J.; et al. pH-Channeling in Cancer: How pH-Dependence of Cation Channels Shapes Cancer Pathophysiology. Cancers 2020, 12, 2484. [Google Scholar] [CrossRef]
- Holzer, P. Acid-sensitive ion channels and receptors. In Handbook of Experimental Pharmacology; Springer: Berlin/Heidelberg, Germany, 2009. [Google Scholar] [CrossRef] [Green Version]
- Damaghi, M.; Wojtkowiak, J.W.; Gillies, R.J. pH sensing and regulation in cancer. Front. Physiol. 2013, 4, 370. [Google Scholar] [CrossRef]
- Audero, M.M.; Prevarskaya, N.; Fiorio Pla, A. Ca2+ Signalling and Hypoxia/Acidic Tumour Microenvironment Interplay in Tumour Progression. Int. J. Mol. Sci. 2022, 23, 7377. [Google Scholar] [CrossRef]
- Schnipper, J.; Ouadid-Ahidouch, H.; Dhennin-Duthille, I.; Ahidouch, A. Ion channel signature in healthy pancreas and pancreatic ductal adenocarcinoma. Front. Pharmacol. 2020, 11, 568993. [Google Scholar] [CrossRef]
- Chamlali, M.; Rodat-Despoix, L.; Ouadid-Ahidouch, H. Store-Independent Calcium Entry and Related Signaling Pathways in Breast Cancer. Genes 2021, 12, 994. [Google Scholar] [CrossRef]
- Tajada, S.; Villalobos, C. Calcium Permeable Channels in Cancer Hallmarks. Front. Pharmacol. 2020, 11, 968. [Google Scholar] [CrossRef]
- Wang, H.; Cheng, X.; Tian, J.; Xiao, Y.; Tian, T.; Xu, F.; Hong, X.; Zhu, M.X. TRPC channels: Structure, function, regulation and recent advances in small molecular probes. Pharmacol. Ther. 2020, 209, 107497. [Google Scholar] [CrossRef]
- Fels, B.; Bulk, E.; Petho, Z.; Schwab, A. The Role of TRP Channels in the Metastatic Cascade. Pharmaceuticals 2018, 11, 48. [Google Scholar] [CrossRef] [Green Version]
- Elzamzamy, O.M.; Penner, R.; Hazlehurst, L.A. The Role of TRPC1 in Modulating Cancer Progression. Cells 2020, 9, 388. [Google Scholar] [CrossRef] [Green Version]
- Asghar, M.Y.; Magnusson, M.; Kemppainen, K.; Sukumaran, P.; Lof, C.; Pulli, I.; Kalhori, V.; Tornquist, K. Transient Receptor Potential Canonical 1 (TRPC1) Channels as Regulators of Sphingolipid and VEGF Receptor Expression: Implications for thyroid cancer cell migration and proliferation. J. Biol. Chem. 2015, 290, 16116–16131. [Google Scholar] [CrossRef] [Green Version]
- Azimi, I.; Milevskiy, M.J.G.; Kaemmerer, E.; Turner, D.; Yapa, K.; Brown, M.A.; Thompson, E.W.; Roberts-Thomson, S.J.; Monteith, G.R. TRPC1 is a differential regulator of hypoxia-mediated events and Akt signalling in PTEN-deficient breast cancer cells. J. Cell Sci. 2017, 130, 2292–2305. [Google Scholar] [CrossRef] [Green Version]
- Fels, B.; Nielsen, N.; Schwab, A. Role of TRPC1 channels in pressure-mediated activation of murine pancreatic stellate cells. Eur. Biophys. J. 2016, 45, 657–670. [Google Scholar] [CrossRef]
- Radoslavova, S.; Fels, B.; Petho, Z.; Gruner, M.; Ruck, T.; Meuth, S.G.; Folcher, A.; Prevarskaya, N.; Schwab, A.; Ouadid-Ahidouch, H. Trpc1 channels regulate the activation of pancreatic stellate cells through erk1/2 and smad2 pathways and perpetuate their pressure-mediated activation. Cell Calcium. 2022, 106, 102621. [Google Scholar] [CrossRef]
- Lepannetier, S.; Zanou, N.; Yerna, X.; Emeriau, N.; Dufour, I.; Masquelier, J.; Muccioli, G.; Tajeddine, N.; Gailly, P. Sphingosine-1-phosphate-activated TRPC1 channel controls chemotaxis of glioblastoma cells. Cell Calcium 2016, 60, 373–383. [Google Scholar] [CrossRef]
- Zheng, J. Molecular mechanism of TRP channels. Compr. Physiol. 2013, 3, 221–242. [Google Scholar] [CrossRef] [Green Version]
- Thakur, D.P.; Wang, Q.; Jeon, J.; Tian, J.B.; Zhu, M.X. Intracellular acidification facilitates receptor-operated TRPC4 activation through PLCdelta1 in a Ca2+ -dependent manner. J. Physiol. 2020, 598, 2651–2667. [Google Scholar] [CrossRef]
- Semtner, M.; Schaefer, M.; Pinkenburg, O.; Plant, T.D. Potentiation of TRPC5 by protons. J. Biol. Chem. 2007, 282, 33868–33878. [Google Scholar] [CrossRef] [Green Version]
- Schnipper, J.; Kouba, S.; Hague, F.; Girault, A.; Rybarczyk, P.; Telliez, M.S.; Guenin, S.; Tebbakha, R.; Sevestre, H.; Ahidouch, A.; et al. The TRPC1 Channel Forms a PI3K/CaM Complex and Regulates Pancreatic Ductal Adenocarcinoma Cell Proliferation in a Ca(2+)-Independent Manner. Int. J. Mol. Sci. 2022, 23, 7923. [Google Scholar] [CrossRef]
- Michl, J.; Park, K.C.; Swietach, P. Evidence-based guidelines for controlling pH in mammalian live-cell culture systems. Commun. Biol. 2019, 2, 144. [Google Scholar] [CrossRef] [Green Version]
- Yao, J.; Czaplinska, D.; Ialchina, R.; Schnipper, J.; Liu, B.; Sandelin, A.; Pedersen, S.F. Cancer Cell Acid Adaptation Gene Expression Response Is Correlated to Tumor-Specific Tissue Expression Profiles and Patient Survival. Cancers 2020, 12, 2183. [Google Scholar] [CrossRef]
- Hagelund, S.; Trauzold, A. Impact of Extracellular pH on Apoptotic and Non-Apoptotic TRAIL-Induced Signaling in Pancreatic Ductal Adenocarcinoma Cells. Front. Cell Dev. Biol. 2022, 10, 768579. [Google Scholar] [CrossRef]
- Flinck, M.; Kramer, S.H.; Schnipper, J.; Andersen, A.P.; Pedersen, S.F. The acid-base transport proteins NHE1 and NBCn1 regulate cell cycle progression in human breast cancer cells. Cell Cycle 2018, 17, 1056–1067. [Google Scholar] [CrossRef]
- Olesen, C.W.; Vogensen, J.; Axholm, I.; Severin, M.; Schnipper, J.; Pedersen, I.S.; von Stemann, J.H.; Schroder, J.M.; Christensen, D.P.; Pedersen, S.F. Trafficking, localization and degradation of the Na(+),HCO3(-) co-transporter NBCn1 in kidney and breast epithelial cells. Sci. Rep. 2018, 8, 7435. [Google Scholar] [CrossRef]
- Thomas, J.A.; Buchsbaum, R.N.; Zimniak, A.; Racker, E. Intracellular pH measurements in Ehrlich ascites tumor cells utilizing spectroscopic probes generated in situ. Biochemistry 1979, 18, 2210–2218. [Google Scholar] [CrossRef]
- Radoslavova, S.; Folcher, A.; Lefebvre, T.; Kondratska, K.; Guenin, S.; Dhennin-Duthille, I.; Gautier, M.; Prevarskaya, N.; Ouadid-Ahidouch, H. Orai1 Channel Regulates Human-Activated Pancreatic Stellate Cell Proliferation and TGFbeta1 Secretion through the AKT Signaling Pathway. Cancers 2021, 13, 2395. [Google Scholar] [CrossRef] [PubMed]
- Girault, A.; Peretti, M.; Badaoui, M.; Hemon, A.; Morjani, H.; Ouadid-Ahidouch, H. The N and C-termini of SPCA2 regulate differently Kv10.1 function: Role in the collagen 1-induced breast cancer cell survival. Am. J. Cancer Res. 2021, 11, 251–263. [Google Scholar]
- Bolte, S.; Cordelieres, F.P. A guided tour into subcellular colocalization analysis in light microscopy. J. Microsc. 2006, 224, 213–232. [Google Scholar] [CrossRef]
- Chamlali, M.; Kouba, S.; Rodat-Despoix, L.; Todesca, L.M.; Petho, Z.; Schwab, A.; Ouadid-Ahidouch, H. Orai3 Calcium Channel Regulates Breast Cancer Cell Migration through Calcium-Dependent and -Independent Mechanisms. Cells 2021, 10, 3487. [Google Scholar] [CrossRef] [PubMed]
- Flinck, M.; Kramer, S.H.; Pedersen, S.F. Roles of pH in control of cell proliferation. Acta Physiol. 2018, 223, e13068. [Google Scholar] [CrossRef] [PubMed]
- Smallbone, K.; Gavaghan, D.J.; Gatenby, R.A.; Maini, P.K. The role of acidity in solid tumour growth and invasion. J. Theor. Biol. 2005, 235, 476–484. [Google Scholar] [CrossRef] [Green Version]
- Garcia, Z.; Kumar, A.; Marques, M.; Cortes, I.; Carrera, A.C. Phosphoinositide 3-kinase controls early and late events in mammalian cell division. EMBO J. 2006, 25, 655–661. [Google Scholar] [CrossRef] [Green Version]
- Sun, Y.; Ye, C.; Tian, W.; Ye, W.; Gao, Y.Y.; Feng, Y.D.; Zhang, H.N.; Ma, G.Y.; Wang, S.J.; Cao, W.; et al. TRPC1 promotes the genesis and progression of colorectal cancer via activating CaM-mediated PI3K/AKT signaling axis. Oncogenesis 2021, 10, 67. [Google Scholar] [CrossRef] [PubMed]
- Blaszczak, W.; Swietach, P. What do cellular responses to acidity tell us about cancer? Cancer Metastasis Rev. 2021, 40, 1159–1176. [Google Scholar] [CrossRef]
- White, K.A.; Grillo-Hill, B.K.; Barber, D.L. Cancer cell behaviors mediated by dysregulated pH dynamics at a glance. J. Cell Sci. 2017, 130, 663–669. [Google Scholar] [CrossRef] [PubMed] [Green Version]
- De Bem Prunes, B.; Nunes, J.S.; da Silva, V.P.; Laureano, N.K.; Goncalves, D.R.; Machado, I.S.; Barbosa, S.; Lamers, M.L.; Rados, P.V.; Kurth, I.; et al. The role of tumor acidification in aggressiveness, cell dissemination and treatment resistance of oral squamous cell carcinoma. Life Sci. 2022, 288, 120163. [Google Scholar] [CrossRef]
- Sutoo, S.; Maeda, T.; Suzuki, A.; Kato, Y. Adaptation to chronic acidic extracellular pH elicits a sustained increase in lung cancer cell invasion and metastasis. Clin. Exp. Metastasis 2020, 37, 133–144. [Google Scholar] [CrossRef] [Green Version]
- Moellering, R.E.; Black, K.C.; Krishnamurty, C.; Baggett, B.K.; Stafford, P.; Rain, M.; Gatenby, R.A.; Gillies, R.J. Acid treatment of melanoma cells selects for invasive phenotypes. Clin. Exp. Metastasis 2008, 25, 411–425. [Google Scholar] [CrossRef]
- Wu, T.C.; Liao, C.Y.; Lu, W.C.; Chang, C.R.; Tsai, F.Y.; Jiang, S.S.; Chen, T.H.; Lin, K.M.; Chen, L.T.; Chang, W.W. Identification of distinct slow mode of reversible adaptation of pancreatic ductal adenocarcinoma to the prolonged acidic pH microenvironment. J. Exp. Clin. Cancer Res. 2022, 41, 137. [Google Scholar] [CrossRef]
- Shin, S.C.; Thomas, D.; Radhakrishnan, P.; Hollingsworth, M.A. Invasive phenotype induced by low extracellular pH requires mitochondria dependent metabolic flexibility. Biochem. Biophys. Res. Commun. 2020, 525, 162–168. [Google Scholar] [CrossRef] [PubMed]
- Zhou, Z.H.; Wang, Q.L.; Mao, L.H.; Li, X.Q.; Liu, P.; Song, J.W.; Liu, X.; Xu, F.; Lei, J.; He, S. Chromatin accessibility changes are associated with enhanced growth and liver metastasis capacity of acid-adapted colorectal cancer cells. Cell Cycle 2019, 18, 511–522. [Google Scholar] [CrossRef] [PubMed] [Green Version]
- Riemann, A.; Schneider, B.; Gundel, D.; Stock, C.; Thews, O.; Gekle, M. Acidic priming enhances metastatic potential of cancer cells. Pflugers Arch. 2014, 466, 2127–2138. [Google Scholar] [CrossRef]
- Robey, I.F.; Baggett, B.K.; Kirkpatrick, N.D.; Roe, D.J.; Dosescu, J.; Sloane, B.F.; Hashim, A.I.; Morse, D.L.; Raghunand, N.; Gatenby, R.A.; et al. Bicarbonate increases tumor pH and inhibits spontaneous metastases. Cancer Res. 2009, 69, 2260–2268. [Google Scholar] [CrossRef] [PubMed] [Green Version]
- Glitsch, M. Protons and Ca2+: Ionic allies in tumor progression? Physiology 2011, 26, 252–265. [Google Scholar] [CrossRef]
- Cheng, K.T.; Liu, X.; Ong, H.L.; Swaim, W.; Ambudkar, I.S. Local Ca2+ entry via Orai1 regulates plasma membrane recruitment of TRPC1 and controls cytosolic Ca2+ signals required for specific cell functions. PLoS Biol. 2011, 9, e1001025. [Google Scholar] [CrossRef] [Green Version]
- Ambudkar, I.S.; de Souza, L.B.; Ong, H.L. TRPC1, Orai1, and STIM1 in SOCE: Friends in tight spaces. Cell Calcium 2017, 63, 33–39. [Google Scholar] [CrossRef] [Green Version]
- Mehta, D.; Ahmmed, G.U.; Paria, B.C.; Holinstat, M.; Voyno-Yasenetskaya, T.; Tiruppathi, C.; Minshall, R.D.; Malik, A.B. RhoA interaction with inositol 1,4,5-trisphosphate receptor and transient receptor potential channel-1 regulates Ca2+ entry. Role in signaling increased endothelial permeability. J. Biol. Chem. 2003, 278, 33492–33500. [Google Scholar] [CrossRef] [Green Version]
- Chung, H.K.; Rathor, N.; Wang, S.R.; Wang, J.Y.; Rao, J.N. RhoA enhances store-operated Ca2+ entry and intestinal epithelial restitution by interacting with TRPC1 after wounding. Am. J. Physiol. Gastrointest Liver Physiol. 2015, 309, G759–G767. [Google Scholar] [CrossRef] [Green Version]
- Zhang, L.Y.; Zhang, Y.Q.; Zeng, Y.Z.; Zhu, J.L.; Chen, H.; Wei, X.L.; Liu, L.J. TRPC1 inhibits the proliferation and migration of estrogen receptor-positive Breast cancer and gives a better prognosis by inhibiting the PI3K/AKT pathway. Breast Cancer Res. Treat. 2020, 182, 21–33. [Google Scholar] [CrossRef] [PubMed]
- Schaar, A.; Sukumaran, P.; Sun, Y.; Dhasarathy, A.; Singh, B.B. TRPC1-STIM1 activation modulates transforming growth factor beta-induced epithelial-to-mesenchymal transition. Oncotarget 2016, 7, 80554–80567. [Google Scholar] [CrossRef] [Green Version]
- Bomben, V.C.; Turner, K.L.; Barclay, T.T.; Sontheimer, H. Transient receptor potential canonical channels are essential for chemotactic migration of human malignant gliomas. J. Cell Physiol. 2011, 226, 1879–1888. [Google Scholar] [CrossRef] [PubMed] [Green Version]
- Dong, H.; Shim, K.N.; Li, J.M.; Estrema, C.; Ornelas, T.A.; Nguyen, F.; Liu, S.; Ramamoorthy, S.L.; Ho, S.; Carethers, J.M.; et al. Molecular mechanisms underlying Ca2+-mediated motility of human pancreatic duct cells. Am. J. Physiol. Cell Physiol. 2010, 299, C1493–C1503. [Google Scholar] [CrossRef] [Green Version]
- Tajeddine, N.; Gailly, P. TRPC1 protein channel is major regulator of epidermal growth factor receptor signaling. J. Biol. Chem. 2012, 287, 16146–16157. [Google Scholar] [CrossRef] [Green Version]
- Selli, C.; Erac, Y.; Kosova, B.; Erdal, E.S.; Tosun, M. Silencing of TRPC1 regulates store-operated calcium entry and proliferation in Huh7 hepatocellular carcinoma cells. Biomed. Pharmacother. 2015, 71, 194–200. [Google Scholar] [CrossRef] [PubMed]
- El Hiani, Y.; Ahidouch, A.; Lehen’kyi, V.; Hague, F.; Gouilleux, F.; Mentaverri, R.; Kamel, S.; Lassoued, K.; Brule, G.; Ouadid-Ahidouch, H. Extracellular signal-regulated kinases 1 and 2 and TRPC1 channels are required for calcium-sensing receptor-stimulated MCF-7 breast cancer cell proliferation. Cell Physiol. Biochem. 2009, 23, 335–346. [Google Scholar] [CrossRef] [PubMed]
- Davis, F.M.; Peters, A.A.; Grice, D.M.; Cabot, P.J.; Parat, M.O.; Roberts-Thomson, S.J.; Monteith, G.R. Non-stimulated, agonist-stimulated and store-operated Ca2+ influx in MDA-MB-468 breast cancer cells and the effect of EGF-induced EMT on calcium entry. PLoS ONE 2012, 7, e36923. [Google Scholar] [CrossRef] [PubMed] [Green Version]
- Waters, A.M.; Der, C.J. KRAS: The Critical Driver and Therapeutic Target for Pancreatic Cancer. Cold Spring Harb. Perspect. Med. 2018, 8, a031435. [Google Scholar] [CrossRef] [PubMed] [Green Version]
- Mukhopadhyay, S.; Vander Heiden, M.G.; McCormick, F. The Metabolic Landscape of RAS-Driven Cancers from biology to therapy. Nat. Cancer 2021, 2, 271–283. [Google Scholar] [CrossRef]
- Selli, C.; Pearce, D.A.; Sims, A.H.; Tosun, M. Differential expression of store-operated calcium- and proliferation-related genes in hepatocellular carcinoma cells following TRPC1 ion channel silencing. Mol. Cell Biochem. 2016, 420, 129–140. [Google Scholar] [CrossRef] [PubMed] [Green Version]
- Pfaffl, M.W.; Horgan, G.W.; Dempfle, L. Relative expression software tool (REST) for group-wise comparison and statistical analysis of relative expression results in real-time PCR. Nucleic Acids Res. 2002, 30, e36. [Google Scholar] [CrossRef]


Publisher’s Note: MDPI stays neutral with regard to jurisdictional claims in published maps and institutional affiliations. |
© 2022 by the authors. Licensee MDPI, Basel, Switzerland. This article is an open access article distributed under the terms and conditions of the Creative Commons Attribution (CC BY) license (https://creativecommons.org/licenses/by/4.0/).
Share and Cite
Schnipper, J.; Kouba, S.; Hague, F.; Girault, A.; Telliez, M.-S.; Guénin, S.; Ahidouch, A.; Pedersen, S.F.; Ouadid-Ahidouch, H. Acid Adaptation Promotes TRPC1 Plasma Membrane Localization Leading to Pancreatic Ductal Adenocarcinoma Cell Proliferation and Migration through Ca2+ Entry and Interaction with PI3K/CaM. Cancers 2022, 14, 4946. https://doi.org/10.3390/cancers14194946
Schnipper J, Kouba S, Hague F, Girault A, Telliez M-S, Guénin S, Ahidouch A, Pedersen SF, Ouadid-Ahidouch H. Acid Adaptation Promotes TRPC1 Plasma Membrane Localization Leading to Pancreatic Ductal Adenocarcinoma Cell Proliferation and Migration through Ca2+ Entry and Interaction with PI3K/CaM. Cancers. 2022; 14(19):4946. https://doi.org/10.3390/cancers14194946
Chicago/Turabian StyleSchnipper, Julie, Sana Kouba, Frédéric Hague, Alban Girault, Marie-Sophie Telliez, Stéphanie Guénin, Ahmed Ahidouch, Stine Falsig Pedersen, and Halima Ouadid-Ahidouch. 2022. "Acid Adaptation Promotes TRPC1 Plasma Membrane Localization Leading to Pancreatic Ductal Adenocarcinoma Cell Proliferation and Migration through Ca2+ Entry and Interaction with PI3K/CaM" Cancers 14, no. 19: 4946. https://doi.org/10.3390/cancers14194946