
Transcriptome-Wide Gene Expression Profiles from FFPE Materials Based on a Nuclease Protection Assay Reveals Significantly Different Patterns between Synovial Sarcomas and Morphologic Mimickers

 , ,
, ,
Abstract
:Simple Summary
Abstract
1. Introduction
2. Materials and Methods
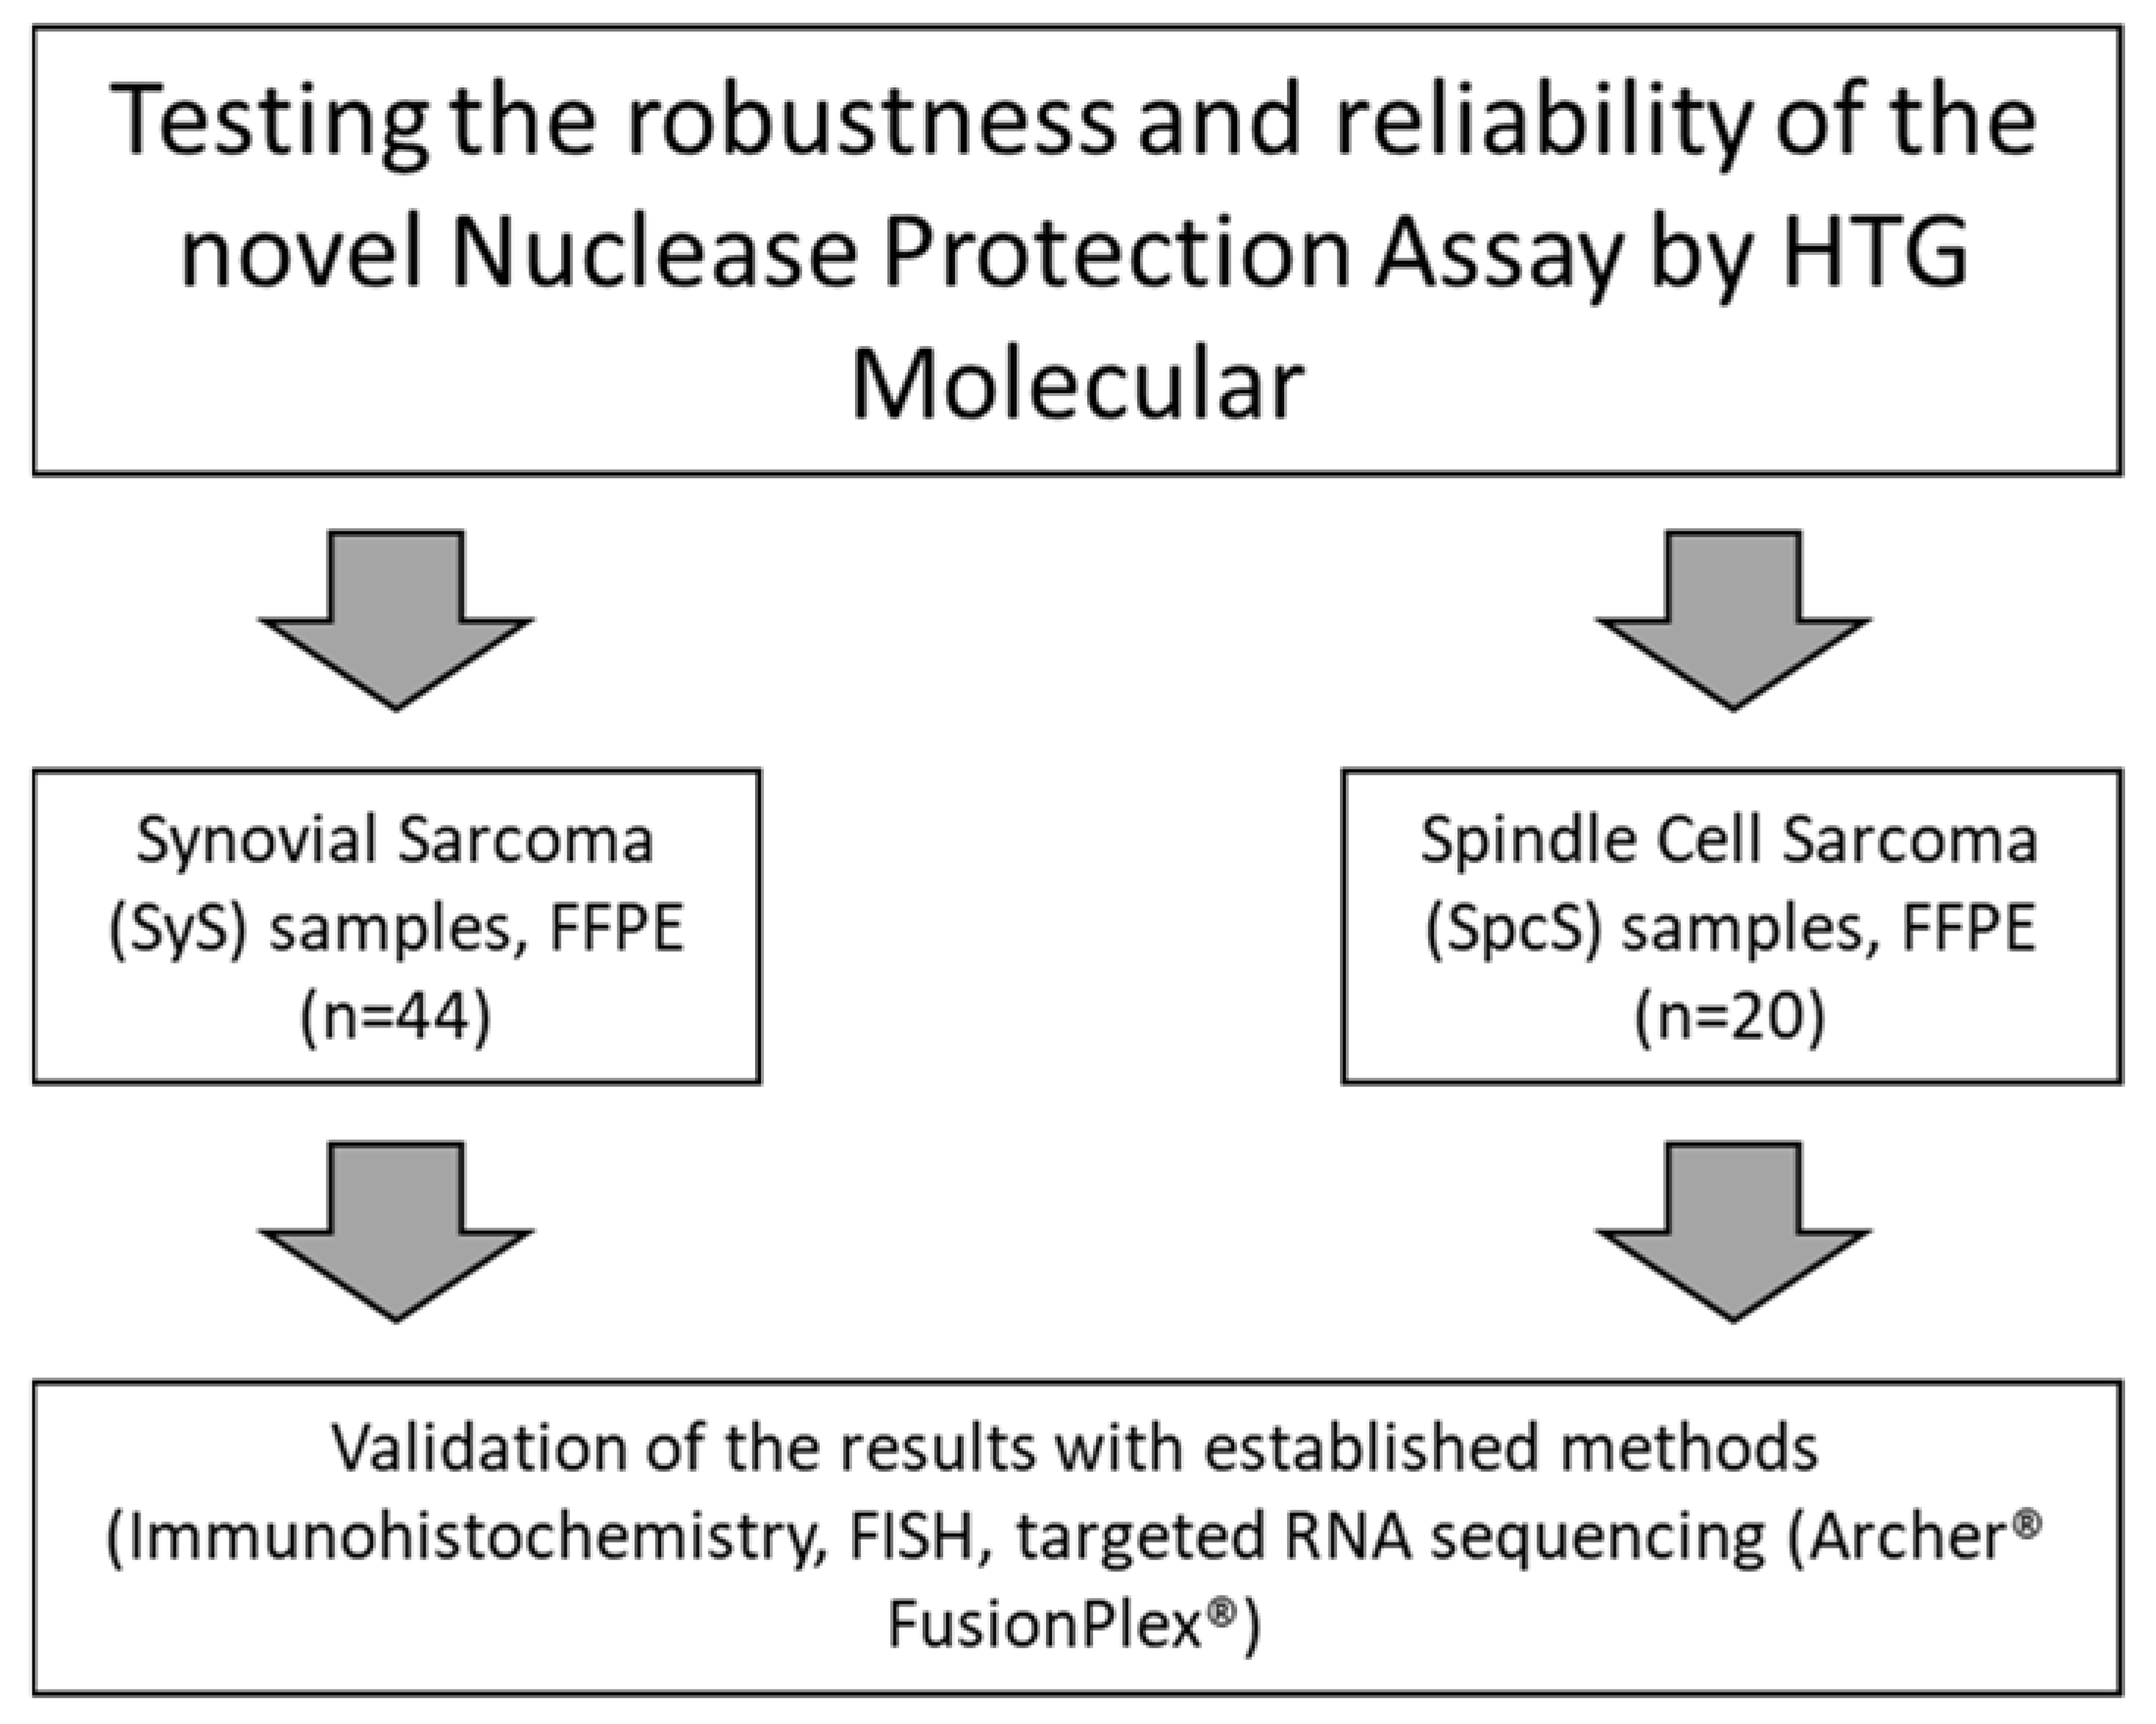
2.1. Study Design
2.2. RNA-Isolation and Quantification for Archer® FusionPlex® Analysis
2.3. Archer® FusionPlex® Targeted RNA Sequencing
2.4. RNA-Fusion Detection via Archer® FusionPlex® Analysis Software
2.5. Fluorescence In Situ Hybridization
2.6. Immunohistochemistry
2.7. HTG Transcriptome Panel
3. Results
4. Discussion
4.1. Assay Performance
4.2. Comparison of HTP with Other Existing mRNA Profiling Systems
5. Conclusions
Author Contributions
Funding
Institutional Review Board Statement
Informed Consent Statement
Data Availability Statement
Acknowledgments
Conflicts of Interest
References
- Gaffney, E.F.; Riegman, P.H.; Grizzle, W.E.; Watson, P.H. Factors that drive the increasing use of FFPE tissue in basic and translational cancer research. Biotech. Histochem. 2018, 93, 373–386. [Google Scholar] [CrossRef] [PubMed]
- Schmeller, J.; Wessolly, M.; Mairinger, E.; Borchert, S.; Hager, T.; Mairinger, T.; Schmid, K.W.; Wohlschlaeger, J.; Walter, R.F.H.; Mairinger, F.D. Setting out the frame conditions for feasible use of FFPE derived RNA. Pathol. Res. Pract. 2019, 215, 381–386. [Google Scholar] [CrossRef]
- Esteve-Codina, A.; Arpi, O.; Martinez-García, M.; Pineda, E.; Mallo, M.; Gut, M.; Carrato, C.; Rovira, A.; Lopez, R.; Tortosa, A.; et al. A Comparison of RNA-Seq Results from Paired Formalin-Fixed Paraffin-Embedded and Fresh-Frozen Glioblastoma Tissue Samples. PLoS ONE 2017, 12, e0170632. [Google Scholar] [CrossRef]
- Lüder Ripoli, F.; Mohr, A.; Conradine Hammer, S.; Willenbrock, S.; Hewicker-Trautwein, M.; Hennecke, S.; Murua Escobar, H.; Nolte, I. A Comparison of Fresh Frozen vs. Formalin-Fixed, Paraffin-Embedded Specimens of Canine Mammary Tumors via Branched-DNA Assay. Int. J. Mol. Sci. 2016, 17, 724. [Google Scholar] [CrossRef] [PubMed]
- Kashofer, K.; Viertler, C.; Pichler, M.; Zatloukal, K. Quality control of RNA preservation and extraction from paraffin-embedded tissue: Implications for RT-PCR and microarray analysis. PLoS ONE 2013, 8, e70714. [Google Scholar] [CrossRef] [PubMed]
- von Ahlfen, S.; Missel, A.; Bendrat, K.; Schlumpberger, M. Determinants of RNA quality from FFPE samples. PLoS ONE 2007, 2, e1261. [Google Scholar] [CrossRef] [PubMed]
- Castiglione, F.; Rossi Degl’Innocenti, D.; Taddei, A.; Garbini, F.; Buccoliero, A.M.; Raspollini, M.R.; Pepi, M.; Paglierani, M.; Asirelli, G.; Freschi, G.; et al. Real-time PCR analysis of RNA extracted from formalin-fixed and paraffin-embeded tissues: Effects of the fixation on outcome reliability. Appl. Immunohistochem. Mol. Morphol. 2007, 15, 338–342. [Google Scholar] [CrossRef] [PubMed]
- Trejo, C.L.; Babić, M.; Imler, E.; Gonzalez, M.; Bibikov, S.I.; Shepard, P.J.; VanSteenhouse, H.C.; Yeakley, J.M.; Seligmann, B.E. Extraction-free whole transcriptome gene expression analysis of FFPE sections and histology-directed subareas of tissue. PLoS ONE 2019, 14, e0212031. [Google Scholar] [CrossRef]
- Jones, K.B.; Barrott, J.J.; Xie, M.; Haldar, M.; Jin, H.; Zhu, J.F.; Monument, M.J.; Mosbruger, T.L.; Langer, E.M.; Randall, R.L.; et al. The impact of chromosomal translocation locus and fusion oncogene coding sequence in synovial sarcomagenesis. Oncogene 2016, 35, 5021–5032. [Google Scholar] [CrossRef] [PubMed]
- Molecular, H. White Paper: Comparison of the Prototype HTG Transcriptome Panel to RNA-Seq. Available online: https://www.htgmolecular.com/assays/htp (accessed on 24 March 2021).
- El Beaino, M.; Jupiter, D.C.; Assi, T.; Rassy, E.; Lazar, A.J.; Araujo, D.M.; Lin, P.P. Diagnostic Value of TLE1 in Synovial Sarcoma: A Systematic Review and Meta-Analysis. Sarcoma 2020, 2020, 7192347. [Google Scholar] [CrossRef] [PubMed] [Green Version]
- Chen, T.; Wu, G.; Hu, H.; Wu, C. Enhanced fatty acid oxidation mediated by CPT1C promotes gastric cancer progression. J. Gastrointest. Oncol. 2020, 11, 695–707. [Google Scholar] [CrossRef] [PubMed]
- Casals Farré, N.; Zammit, V.; Herrero, L.; Fadó, R.; Rodriguez-Rodriguez, R.; Serra, D. Carnitine palmitoyltransferase 1C: From cognition to cancer. Prog. Lipid Res. 2015, 61, 134–148. [Google Scholar] [CrossRef] [PubMed]
- Reilly, P.T.; Mak, T.W. Molecular Pathways: Tumor Cells Co-opt the Brain-Specific Metabolism Gene CPT1C to Promote Survival. Clin. Cancer Res. 2012, 18, 5850. [Google Scholar] [CrossRef] [PubMed]
- Tsai, C.K.; Huang, L.C.; Tsai, W.C.; Huang, S.M.; Lee, J.T.; Hueng, D.Y. Overexpression of PLOD3 promotes tumor progression and poor prognosis in gliomas. Oncotarget 2018, 9, 15705–15720. [Google Scholar] [CrossRef] [PubMed]
- Qi, Y.; Xu, R. Roles of PLODs in Collagen Synthesis and Cancer Progression. Front. Cell Dev. Biol. 2018, 6, 66. [Google Scholar] [CrossRef] [PubMed]
- Turnbull, A.K.; Selli, C.; Martinez-Perez, C.; Fernando, A.; Renshaw, L.; Keys, J.; Figueroa, J.D.; He, X.; Tanioka, M.; Munro, A.F.; et al. Unlocking the transcriptomic potential of formalin-fixed paraffin embedded clinical tissues: Comparison of gene expression profiling approaches. BMC Bioinform. 2020, 21, 30. [Google Scholar] [CrossRef] [PubMed]


| QC Metric | Failure Mode Detected | Criteria |
|---|---|---|
| QC0 | Insufficient RNA | %POS > 4% is a failure |
| QC1 | Insufficient read depth | Total aligned reads < 7 million per sample is a failure |
| QC2 | High background signal | Median log2 (CPM) negative control probes > 2 is a failure |
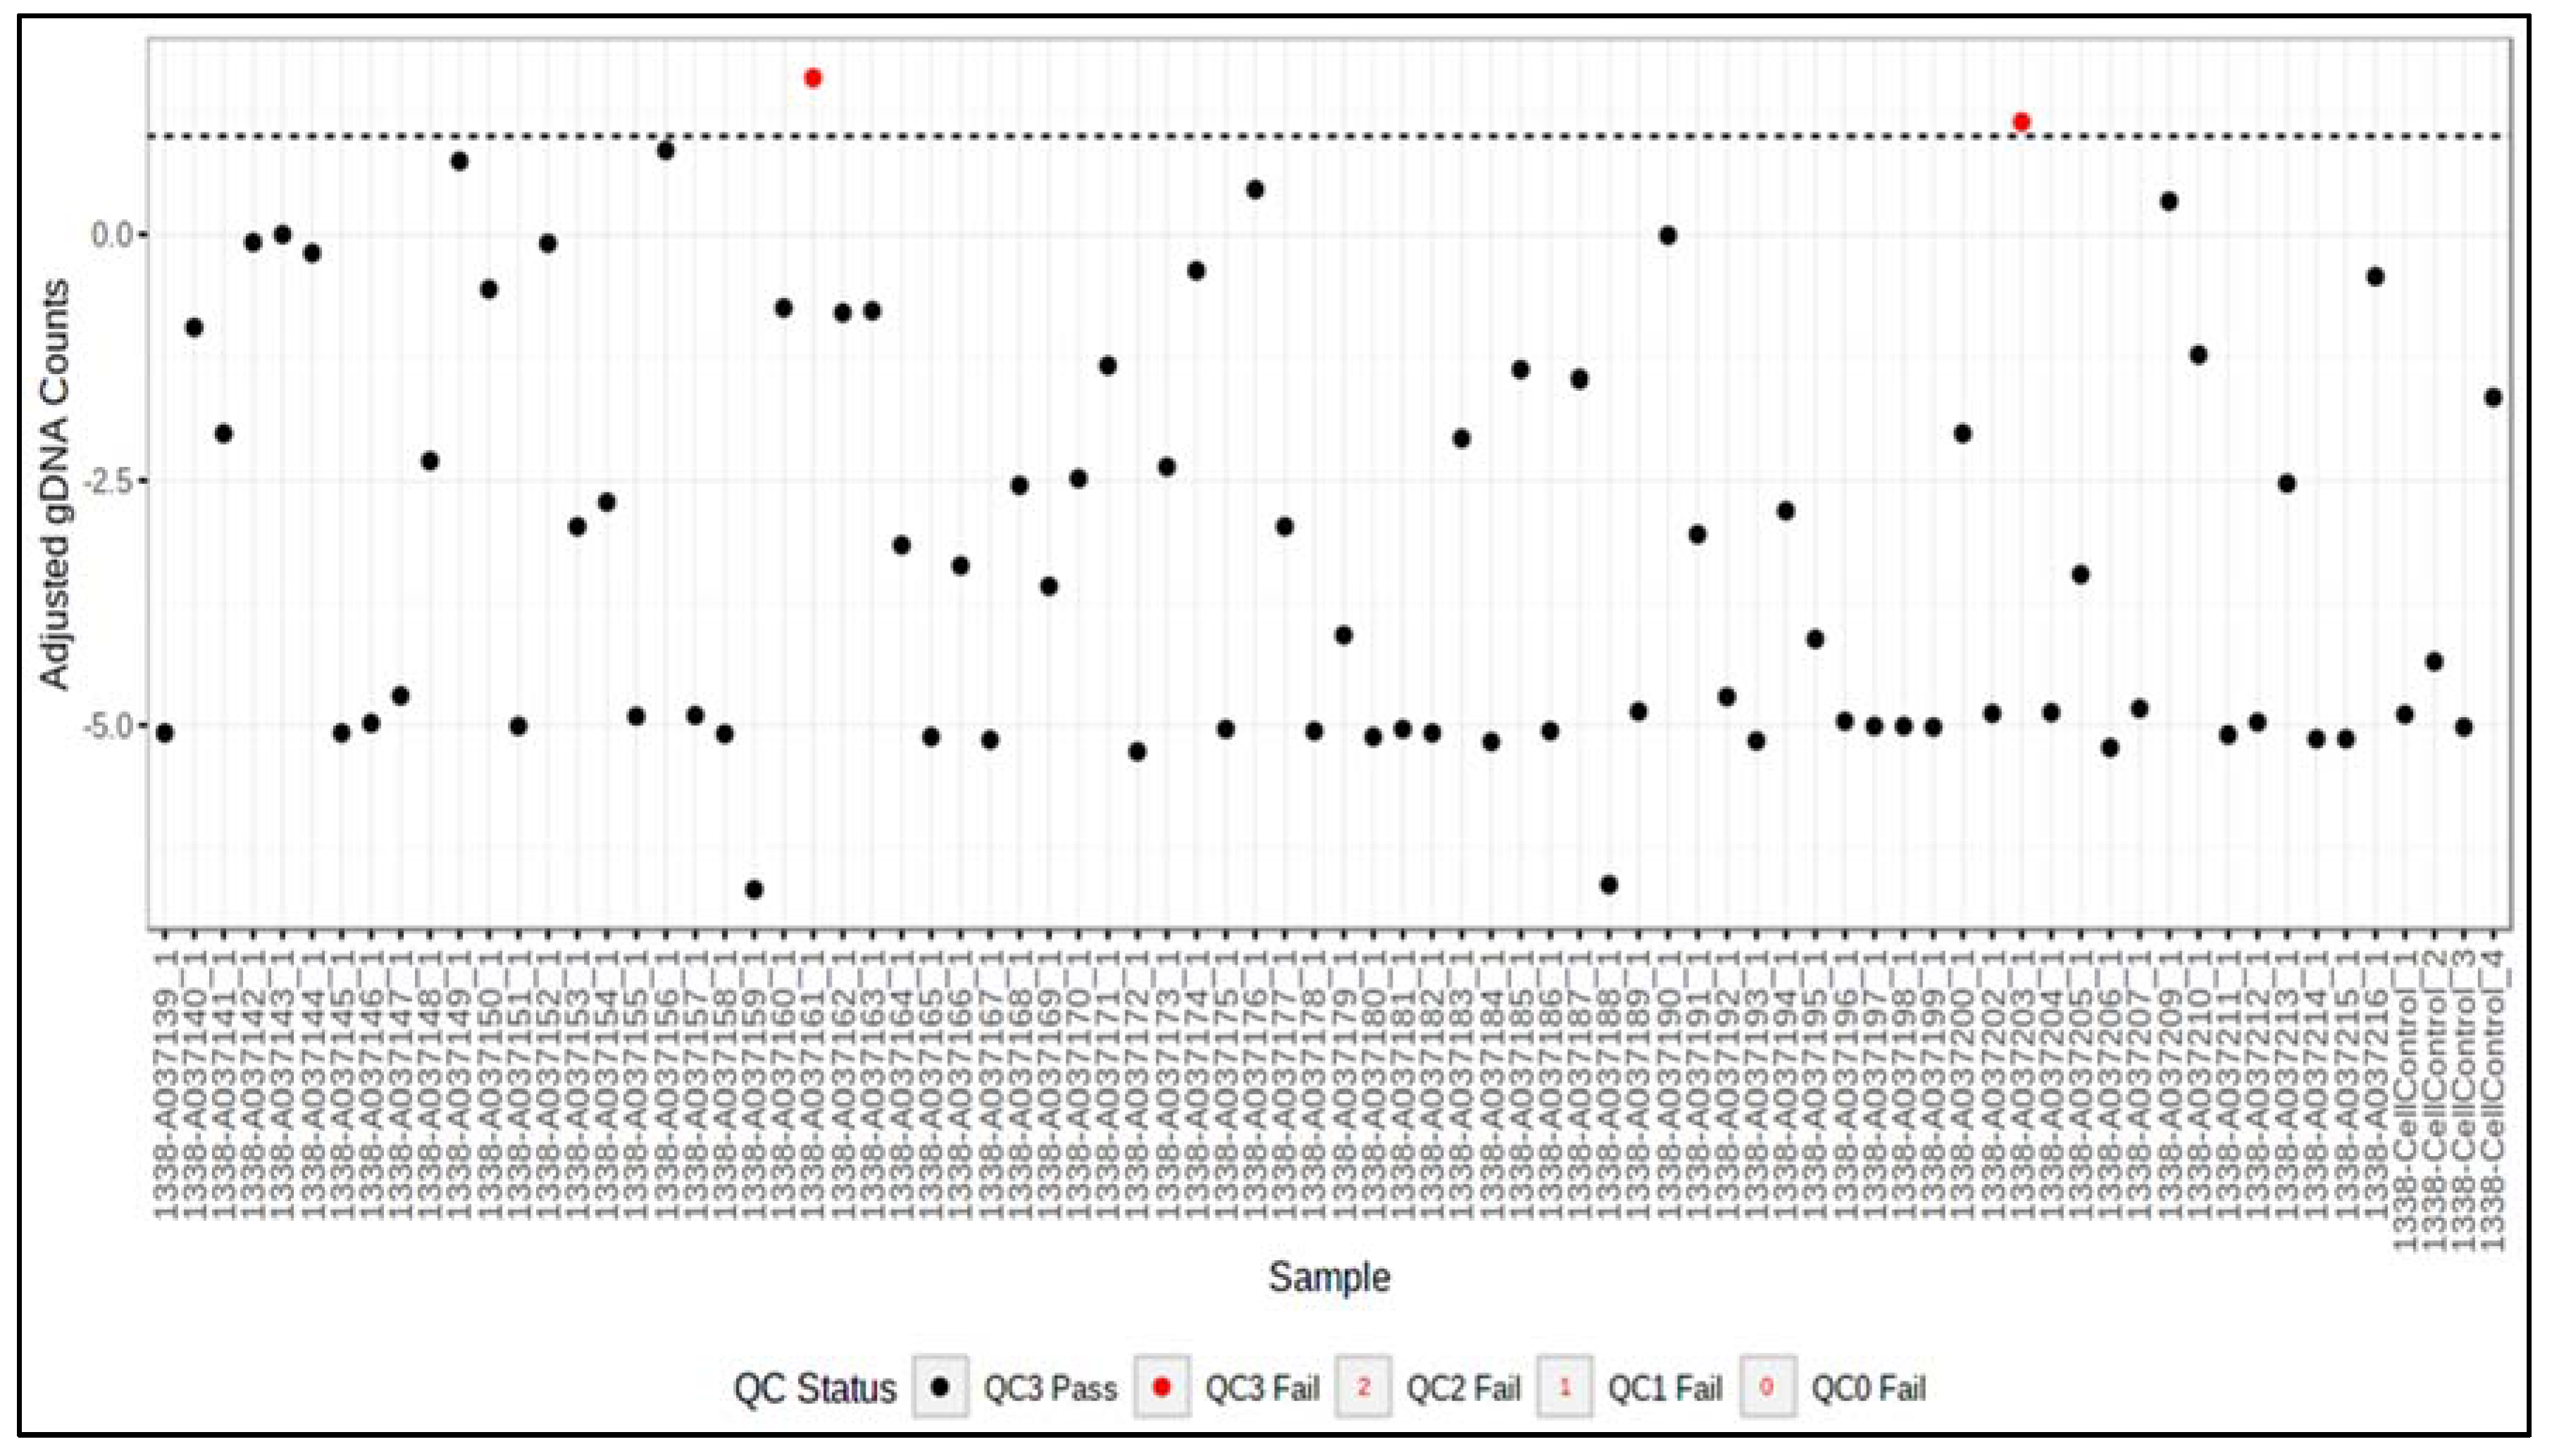
| QC3 | Incomplete digestion of gDNA by DNase | Median adjusted log2 (CPM) of gDNA probes > 1 is a failure |
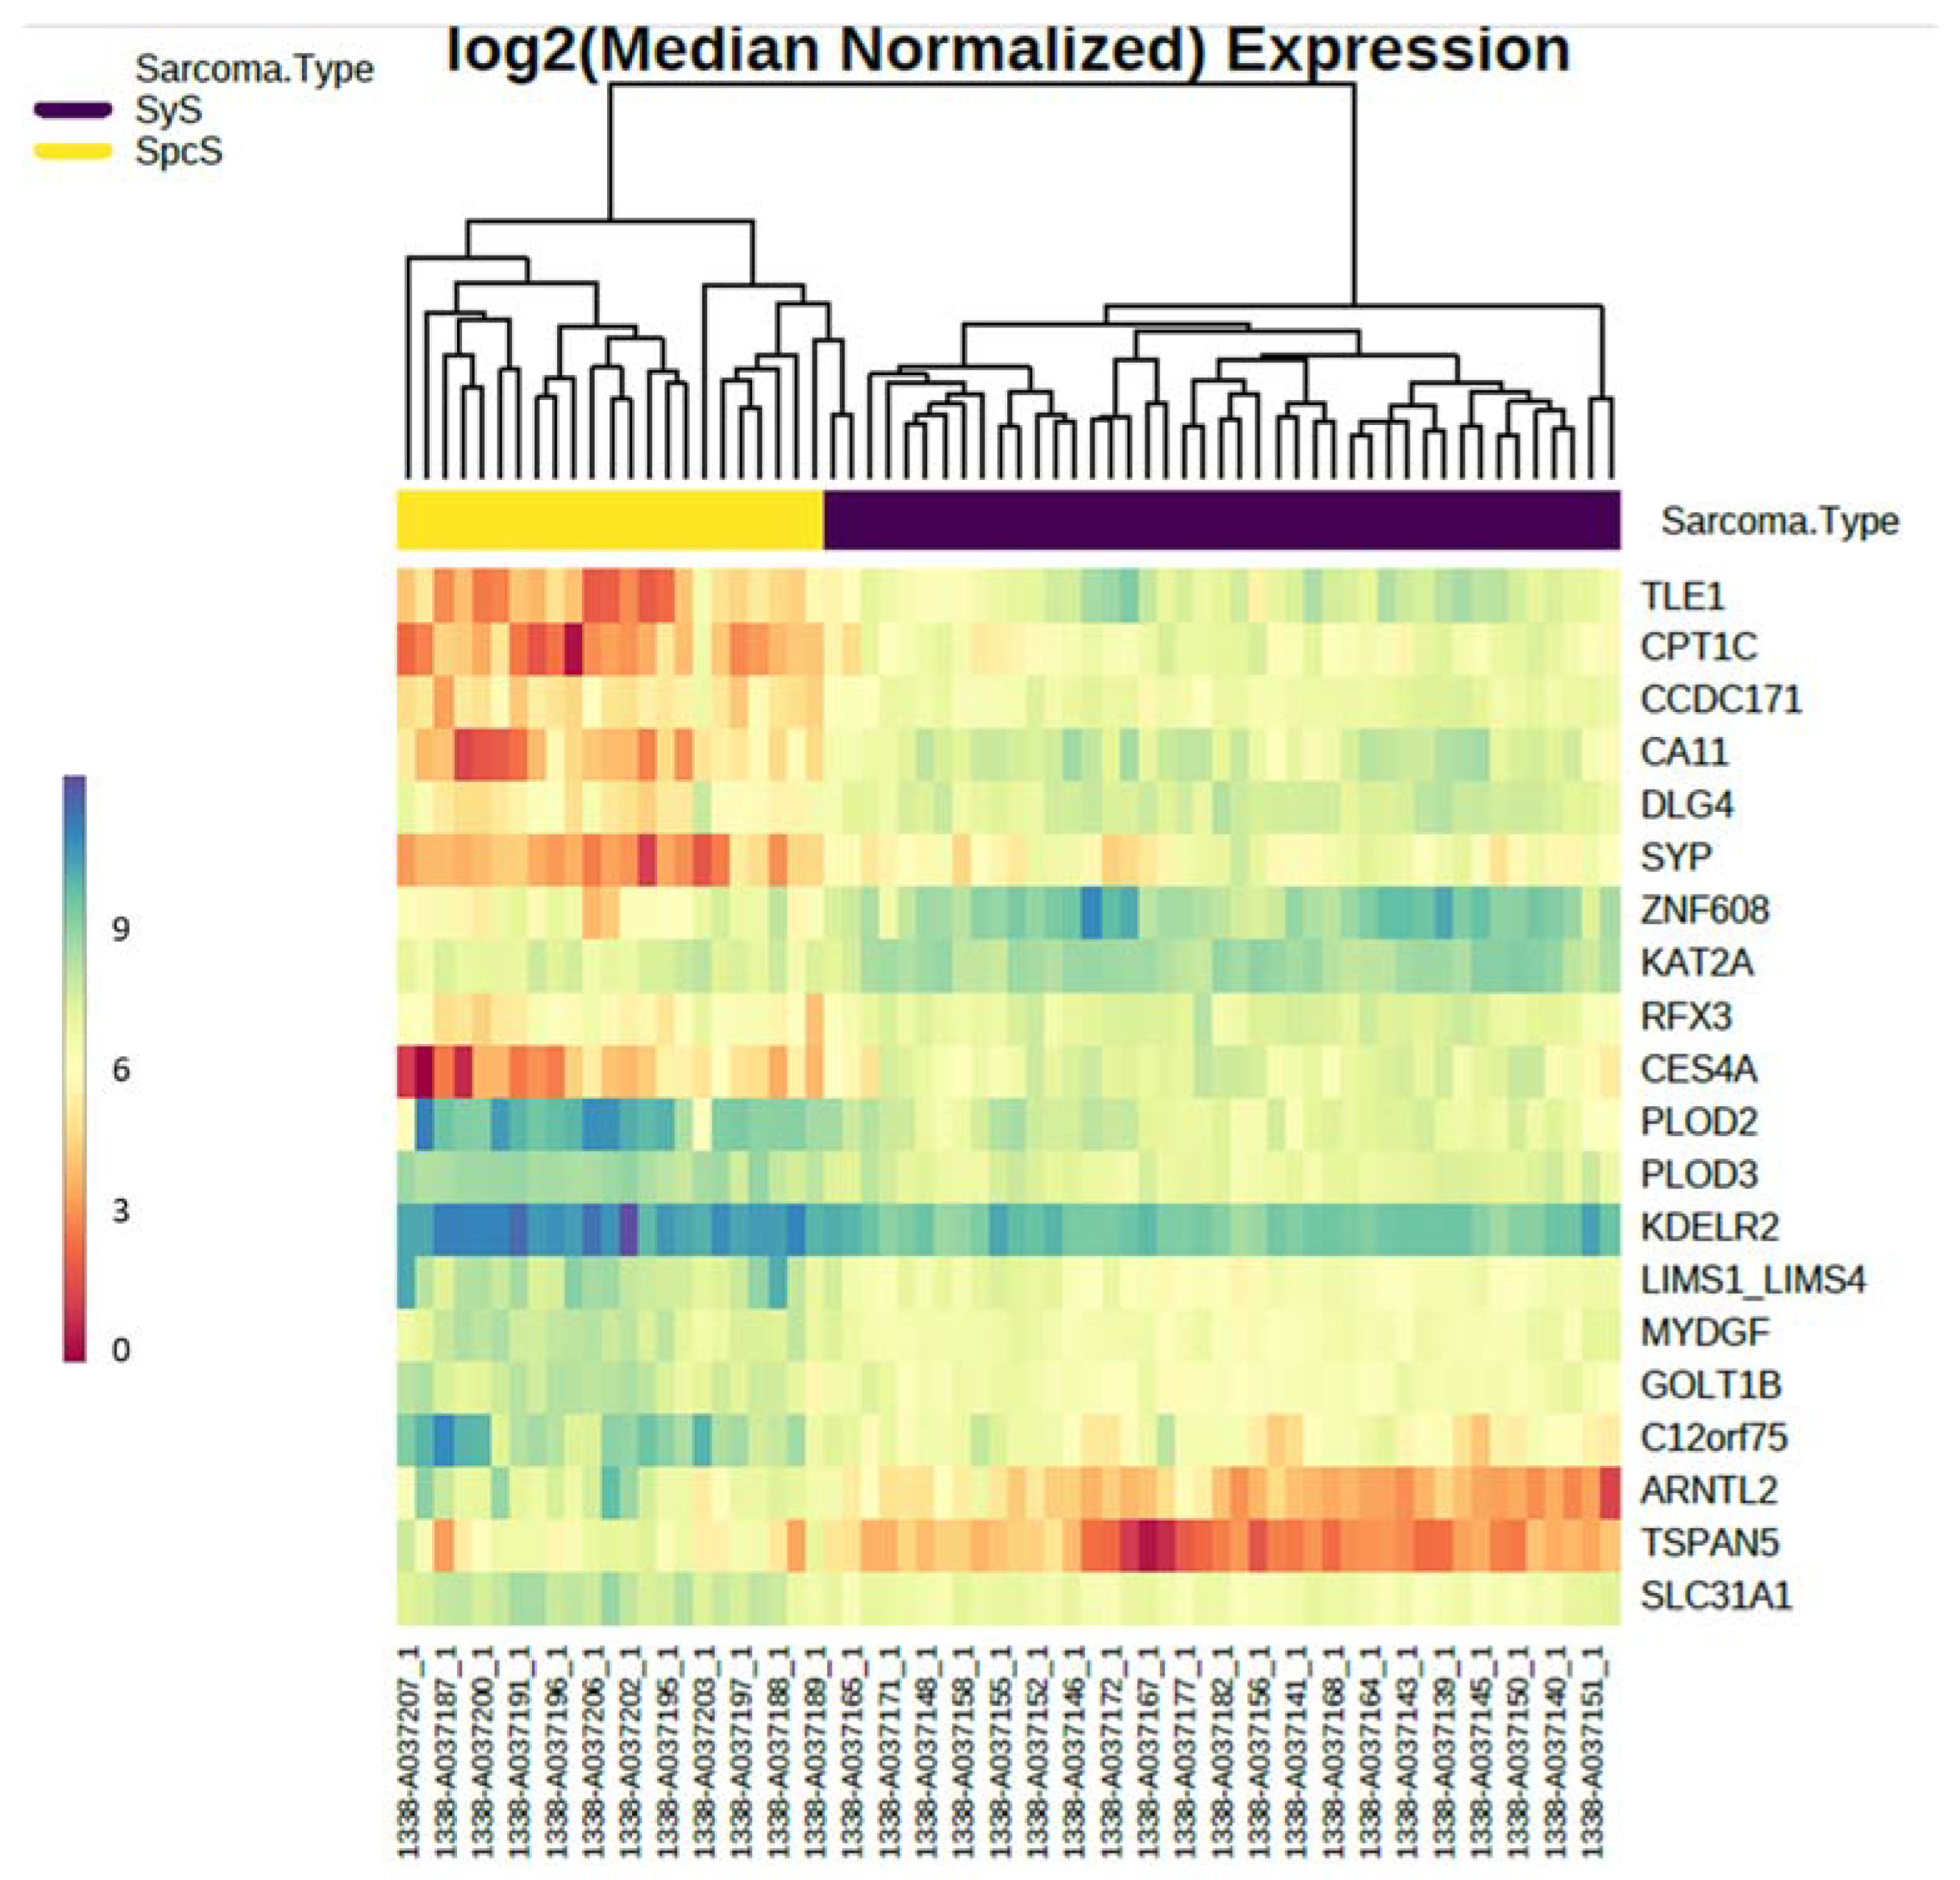
| Probe | Mean Normalized SyS | Mean Normalized SpcS | AveExpr | Fold Change SpcS. Vs. SyS | rawP SpcS. Vs. SyS | adjP SpcS. Vs. SyS |
|---|---|---|---|---|---|---|
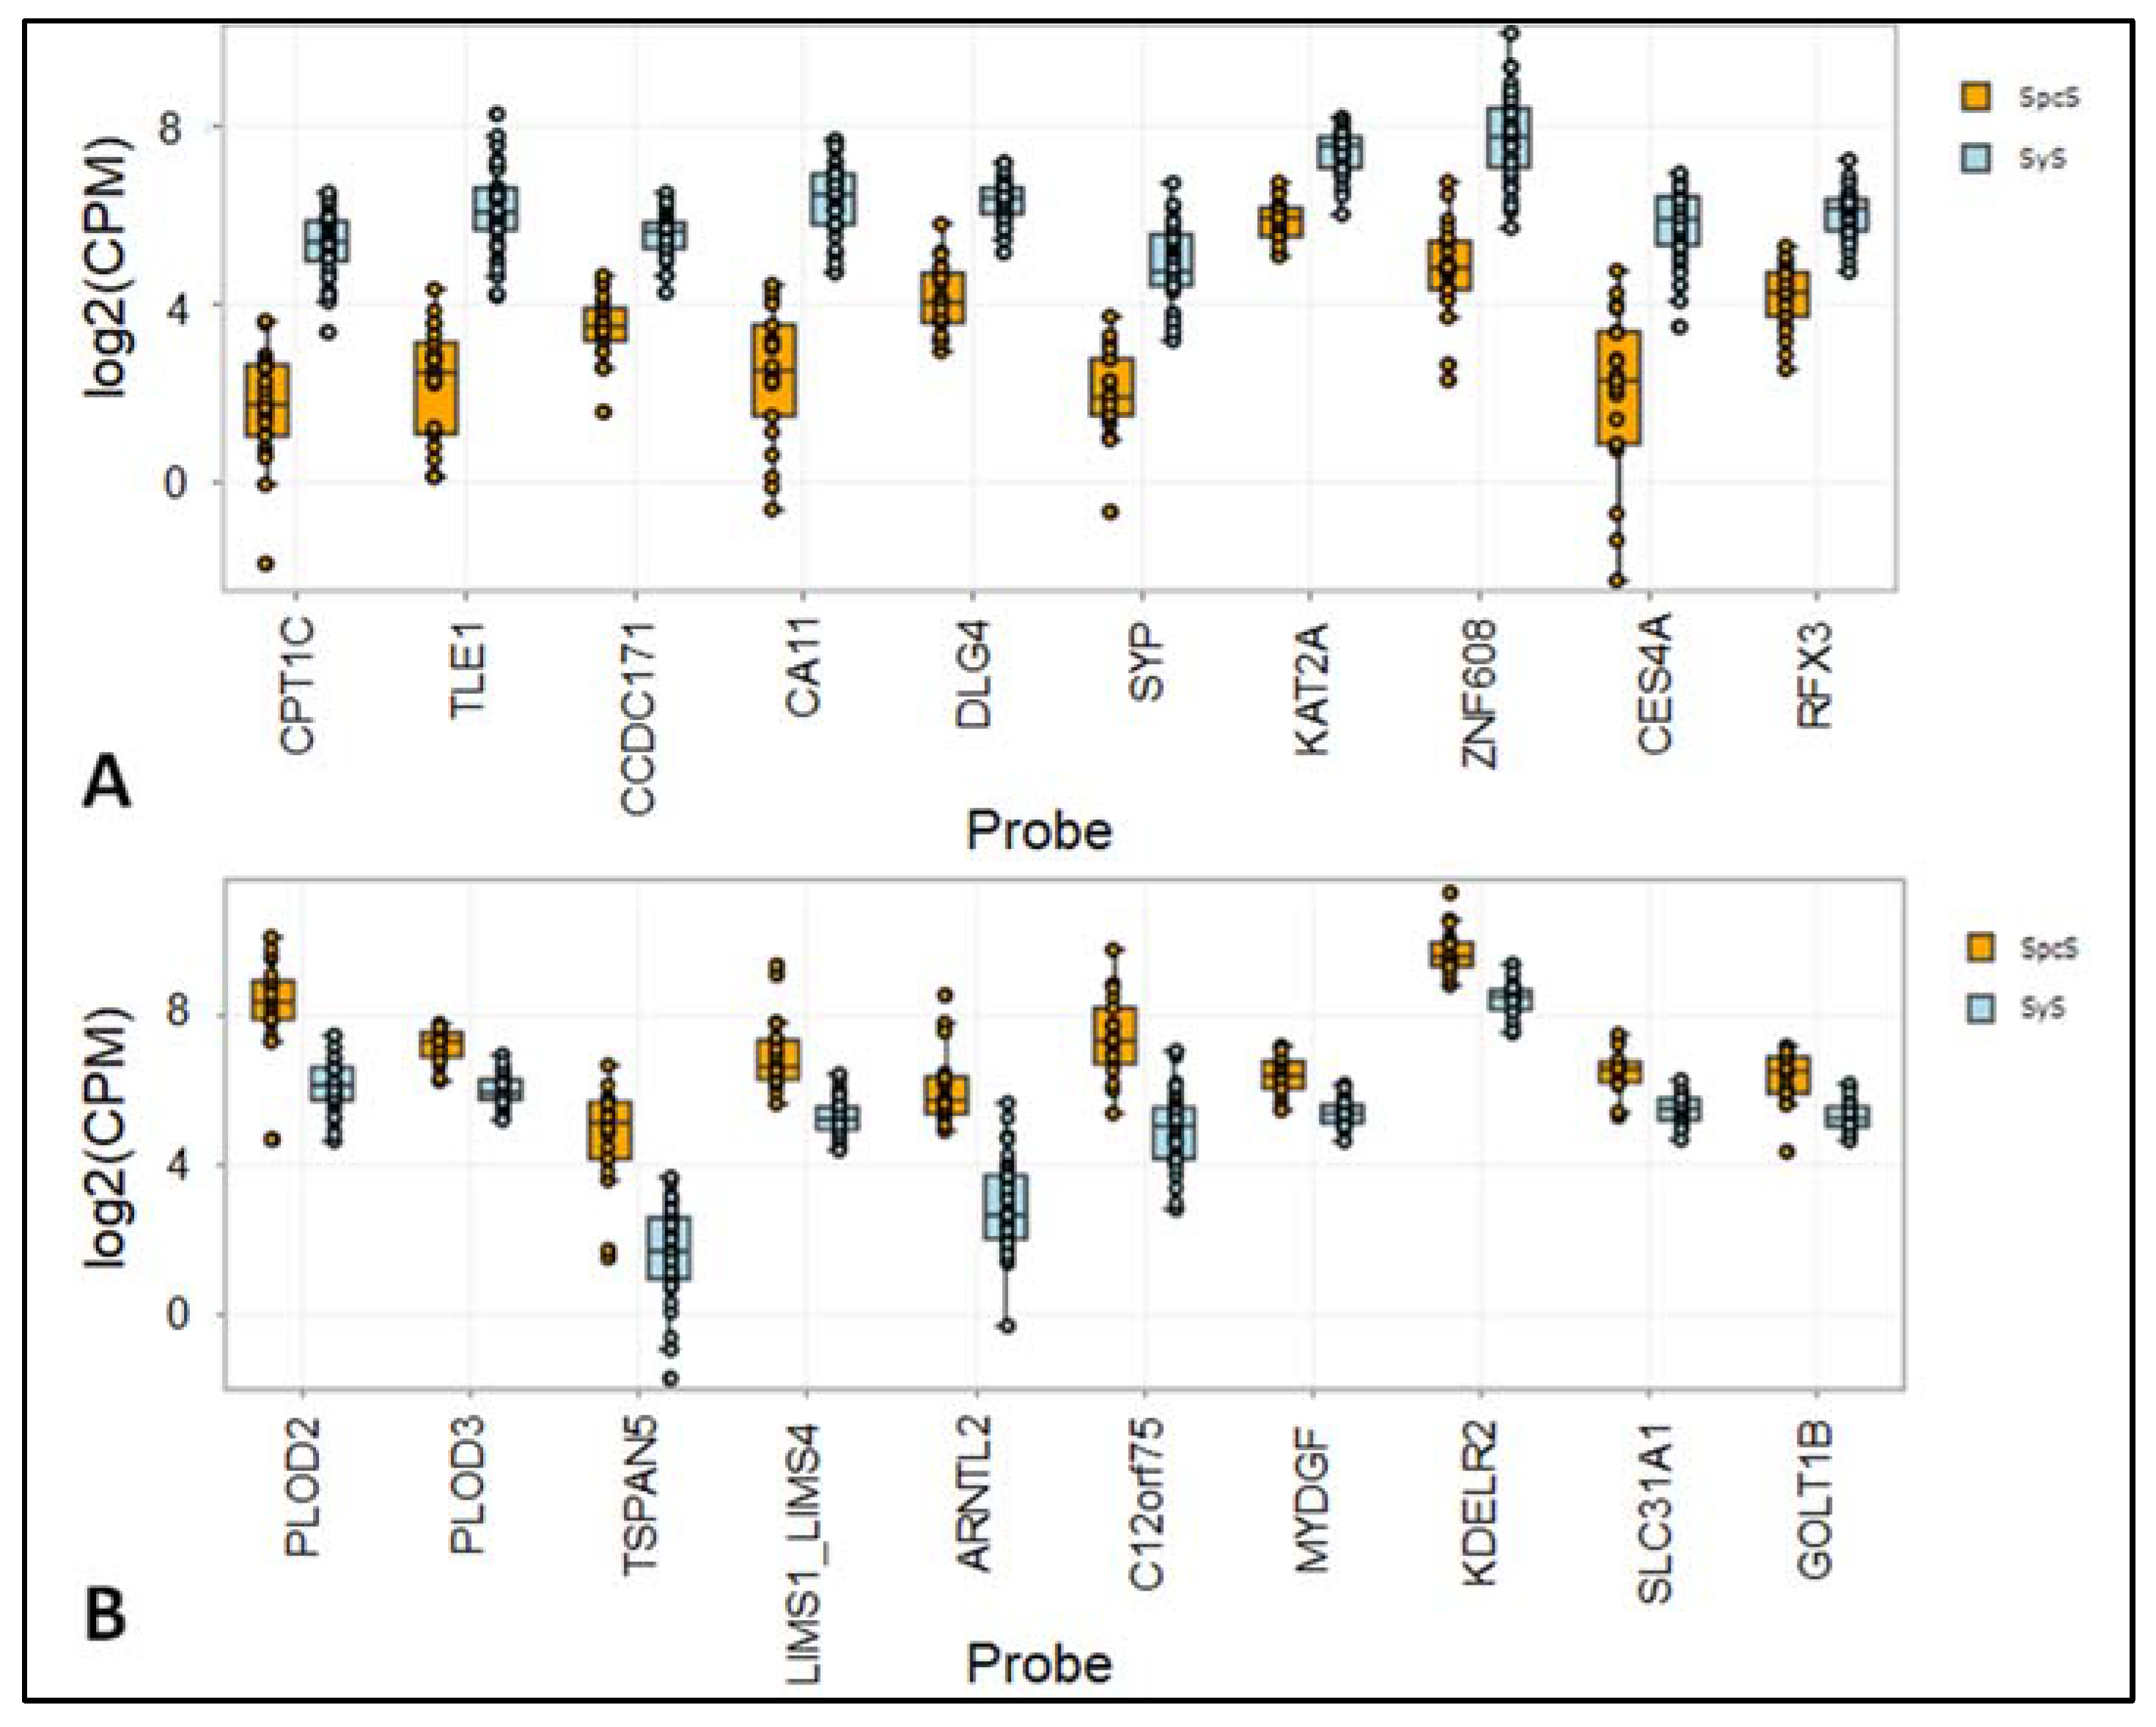
| CPT1C | 769 | 87 | 9.07 | −8.89 | 6.29 × 10−48 | 7.57 × 10−44 |
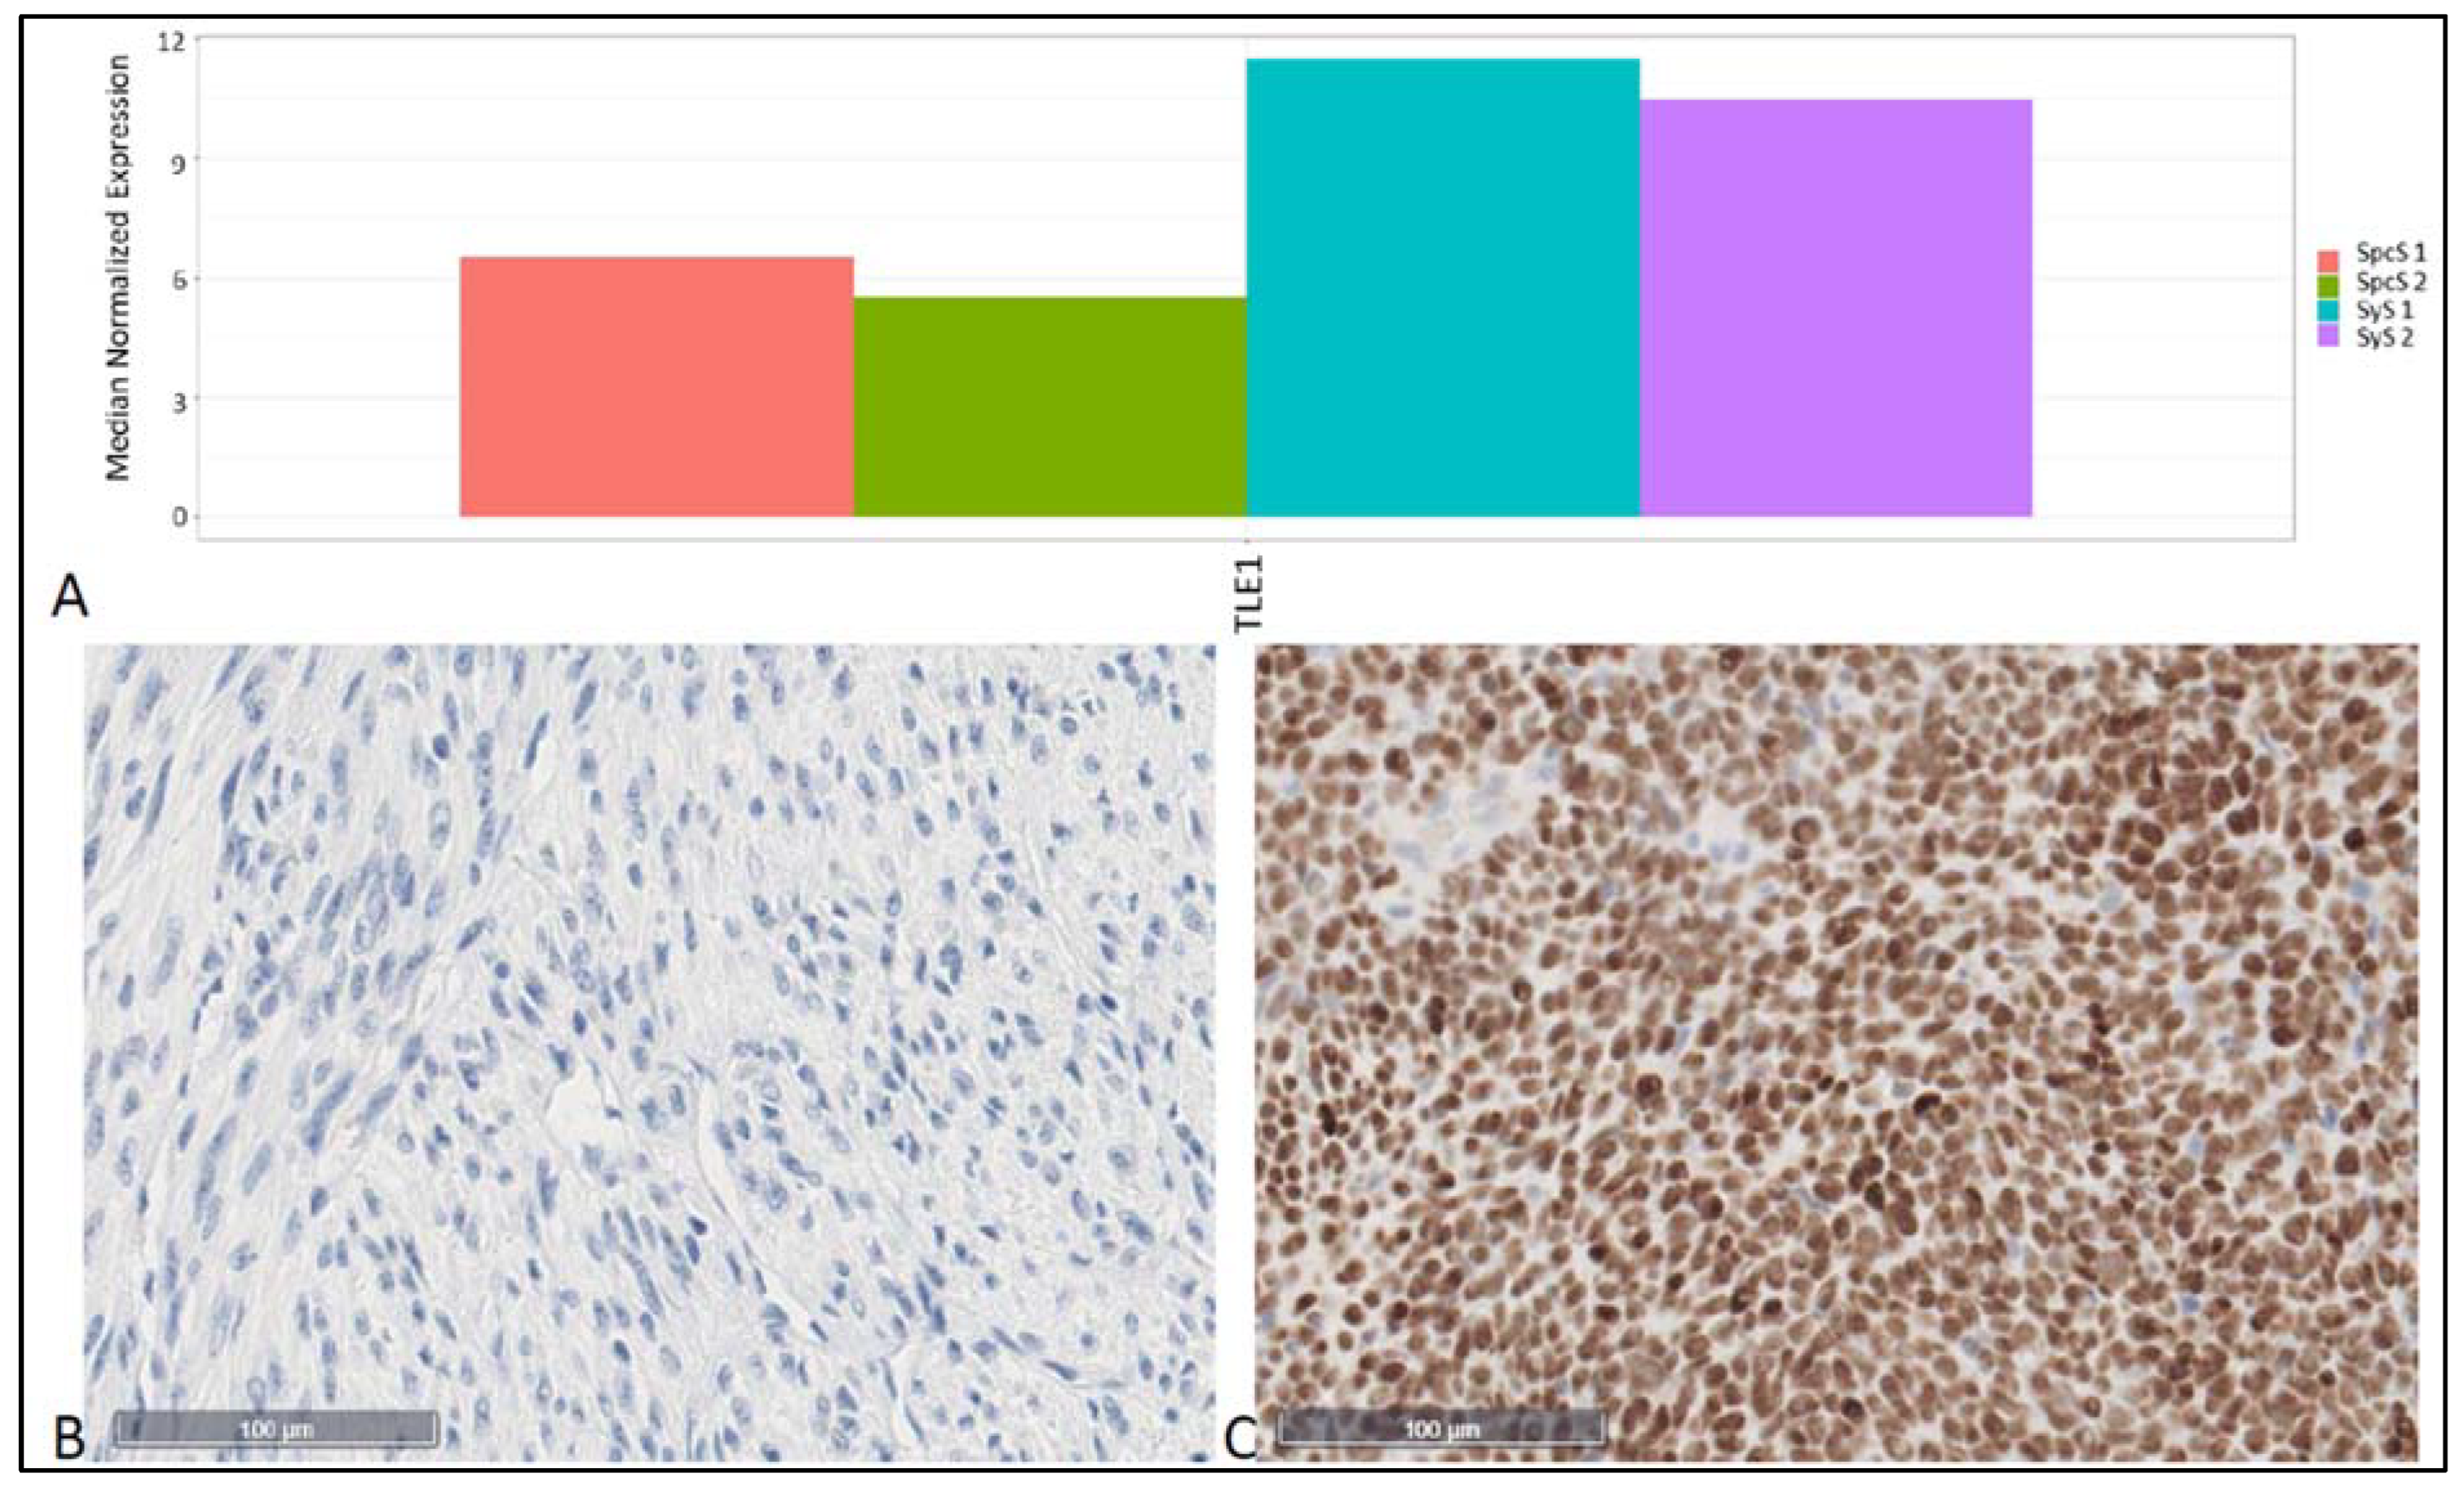
| TLE1 | 1520 | 123 | 10.03 | −12.38 | 1.02 × 10−46 | 6.14 × 10−43 |
| CCDC171 | 870 | 242 | 9.36 | −3.60 | 1.73 × 10−43 | 6.94 × 10−40 |
| CA11 | 1593 | 162 | 10.11 | −9.87 | 2.09 × 10−42 | 6.29 × 10−39 |
| DLG4 | 1472 | 392 | 10.11 | −3.75 | 5.39 × 10−39 | 1.30 × 10⁻³⁵ |
| PLOD2 | 1366 | 8094 | 11.83 | 5.93 | 3.08 × 10−36 | 6.17 × 10⁻³³ |
| PLOD3 | 1170 | 2982 | 10.80 | 2.55 | 1.49 × 10⁻³⁵ | 2.56 × 10⁻³² |
| SYP | 611 | 94 | 8.77 | −6.48 | 1.43 × 10⁻³⁴ | 2.16 × 10⁻³¹ |
| KAT2A | 3135 | 1225 | 11.28 | −2.56 | 1.39 × 10⁻³⁰ | 1.51 × 10⁻²⁷ |
| ZNF608 | 4609 | 691 | 11.68 | −6.67 | 1.50 × 10⁻³⁰ | 1.51 × 10⁻²⁷ |
| Technology | Technology /Platform | Biochemistry | Approx. Throughput | Max. no. probes/Primer Pairs | No. of Mapped ENSG IDs | Read Depths | Input FFPE RNA (ng) | Approx. Cost per Sample (£) | Success Rate of FFPE Samples (n) |
|---|---|---|---|---|---|---|---|---|---|
| 3′ RNA sequencing | Lexogen QuantSeq | RNA → RT, oligodT priming from 3′ end, random priming towards 3′ end → amplification and barcoding → sequencing | 96 samples per 5 days | 55,765 | 25,610 | 10 M | 500 | 90 | 98% (318) |
| QiaSeq UPX 3′ Transcriptome | RNA → RT, oligodT priming for cDNA synthesis →template switching for 2nd strand synthesis priming → fragmentation → end repair addition, adapter ligation → PCR to add indices → sequencing | 96 samples per 5 days | 42,553 | 20,000 | 15 M | 10 | 50 | 94% (48) | |
| Specific Targeted Sequencing | BioSpyder TempO-Seq | RNA → annealed 50 bp detector oligos are ligated then amplified and barcoded → sequencing | 192 samples per 4 days | 19,300 | 19,300 | 12 M | 20 μm FFPE Section | 160 | 95% (38) |
| Ion Ampliseq Transcriptome | RNA → RT, multiplex PCR → sequence barcoding → emulsion PCR → sequencing of ~150 bp Targets | 96 samples per 5 days | 20,802 | 19,059 | 8 M | 10 | 160 | 76% (76) | |
| HTG Edge Seq, Illumina Next Seq 500 | FFPE slide → nuclease protection and probe hybridization → S1 nuclease digestion → barcoding and amplification → Library Cleanup → sequencing → Data Parsing | 24 samples per 3 days | 19,398 | 19,398 | 8 M | 11 mm2 on a 10 µm FFPE section | 1159,095 | 96.88 (64) | |
| Targeted Probes | Nanostring | RNA → hybridisation to fluorescent barcoded probes in solution → immobilised in nCounter cartridge → scan | 12 samples per day (800 genes) | 800 | 800 | N/A | 50 | 250 | 100% (12) |
| Newer Microarray | Affymetrix Clariom S | RNA → cRNA amplification → hybridisation to GeneChip → scan | 192 samples per 4 days | 211,300 | >20,000 | N/A | 50 | 100 | 100% (8) |
| Traditional Microarray | Affymetrix U133A | 192 per day | 250,833 | 11,827 | N/A | 50 | 360 | 100% (286) | |
| Illumina BeadChip HT12 v3/v4 | RNA → RT, amplification, biotinylation (NuGEN WT Ovation kit) → hybridisation to 50 bp probes on chip → scan | 96 samples per 1.5 days | 47,323 | 22,571 | N/A | 1500 | 195 | 21% (206) | |
| Full RNA Sequencing | RNA-seq | RNA → fragmentation → RT → barcoded library construction → genome-wide full RNA sequencing | 8 samples per 5 days | 20,025 | 18,571 | 136 M paired reads | 2000 | 250-500 | 100% (87) |
Publisher’s Note: MDPI stays neutral with regard to jurisdictional claims in published maps and institutional affiliations. |
© 2022 by the authors. Licensee MDPI, Basel, Switzerland. This article is an open access article distributed under the terms and conditions of the Creative Commons Attribution (CC BY) license (https://creativecommons.org/licenses/by/4.0/).
Share and Cite
Borchert, S.; Herold, T.; Kalbourtzis, S.; Hamacher, R.; Krause, Y.; Berger, S.; Guder, W.K.; Streitbuerger, A.; Hardes, J.; Goetz, M.; et al. Transcriptome-Wide Gene Expression Profiles from FFPE Materials Based on a Nuclease Protection Assay Reveals Significantly Different Patterns between Synovial Sarcomas and Morphologic Mimickers. Cancers 2022, 14, 4737. https://doi.org/10.3390/cancers14194737
Borchert S, Herold T, Kalbourtzis S, Hamacher R, Krause Y, Berger S, Guder WK, Streitbuerger A, Hardes J, Goetz M, et al. Transcriptome-Wide Gene Expression Profiles from FFPE Materials Based on a Nuclease Protection Assay Reveals Significantly Different Patterns between Synovial Sarcomas and Morphologic Mimickers. Cancers. 2022; 14(19):4737. https://doi.org/10.3390/cancers14194737
Chicago/Turabian StyleBorchert, Sabrina, Thomas Herold, Stavros Kalbourtzis, Rainer Hamacher, Yvonne Krause, Sophia Berger, Wiebke K. Guder, Arne Streitbuerger, Jendrik Hardes, Moritz Goetz, and et al. 2022. "Transcriptome-Wide Gene Expression Profiles from FFPE Materials Based on a Nuclease Protection Assay Reveals Significantly Different Patterns between Synovial Sarcomas and Morphologic Mimickers" Cancers 14, no. 19: 4737. https://doi.org/10.3390/cancers14194737