
Could 18-FDG PET-CT Radiomic Features Predict the Locoregional Progression-Free Survival in Inoperable or Unresectable Oesophageal Cancer?

 ,
,
Abstract
:Simple Summary
Abstract
1. Introduction
2. Materials and Methods
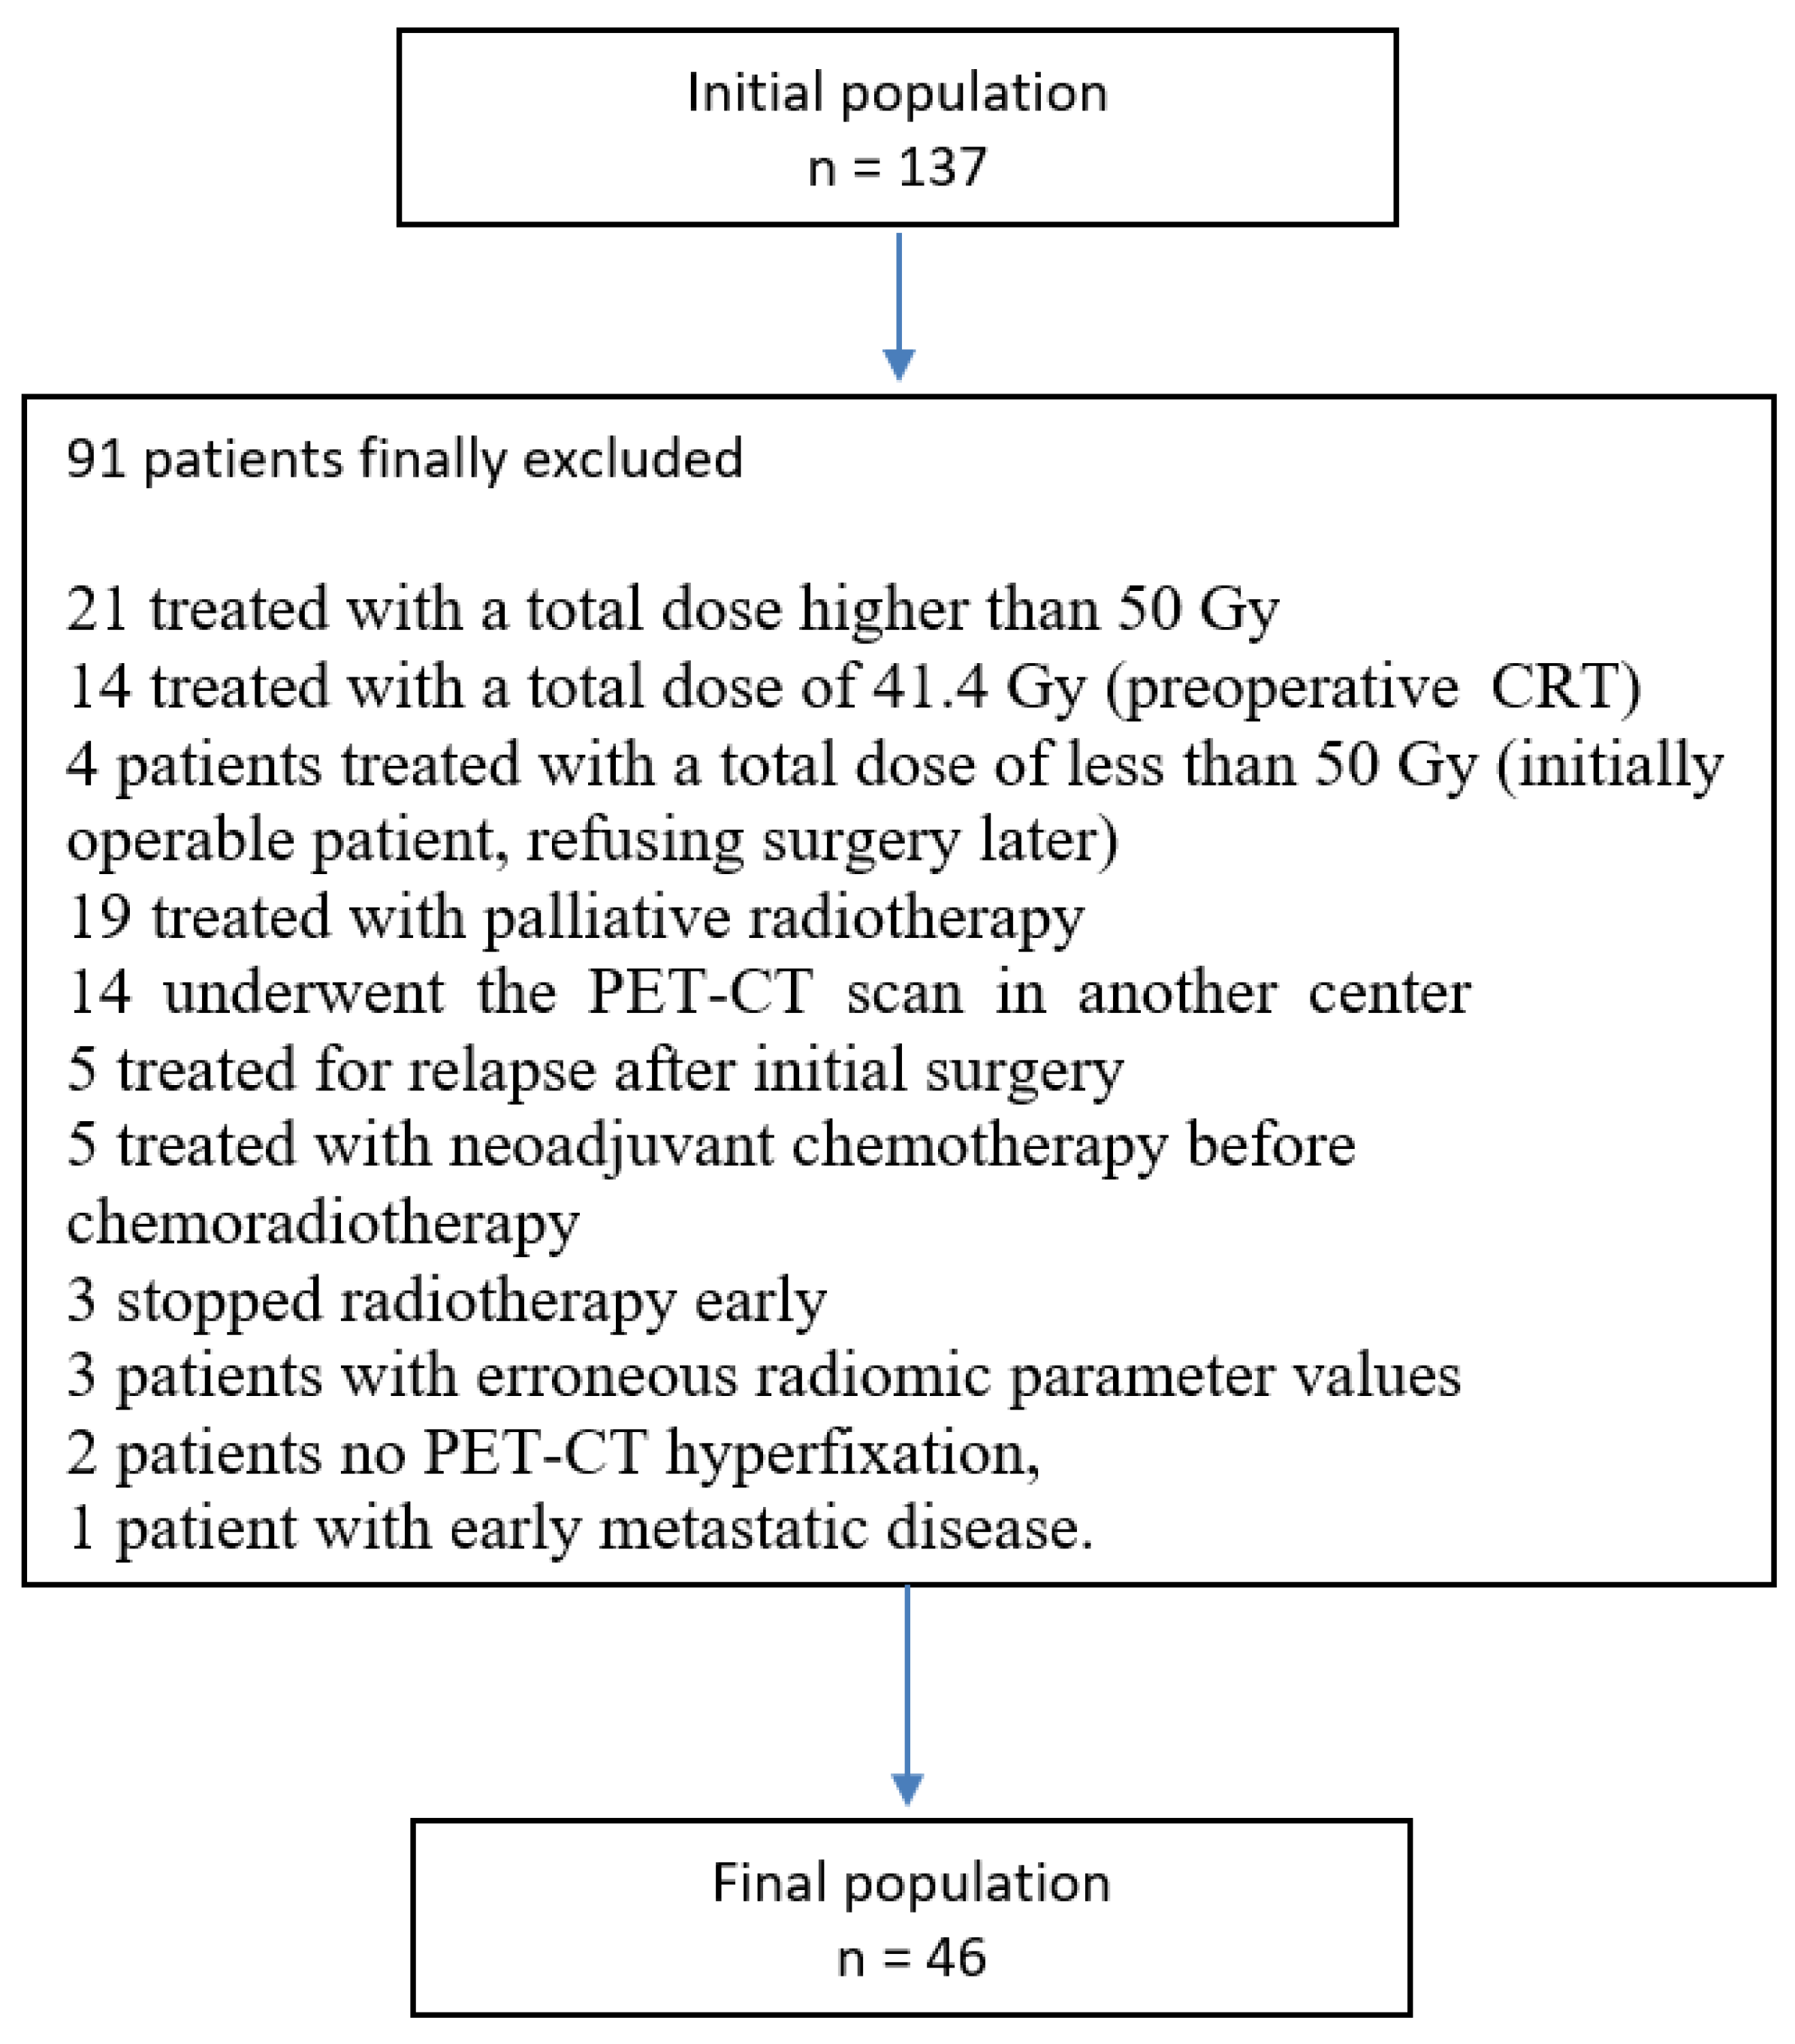
2.1. Population
2.2. PET-CT Acquisition Technique
2.3. Chemoradiotherapy Schedule
- -
- CTV 1 = T and N GTV + perioesophageal interfaces and nodal drainage (depending on the tumour localisation in the oesophagus) + 5 cm in the cranio-caudal direction;
- -
- CTV 2 = T and N GTV + perioesophageal interfaces and nodal drainage (depending on the tumour localisation in the oesophagus) + 3 cm in the cranio-caudal direction.
2.4. Delineation of the Metabolic Volumes Studied on PET-CT and Extraction of Radiomic Parameters
2.5. Statistical Methods and Endpoints
2.6. Strategy for Radiomic Parameter Analysis
2.6.1. Step 1: Correlation Analysis for Parameters Selection
2.6.2. Step 2: Hierarchical Clustering on Parameters Selected
2.6.3. Step 3: PCA on Selected Parameters
2.6.4. Step 4: Sensitivity Analysis on All Parameters
3. Results
3.1. Description of the Population
3.2. Radiomic Parameter Analysis
3.2.1. Step 1: Correlation Analysis for Parameter Selection
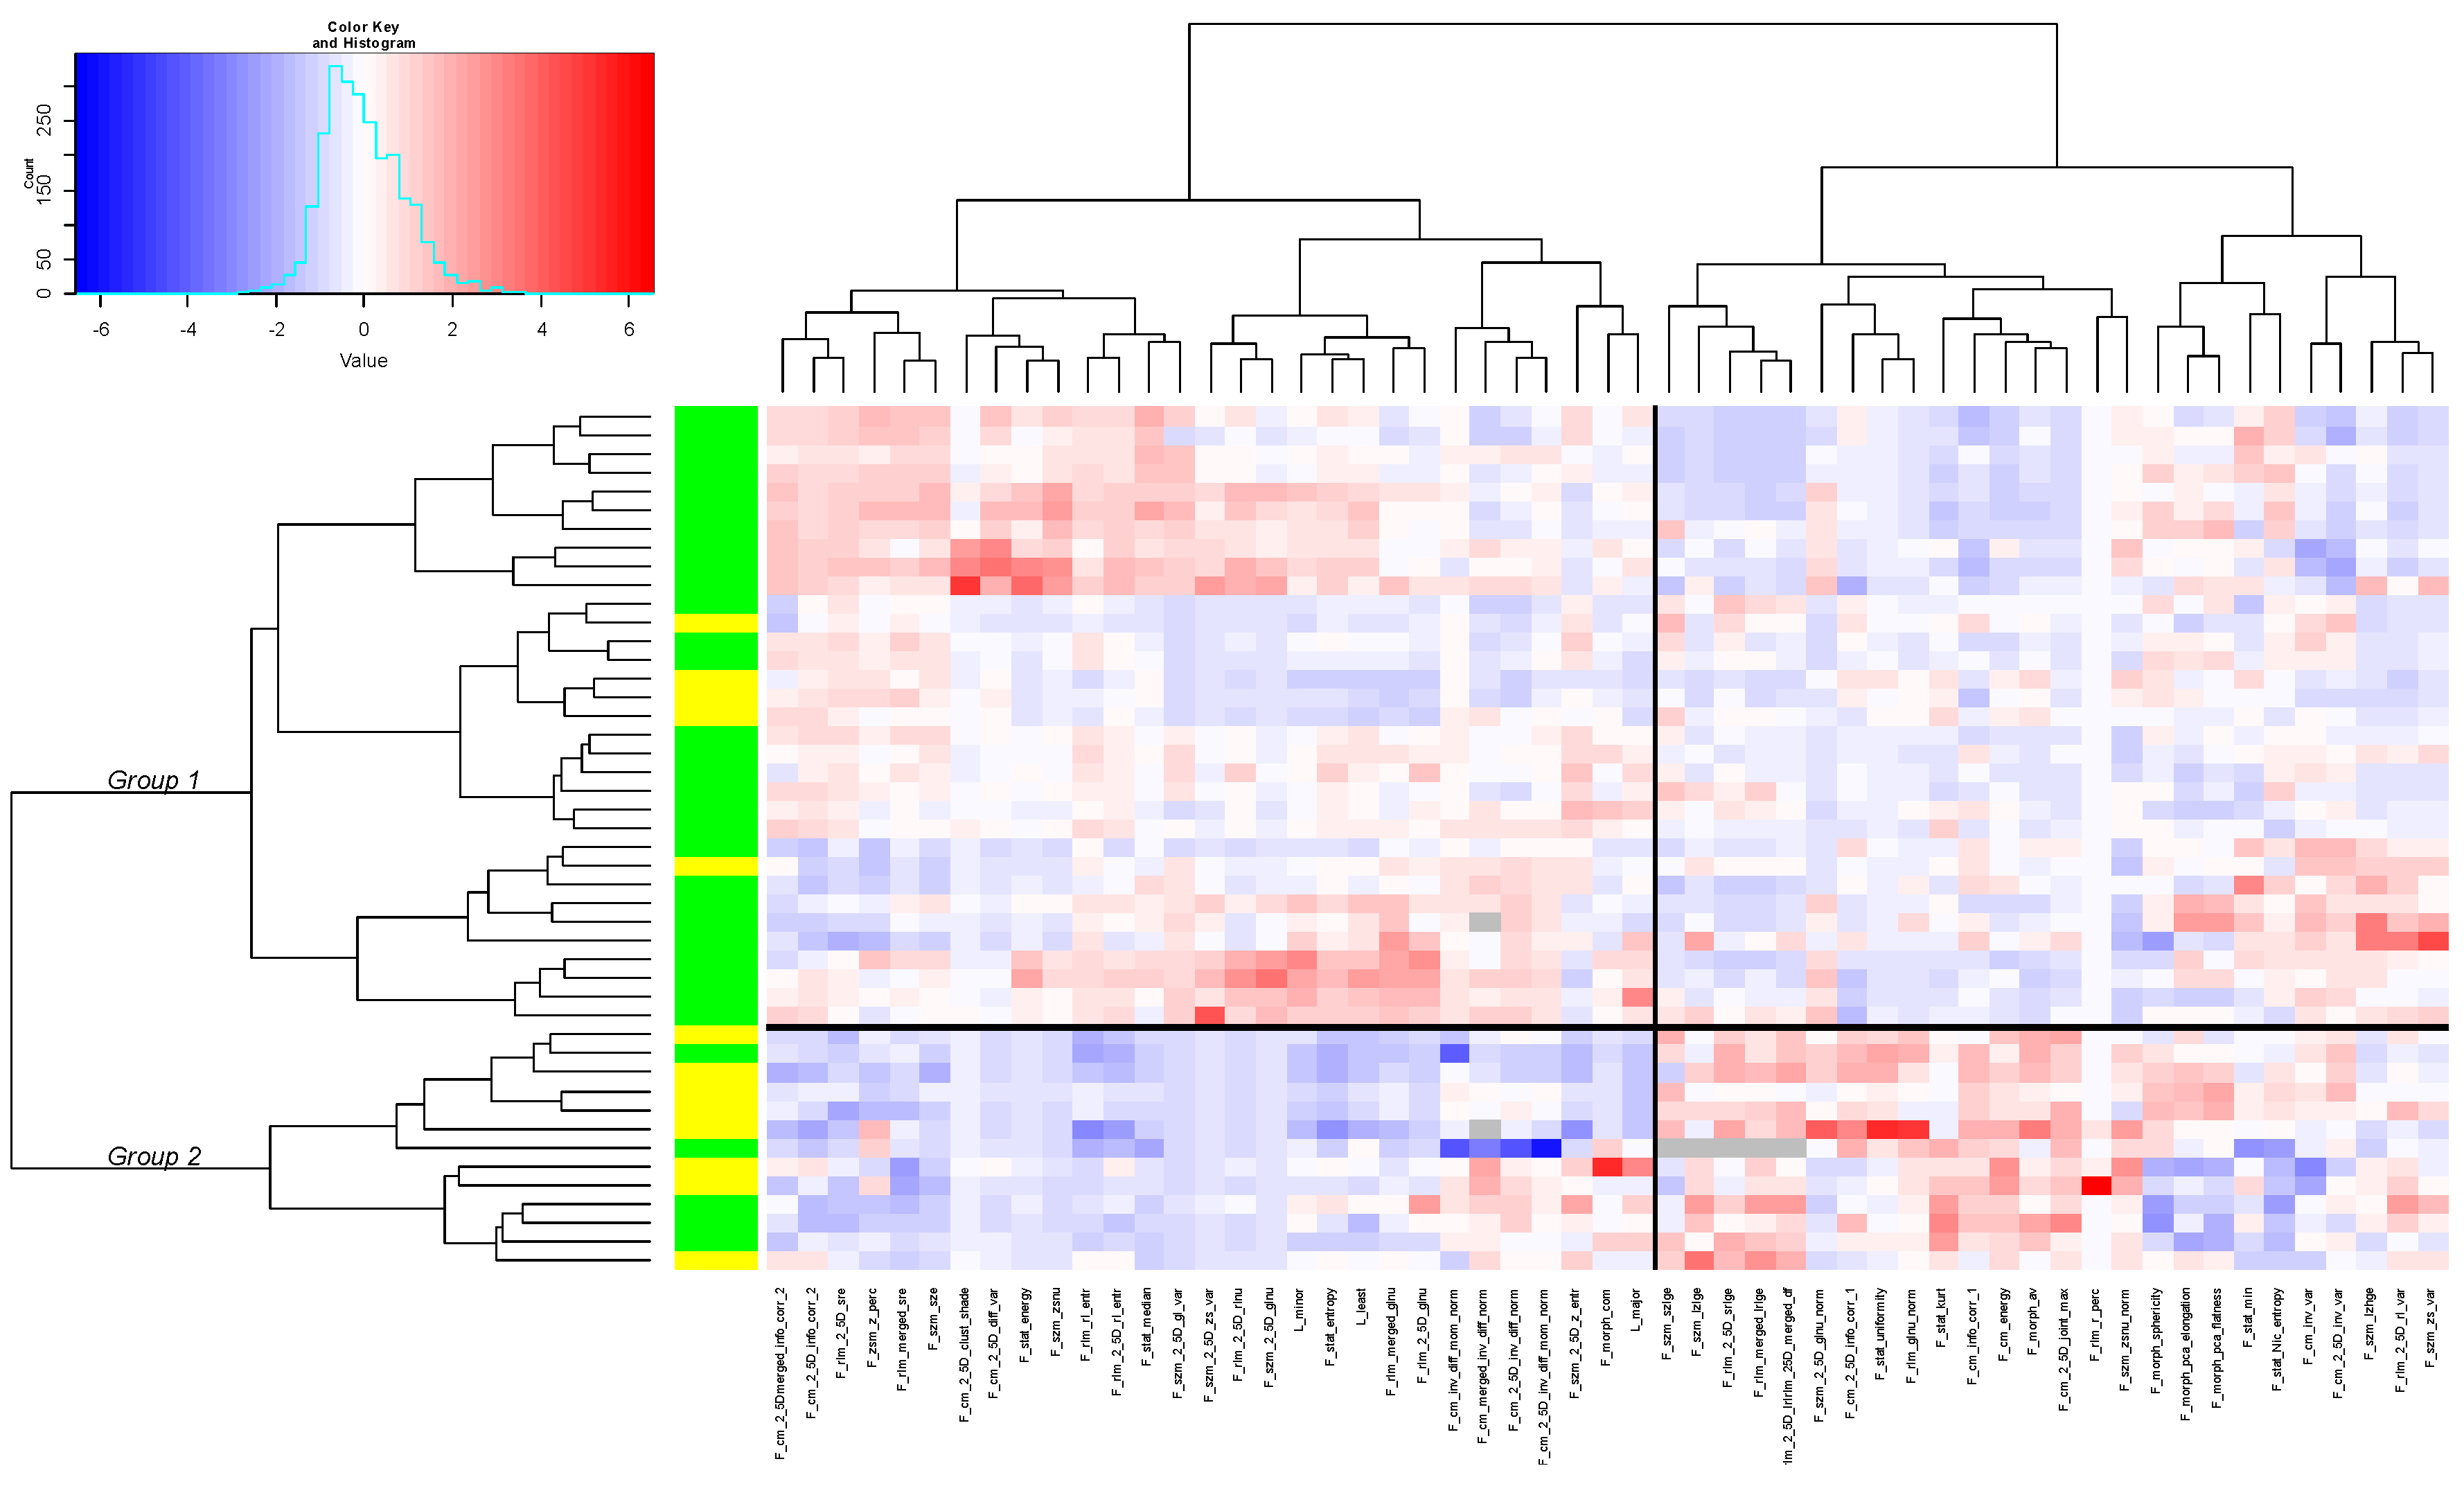
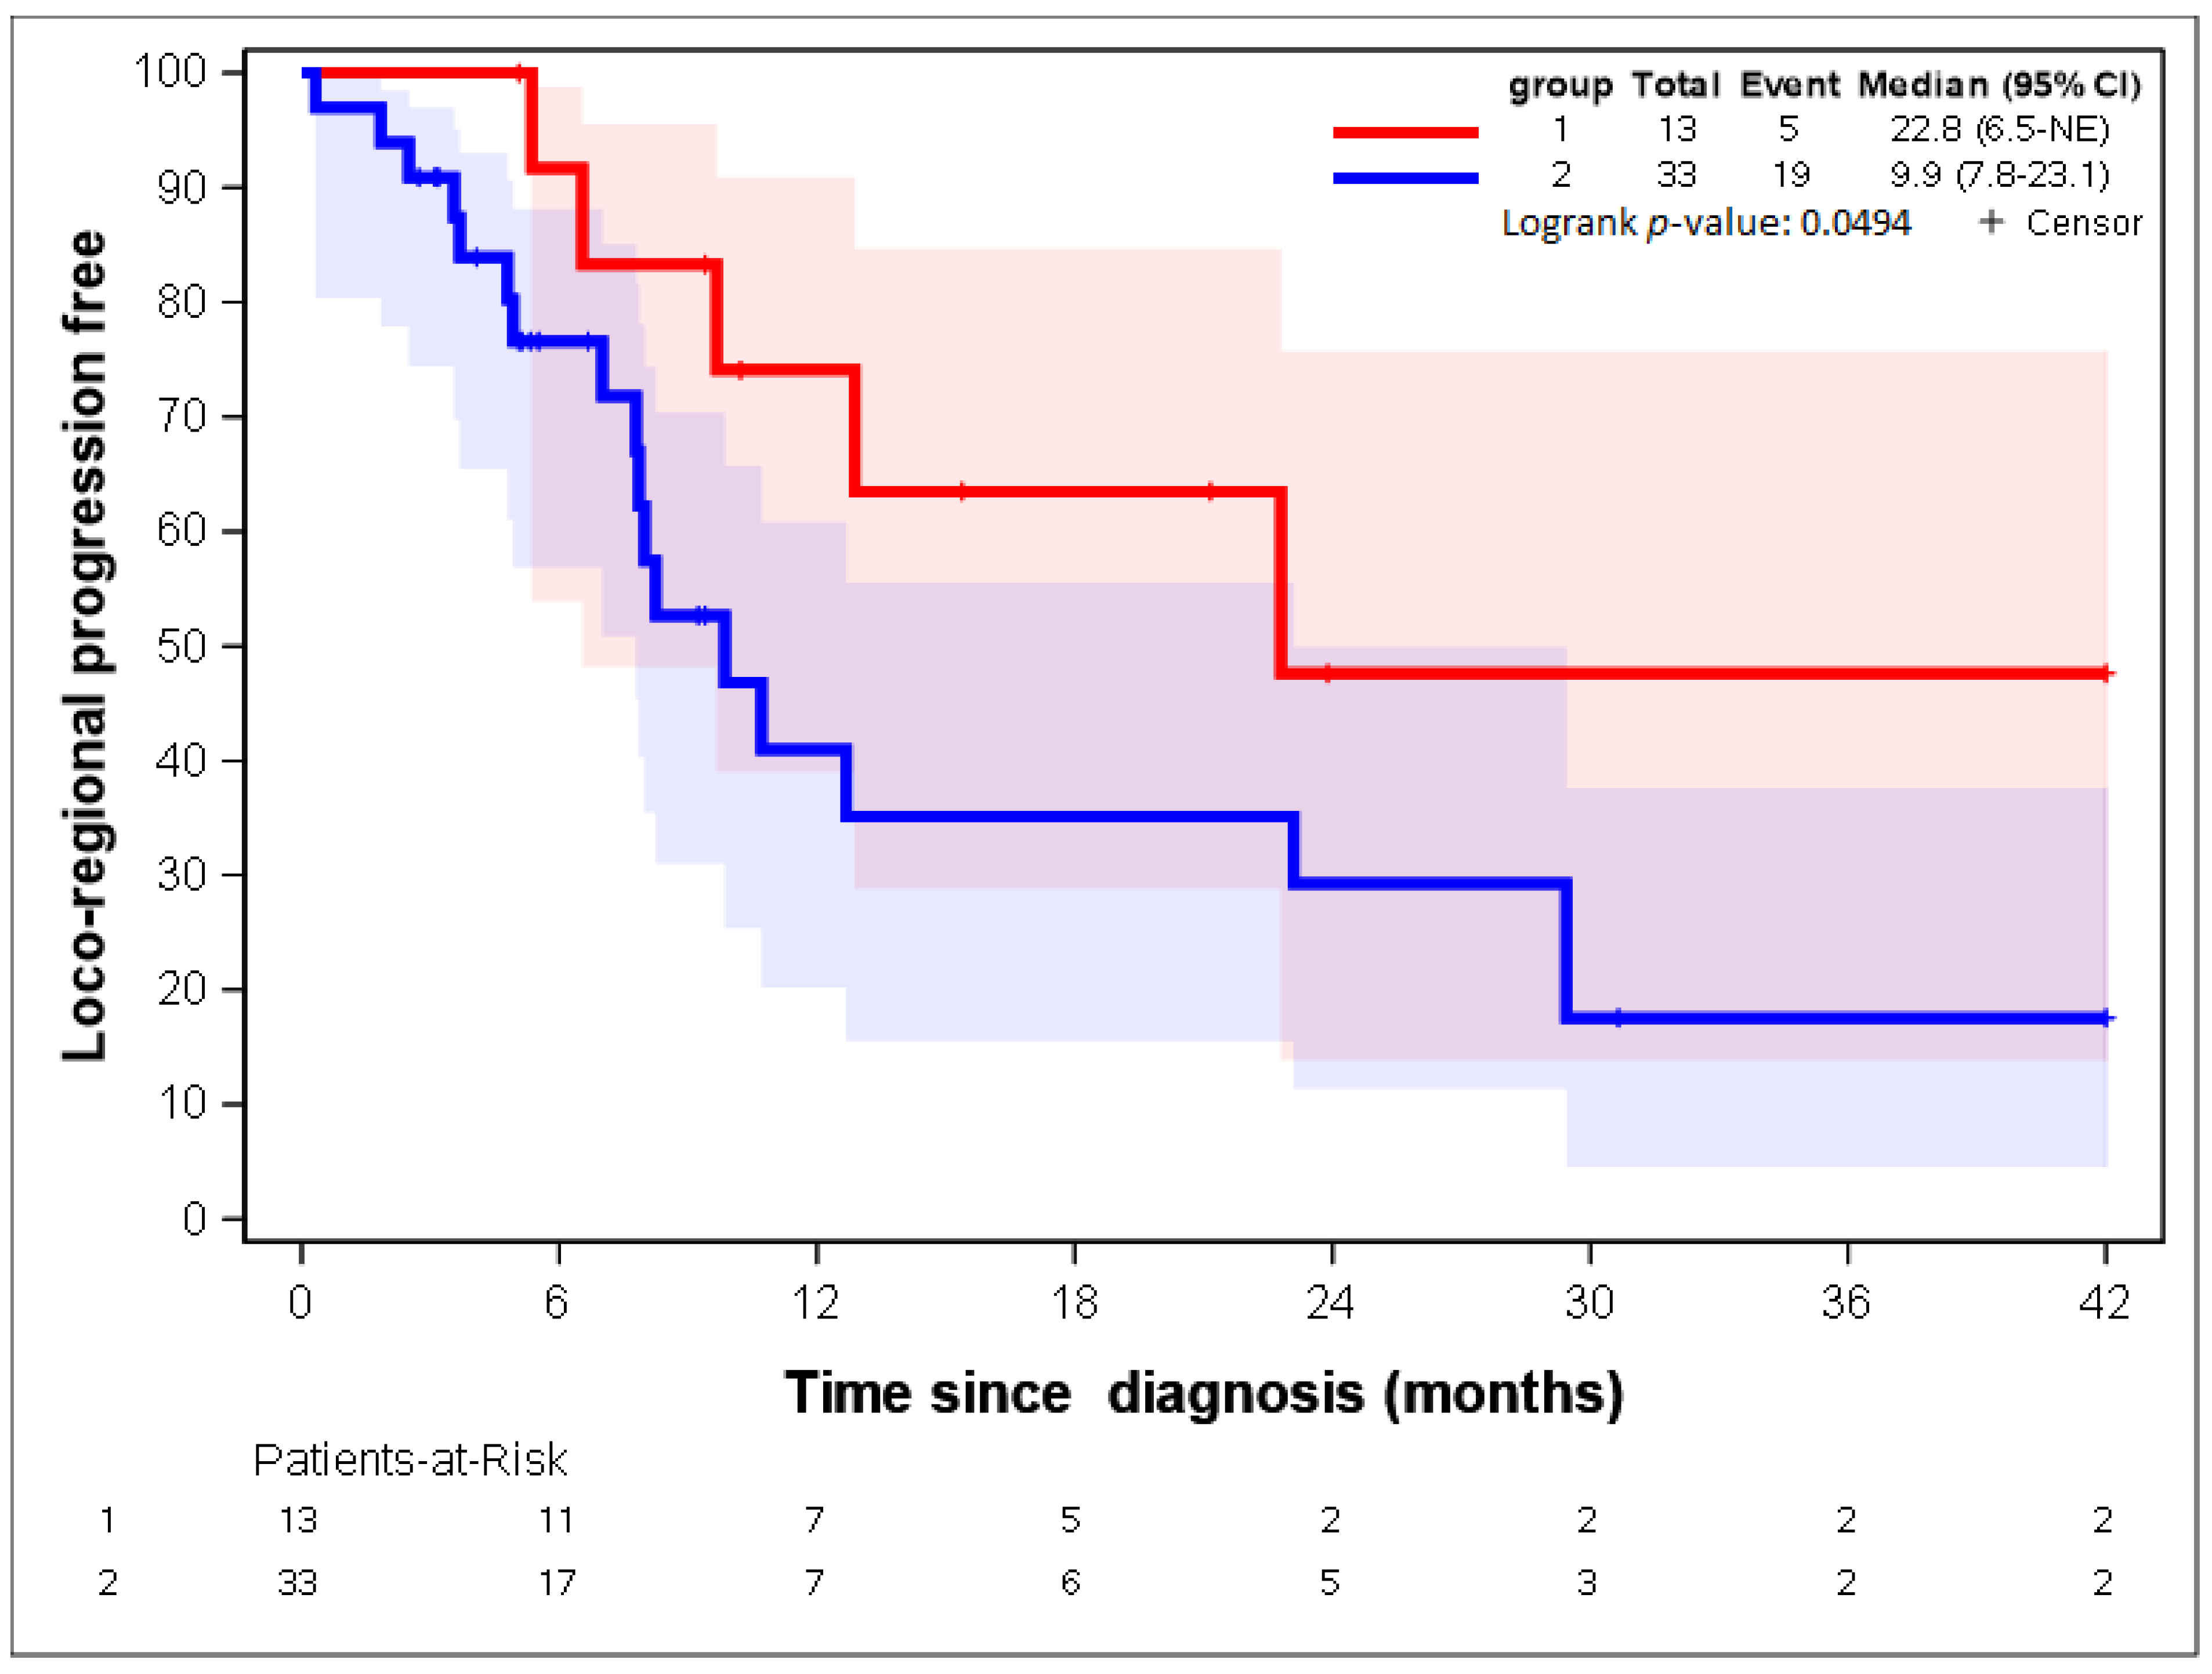
3.2.2. Step 2: Hierarchical Clustering on Parameters Selected
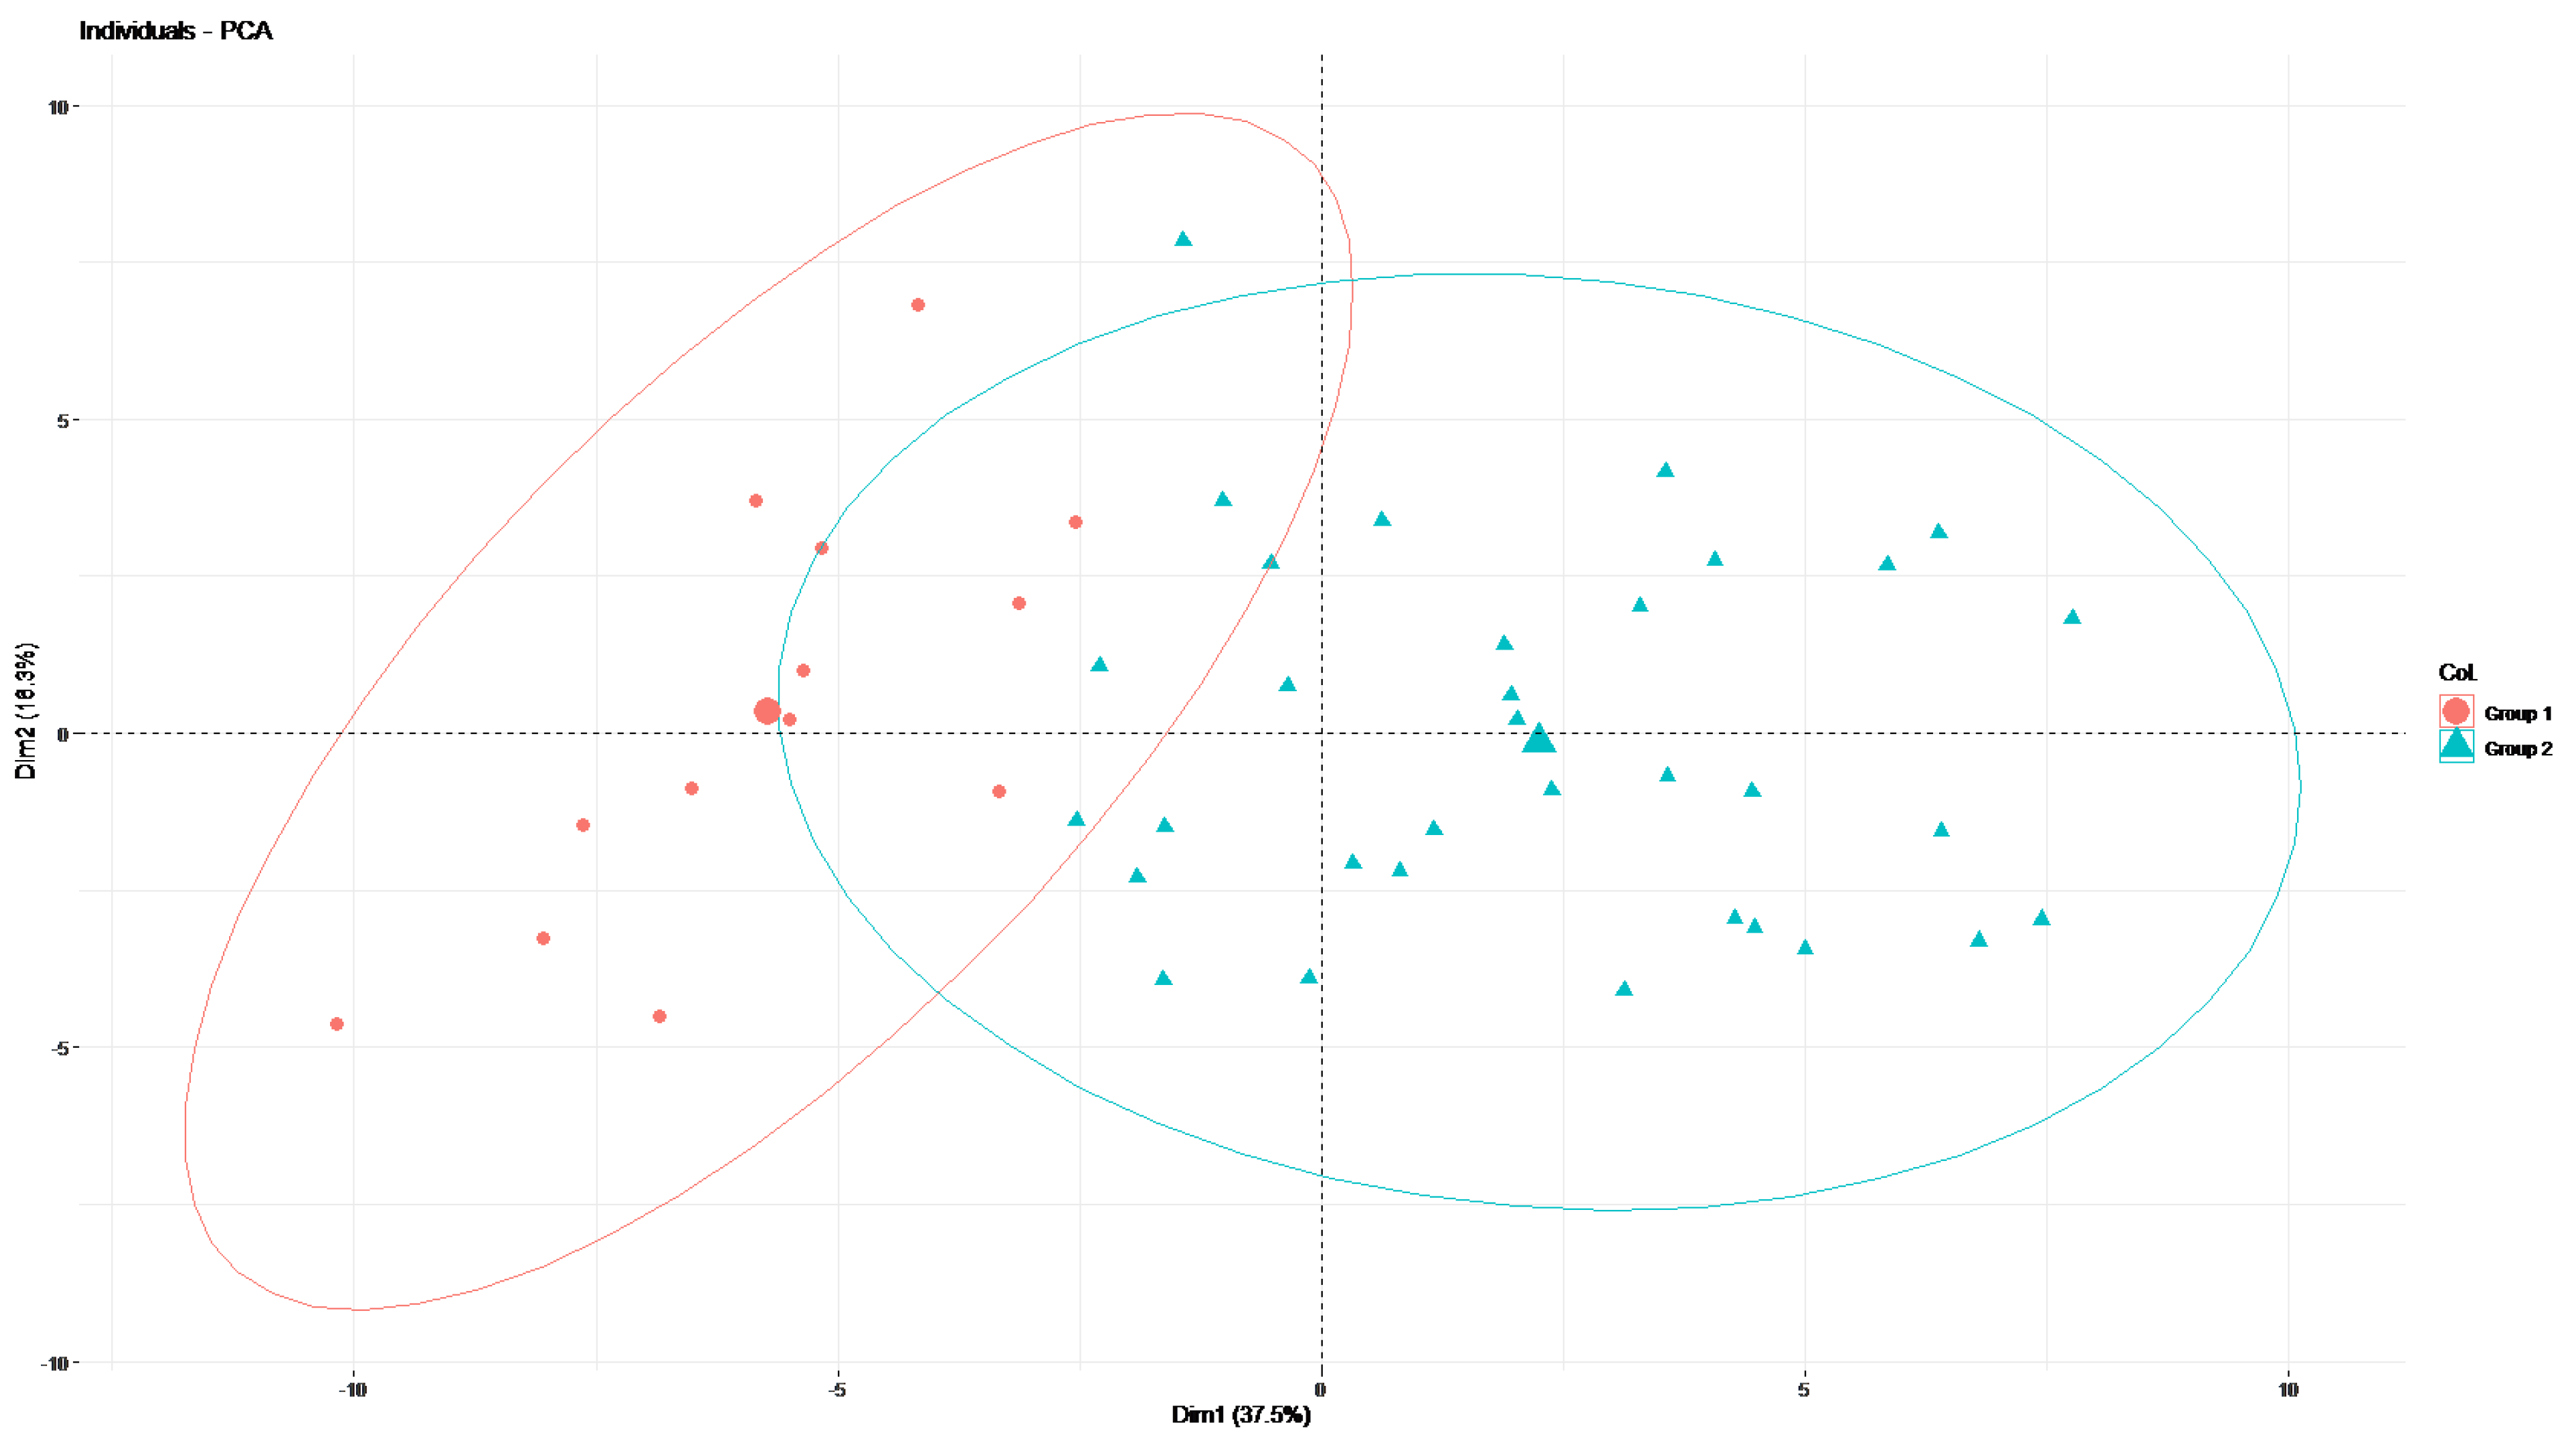
3.2.3. Step 3: PCA on Selected Parameters (55 Radiomic Parameters and 46 Patients)
3.3. Sensitivity Analysis
4. Discussion
5. Conclusions
Supplementary Materials
Author Contributions
Funding
Institutional Review Board Statement
Informed Consent Statement
Data Availability Statement
Conflicts of Interest
References
- American Cancer Society. Cancer Facts & Figures 2022; American Cancer Society: Atlanta, GA, USA, 2022; Available online: https://www.cancer.org/content/dam/cancer-org/research/cancer-facts-and-statistics/annual-cancer-facts-and-figures/2022/2022-cancer-facts-and-figures.pdf (accessed on 19 April 2022).
- Rossi, S.; Baili, P.; Capocaccia, R.; Caldora, M.; Carrani, E.; Minicozzi, P.; Pierannunzio, D.; Santaquilani, M.; Trama, A.; Allemani, C.; et al. The EUROCARE-5 study on cancer survival in Europe 1999–2007: Database, quality checks and statistical analysis methods. Eur. J. Cancer 2015, 51, 2104–2119. [Google Scholar] [CrossRef] [PubMed]
- NCCN Guidelines for Esophageal and Esophagogastric Junction Cancers. Available online: https://www.nccn.org/professionals/physician_gls/pdf/esophageal.pdf (accessed on 19 April 2022).
- Van Hagen, P.; Hulshof, M.C.C.M.; van Lanschot, J.J.B.; Steyerberg, E.W.; van Berge Henegouwen, M.I.; Wijnhoven, B.P.L.; Richel, D.J.; Nieuwenhuijzen, G.A.P.; Hospers, G.A.P.; Bonenkamp, J.J.; et al. Preoperative Chemoradiotherapy for Oesophageal or Junctional Cancer. N. Engl. J. Med. 2012, 366, 2074–2084. [Google Scholar] [CrossRef]
- Shapiro, J.; van Lanschot, J.J.B.; Hulshof, M.C.C.M.; van Hagen, P.; van Berge Henegouwen, M.I.; Wijnhoven, B.P.L.; van Laarhoven, H.W.M.; Nieuwenhuijzen, G.A.P.; Hospers, G.A.P.; Bonenkamp, J.J.; et al. Neoadjuvant chemoradiotherapy plus surgery versus surgery alone for ooesophageal or junctional cancer (CROSS): Long-term results of a randomised controlled trial. Lancet Oncol. 2015, 16, 1090–1098. [Google Scholar] [CrossRef]
- Mariette, C.; Dahan, L.; Mornex, F.; Maillard, E.; Thomas, P.-A.; Meunier, B.; Boige, V.; Pezet, D.; Robb, V.B.; Le Brun-Ly, V.; et al. Surgery alone versus chemoradiotherapy followed by surgery for stage I and II oesophageal cancer: Final analysis of randomized controlled phase III trial FFCD 9901. J. Clin. Oncol. 2014, 32, 2416–2422. [Google Scholar] [CrossRef]
- Herskovic, A.; Martz, K.; al-Sarraf, M.; Leichman, L.; Brindle, J.; Vaitkevicius, V.; Cooper, J.; Byhardt, R.; Davis, L.; Emami, B. Combined chemotherapy and radiotherapy compared with radiotherapy alone in patients with cancer of the esophagus. N. Engl. J. Med. 1992, 326, 1593–1598. [Google Scholar] [CrossRef] [PubMed]
- Cooper, J.S.; Guo, M.D.; Herskovic, A.; Macdonald, J.S.; Martenson, J.A.; Al-Sarraf, M.; Byhardt, R.; Russell, A.H.; Beitler, J.J.; Spencer, S.; et al. Chemoradiotherapy of locally advanced oesophageal cancer: Long-term follow-up of a prospective randomized trial (RTOG 85-01). Radiation Therapy Oncology Group. JAMA 1999, 281, 1623–1627. [Google Scholar] [CrossRef]
- Zhu, L.-L.; Yuan, L.; Wang, H.; Ye, L.; Yao, G.-Y.; Liu, C.; Sun, N.-N.; Li, X.-J.; Zhai, S.-C.; Niu, L.-J.; et al. A Meta-Analysis of Concurrent Chemoradiotherapy for Advanced Oesophageal Cancer. PLoS ONE. 2015, 10, e0128616. [Google Scholar]
- Guidelines of the National French Society of Gastro-Entrerology (SNFGE) for Esophageal Cancer. Available online: https://www.snfge.org/content/1-cancer-de-loesophage (accessed on 19 April 2022). (In French).
- Monjazeb, A.M.; Riedlinger, G.; Aklilu, M.; Geisinger, K.R.; Mishra, G.; Isom, S.; Clark, P.; Levine, E.A.; Blackstock, A.W. Outcomes of patients with oesophageal cancer staged with [18F] fluorodeoxyglucose positron emission tomography (FDG-PET): Can postchemoradiotherapy FDG-PET predict the utility of resection? J. Clin. Oncol. 2010, 28, 4714–4721. [Google Scholar] [CrossRef]
- Aerts, H.J.W.L.; Velazquez, E.R.; Leijenaar, R.T.H.; Parmar, C.; Grossmann, P.; Carvalho, S.; Bussink, J.; Monshouwer, R.; Haibe-Kains, B.; Rietveld, D.; et al. Decoding tumour phenotype by non invasive imaging using a quantitative radiomics approach. Nat. Commun. 2014, 5, 4006. [Google Scholar] [CrossRef]
- Gatta, R.; Depeursinge, A.; Ratib, O.; Michielin, O.; Leimgruber, A. Integrating radiomics into holomics for personalised oncology: From algorithms to bedside. Eur. Radiol. Exp. 2020, 4, 11. [Google Scholar] [CrossRef]
- Gillies, R.J.; Kinahan, P.E.; Hricak, H. Radiomics: Images Are More than Pictures, They Are Data. Radiology 2015, 278, 563–577. [Google Scholar] [CrossRef] [PubMed]
- Farchione, A.; Larici, A.R.; Masciocchi, C.; Cicchetti, G.; Congedo, M.T.; Franchi, P.; Gatta, R.; Lo Cicero, S.; Valentini, V.; Bonomo, L.; et al. Exploring technical issues in personalized medicine: NSCLC survival prediction by quantitative image analysis-usefulness of density correction of volumetric CT data. Radiol. Med. 2020, 125, 625–635. [Google Scholar] [CrossRef] [PubMed]
- Huang, Y.-Q.; Liang, C.-H.; He, L.; Tian, J.; Liang, C.-S.; Chen, X.; Ma, Z.-L.; Liu, Z.-Y. Development and Validation of a Radiomics Nomogram for Preoperative Prediction of Lymph Node Metastasis in Colorectal Cancer. J. Clin. Oncol. 20 2016, 34, 2157–2164. [Google Scholar] [CrossRef] [PubMed]
- Zhang, B.; Tian, J.; Dong, D.; Gu, D.; Dong, Y.; Zhang, L.; Lian, L.; Liu, J.; Luo, X.; Pei, S.; et al. Radiomics Features of Multiparametric MRI as Novel Prognostic Factors in Advanced Nasopharyngeal Carcinoma. Clin. Cancer Res. 2017, 23, 4259–4269. [Google Scholar] [CrossRef]
- Cook, G.J.R.; Siddique, M.; Taylor, B.P.; Yip, C.; Chicklore, S.; Goh, V. Radiomics in PET: Principles and applications. Clin. Transl. Imaging 2014, 2, 269–276. [Google Scholar] [CrossRef]
- Chicklore, S.; Goh, V.; Siddique, M.; Roy, A.; Marsden, P.K.; Cook, G.J.R. Quantifying tumour heterogeneity in 18F-FDG PET/CT imaging by texture analysis. Eur. J. Nucl. Med. Mol. Imaging 2013, 40, 133–140. [Google Scholar] [CrossRef]
- Rice, T.W.; Blackstone, E.H.; Rusch, V.W. 7th Edition of the AJCC Cancer Staging Manual: Esophagus and Esophagogastric Junction. Ann. Surg. Oncol. 2010, 17, 1721–1724. [Google Scholar] [CrossRef]
- Dinapoli, N.; Alitto, A.R.; Vallati, M.; Gatta, R.; Autorino, R.; Boldrini, L.; Damiani, A.; Valentini, V. Moddicom: A complete and easily accessible library for prognostic evaluations relying on image features. In Proceedings of the 2015 37th Annual International Conference of the IEEE Engineering in Medicine and Biology Society (EMBC), Milan, Italy, 25–29 August 2015; pp. 771–774. [Google Scholar]
- MODDICOM Library. Available online: https://github.com/kbolab/moddicom (accessed on 4 May 2022).
- Zwanenburg, A.; Vallières, M.; Abdalah, M.A.; Aerts, H.J.W.L.; Andrearczyk, V.; Apte, A.; Ashrafinia, S.; Bakas, S.; Beukinga, R.J.; Boellaard, R.; et al. The Image Biomarker Standardization Initiative: Standardized Quantitative Radiomics for High-Throughput Image-based Phenotyping. Radiology 2020, 295, 328–338. [Google Scholar] [CrossRef]
- Gehlenborg, N.; Wong, B. Heat maps. Nat. Methods 2012, 9, 3. [Google Scholar] [CrossRef]
- Albregtsen, F.; Nielsen, B.; Danielsen, H. Adaptive gray level run length features from class distance matrices. In Proceedings of the 15th International Conference on Pattern Recognition (ICPR-20001), Barcelona, Spain, 3–7 September 2000; pp. 738–741. [Google Scholar]
- Wang, J.; Qin, J.; Jing, S.; Liu, Q.; Cheng, Y.; Wang, Y.; Cao, F. Clinical complete response after chemoradiotherapy for carcinoma of thoracic esophagus: Is esophagectomy always necessary? A systematic review and meta-analysis. Thorac. Cancer 2018, 9, 1638–1647. [Google Scholar] [CrossRef]
- Sjoquist, K.M.; Burmeister, B.H.; Smithers, B.M.; Zalcberg, J.R.; Simes, R.J.; Barbour, A.; Gebski, V.; Australasian Gastro-Intestinal Trials Group. Survival after neoadjuvant chemotherapy or chemoradiotherapy for resectable oesophageal carcinoma: An updated meta-analysis. Lancet Oncol. 2011, 12, 681–692. [Google Scholar] [CrossRef]
- Vellayappan, B.A.; Soon, Y.Y.; Ku, G.Y.; Leong, C.N.; Lu, J.J.; Tey, J.C. Chemoradiotherapy versus chemoradiotherapy plus surgery for oesophageal cancer. Cochrane Database Syst. Rev. 2017, 8, CD010511. [Google Scholar] [PubMed]
- Stahl, M.; Stuschke, M.; Lehmann, N.; Meyer, H.J.; Walz, M.K.; Seeber, S.; Klump, B.; Budach, W.; Teichmann, R.; Schmitt, M.; et al. Chemoradiation with and without surgery in patients with locally advanced squamous cell carcinoma of the esophagus. J. Clin. Oncol. 2005, 23, 2310–2317. [Google Scholar] [CrossRef] [PubMed]
- Rohatgi, P.R.; Swisher, S.G.; Correa, A.M.; Wu, T.T.; Liao, Z.; Komaki, R.; Walsh, G.; Vaporciyan, A.; Lynch, P.M.; Rice, D.C.; et al. Failure patterns correlate with the proportion of residual carcinoma after preoperative chemoradiotherapy for carcinoma of the esophagus. Cancer 2005, 104, 1349–1355. [Google Scholar] [CrossRef] [PubMed]
- Chao, Y.K.; Tseng, C.K.; Wen, Y.W.; Liu, Y.H.; Wan, Y.L.; Chiu, C.T.; Chang, W.C.; Chang, H.K. Using pretreatment tumor depth and length to select oesophageal squamous cell carcinoma patients for nonoperative treatment after neoadjuvant chemoradiotherapy. Ann. Surg. Oncol. 2013, 20, 3000–3008. [Google Scholar] [CrossRef] [PubMed]
- Jeong, Y.; Kim, J.H.; Kim, S.B.; Yoon, D.H.; Park, S.I.; Kim, Y.H.; Kim, H.R.; Jung, H.Y.; Lee, G.H.; Ryu, J.S. Role of surgical resection in complete responders on FDG-PET after chemoradiotherapy for locally advanced oesophageal squamous cell carcinoma. J. Surg. Oncol. 2014, 109, 472–477. [Google Scholar] [CrossRef] [PubMed]
- Rawat, S.; Kumar, G.; Kakria, A.; Sharma, M.K.; Chauhan, D. Chemoradiotherapy in the management of locally advanced squamous cell carcinoma esophagus: Was surgical resection required? J. Gastrointest. Cancer 2013, 44, 277–284. [Google Scholar] [CrossRef]
- Lowe, V.J.; Booya, F.; Fletcher, J.G.; Nathan, M.; Jensen, E.; Mullan, B.; Rohren, E.; Wiersema, M.J.; Vazquez-Sequeiros, E.; Murray, J.A.; et al. Comparison of positron emission tomography, computed tomography, and endoscopic ultrasound in the initial staging of patients with oesophageal cancer. Mol. Imaging Biol. 2005, 7, 422–430. [Google Scholar] [CrossRef]
- Allum, W.H.; Blazeby, J.M.; Griffin, S.M.; Cunningham, D.; Jankowski, J.A.; Wong, R. Guidelines for the management of oesophageal and gastric cancer. Gut 2011, 60, 1449–1472. [Google Scholar] [CrossRef]
- Deantonio, L.; Garo, M.L.; Paone, G.; Valli, M.C.; Cappio, S.; La Regina, D.; Cefali, M.; Palmarocchi, M.C.; Vannelli, A.; De Dosso, S. 18F-FDG PET Radiomics as Predictor of Treatment Response in Oesophageal Cancer: A Systematic Review and Meta-Analysis. Front. Oncol. 2022, 12, 861638. [Google Scholar] [CrossRef]
- Beukinga, R.J.; Hulshoff, J.B.; van Dijk, L.V.; Muijs, C.T.; Burgerhof, J.G.M.; Kats-Ugurlu, G.; Slart, R.H.J.A.; Slump, C.H.; Mul, V.E.M.; Plukker, J.T.M. Predicting Response to Neoadjuvant Chemoradiotherapy in Oesophageal Cancer with Textural Features Derived from Pretreatment 18F-FDG PET/CT Imaging. J. Nucl. Med. 2017, 58, 723–729. [Google Scholar] [CrossRef] [PubMed]
- Xiong, J.; Yu, W.; Ma, J.; Ren, Y.; Fu, X.; Zhao, J. The Role of PET-Based Radiomic Features in Predicting Local Control of Oesophageal Cancer Treated with Concurrent Chemoradiotherapy. Sci. Rep. 2018, 8, 9902. [Google Scholar] [CrossRef] [PubMed]
- Chen, Y.-H.; Lue, K.-H.; Chu, S.-C.; Chang, B.-S.; Wang, L.-Y.; Liu, D.-W.; Liu, S.-H.; Chao, Y.-K.; Chan, S.-C. Combining the radiomic features and traditional parameters of 18F-FDG PET with clinical profiles to improve prognostic stratification in patients with oesophageal squamous cell carcinoma treated with neoadjuvant chemoradiotherapy and surgery. Ann. Nucl. Med. 2019, 33, 657–670. [Google Scholar] [CrossRef] [PubMed]


| Variable | n | % |
|---|---|---|
| Whole population | 46 | 100 |
| Sex | ||
| Male | 35 | 76 |
| Female | 11 | 24 |
| Age | ||
| Median | 68.8 | - |
| Range | 52.2–92.5 | - |
| ECOG performance status | ||
| 0 | 13 | 28 |
| 1 | 22 | 48 |
| 2 | 10 | 22 |
| 3 | 1 | 2 |
| Body mass index (BMI) | ||
| Median | 23.1 | - |
| Range | 15.4–31.9 | - |
| <18.5 | 4 | 9 |
| 18-5–25 | 28 | 61 |
| 25–30 | 11 | 24 |
| >30 | 3 | 6 |
| Medical history of the patient | ||
| History of digestive surgery | ||
| Yes | 16 | 35 |
| No | 30 | 65 |
| History of cardio-vascular disease | ||
| Yes | 29 | 37 |
| Not | 17 | 63 |
| History of pulmonary disease | ||
| Yes | 12 | 26 |
| Not | 34 | 74 |
| Histology | ||
| Squamous cell carcinoma | 40 | 87 |
| Adenocarcinoma | 6 | 13 |
| Tumour localisation | ||
| Cervical and superior 3rd oesophageal cancer | 18 | 39 |
| Thoracic oesophageal cancer | 17 | 37 |
| Distal oesophageal cancer | 7 | 15 |
| Oeso-gastric junction | 4 | 9 |
| Tumour (T) stage | ||
| T1 | 2 | 4 |
| T2 | 11 | 24 |
| T3 | 29 | 63 |
| T4 | 4 | 9 |
| Nodal (N) | ||
| 0 | 17 | 37 |
| 1 | 21 | 46 |
| 2 | 5 | 11 |
| 3 | 3 | 6 |
| TNM stage | ||
| IA | 1 | 2 |
| IB | 5 | 11 |
| IIA | 11 | 24 |
| IIB | 5 | 11 |
| IIIA | 14 | 30 |
| IIIB | 3 | 7 |
| IIIC | 7 | 15 |
| Group 1 | Heatmap | Group 2 | |||
|---|---|---|---|---|---|
| n | % | n | % | p-Value | |
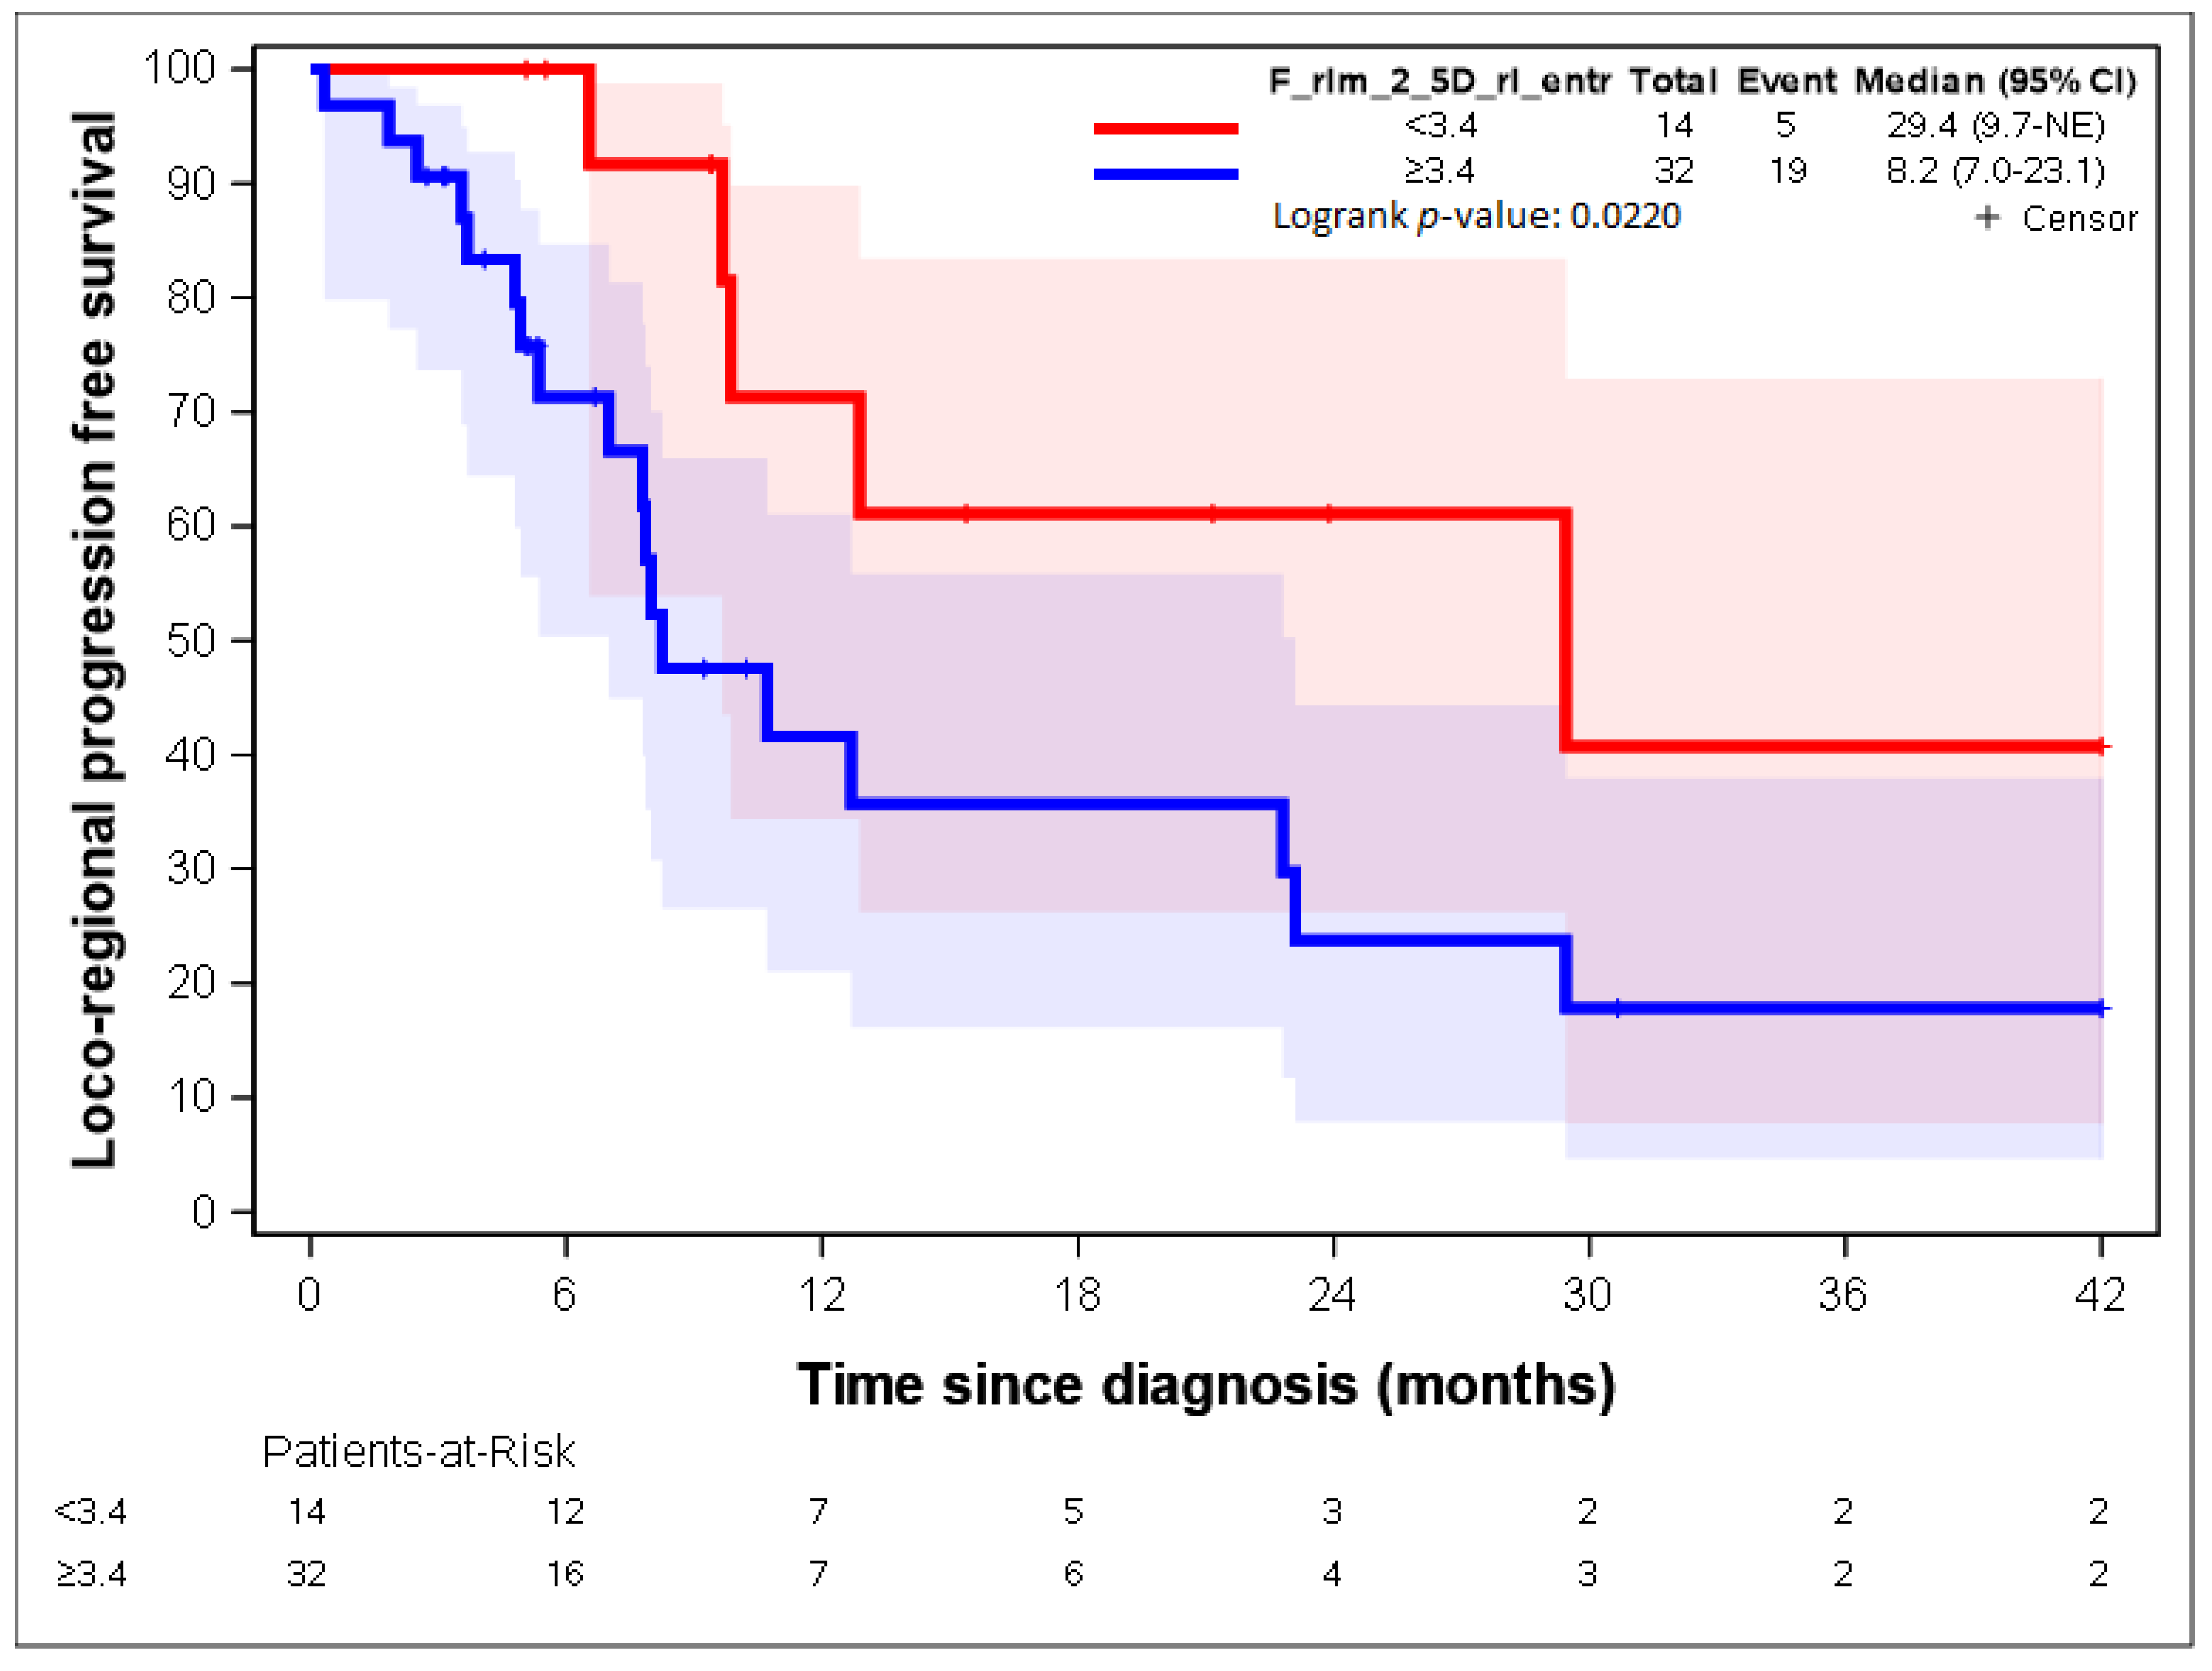
| F_rlm_2_5D_rl_entr < 3.3 | 10 | 76.92 | 3 | 9.09 | <0.0001 |
| F_rlm_2_5D_rl_entr ≥ 3.3 | 3 | 23.08 | 30 | 90.91 |
| Group 1 | Heatmap | Group 2 | |||
|---|---|---|---|---|---|
| n | % | n | % | p-Value | |
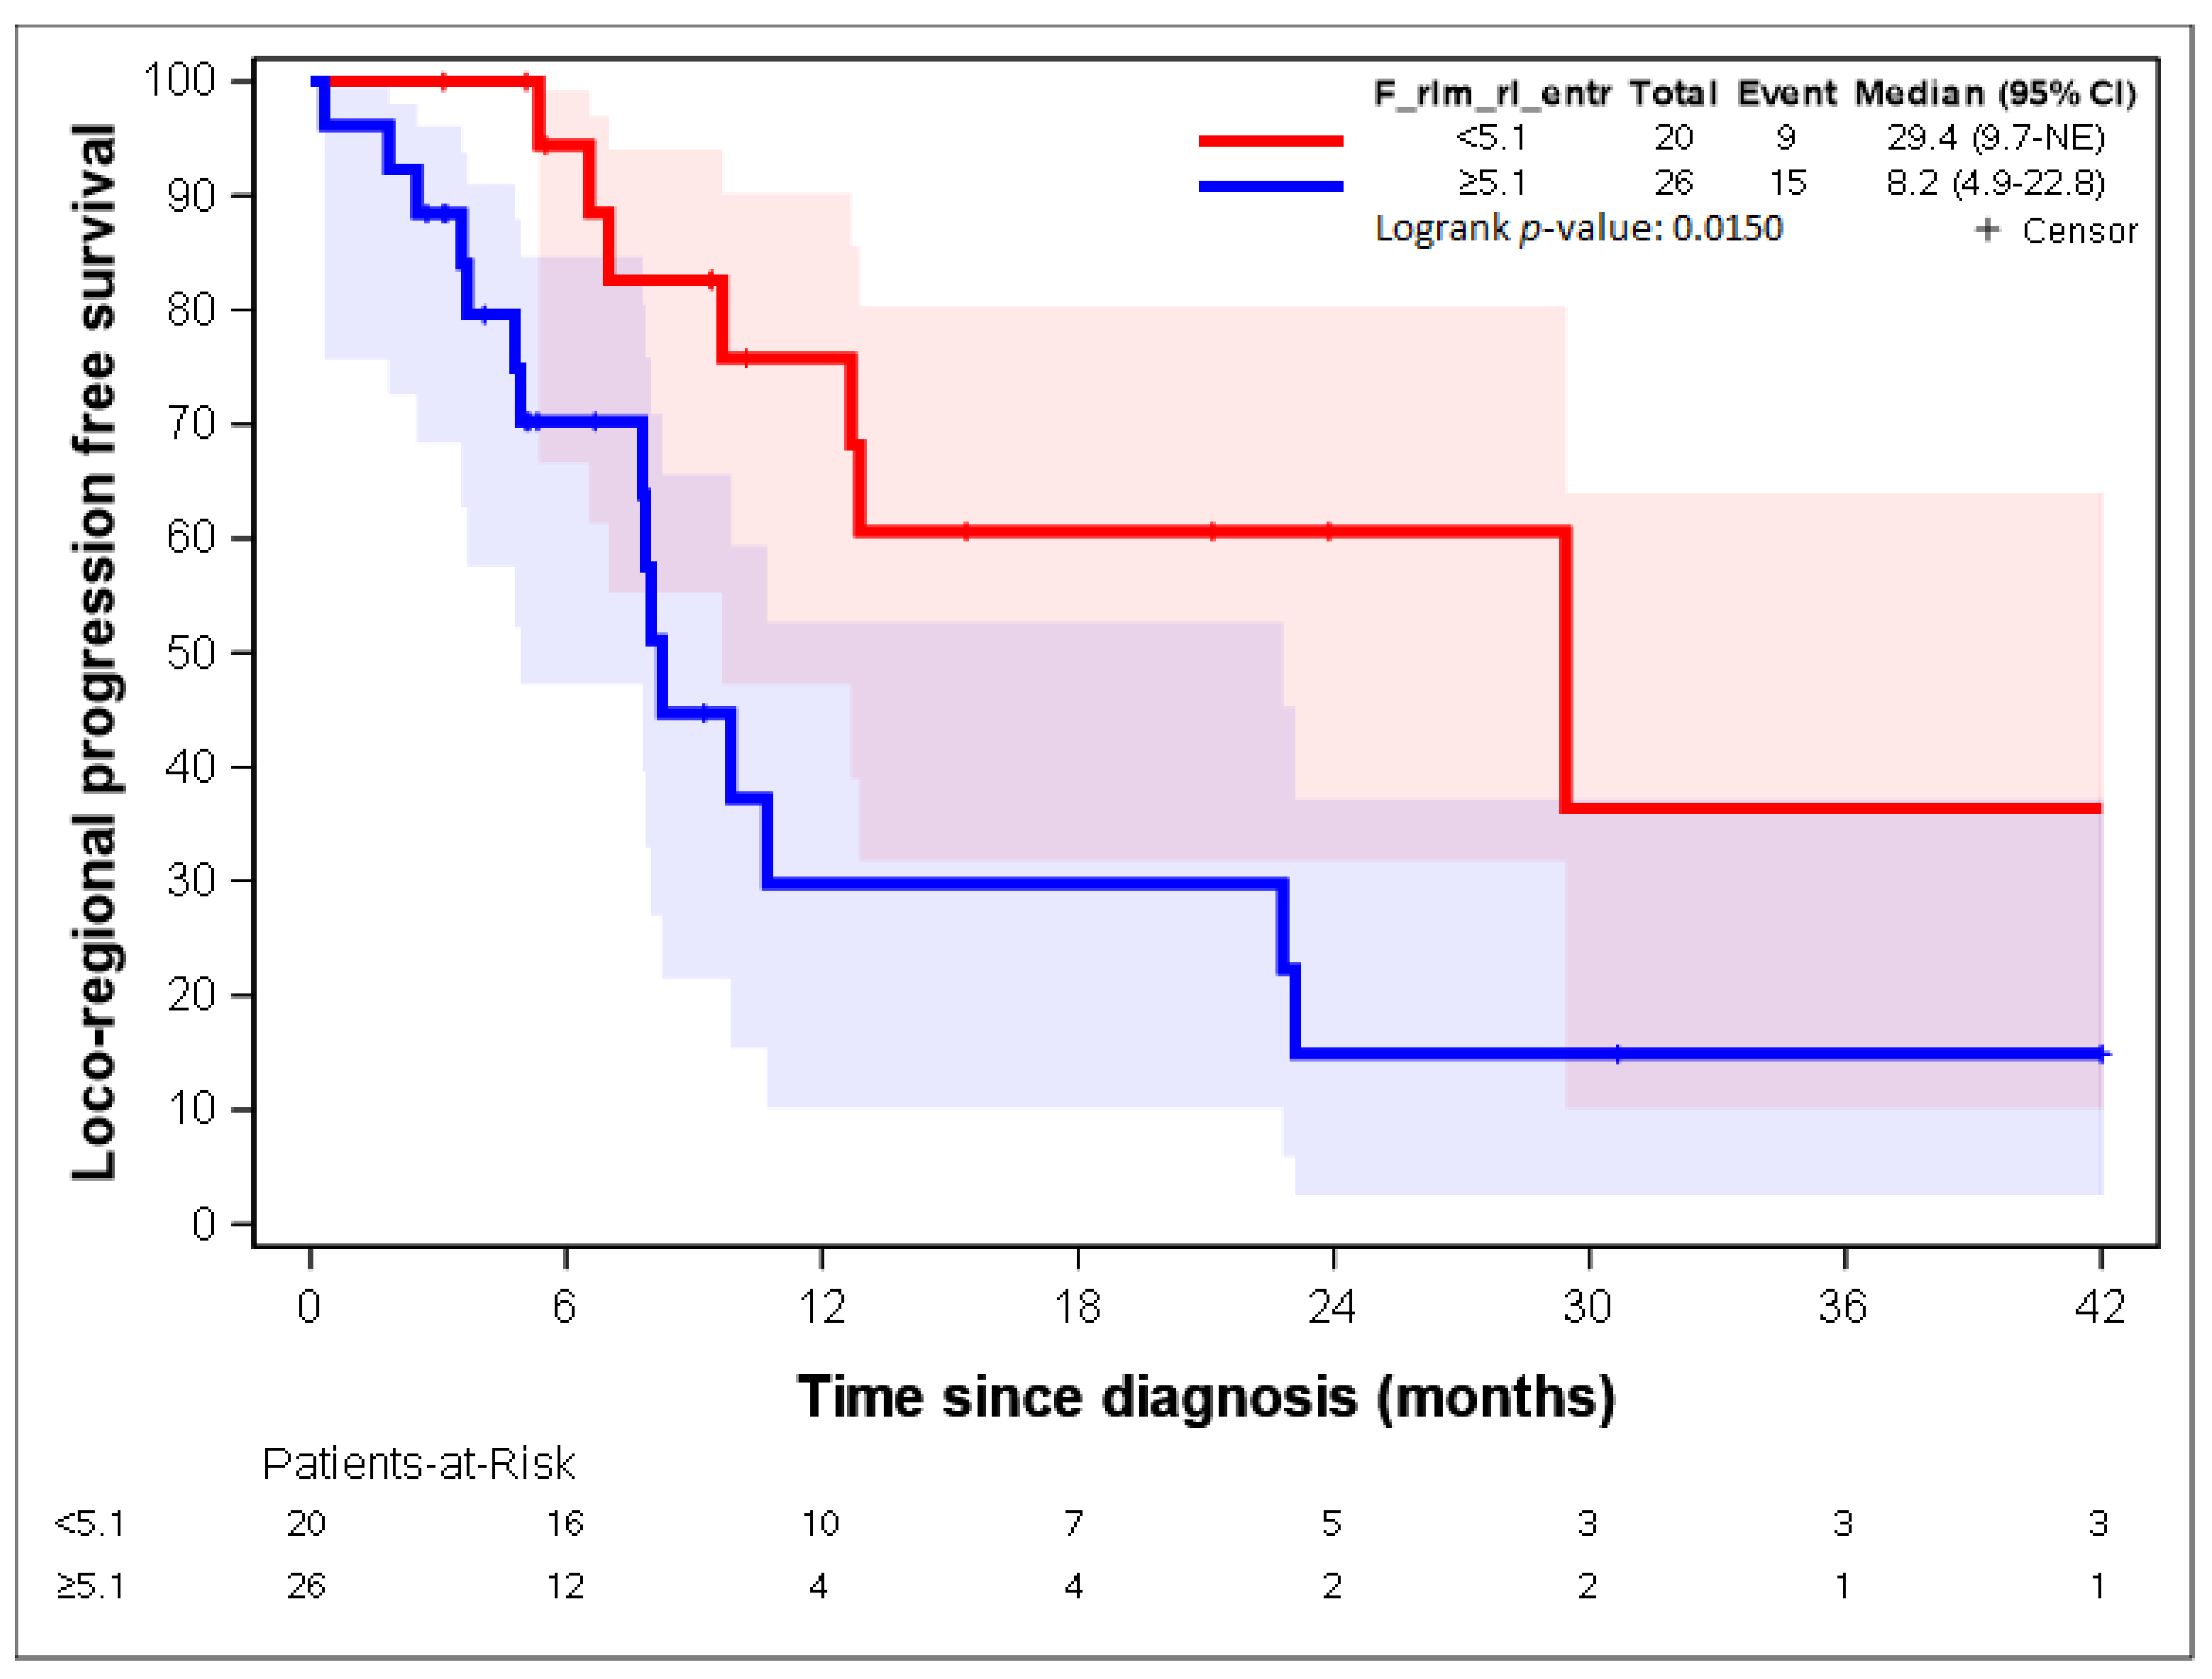
| F_rlm_rl_entr_per < 4.7 | 12 | 92.31 | 2 | 6.06 | <0.0001 |
| F_rlm_rl_entr_per ≥ 4.7 | 1 | 7.69 | 31 | 93.94 |
| F_stat_entropy | F_rlm_glnu | F_szm_2_5D_zs_var | F_rlm_rl_entr | F_rlm_2_5D_rl_entr | |
|---|---|---|---|---|---|
| F_stat_entropy | 1 | 0.72 | 0.65 | 0.87 | 0.88 |
| F_rlm_glnu | 1 | 0.9 | 0.58 | 0.69 | |
| F_szm_2_5D_zs_var | 1 | 0.52 | 0.63 | ||
| F_rlm_rl_entr | 1 | 0.87 | |||
| F_rlm_2_5D_rl_entr | 1 |
Publisher’s Note: MDPI stays neutral with regard to jurisdictional claims in published maps and institutional affiliations. |
© 2022 by the authors. Licensee MDPI, Basel, Switzerland. This article is an open access article distributed under the terms and conditions of the Creative Commons Attribution (CC BY) license (https://creativecommons.org/licenses/by/4.0/).
Share and Cite
De Bari, B.; Lefevre, L.; Henriques, J.; Gatta, R.; Falcoz, A.; Mathieu, P.; Borg, C.; Dinapoli, N.; Boulahdour, H.; Boldrini, L.; et al. Could 18-FDG PET-CT Radiomic Features Predict the Locoregional Progression-Free Survival in Inoperable or Unresectable Oesophageal Cancer? Cancers 2022, 14, 4043. https://doi.org/10.3390/cancers14164043
De Bari B, Lefevre L, Henriques J, Gatta R, Falcoz A, Mathieu P, Borg C, Dinapoli N, Boulahdour H, Boldrini L, et al. Could 18-FDG PET-CT Radiomic Features Predict the Locoregional Progression-Free Survival in Inoperable or Unresectable Oesophageal Cancer? Cancers. 2022; 14(16):4043. https://doi.org/10.3390/cancers14164043
Chicago/Turabian StyleDe Bari, Berardino, Loriane Lefevre, Julie Henriques, Roberto Gatta, Antoine Falcoz, Pierre Mathieu, Christophe Borg, Nicola Dinapoli, Hatem Boulahdour, Luca Boldrini, and et al. 2022. "Could 18-FDG PET-CT Radiomic Features Predict the Locoregional Progression-Free Survival in Inoperable or Unresectable Oesophageal Cancer?" Cancers 14, no. 16: 4043. https://doi.org/10.3390/cancers14164043