Article

Improvements in Quality Control and Library Preparation for Targeted Sequencing Allowed Detection of Potentially Pathogenic Alterations in Circulating Cell-Free DNA Derived from Plasma of Brain Tumor Patients

1
Nencki Institute of Experimental Biology, 02-093 Warsaw, Poland
2
Postgraduate School of Molecular Medicine, Medical University of Warsaw, 02-007 Warsaw, Poland
3
Academic Computer Centre CYFRONET AGH, 30-950 Krakow, Poland
4
Sano Centre for Computational Medicine, 30-054 Krakow, Poland
5
Regional Science and Technology Centre, 26-060 Podzamcze, Poland
6
Department of Neurosurgery, Medical University of Silesia, Regional Hospital, 41-200 Sosnowiec, Poland
7
Department of Oncology, University of Warmia and Mazury in Olsztyn, 10-228 Olsztyn, Poland
*
Author to whom correspondence should be addressed.
Cancers 2022, 14(16), 3902; https://doi.org/10.3390/cancers14163902
Submission received: 4 July 2022 / Revised: 3 August 2022 / Accepted: 9 August 2022 / Published: 12 August 2022
(This article belongs to the Special Issue The 5th ACTC: “Liquid Biopsy in Its Best”)

Abstract

:

Simple Summary

Malignant brain tumors present an enormous challenge due to their genetic heterogeneity, and the difficulties in accessing them impede a precise diagnosis. Numerous genetic alterations have been described, and some of them can assist in personalized therapy for glioma patients. Brain biopsy is an invasive procedure with potentially deleterious complications. Liquid biopsy from a patient’s plasma may provide a less invasive method for diagnosis and personalized therapy selection. We performed targeted next-generation sequencing of tumors and circulating cell-free DNA (ccfDNA) from 84 brain tumor patients. We detected tumor-specific genetic alterations in ccfDNA in 5 out of 80 glioma patients and potentially pathogenic alterations in ccfDNA from the plasma of 29 out of 80 glioma patients. Despite a low efficacy, with further improvements, the detection of genetic alterations in ccfDNA holds promise for noninvasive diagnosis, which may revolutionize personalized therapy for these deadly tumors.

Abstract

Malignant gliomas are the most frequent primary brain tumors in adults. They are genetically heterogenous and invariably recur due to incomplete surgery and therapy resistance. Circulating tumor DNA (ctDNA) is a component of circulating cell-free DNA (ccfDNA) and represents genetic material that originates from the primary tumor or metastasis. Brain tumors are frequently located in the eloquent brain regions, which makes biopsy difficult or impossible due to severe postoperative complications. The analysis of ccfDNA from a patient’s blood presents a plausible and noninvasive alternative. In this study, freshly frozen tumors and corresponding blood samples were collected from 84 brain tumor patients and analyzed by targeted next-generation sequencing (NGS). The cohort included 80 glioma patients, 2 metastatic cancer patients, and 2 primary CNS lymphoma (PCNSL) patients. We compared the pattern of genetic alterations in the tumor DNA (tDNA) with that of ccfDNA. The implemented technical improvements in quality control and library preparation allowed for the detection of ctDNA in 8 out of 84 patients, including 5 out of 80 glioma patients. In 32 out of 84 patients, we found potentially pathogenic genetic alterations in ccfDNA that were not detectable in tDNA. While sequencing ccfDNA from plasma has a low efficacy as a diagnostic tool for glioma patients, we concluded that further improvements in sample processing and library preparation can make liquid biopsy a valuable diagnostic tool for glioma patients.

Graphical Abstract

1. Introduction

Recent advances in the detection and characterization of ctDNA have allowed the implementation of liquid biopsy in clinical practice. Several single- or multi-gene assays for detecting genetic alterations in ccfDNA are used for better cancer diagnosis and molecularly targeted therapy recommendations. A few assays have been approved by the American Federation of Drug Administration [1,2]. ccfDNA originates from degraded DNA fragments that are released into the blood and all other bodily fluids due to ongoing apoptosis, necrosis, or secretion from either normal or malignant cells [3,4]. Released fragments of ccfDNA and the presence of ctDNA can be assessed using many different methods: qPCR [3,5], droplet digital PCR (ddPCR) [4], atomic force microscopy (AFM) [5], massive parallel sequencing (MPS) [6], microchip-based capillary electrophoresis [7], or agarose gel electrophoresis [8]. Elevated levels of ccfDNA are detected in many pathological conditions: advanced cancer, sepsis, myocardial infarction, physical trauma, pregnancy, and transplant graft rejection [9,10,11]. ccfDNA circulates as fragments ranging in length from 120 to 220 base pairs (bp), with the peak at 167 bp, but dimers and trimers of this length have been found [10]. The estimated half-life of ccfDNA in circulating blood varies from 2 min to 2 h [12]. This rapid turnover allows for a snapshot of the tumor’s mutational landscape, which provides valuable diagnostic information. ccfDNA contains nuclear and mitochondrial DNA, which impacts its structure and stability [13]. ctDNA can be used as a marker for detecting cancer-specific alterations or tracking tumor evolution [14,15,16].
Malignant gliomas are the most frequent primary brain tumors in adults [17] and are classified by the World Health Organization (WHO) as either grade 3 or 4 gliomas. The most aggressive is glioblastoma (GBM, G4), which is characterized by highly infiltrative growth, multiple genetic alterations, and high resistance to therapy, resulting in rapid recurrence and a high mortality rate. The median overall survival of GBM patients is 14.5 months from the time of diagnosis, despite extensive surgical resection, radiotherapy, and chemotherapy [18]. Multiplatform genomic, epigenetic, and proteomic analyses of these tumors by The Cancer Genome Atlas (TCGA) consortium [19] revealed predominant, recurrent alterations, molecular subtypes, and potential therapeutic clues [19,20,21,22]. Recurrent somatic alterations in genes such as TP53, PTEN, NF1, ATRX, EGFR, PDGFRA, and IDH1 have been reported [20,23]. Despite many developments in oncology, there has been no progress in therapy for malignant gliomas. Due to the shortage of efficient treatment, the detection of rare but targetable genetic changes is of interest, which raises the possibility for tailored therapy for selected patients. This is exemplified by the inhibitors of the mutated BRAF V600E targeting the alteration present in 1% of glioma patients [24]; inhibitors of Aurora kinases (AURK), which are upregulated in GBMs; or AURK inhibitors, which have a synergistic or sensitizing effect when combined with standard therapy [25,26].
The biopsy of brain tumors is invasive and risky, particularly in elderly patients. Moreover, sampling is highly biased due to cellular and genetic tumor heterogeneity. Some brain tumors are in the eloquent brain regions, which makes biopsy difficult and likely to cause postoperative complications. It is essential to provide real-time quantitative information regarding the tumor burden and qualitative information on genetic profiles that can be used for better diagnosis, prognosis, and outcome prediction. The cerebrospinal fluid (CSF) is in direct contact with tumors and may serve as a better source of ctDNA. CSF-derived ccfDNA has been used to characterize genomic alterations, the dynamics of tumor growth, and genomic evolution. Several studies have reported the presence of ctDNA in the CSF of patients with primary brain tumors or metastatic lesions [2,27,28,29]. The quality and quantity of ccfDNA, which is typically isolated from the plasma of glioma patients, are low; standard methods, effective in other tumors, produce a poor outcome. We hypothesized that improvements in various steps of ccfDNA isolation, library preparation, and sequencing may reinforce the quality of results.
In the present study, we isolated matching samples of tDNA, ccfDNA, and whole-blood reference DNA (gDNA) from 84 brain tumor patients and analyzed them by targeted next-generation sequencing (NGS). The cohort included 80 glioma patients, 2 metastatic cancer patients, and 2 primary CNS lymphoma (PCNSL) patients. We compared the pattern of genetic alterations in tDNA with that of ccfDNA and gDNA. Owing to technical improvements allowing for precise quality and quantity control and application of targeted NGS, ctDNA was detected in 8 out of 84 patients, including 5 out of 80 glioma patients. Some ccfDNA showed somatic alterations that were not detectable in the matching tDNA. While the sequencing of ccfDNA from plasma has low efficacy in the case of brain tumor patients, which prevents the use of this method as a diagnostic tool now, we concluded that further improvements to the isolation, processing, and sequencing of ccfDNA might make liquid biopsy available for glioma patients in the future.

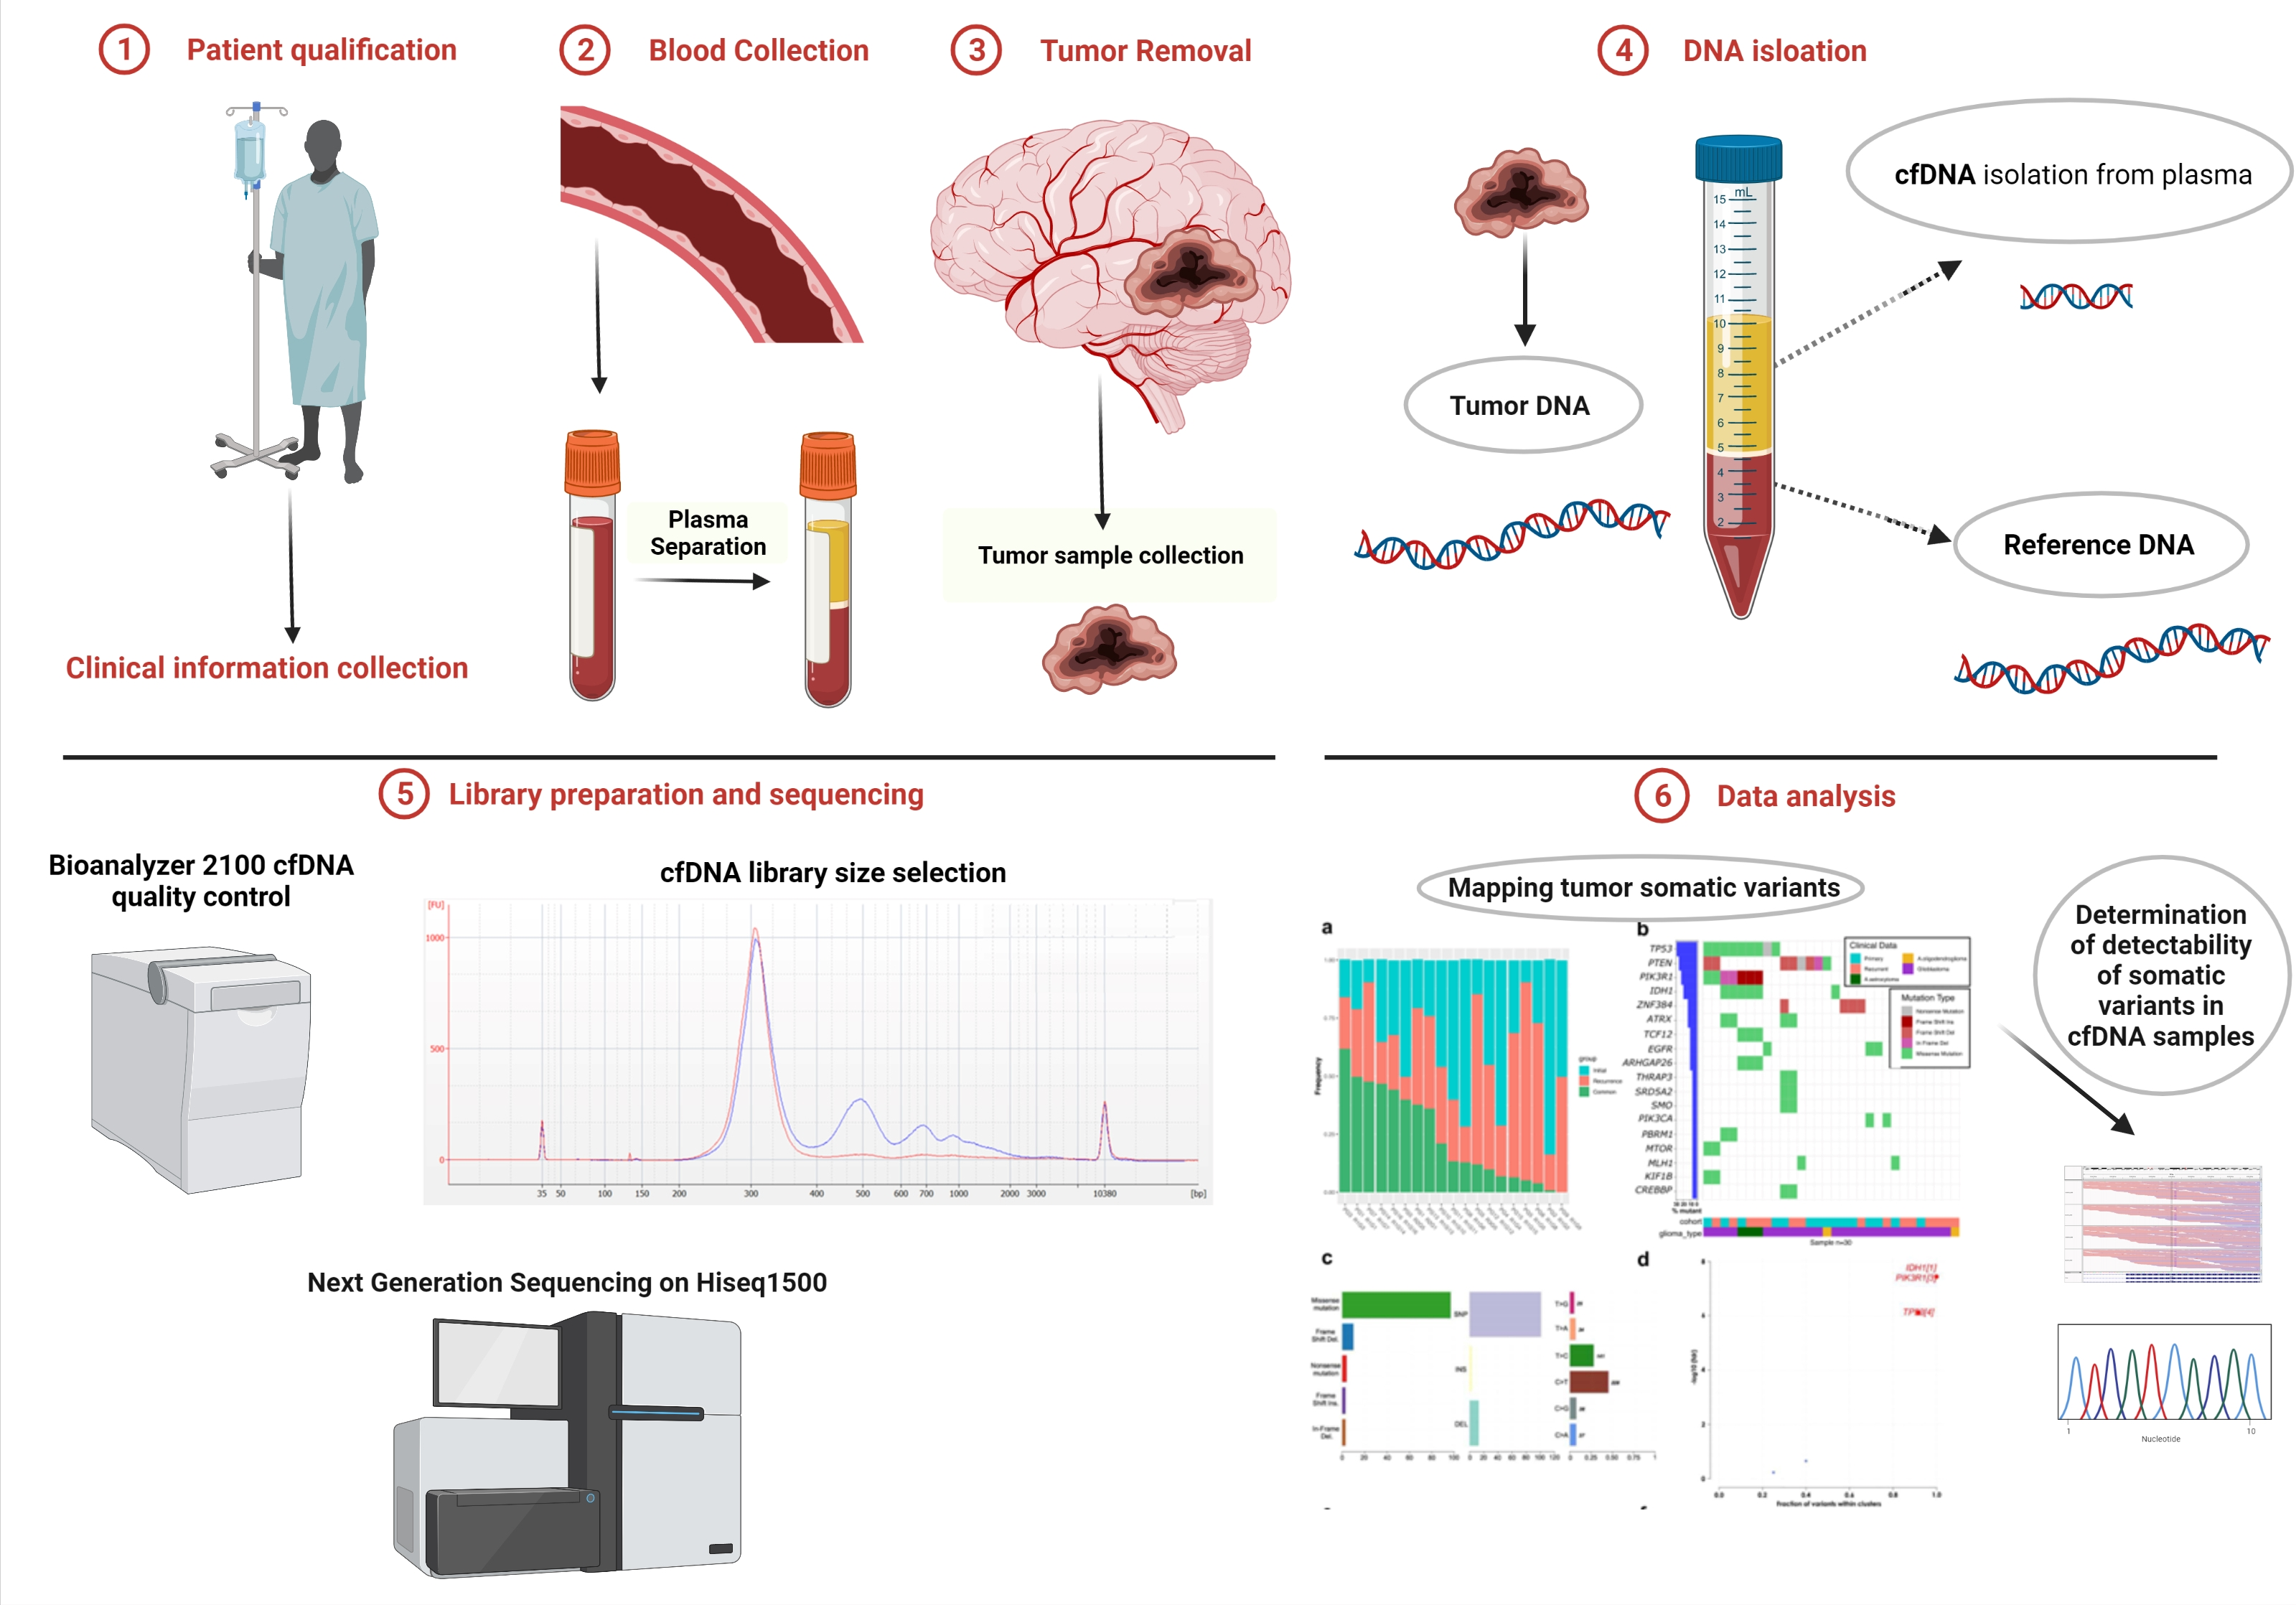
2. Materials and Methods
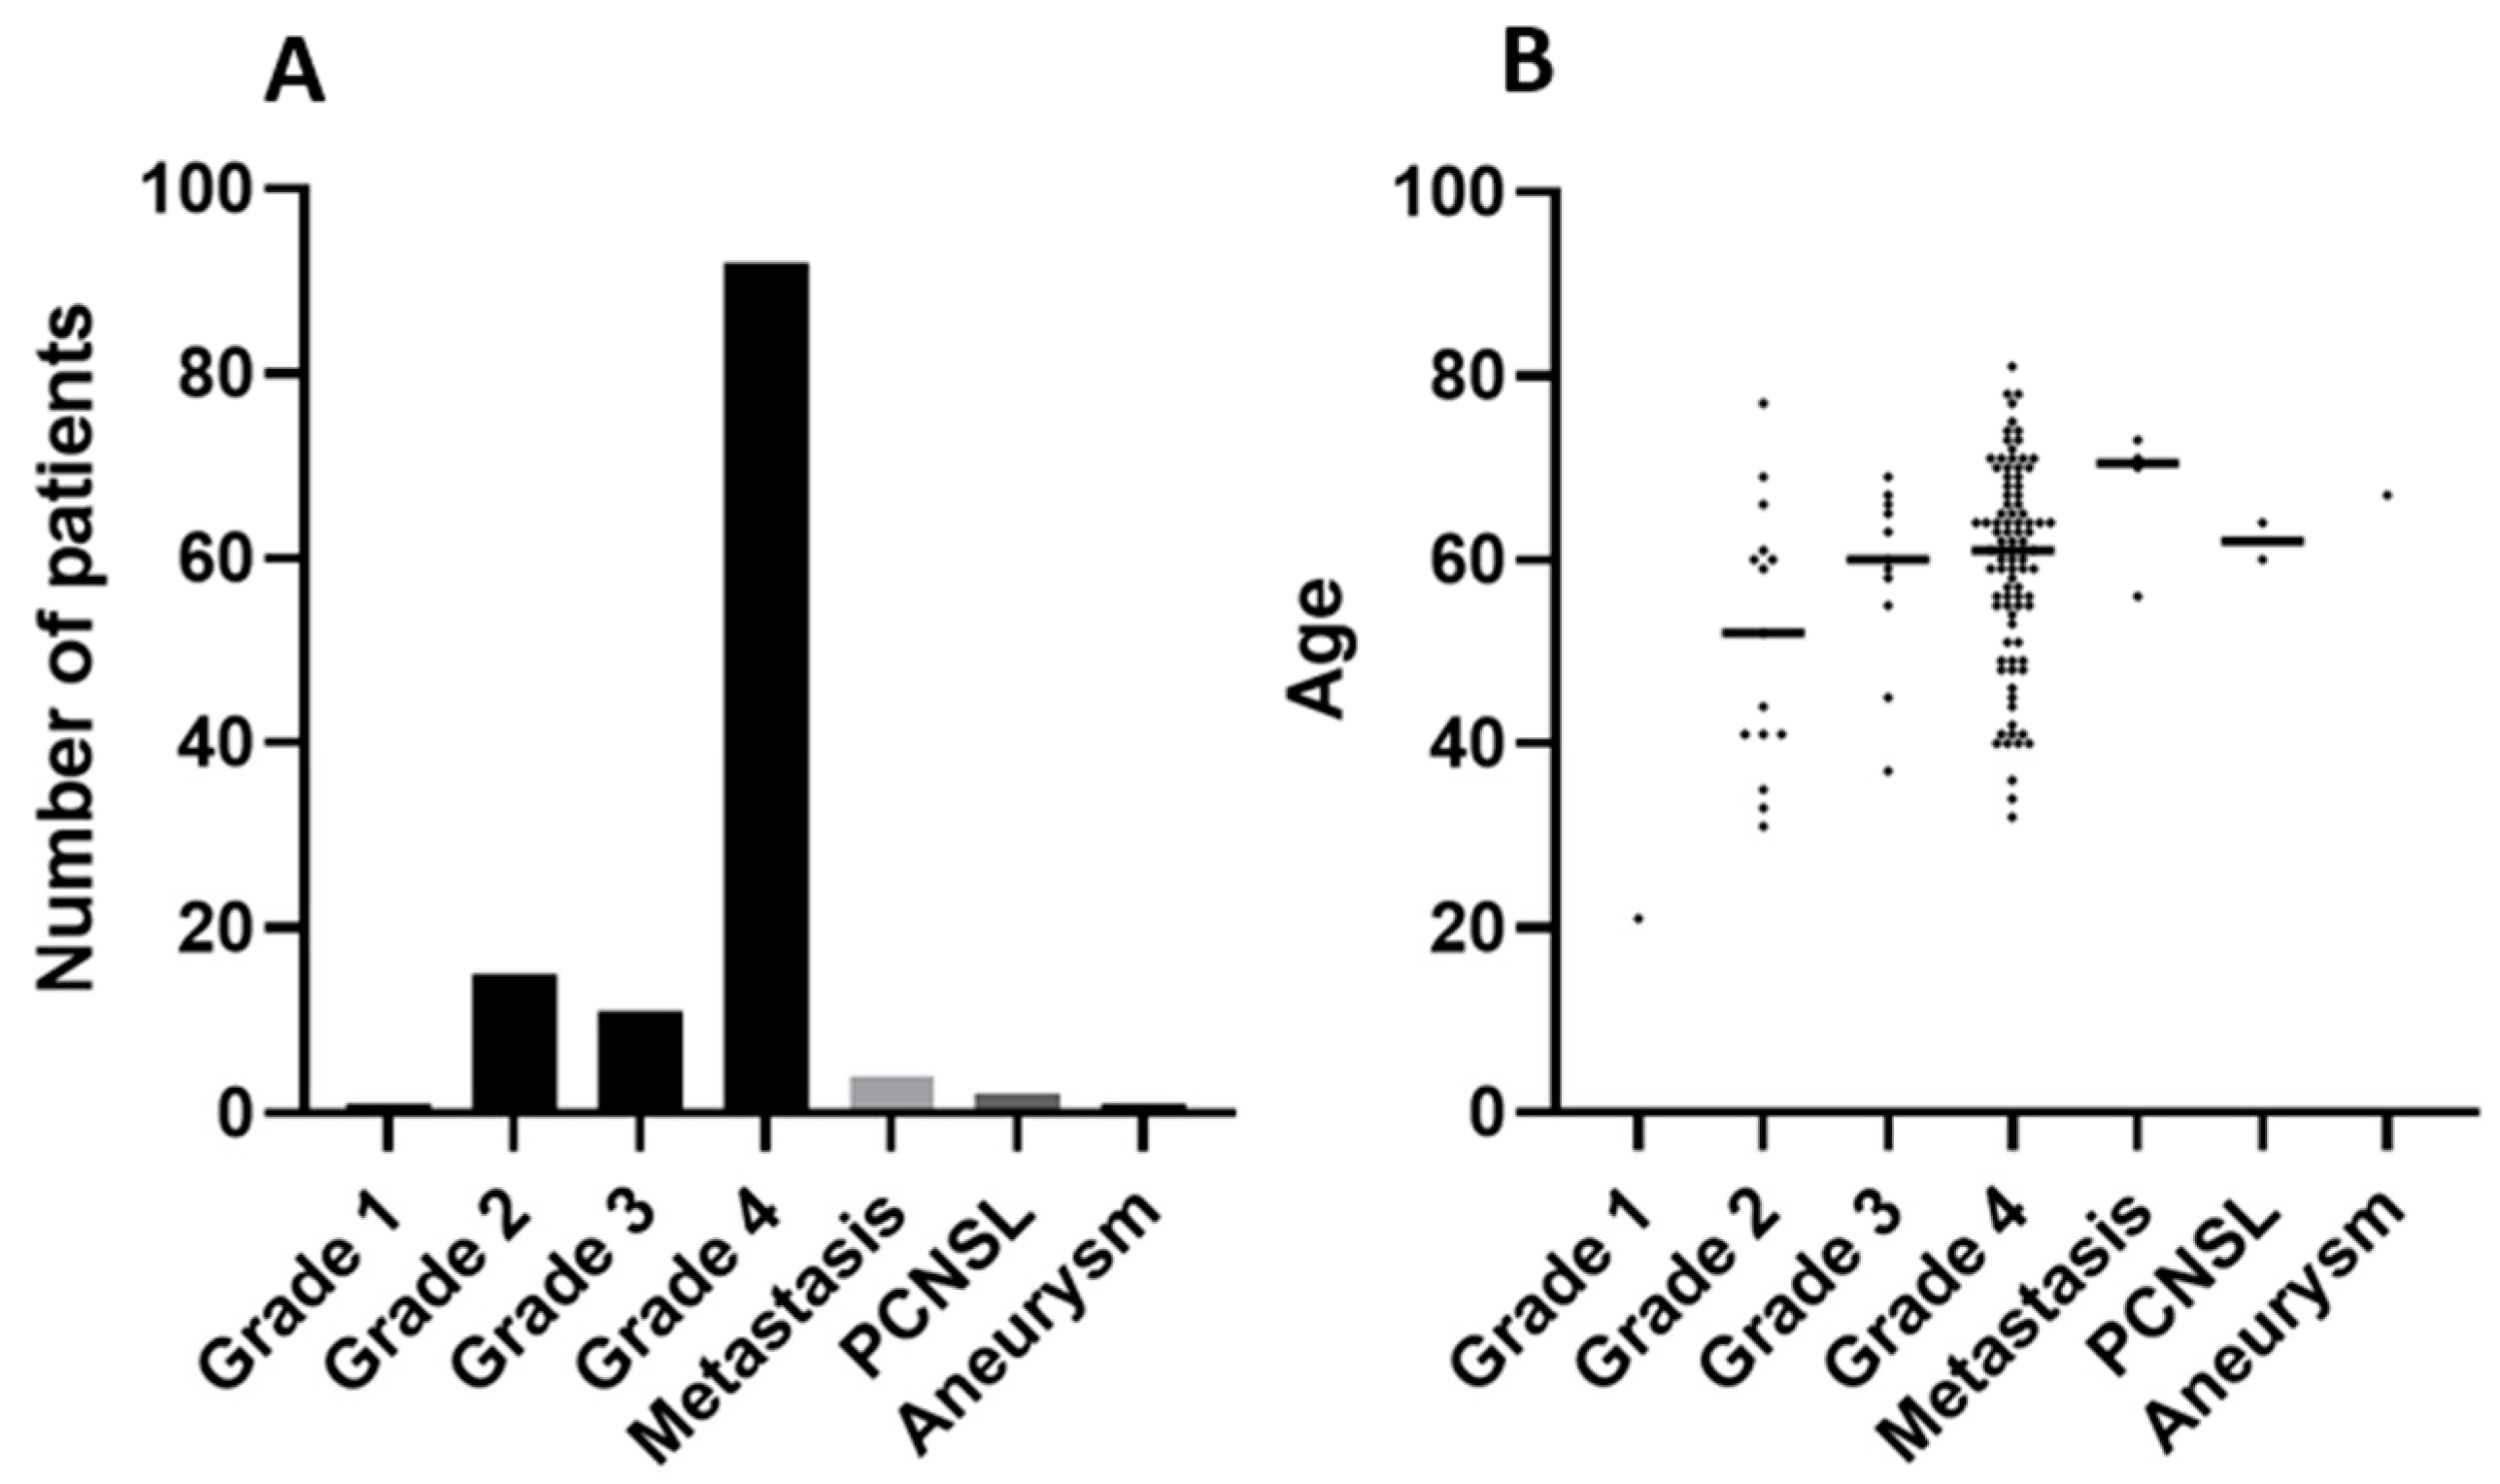
2.1. Patients

Freshly frozen tumors and corresponding blood samples were collected from brain tumor patients. The blood samples were collected before and after surgery. Detailed descriptions of the patient cohort are presented in Supplementary Table S1. Each patient gave written consent for the use of their blood and tumor tissues. All the procedures that involved human participants were performed in accordance with the institutional ethical standards and were approved by the ethics committee of the Medical University of Silesia (KNW/0022/KB1/2/I/17). In the NGS analysis, we used presurgery plasma-derived ccfDNA collected from 84 patients: 80 patients with WHO G3 and G4 gliomas, 2 patients with primary central nervous system lymphoma (PCNSL), and 2 patients with anaplastic thyroid cancer metastasis and adenocarcinoma lung metastasis. Copy number alteration targeted sequencing was additionally performed on 4 ccfDNA samples that displayed the ctDNA signal in the primary analysis.

2.2. DNA Isolation

tDNA was extracted from freshly frozen (−80 °C) tumor tissue samples using Trizol reagent (Thermo Fisher Scientific, Waltham, MA, USA), following the manufacturer’s protocol. gDNA was isolated from whole blood samples that were stored and frozen (−20 °C) in EDTA-coated tubes prior to isolation, using a QIAamp DNA Blood Mini Kit (Qiagen, Hilden, Germany), following the manufacturer’s protocol. The blood collected for ccfDNA isolation was stored in ccfDNA PAXgene tubes (PreAnalytiX, Homberchtikton, Switzerland) prior to isolation. The postsurgical blood used for ccfDNA isolation was collected from most patients 2–3 days after surgery, and 4–5 days postoperation in some cases. Presurgical blood samples were collected up to 24 h prior to surgery. In accordance with the ccfDNA PAXgene (PreAnalytiX, Homberchtikton, Switzerland) manufacturer’s recommendations, the blood samples were stored at room temperature for up to 10 days. The blood tubes (PreAnalytiX, Homberchtikton, Switzerland) were centrifuged at room temperature (15–25 °C) for 15 min at 1900× g. The obtained plasma was transferred into a 15 mL conical-bottom centrifugation tube without disturbance of the buffy coat. The cellular fraction was centrifuged for 10 min at room temperature (15–25 °C) at 1900× g for further purification of the plasma. ccfDNA was isolated from the obtained plasma using a QIAamp Circulating Nucleic Acid Kit and QIAvac system (Qiagen, Hilden, Germany). The isolation was performed according to the manufacturer’s protocol, with appropriate amounts of reagents selected depending on the volume of the input material. The protocol assumes a volume of input material of 1–5 mL of plasma. The obtained ccfDNA was stored at −80 °C until further processing. For some patients, additional whole-blood reference samples were not available; in this case, after plasma removal for ccfDNA isolation, the remaining fraction was stored at −20 °C and later used for gDNA isolation using a QIAamp DNA Blood Mini Kit (Qiagen, Hilden, Germany), so in this case, both ccfDNA and gDNA were isolated from the same blood sample.

2.3. Design of Targeted Glioma-Related Gene Enrichment Panel

To capture a wide spectrum of somatic mutations, tDNA and gDNA were sequenced using a broad 664-gene panel (Supplementary File S1). A SeqCap EZ Custom Enrichment Kit was used, which is an exome enrichment design that targets the latest genomic annotation GRCh38/hg38. The vast majority of the genes (578) were selected from a Roche Nimblegen Cancer Comprehensive Panel (based on the Cancer Gene Consensus from the Sanger Institute and NCBI Gene Tests). Eighty-six epigenetics-related genes were additionally included (genes coding for histone acetylases and deacetylases, histone methylases and demethylases, DNA methylases and demethylases, and chromatin-remodeling proteins) based on a literature review [30,31,32]. The targeted deep sequencing of ccfDNA was performed using a narrow 50-gene Sure Select XT HS custom panel (covering 411,483 kbp) that targets the genomic annotation, GRCh19/hg19 (Design ID: 3216011). All selected gene regions were included in the 664-gene larger panel (Supplementary File S2). For the 50-gene panel, we selected the genes most frequently mutated in the previously analyzed patient cohort of 182 glioma samples [33]. The copy number alteration of Sure Select XT HS custom probes covering the same 50-gene region was additionally tested (Design ID: A3224001, Supplementary File S3).

2.4. Sequencing tDNA and gDNA

The libraries of tDNA and gDNA were prepared using a KAPA HyperPlus Kit, according to the SeqCap EZ HyperCap Workflow user’s guide (version 2.3). The library preparation used 100 ng of DNA. After the enzymatic fragmentation of the material to obtain 180–220 bp DNA fragments, the end repair and A-tailing were performed. Next, the indexed adapters were ligated, the double-size selection was performed, and the libraries were amplified. The concentration of the resulting libraries was determined by a Quantus Fluorometer with a QuantiFluor ONE Double-Stranded DNA System (Promega, Madison, WI, USA), and the quality check was performed using an Agilent Bioanalyzer (Agilent Technologies, Santa Clara, CA, USA). The obtained libraries were mixed in equimolar concentrations to form a 1400 ng pool. After COT (Human Cot-1 DNA®, NimbleGen SeqCap EZ Accessory Kit v2, Roche, Basel, Switzerland) and complementary adapter oligos (SeqCap Adapter Kit Band hybridization, Roche) were added, the sample was condensed using a PCR clean speed vac for 30 min at 60 °C. The resulting pool was mixed with probes and additional reagents from a SeqCap EZ Custom Enrichment Kit, denatured at 95 °C for 10 min and incubated at 47 °C for at least 17 h to allow proper probe binding. After overnight incubation, the mixture of pooled libraries was purified using special HyperCap beads (HyperCap Bead Kit, Roche) and later amplified. During that step, the libraries were enriched with fragments of interest. The quality of the obtained libraries was evaluated using an Agilent Bioanalyzer with a High-Sensitivity DNA Kit (Agilent Technologies, Palo Alto, CA, USA). The quantification of the libraries was performed using a Quantus Fluorometer and a QuantiFluor Double-Stranded DNA System (Promega, Madison, WI, USA). The libraries were run in a rapid-run flow cell and paired-end sequenced (2 × 76 bp) on a HiSeq 1500 (Illumina, San Diego, CA, USA).

2.5. ccfDNA Sequencing

The quality of ccfDNA was evaluated using an Agilent Bioanalyzer with a High-Sensitivity DNA Kit (Agilent Technologies, Palo Alto, CA, USA). Most of the samples contained fragments that averaged around 167 bp. Samples that only displayed fragments longer than 2000 bp or had no detectable nucleic acid signal were eliminated from further processing. The libraries were prepared using a Sure Select XT HS Target Enrichment System for Illumina Paired-End Multiplexed Sequencing Library (Agilent Technologies, Palo Alto, CA, USA) according to the manufacturer’s protocol (version C 2 July 2019), with only a few adjustments. The fragmentation step was skipped for all the ccfDNA samples because properly isolated DNA is characterized by a 120–200 bp fragment size.
The libraries were prepared from the scarce amounts of ccfDNA material, which varied between 0.5 and 10 ng depending on the sample. The ends were repaired and a dA-tail was added to the 3′ ends. The next step was the ligation of molecular-barcoded adapters. During this step, unique molecular identifiers were attached to each DNA fragment, labeling each as an original and unique sequence prior to PCR amplification. This step was crucial in allowing a clear verification of false positives during the later stages of the bioinformatic analysis of the sequenced data. The remaining molecular-barcoded adapters were removed by AM Pure Bead purification prior to the PCR-amplification step. Due to the small quantity of ccfDNA, 14 PCR cycles were performed, during which SureSelect XT HS Index Primers were added to label each sample.
According to current reports [34,35], the enrichment of ccfDNA in shorter fragments can improve tDNA detection, so an additional right-sided size-selection step, using AM Pure Beads (Beckman Coulter, Brea, CA, USA), was added to the protocol. The quality of the resulting libraries was evaluated using an Agilent Bioanalyzer with a High-Sensitivity DNA Kit (Agilent Technologies, Palo Alto, CA, USA). The hybridization and capture were conducted according to the manufacturer’s protocol (version C 2 July 2019). Finally, the quality of the obtained libraries was evaluated using an Agilent Bioanalyzer as described above. The libraries were run in a rapid-run flow cell and were paired-end sequenced (2 × 100 bp) on a HiSeq 1500 (Illumina, San Diego, CA, USA), as recommended by the manufacturer.

2.6. Bioinformatic Analyses

Somatic variants pipeline. The FASTQ files obtained from sequencing the ctDNA and gDNA samples were processed with a trimmomatic program [36] to remove low-quality reads and sequencing adapters. Filtered and trimmed reads were mapped to the human genome (hg38) by NextGenMap aligner (http://cibiv.github.io/NextGenMap/ (accessed on 8 November 2021)) [37]. Any read duplicates were marked and removed by Picard (https://broadinstitute.github.io/picard/ (accessed on 8 November 2021)) [38], and only properly oriented and uniquely mapped reads were considered for further analysis. For somatic ctDNA calls, a minimum coverage of 10 reads was established. Additionally, variants with strand-supporting-read bias were discarded. Only coding variants with damaging predicted SIFT values (>0.05) were selected. The ProcessSomatic method from VarScan2 [39] was applied to extract high-confidence somatic cells based on variant allele frequency and Fisher’s exact test p-value. The final subset of variants was annotated with Annovar (http://annovar.openbioinformatics.org/en/latest/ (accessed on 8 November 2021)) [40], using the latest databases versions (refGene, clinvar, cosmic, avsnp150 and dbnsfp30a). Finally, the maftools R library [41] was used to analyze the resulting somatic variants.
ccfDNA data analysis. In the current study, tumor and blood samples were processed using a dedicated pipeline based on open-source bioinformatics tools, while the ccfDNA samples were treated using SureCall (https://www.agilent.com/en/product/next-generation-sequencing/hybridization-based-next-generation-sequencing-ngs/ngs-software/surecall-232880 (accessed on 16 January 2022)), which is dedicated software provided by a library-preparation reagent manufacturer. The raw sequencing reads from both tumor and blood samples were converted to fastq files with bcl2fastq software (https://emea.support.illumina.com/sequencing/sequencing_software/bcl2fastq-conversion-software.html (accessed on 16 January 2022)) from Illumina. The quality control of obtained reads was performed using the FastQC tool. The raw reads obtained from the ccfDNA samples were processed and converted to a fastq format, which allowed the mutant variants to be detected using SureCall software. Each somatic mutation within the tumor was assigned to a corresponding read from ccfDNA. Annotation of variants obtained by ccfDNA sequencing was performed.
To find somatic variants, reads of sufficient quality were mapped to the human reference genome, hg19, using the bwa package and standard parameters because the library manufacturer’s pipeline is a proprietary software solution that could not be modified to be compatible with hg38. This was followed by a recalibration, de-duplication, and variant-calling in somatic mode using the appropriate tools from the GATK package [42]. Among others, BaseRecalibrator, MarkDuplicates, and Mutect2 were used. The obtained vcf files were annotated using the Annovar (http://annovar.openbioinformatics.org/en/latest/ (accessed on 16 January 2022)) [40] package with appropriate databases (refGene and ClinVar, among others). Mutations, which were supported for at least 10 raw reads and found only in tumor samples, were filtered out and treated as potentially pathogenic. Somatic variant calls were retained that presented at less than 1% mutant allelic frequency in the gDNA, but with at least 1% allelic frequency and at least 3 reads supporting variant alleles in the tumor samples. We filtered the mutations reported in dbSNP (v137) and the 1000 Genomes database. Copy number variations (CNVs) were detected using ADTEx (http://adtex.sourceforge.net (accessed on 15 February 2022)) with default parameters. The germline CNVs from each patient were identified using the blood sample and normal human HapMap DNA sample NA18535 (Coriell Institute) for each captured region (exonic region). The somatic CNVs were identified using paired blood DNA–tumor DNA samples for each exon. The data were deposited to European Genome-phenome Archive EGA (http://www.ebi.ac.uk/ega/ (accessed on 25 July 2022)), hosted by the European Bioinformatics Institute (EBI) under accession numbers EGAS00001006451 and EGAD00001009080.
Statistical analysis. The statistical significance was calculated using a t-test with GraphPad Prism v6 (GraphPad Software, San Diego, CA, USA). p-values < 0.05 were considered significant.

3. Results

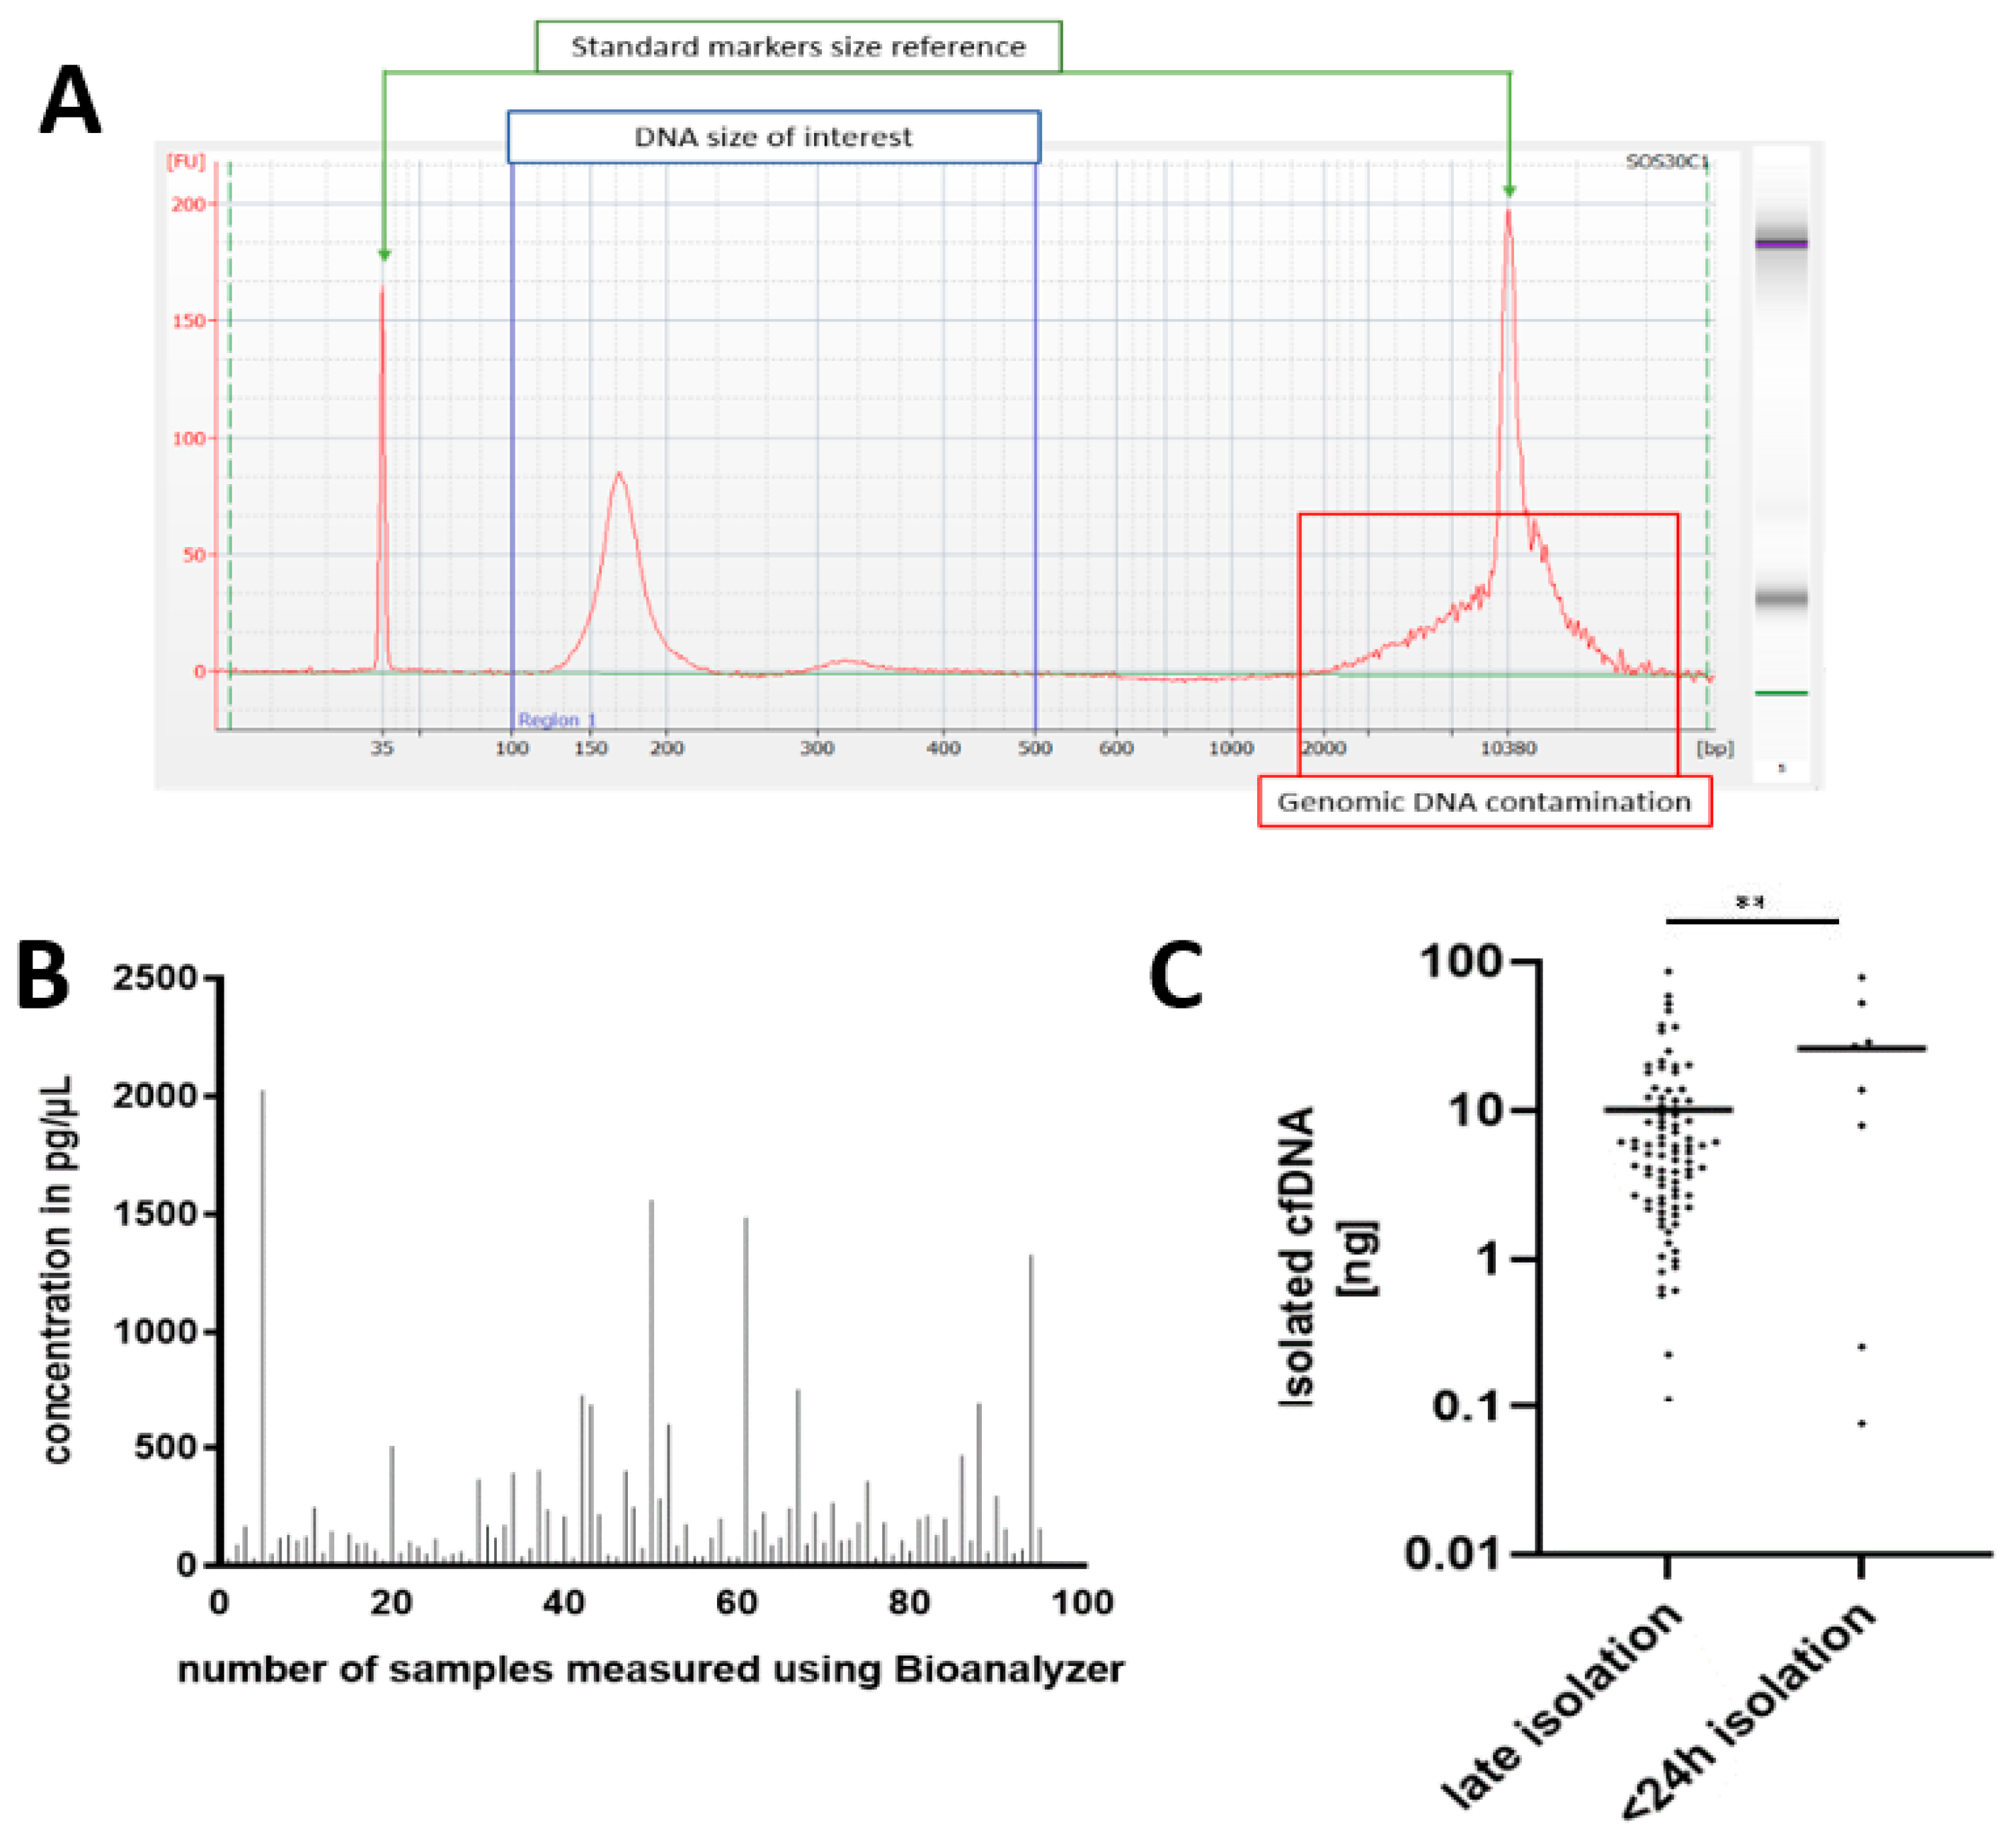
3.1. Cohort Characteristics and Quality Control

The initial cohort included 126 patients from whom clinical data, including age, sex, and diagnosis, were collected. The majority of the cohort was composed of patients with gliomas: WHO grade 4 (92), grade 3 (11), grade 2 (15), and grade 1 (1). There were also PCNSL (2), metastatic cancers (4), brain aneurysm (1). The clinical characteristics of this cohort are available in Supplementary Table S1 and as a summary in Figure 1A,B. The matching pairs of bulk-tumor and whole-blood samples were collected. The blood for ccfDNA isolation was collected from most patients prior to and after surgery.

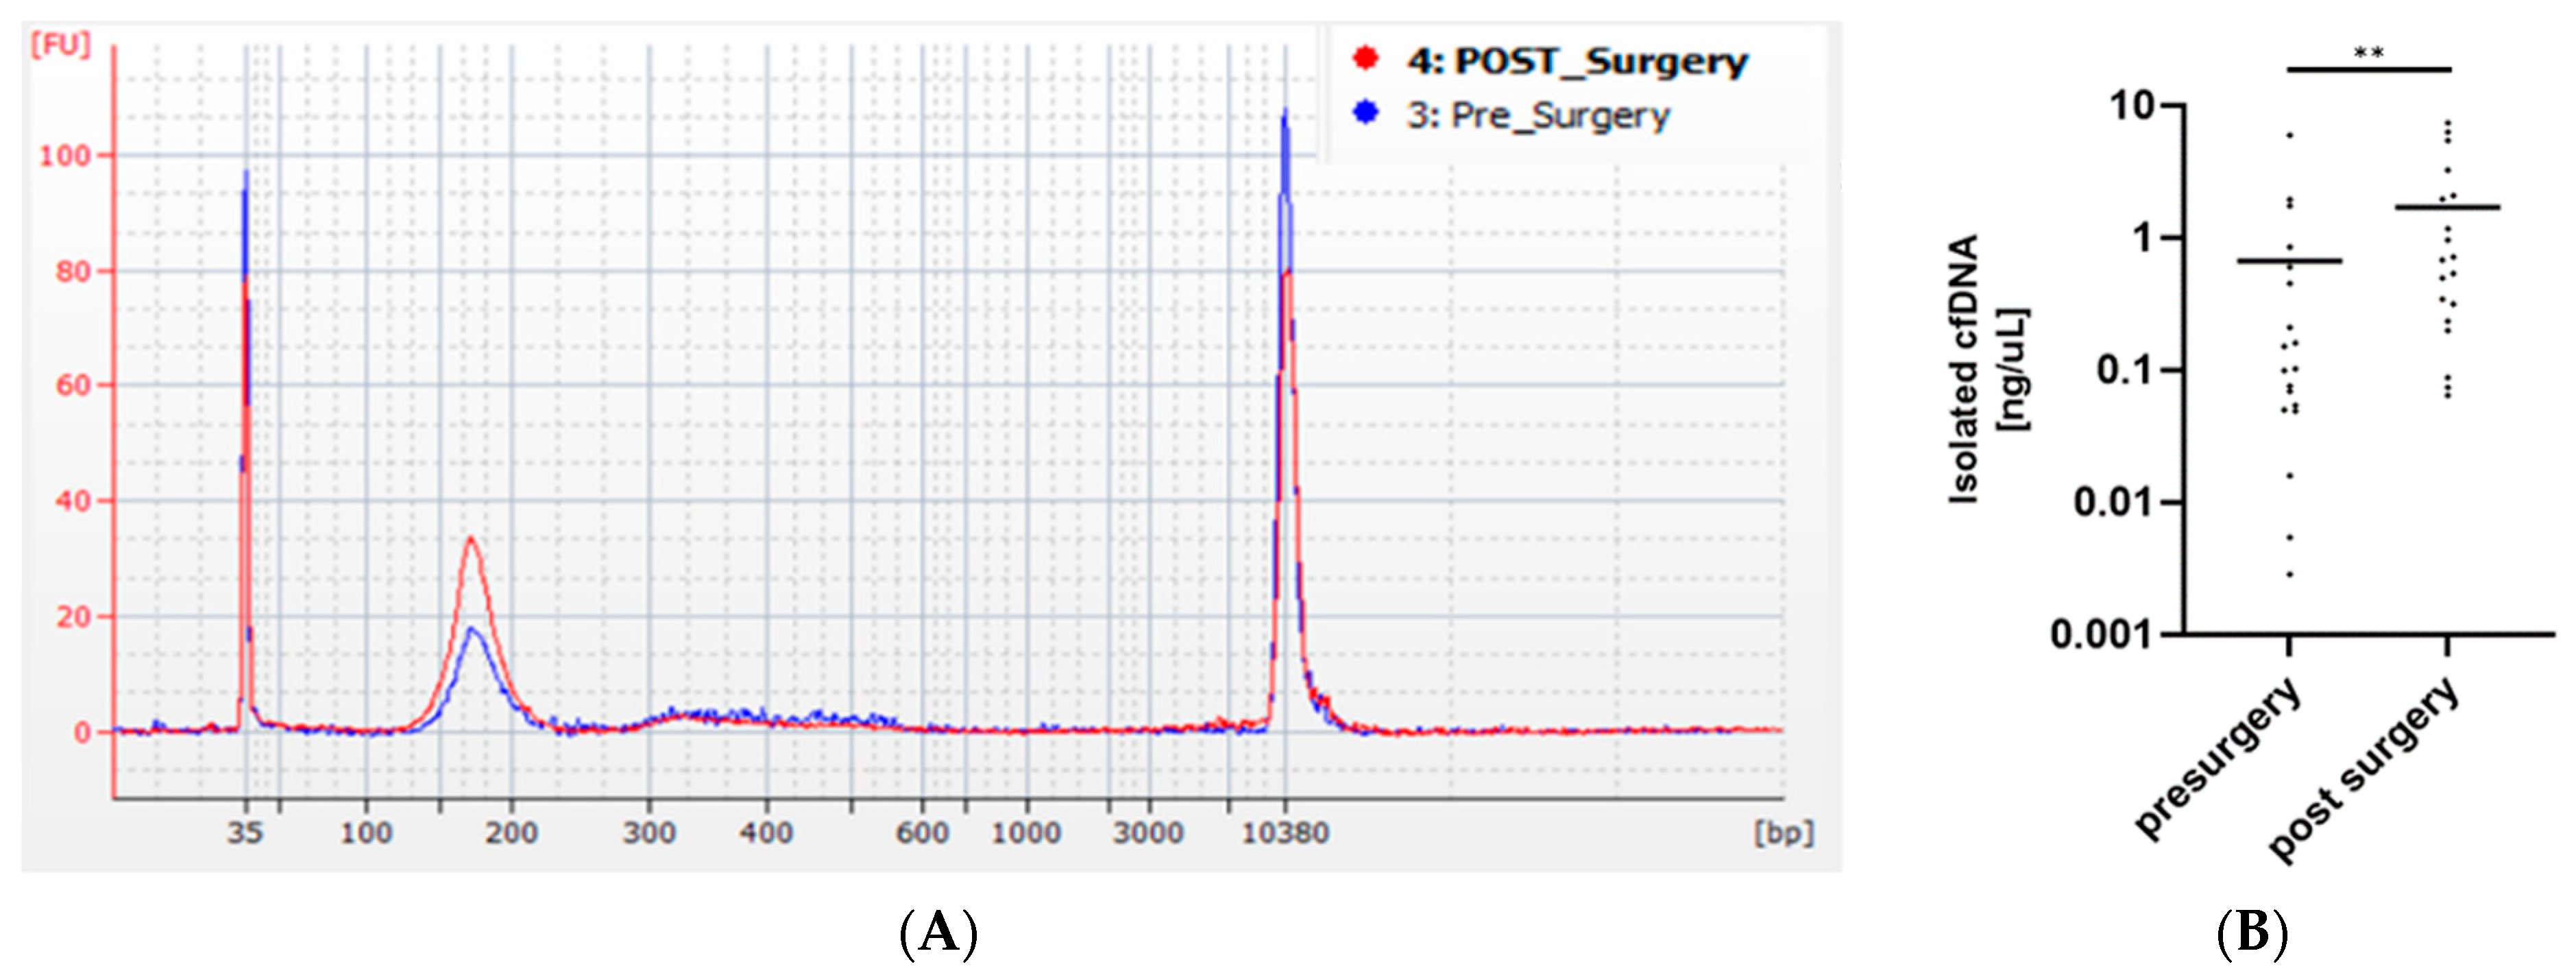
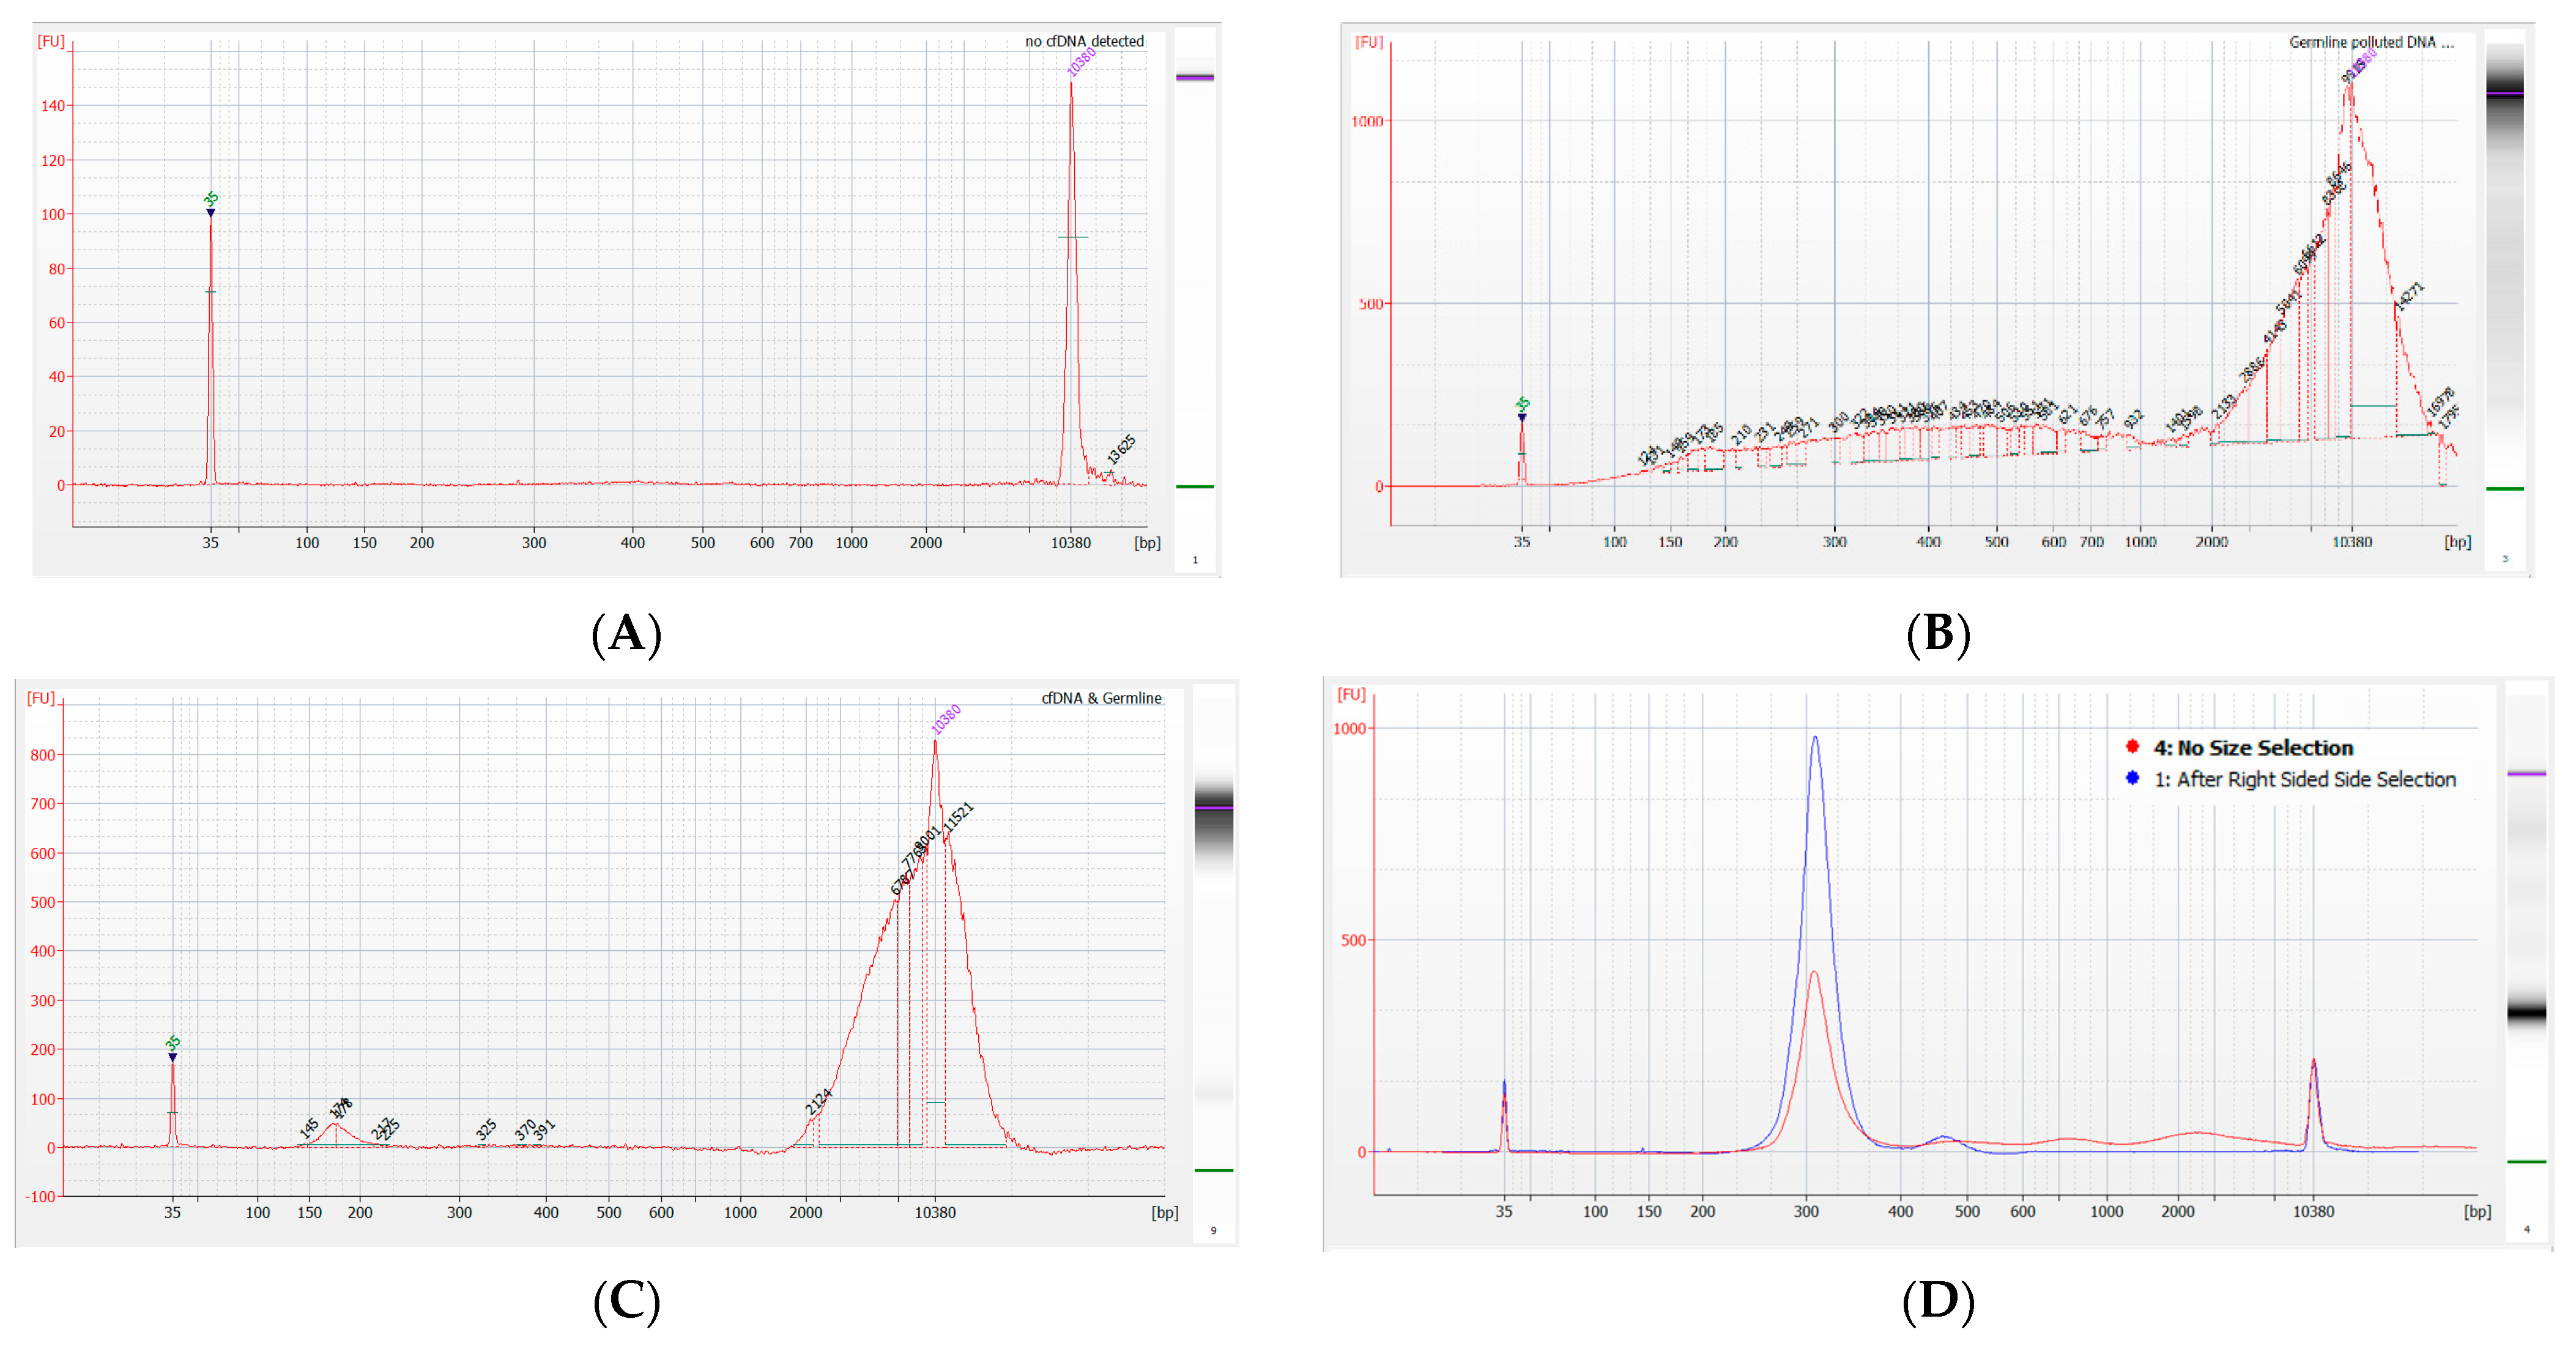
3.2. Precise Quantification of ccfDNA Demonstrates Importance of Fast Blood Processing and Marked Increase in ccfDNA after Surgery

The determination of the purity, quality, and quantity of the starting material was required for the precise control of the further steps. We used microchip-based capillary electrophoresis to quantify those parameters. While this protocol is not regular, we found it produces reliable and precise results for the quantity and quality of low-abundance DNA.
Due to collecting materials from different surgery clinics, the blood for ccfDNA isolation was stored in PAXgene blood ccfDNA tubes for varying times prior to isolation, allowing a comparison of its quality after short- and long-term storage (Figure 2A). ctDNA is usually short in size [29,30]; therefore, to improve its detection, we performed right-sided size selection using magnetic beads. Some blood samples were not eligible for ccfDNA isolation due to hemolysis; others failed quality control. In summary, ccfDNA (ranging in size from 100 to 500 bp) was quantified for 95 patients (Figure 2B). The unpaired t-tests confirmed that ccfDNA isolated within 24 h after the blood collection (n = 8) had a significantly higher yield (Figure 2C) compared with the rest of the samples that were not subjected to ccfDNA isolation for more than 24 h (n = 87).
The pre- and postsurgery isolated ccfDNA concentrations were measured in 19 patients (Figure 3A), and a significant increase in ccfDNA levels in the blood after surgery was detected (Figure 3B). The library preparation of the complete sets of preoperative ccfDNA, ctDNA, and reference gDNA was successful in the case of 84 patients.
The libraries were prepared from various quantities (0.5–10 ng) of ccfDNA. Quality control step using Bioanalyzer (Agilent Technologies, Palo Alto, CA, USA) excluded samples with no visible ccfDNA (Figure 4A) or ones that had significant amounts of long DNA fragments polluting ccfDNA samples (Figure 4B). Samples with long DNA fragment pollution, but distinguishable ccfDNA signal were used in further library preparation (Figure 4C). Prior to hybridization, right-sided size selection was performed using AM Pure Beads (Beckman Coulter) to enrich the final library into shorter fragments (Figure 4D) and remove fragments longer than 500 bp. The libraries were prepared without DNA fragmentation. Such small improvements may increase the detection of ctDNA, according to recent reports [34,35].

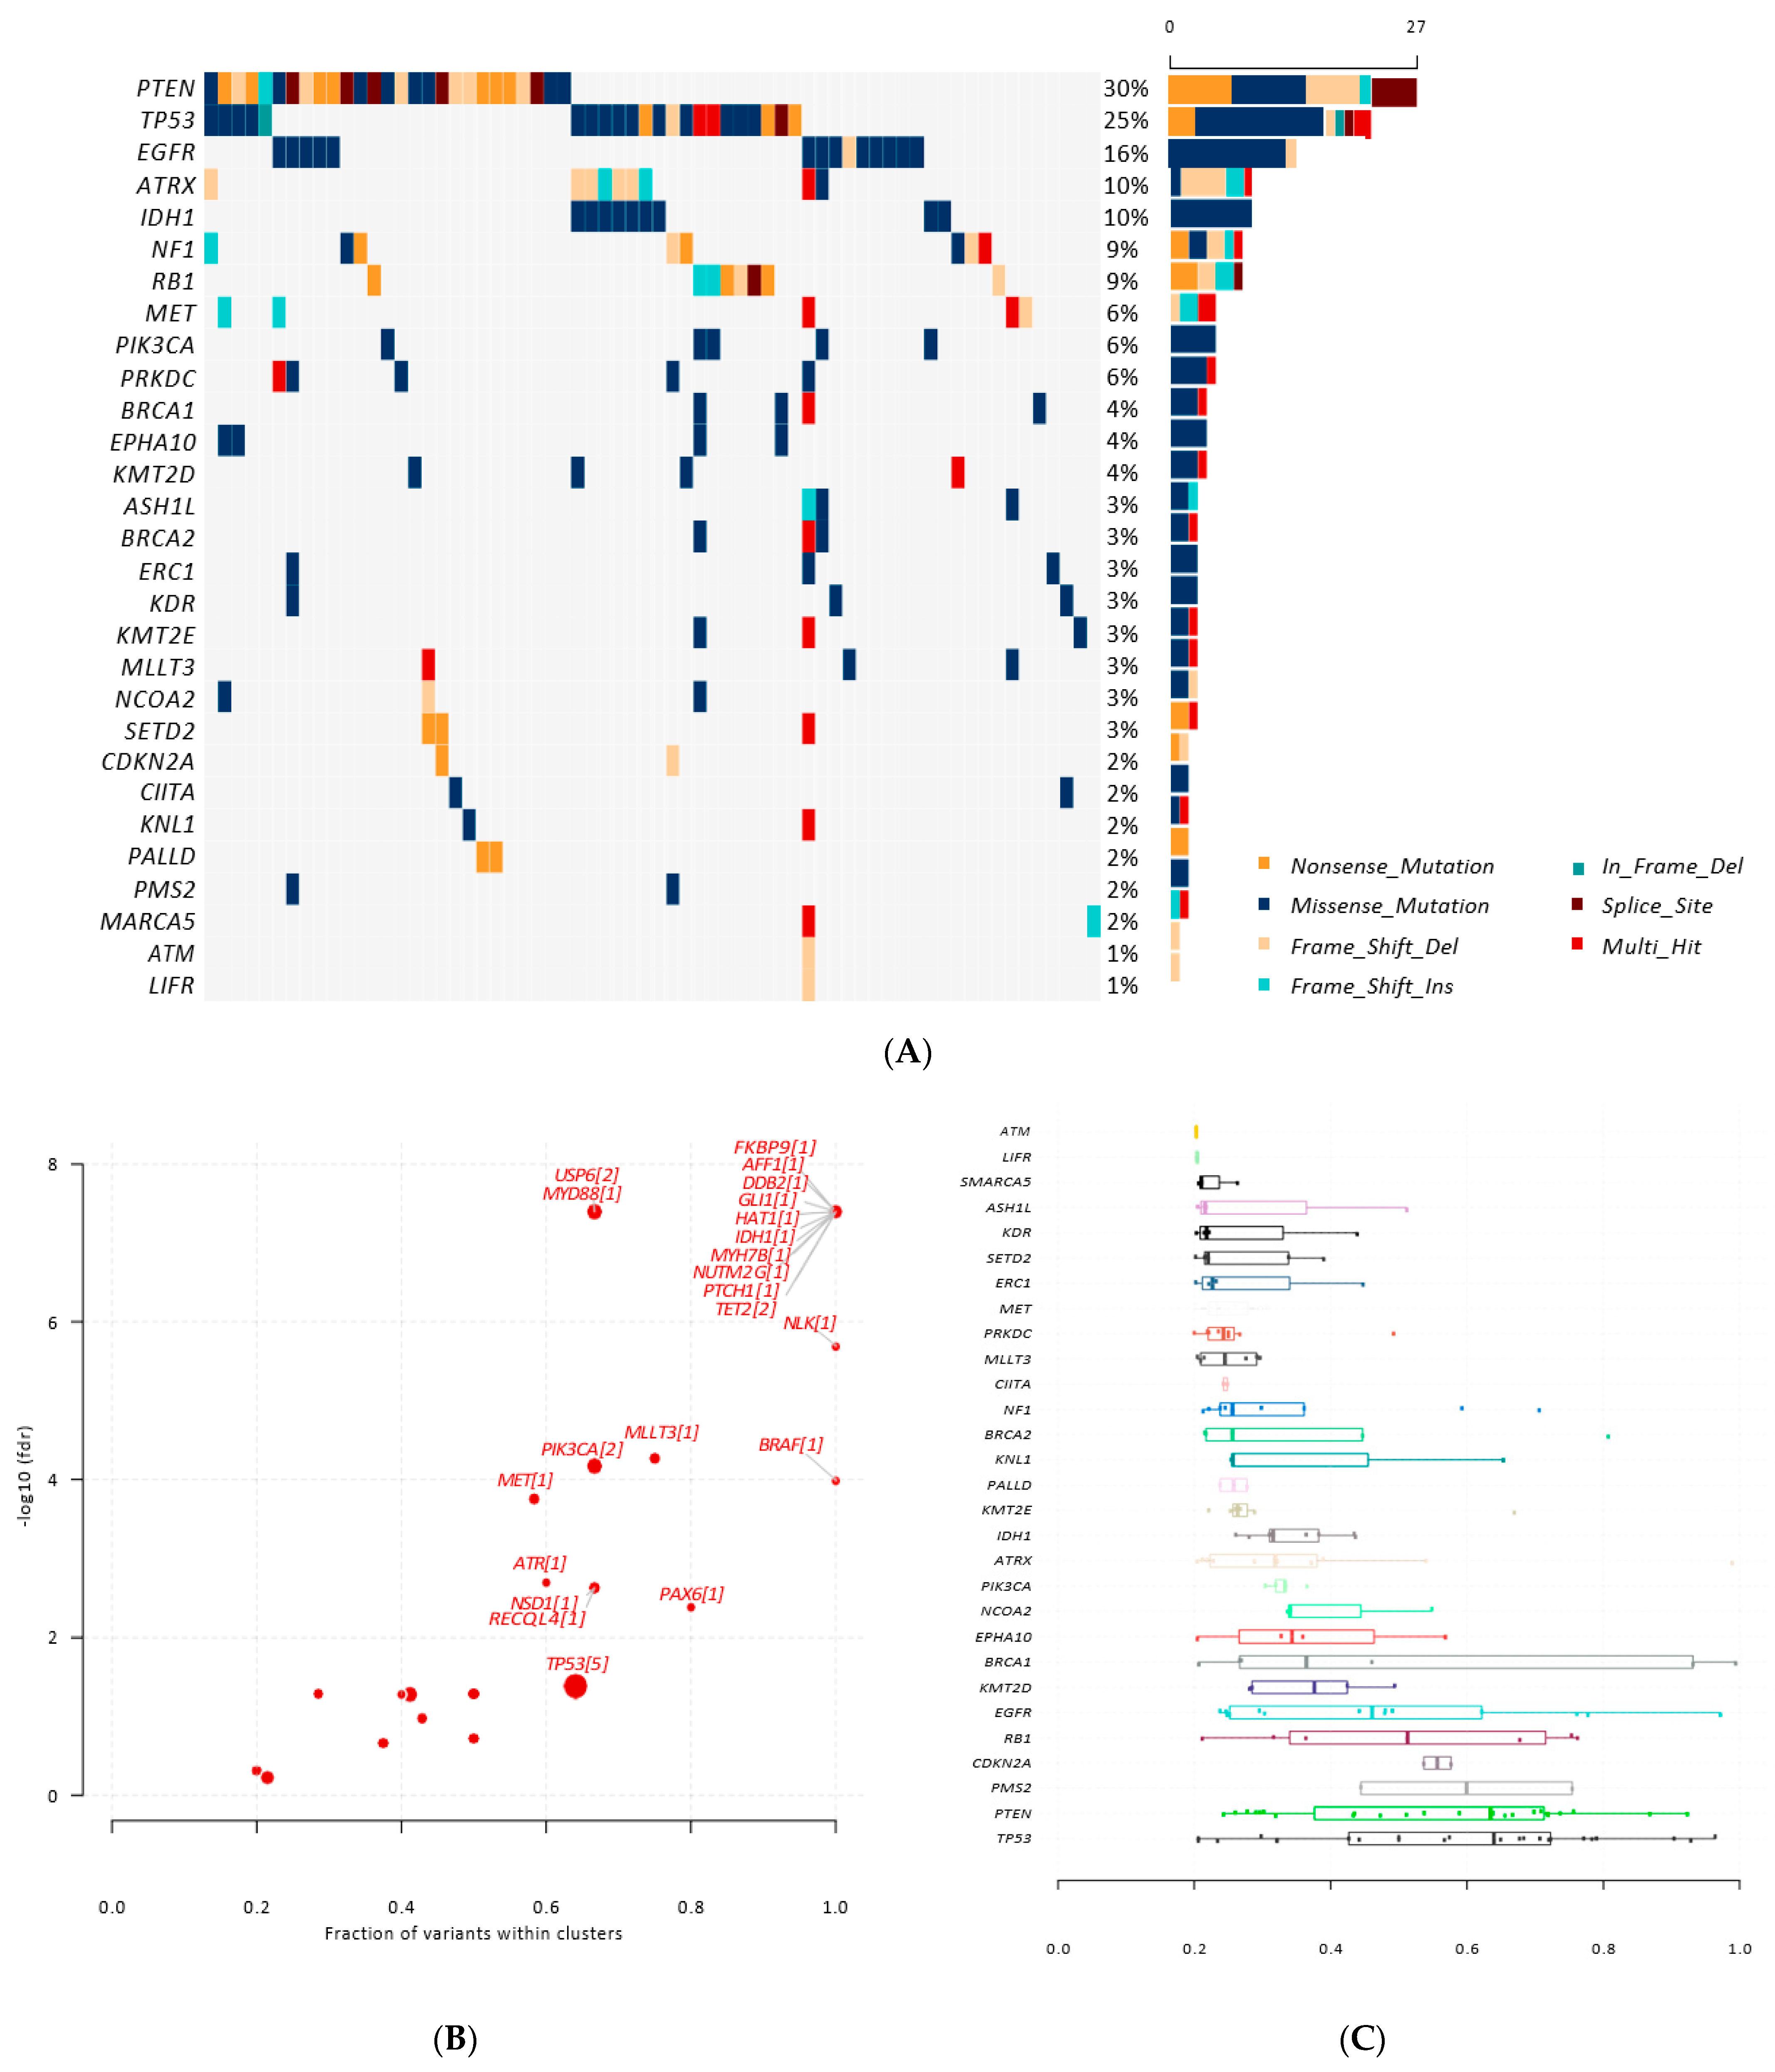
3.3. Identification of Somatic and Germline Variants

First, we performed targeted sequencing to identify somatic and germline variants in the tDNA and gDNA samples. The most frequently found somatic mutations in the cohort were PTEN, TP53, EGFR, ATRX, IDH1, and NF1 (Figure 5A), in coherence with the findings in our previous study [43]. We used an oncodriveCLUST algorithm [44] to identify cancer drivers based on mutational clustering and found several variants enriched at the TP53 (five clusters), RECQL4 (one cluster), PIK3CA (two clusters), and IDH1 (one cluster) genes, among many others (Figure 5B). The variations between the tumor samples’ mutation penetration were reviewed by comparing the allele frequencies of detected somatic variants within specific gene regions (Figure 5C).
We found that TP53 and PTEN frequently harbored mutations with high variant allele frequencies (VAFs), suggesting the presence of homozygous mutations in some patients (Figure 5C). The RB1, EGFR and CDKN2A genes exhibited mutations with VAFs close to 0.5, indicating the loss of heterozygosity in those mutations [45]. In terms of the germline analysis, we found a mutation in the AKAP9 (T1334fs) gene in 36 of the 89 patients; this variant had no clinical or mutational annotation format (MAF) data. The germline variant allele frequencies were close to 0.5, implying heterozygous mutations.

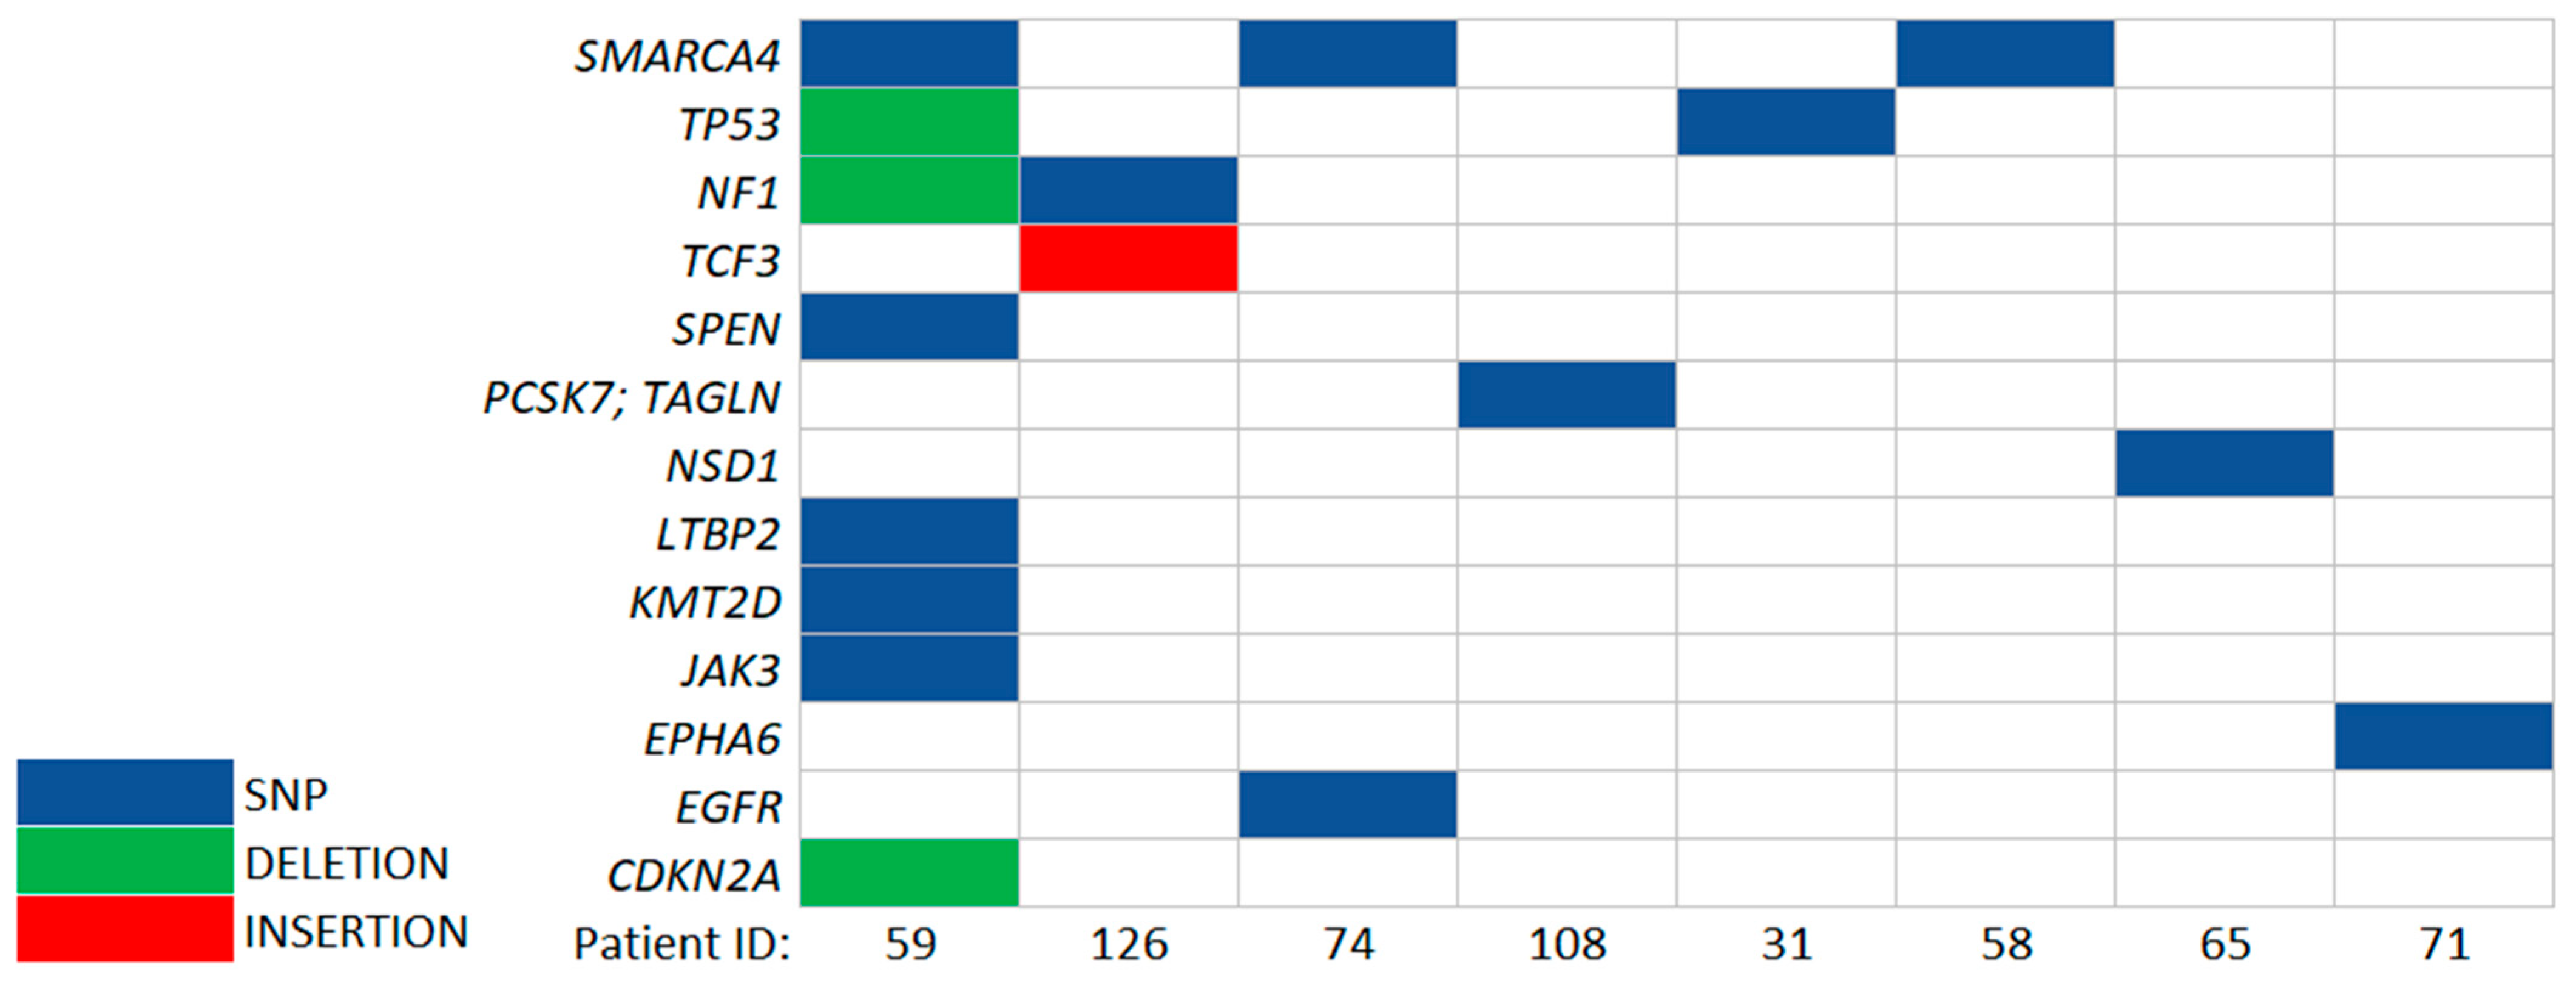
3.4. Identification of Somatic Variants in ccfDNA

ccfDNA was sequenced using the preselected 50-gene custom panel to achieve a deep sequencing coverage. Based on a previous study [33], we selected the top 50 altered genes in the Polish population of 182 gliomas that had diagnostic or prognostic potential (Supplementary File S2). The obtained data were compared with those of cells from the analysis of the somatic variants shown above. This resulted in finding the same somatic genetic alterations in both ccfDNA and ctDNA of eight patients, including five WHO grade 3 or 4 glioma patients, one1 PCNSL patient, and two metastatic brain patients (Table 1).
The SMARCA4 mutation had a 0.71 allele frequency (AF) in the ctDNA, and a significant mutation penetration was detected at AF 0.23 in ccfDNA, but no change was registered in gDNA (patient ID 59). The applied pipeline was very stringent and might not detect all single-nucleotide variations (SNVs) present in ccfDNA. For example, the somatic variant in IDH1 was detected using IGV genome browser [46] but was not detectable as an SNV from the Surecall pipeline.

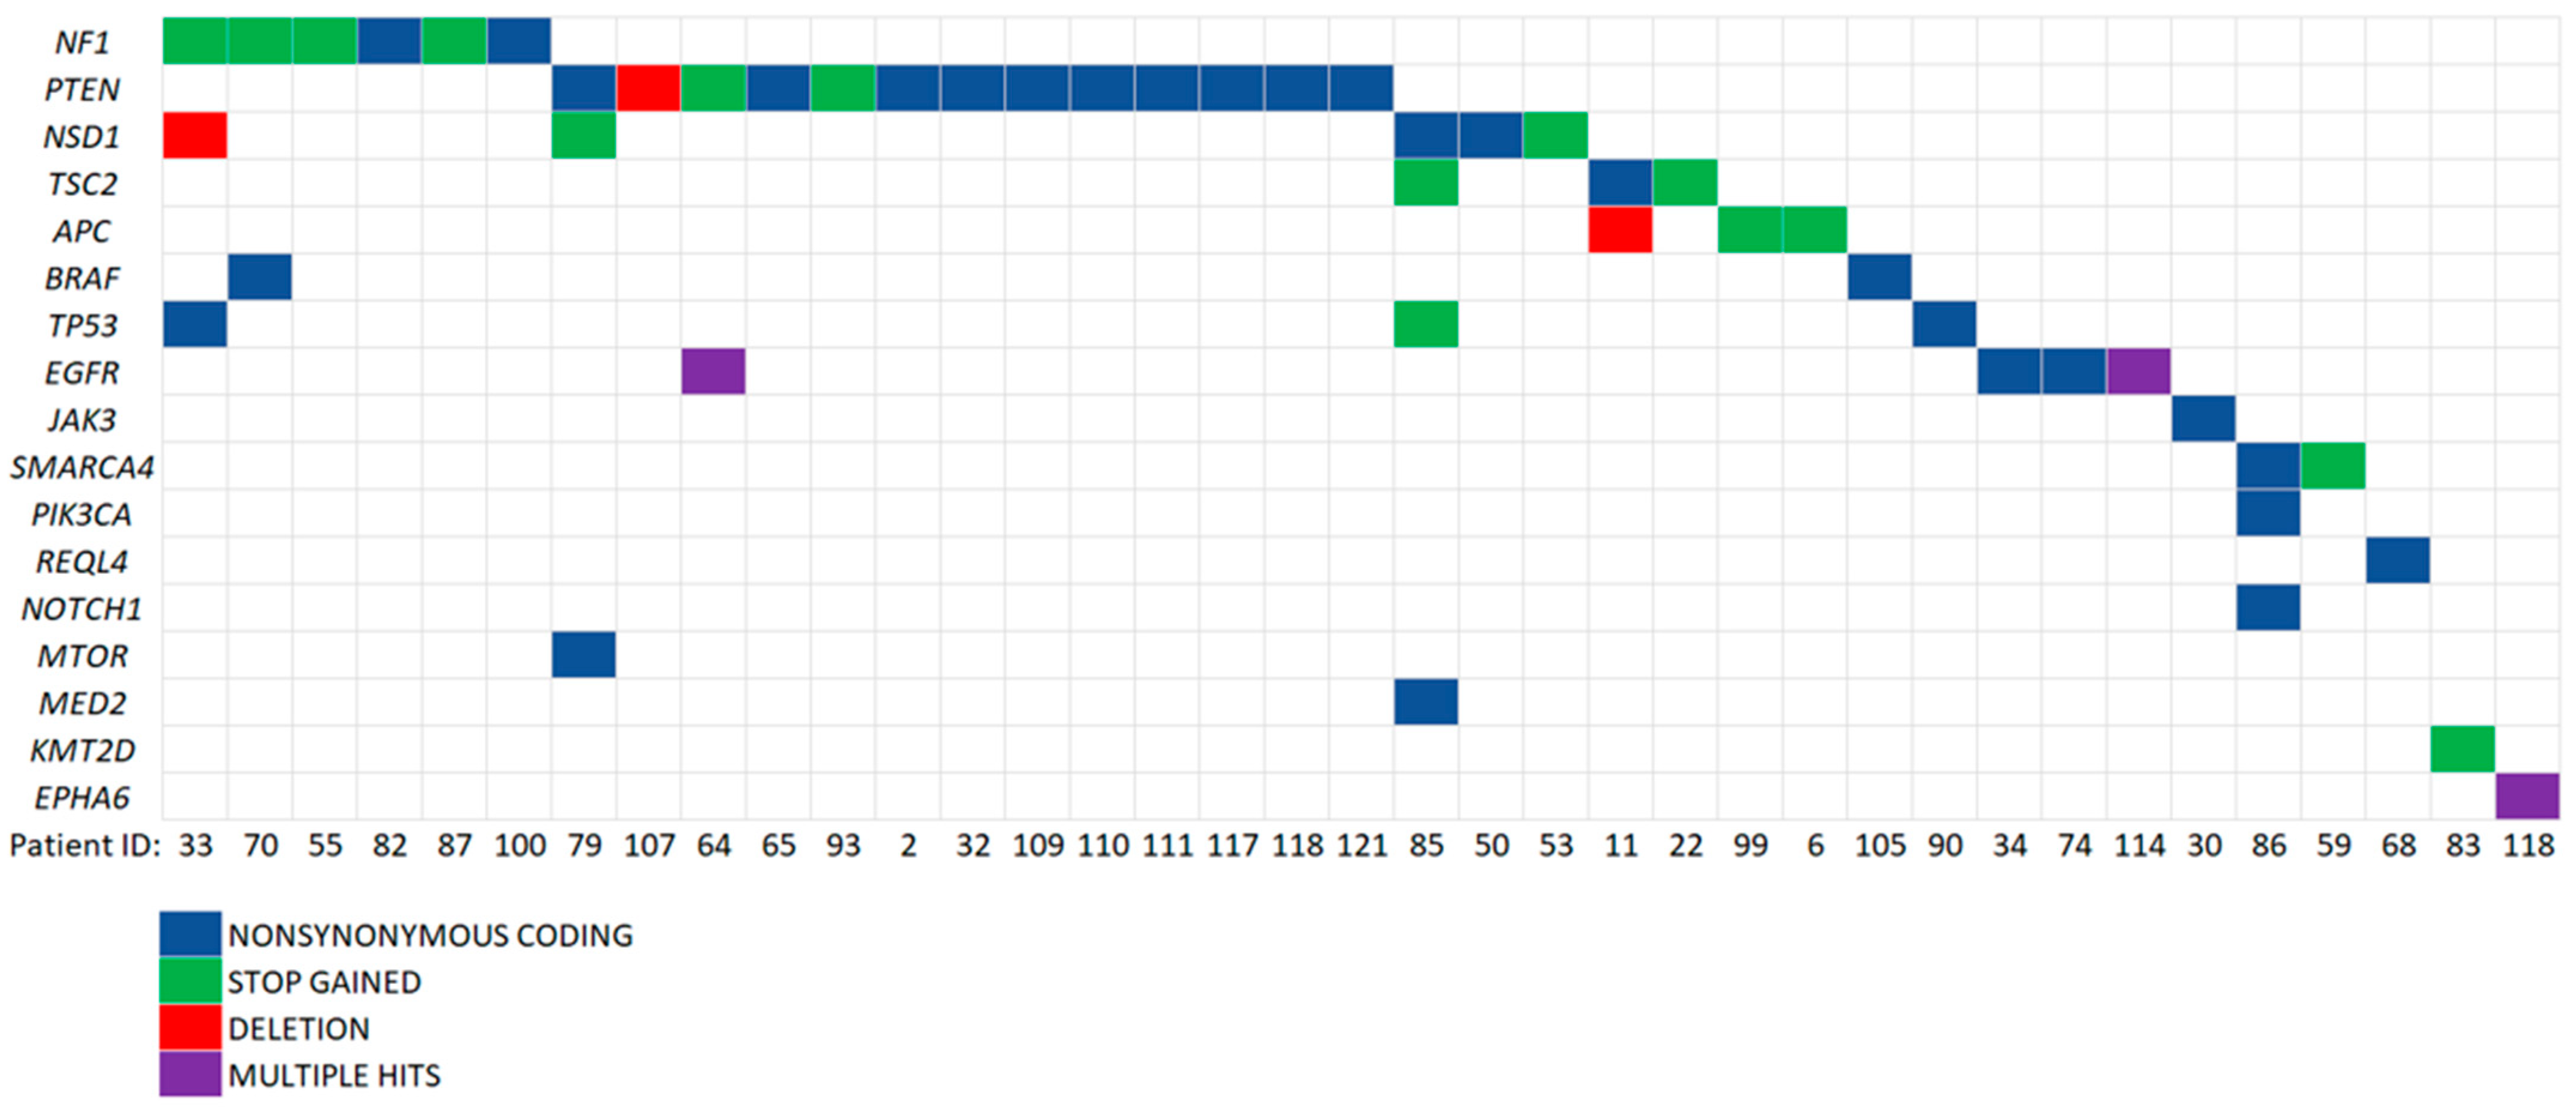
3.5. Potentially Pathogenic Variants Found in ccfDNA, but Not gDNA

Genetic variant databases have recently improved, thus allowing identification of extremely rare variants (based on EXAC, TOPMED, gnomAD, and 1000 Genomes data projects). Pathogenic, likely pathogenic, or disease-coexisting variants are also registered in databases such as ClinVar or COSMIC. Malignant gliomas (particularly GBMs) are genetically heterogeneous [47]. Thus, removing a tumor fragment is intrinsically limited to encompassing its complete mutational heterogeneity. Based upon this assumption, an additional analysis was performed. First, the variants detected in ccfDNA but not in gDNA were filtered, then potentially pathogenic variants were identified. The COSMIC registered coding variants present in ccfDNA but not in gDNA are presented in Figure 6 and Table 2. Most of the selected SNVs were also registered in the ClinVar database as pathogenic or likely pathogenic; some were extremely rare in the population (MAF, AF 1000G, and gnomAD), as shown in Table 2. Altogether, we discovered potentially pathogenic variants in ccfDNA in 25 brain tumor patients.
The SNVs detected in ccfDNA but not in gDNA were filtered out and compared with the somatic variants identified in the previously analyzed cohorts. We found potentially cancer-originating mutations in the ccfDNA samples from 16 patients. The comparison of ccfDNA variants that were not detected in gDNA with somatic variants detected in another glioma cohort (n = 57) from our previous studies [33] is presented in Table 3 and compared with somatic variants from the current study in Table 4. This analysis yielded a common PTEN benign (carrier) mutation that was frequently detected in ccfDNA (10 patients) and likely pathogenic TP53 and EGFR variants present in two additional samples of ccfDNA (Table 3). For example, the EGFR variant (rs149840192) that was found in the ccfDNA of patient 64 was registered in 36 brain tumor cases in the COSMIC database and was confirmed as somatic in one patient from our previous study [33] and in three patients from the current study (Table 4). The complete score of these analyses yielded a set of genetic variants found in ccfDNA but not in gDNA, which suggests they originated from the tumors (Figure 7).

3.6. Detection of Copy Number Alterations in ccfDNA

Copy number alteration (CNA) was another significant somatic alteration in gliomas which often showed a distinctive landscape with synchronous genomic gains or losses [48]. Recently, a new, interesting method has emerged that involves CNA analysis with the targeted panel sequencing. We tested its applicability to ccfDNA sequencing. Four samples of ccfDNA, in which we detected positive ctDNA signals, were chosen. Libraries were prepared from both ccfDNA and gDNA using a SureSelect XT library prep kit. Special probes that determine a copy-number change with a custom design covering the same gene region as the original SureSelect XT custom panel were used. We found numerous CNAs in ccfDNA. The amplifications that were registered in the COSMIC database are reported in Figure 8.

4. Discussion

The detection of ctDNA in brain tumors is still insufficient to incorporate plasma-derived liquid biopsy into clinical practice for glioma patients. CSF has been proposed as a better source of ccfDNA [14,15,27] as ctDNA is more abundant in CSF than in plasma, and the sequencing of ccfDNA isolated from CSF more comprehensively characterizes the genomic alterations of glioma. However, collecting a CSF sample by lumbar puncture is a highly invasive procedure and may cause additional complications in brain tumor patients. Therefore, we exploited a few technical improvements to find actionable genetic changes in ccfDNA from the blood plasma of malignant glioma and metastatic patients.
In the present study, we underlined how slight improvements in isolation, library preparation, and mutational analyses of ccfDNA might lead to better detection of tumor-specific genetic alterations. The results can be summarized as follows: (1) we established a reliable method to determine the precise quantity and quality of ccfDNA using an Agilent Bioanalyzer with a commercial High-Sensitivity DNA Kit; (2) we prepared libraries from ccfDNA without a fragmentation step and performed right-sided size selection, which improved the quality of library preparation; (3) using the 50-gene custom panel, we found somatic variants in ccfDNA of eight patients, which is consistent with those detected in the tumors; (4) we found several somatic variants in ccfDNA that are likely pathogenic but have not been detected in tDNA; (5) we implemented a protocol for the detection of copy number alterations with a commercially available library preparation kit and custom gene panel, which revealed copy number amplifications in ccfDNA that are likely pathogenic.
Our results suggest that there is substantial room for improvement in the sequencing of ccfDNA by shortening ccfDNA isolation time, size selection, and library preparation and deep sequencing with targeted panels. We confirmed that processing blood within 24 h after collection significantly increases the yield of isolated ccfDNA. Our findings agree with reports that showed improved ctDNA detection rates upon instantaneous plasma separation (within 2 h after blood collection) and freezing (at −80 °C) prior to ccfDNA isolation [16]. Measuring the concentration of a specific length of ccfDNA and checking the size distribution ratio using a Bioanalyzer with a commercial High-Sensitivity DNA chip allows the study of quantity, quality, and gDNA contamination levels, which can direct library preparation and ccfDNA isolation procedures. Small, targeted panels that include the most common, actionable mutations may facilitate personalized therapy for glioma patients. In our study, the applied pipeline of data analysis was very stringent, and we found cases where manually reviewing the BAM files using the IGV browser (Broad Institute, USA) showed alterations not identified by the mutect2 or Surecall pipelines. For example, a well-known IDH1 gene substitution in ccfDNA was detected in the ccfDNA BAM file in 5 out of a total of 1211 reads in the IGV browser but not in the results generated using the mutect2 or Surecall pipelines. The variant was lost in data processing, and it was likely removed by software quality control.
The most interesting finding was the nongermline, pathogenic variants in ccfDNA that were not detected in the matched tDNA. After scrutinizing numerous public databases and previous datasets of almost 280 gliomas sequenced with the custom gene panel (664 cancer-related genes), we are confident that the discovered SNVs are pathogenic. Detecting these alterations in ccfDNA, but not in the matching tumor DNA, may be explained by the reported genetic heterogeneity of glioblastoma and regional sampling of a tumor acquired for further processing. Another explanation may be that the regional differences in vascularization and local necrosis of tumor cells (which is typical for GBM) may facilitate a release of ccfDNA from specific regions.
Currently, detecting tumor-related genetic alterations in ccfDNA from a patient’s plasma is not sufficient to claim it as a diagnostic tool for glioma patients, but further research may lead to improvements in the procedure and better reproducibility. Altogether, we discovered potentially pathogenic variants in ccfDNA in 25 patients, including 24 glioma patients, although only in 5 cases were the same somatic SNVs consistently found in both ccfDNA and tumor DNA. We acknowledge that CSF in glioma patients offers better reliability and easier detection as the amount of brain-released ccfDNA is greater in CSF than in plasma, but the substantial invasiveness of the procedure for CSF biopsy must be considered. It is likely that the transient loosening of the blood–brain barrier, using mannitol or focused ultrasound blood–brain barrier disruption, can improve ctDNA detection rates. Moreover, our results indicated that a liquid biopsy from blood might yield a better representation of the overall spectrum of somatic variants present in the tumor, particularly in the case of metastatic patients. ccfDNA from blood likely contains tumor DNA from multiple tumor localizations, which can better assist in personalized therapy of primary and metastatic brain tumor patients [49,50,51,52]. A liquid biopsy from blood may be a plausible alternative for elderly brain tumor patients in which a biopsy of CSF is not recommended due to its invasiveness and danger of infection.

5. Conclusions

We demonstrated several technical improvements that allow for the precise control of the quality and quantity of ccfDNA and the application of targeted NGS to blood-derived ccfDNA. We detected ctDNA in 8 out of 84 patients, including 5 out of 80 glioma patients. Some ccfDNA showed somatic, pathogenic alterations that were not detectable in the matching tumor DNA. We concluded that while the sequencing of ccfDNA from blood has low efficacy, which prevents the use of this method as a diagnostic tool, further improvements to the isolation and processing of ccfDNA may make liquid biopsy also available for glioma patients. Our results show that liquid biopsy from blood is likely a better representation of the overall landscape of the somatic variants present in the tumor, particularly in the case of metastatic patients. ccfDNA from blood may contain tumor DNA from multiple tumor locations, which better reflects the genetic landscape of the primary and metastatic brain tumors [49,50,51,52]. Liquid biopsy from blood could also be an alternative for nonoperable brain tumors or elderly brain tumor patients in which a biopsy of CSF is not recommended due to its invasiveness.

Supplementary Materials

The following supporting information can be downloaded at: https://drive.google.com/drive/folders/1dkgp8B6FAOf5Pso5MrLGjmgB_pb13I4m?usp=sharing, Supplementary Table S1: ST1; Bed Files S1, S2, S3.

Author Contributions

Conceptualization: B.K., S.N. and W.K.; methodology: B.K., B.W. and P.S.; software: S.L., T.W., T.G., K.Z., A.-J.R. and B.W.; validation: B.W., A.-J.R., S.L., T.W., T.G., K.Z. and P.S.; formal analysis, S.L., T.W., T.G., K.Z., A.-J.R. and K.W. (Kamil Wojnicki); investigation: P.S., M.K. and K.W. (Kinga Wilkus); resources: P.S. and M.K.; data curation: B.W., A.-J.R., S.L., T.W., T.G., K.Z. and P.S.; writing—original draft preparation: P.S. and B.K.; writing—review and editing: B.K. and P.S.; visualization: P.S., A.-J.R. and K.W. (Kamil Wojnicki); supervision: B.K.; project administration: S.N., B.K. and W.K.; funding acquisition: B.K., S.N. and W.K. All authors have read and agreed to the published version of the manuscript.

Funding

This study was supported by the grant GLIOMED STRATEGMED3/307326/6/NCBR/2017 from The National Center of Research and Development, Poland and by the Foundation for Polish Science TEAM-TECH Core Facility project “NGS platform for comprehensive diagnostics and personalized therapy in neuro-oncology”. The use of CePT infrastructure was financed by the European Union—The European Regional Development Fund within the Operational Program “Innovative Economy” for 2007–2013 and was highly appreciated. The funders had no role in study design, data collection and analysis, decision to publish or preparation of the manuscript. This publication was partially supported by the EU Horizon 2020 program under grant Sano No. 857533 and by the International Agendas program of the Foundation for Polish Science, cofinanced by the European Union under the European Regional Development Fund.

Institutional Review Board Statement

The study was conducted in accordance with the Declaration of Helsinki and approved by the Ethics Committee of Medical University of Silesia (protocol code KNW/0022/KB1/2/I/17 and date of approval: 11 July 2017).

Informed Consent Statement

Informed consent was obtained from all subjects involved in the study.

Data Availability Statement

The data from this study are openly available at the European Genome-phenome Archive (EGA), reference number EGAS00001006451 and EGAD00001009080.

Acknowledgments

We acknowledge technical support from Paulina Wiechecka, Beata Kaza, Bartlomiej Gielniewski, and Jakub Mieczkowski. We thank all the patients for their consent to use their biological material for this research. This research was supported in part by PLGrid Infrastructure.

Conflicts of Interest

The authors declare that they have no conflict of interest.

References

  1. Ignatiadis, M.; Sledge, G.W.; Jeffrey, S.S. Liquid biopsy enters the clinic—implementation issues and future challenges. Nat. Rev. Clin. Oncol. 2021, 18, 297–312. [Google Scholar] [CrossRef]
  2. Wang, Y.; Springer, S.; Zhang, M.; McMahon, K.W.; Kinde, I.; Dobbyn, L.; Ptak, J.; Brem, H.; Chaichana, K.; Gallia, G.L.; et al. Detection of tumor-derived DNA in cerebrospinal fluid of patients with primary tumors of the brain and spinal cord. Proc. Natl. Acad. Sci. USA 2015, 112, 9704–9709. [Google Scholar] [CrossRef]
  3. Jiang, W.-W.; Zahurak, M.; Goldenberg, D.; Milman, Y.; Park, H.L.; Westra, W.H.; Koch, W.; Sidransky, D.; Califano, J. Increased plasma DNA integrity index in head and neck cancer patients. Int. J. Cancer 2006, 119, 2673–2676. [Google Scholar] [CrossRef] [PubMed]
  4. Alcaide, M.; Cheung, M.; Hillman, J.; Rassekh, S.R.; Deyell, R.; Batist, G.; Karsan, A.; Wyatt, A.W.; Johnson, N.; Scott, D.W.; et al. Evaluating the quantity, quality and size distribution of cell-free DNA by multiplex droplet digital PCR. Sci. Rep. 2020, 10, 12564. [Google Scholar] [CrossRef] [PubMed]
  5. Mouliere, F.; El Messaoudi, S.; Pang, D.; Dritschilo, A.; Thierry, A.R. Multi-marker analysis of circulating cell-free DNA toward personalized medicine for colorectal cancer. Mol. Oncol. 2014, 8, 927–941. [Google Scholar] [CrossRef] [PubMed]
  6. Jiang, P.; Chan, C.W.M.; Chan, K.C.A.; Cheng, S.H.; Wong, J.; Wong, V.W.-S.; Wong, G.L.H.; Chan, S.L.; Mok, T.S.K.; Chan, H.L.Y.; et al. Lengthening and shortening of plasma DNA in hepatocellular carcinoma patients. Proc. Natl. Acad. Sci. USA 2015, 112, E1317–E1325. [Google Scholar] [CrossRef] [PubMed]
  7. Fujihara, J.; Takinami, Y.; Ueki, M.; Kimura-Kataoka, K.; Yasuda, T.; Takeshita, H. Circulating cell-free DNA fragment analysis by microchip electrophoresis and its relationship with DNase I in cardiac diseases. Clin. Chim. Acta 2019, 497, 61–66. [Google Scholar] [CrossRef] [PubMed]
  8. Martignetti, J.A.; Camacho-Vanegas, O.; Priedigkeit, N.; Camacho, C.; Pereira, E.; Lin, L.; Garnar-Wortzel, L.; Miller, D.; Losic, B.; Shah, H.; et al. Personalized Ovarian Cancer Disease Surveillance and Detection of Candidate Therapeutic Drug Target in Circulating Tumor DNA. Neoplasia 2014, 16, W28–W29. [Google Scholar] [CrossRef]
  9. Dwivedi, D.J.; Toltl, L.J.; Swystun, L.L.; Pogue, J.; Liaw, K.L.; Weitz, J.I.; Cook, D.J.; Fox-Robichaud, A.E.; Liaw, P.C. Prognostic utility and characterization of cell-free DNA in patients with severe sepsis. Crit. Care 2012, 16, R151. [Google Scholar] [CrossRef]
  10. Shi, J.; Zhang, R.; Li, J.; Zhang, R. Size profile of cell-free DNA: A beacon guiding the practice and innovation of clinical testing. Theranostics 2020, 10, 4737–4748. [Google Scholar] [CrossRef]
  11. Chan, K.A.; Leung, S.-F.; Yeung, S.-W.; Chan, A.T.; Lo, Y.D. Persistent Aberrations in Circulating DNA Integrity after radiotherapy are associated with poor prognosis in nasopharyngeal carcinoma patients. Clin. Cancer Res. 2008, 14, 4141–4145. [Google Scholar] [CrossRef]
  12. Kustanovich, A.; Schwartz, R.; Peretz, T.; Grinshpun, A. Life and death of circulating cell-free DNA. Cancer Biol. Ther. 2019, 20, 1057–1067. [Google Scholar] [CrossRef]
  13. Thierry, A.R.; El Messaoudi, S.; Gahan, P.B.; Anker, P.; Stroun, M. Origins, structures, and functions of circulating DNA in oncology. Cancer Metastasis Rev. 2016, 35, 347–376. [Google Scholar] [CrossRef]
  14. Bettegowda, C.; Sausen, M.; Leary, R.J.; Kinde, I.; Wang, Y.; Agrawal, N.; Bartlett, B.R.; Wang, H.; Luber, B.; Alani, R.M.; et al. Detection of circulating tumor DNA in early- and late-stage human malignancies. Sci. Transl. Med. 2014, 6, 224. [Google Scholar] [CrossRef]
  15. Pan, W.; Gu, W.; Nagpal, S.; Gephart, M.H.; Quake, S.R. Brain Tumor Mutations Detected in Cerebral Spinal Fluid. Clin. Chem. 2015, 61, 514–522. [Google Scholar] [CrossRef]
  16. Palande, V.; Siegal, T.; Detroja, R.; Gorohovski, A.; Glass, R.; Flueh, C.; Kanner, A.A.; Laviv, Y.; Har-Nof, S.; Levy-Barda, A.; et al. Detection of gene mutations and gene–gene fusions in circulating cell-free DNA of glioblastoma patients: An avenue for clinically relevant diagnostic analysis. Mol. Oncol. 2021, 16, 2098–2114. [Google Scholar] [CrossRef]
  17. Ostrom, Q.T.; Cioffi, G.; Gittleman, H.; Patil, N.; Waite, K.; Kruchko, C.; Barnholtz-Sloan, J.S. CBTRUS Statistical Report: Primary Brain and Other Central Nervous System Tumors Diagnosed in the United States in 2012–2016. Neuro-Oncology 2019, 21, v1–v100. [Google Scholar] [CrossRef]
  18. Stupp, R.; Mason, W.P.; van den Bent, M.J.; Weller, M.; Fisher, B.; Taphoorn, M.J.B.; Belanger, K.; Brandes, A.A.; Marosi, C.; Bogdahn, U.; et al. Radiotherapy plus Concomitant and Adjuvant Temozolomide for Glioblastoma. N. Engl. J. Med. 2005, 352, 987–996. [Google Scholar] [CrossRef]
  19. Cancer Genome Atlas Research Network. Comprehensive genomic characterization defines human glioblastoma genes and core pathways. Nature 2008, 455, 1061–1068. [Google Scholar] [CrossRef]
  20. Verhaak, R.G.W.; Hoadley, K.A.; Purdom, E.; Wang, V.; Wilkerson, M.D.; Miller, C.R.; Ding, L.; Golub, T.; Jill, P.; Alexe, G.; et al. Integrated genomic analysis identifies clinically relevant subtypes of glioblastoma characterized by abnormalities in PDGFRA, IDH1, EGFR, and NF1. Cancer Cell 2010, 17, 98–110. [Google Scholar] [CrossRef]
  21. Liau, B.B.; Sievers, C.; Donohue, L.K.; Gillespie, S.M.; Flavahan, W.A.; Miller, T.E.; Venteicher, A.S.; Hebert, C.H.; Carey, C.D.; Rodig, S.J.; et al. Adaptive chromatin remodeling drives glioblastoma stem cell plasticity and drug tolerance. Cell Stem Cell 2017, 20, 233–246. [Google Scholar] [CrossRef]
  22. Ceccarelli, M.; Barthel, F.P.; Malta, T.M.; Sabedot, T.S.; Salama, S.R.; Murray, B.A.; Morozova, O.; Newton, Y.; Radenbaugh, A.; Pagnotta, S.M.; et al. Molecular profiling reveals biologically discrete subsets and pathways of progression in diffuse glioma. Cell 2016, 164, 550–563. [Google Scholar] [CrossRef]
  23. Brennan, C.W.; Verhaak, R.G.W.; McKenna, A.; Campos, B.; Noushmehr, H.; Salama, S.R.; Zheng, S.; Chakravarty, D.; Sanborn, J.Z.; Berman, S.H.; et al. The somatic genomic landscape of glioblastoma. Cell 2013, 155, 462–477, Erratum in Cell 2014, 157, 753. [Google Scholar] [CrossRef]
  24. Kanemaru, Y.; Natsumeda, M.; Okada, M.; Saito, R.; Kobayashi, D.; Eda, T.; Watanabe, J.; Saito, S.; Tsukamoto, Y.; Oishi, M.; et al. Dramatic response of BRAF V600E-mutant epithelioid glioblastoma to combination therapy with BRAF and MEK inhibitor: Establishment and xenograft of a cell line to predict clinical efficacy. Acta Neuropathol. Commun. 2019, 7, 119. [Google Scholar] [CrossRef]
  25. Borges, K.S.; Castro-Gamero, A.M.; Moreno, D.A.; Silveira, V.D.S.; Brassesco, M.; Queiroz, R.G.D.P.; de Oliveira, H.F.; Carlotti, C.G.; Scrideli, C.; Tone, L.G. Inhibition of Aurora kinases enhances chemosensitivity to temozolomide and causes radiosensitization in glioblastoma cells. J. Cancer Res. Clin. Oncol. 2011, 138, 405–414. [Google Scholar] [CrossRef]
  26. Magalhães, T.D.A.; de Sousa, G.R.; Cruzeiro, G.A.V.; Tone, L.G.; Valera, E.T.; Borges, K.S. The therapeutic potential of Aurora kinases targeting in glioblastoma: From preclinical research to translational oncology. Klin. Wochenschr. 2020, 98, 495–512. [Google Scholar] [CrossRef]
  27. De Mattos-Arruda, L.; Mayor, R.; Ng, C.K.Y.; Weigelt, B.; Martinez-Ricarte, F.; Torrejon, D.; Oliveira, M.; Arias, A.; Raventos, C.; Tang, J.; et al. Cerebrospinal fluid-derived circulating tumour DNA better represents the genomic alterations of brain tumours than plasma. Nat. Commun. 2015, 6, 8839. [Google Scholar] [CrossRef]
  28. Martínez-Ricarte, F.; Mayor, R.; Martínez-Sáez, E.; Rubio-Pérez, C.; Pineda, E.; Cordero, E.; Cicuéndez, M.; Poca, M.A.; López-Bigas, N.; Cajal, S.R.Y.; et al. Molecular diagnosis of diffuse gliomas through sequencing of cell-free circulating tumor DNA from cerebrospinal fluid. Clin. Cancer Res. 2018, 24, 2812–2819. [Google Scholar] [CrossRef] [PubMed]
  29. Pentsova, E.I.; Shah, R.; Tang, J.; Boire, A.; You, D.; Briggs, S.; Omuro, A.; Lin, X.; Fleisher, M.; Grommes, C.; et al. Evaluating cancer of the central nervous system through next-generation sequencing of cerebrospinal fluid. J. Clin. Oncol. 2016, 34, 2404–2415. [Google Scholar] [CrossRef] [PubMed]
  30. Dawson, M.A.; Kouzarides, T. Cancer epigenetics: From mechanism to therapy. Cell 2012, 150, 12–27. [Google Scholar] [CrossRef] [PubMed]
  31. Maleszewska, M.; Kamińska, B. Is glioblastoma an epigenetic malignancy? Cancers 2013, 5, 1120–1139. [Google Scholar] [CrossRef]
  32. Tessarz, P.; Kouzarides, T. Histone core modifications regulating nucleosome structure and dynamics. Nat. Rev. Mol. Cell Biol. 2014, 15, 703–708. [Google Scholar] [CrossRef]
  33. Gielniewski, B.; Poleszak, K.; Roura, A.J.; Szadkowska, P.; Krol, S.K.; Guzik, R.; Wiechecka, P.; Maleszewska, M.; Kaza, B.; Marchel, A.; et al. The novel, recurrent mutation in the TOP2A gene results in the enhanced topoisomerase activity and transcription deregulation in glioblastoma. BioRxiv 2021. [Google Scholar] [CrossRef]
  34. Liu, X.; Lang, J.; Li, S.; Wang, Y.; Peng, L.; Wang, W.; Han, Y.; Qi, C.; Song, L.; Yang, S.; et al. Fragment enrichment of circulating tumor DNA with low-frequency mutations. Front. Genet. 2020, 11, 147. [Google Scholar] [CrossRef]
  35. Mouliere, F.; Chandrananda, D.; Piskorz, A.M.; Moore, E.K.; Morris, J.; Ahlborn, L.B.; Mair, R.; Goranova, T.; Marass, F.; Heider, K.; et al. Enhanced detection of circulating tumor DNA by fragment size analysis. Sci. Transl. Med. 2018, 10, eaat4921. [Google Scholar] [CrossRef]
  36. Bolger, A.M.; Lohse, M.; Usadel, B. Trimmomatic: A flexible trimmer for Illumina sequence data. Bioinformatics 2014, 30, 2114–2120. [Google Scholar] [CrossRef]
  37. Sedlazeck, F.J.; Rescheneder, P.; Von Haeseler, A. NextGenMap: Fast and accurate read mapping in highly polymorphic genomes. Bioinformatics 2013, 29, 2790–2791. [Google Scholar] [CrossRef]
  38. Petersen, K.R.; Streett, D.A.; Gerritsen, A.T.; Hunter, S.S.; Settles, M.L. Super deduper, fast PCR duplicate detection in fastq files. In Proceedings of the 6th ACM Conference on Bioinformatics, Computational Biology and Health Informatics, Atlanta, GA, USA, 9–12 September 2015; pp. 491–492. [Google Scholar]
  39. Koboldt, D.C.; Zhang, Q.; Larson, D.E.; Shen, D.; McLellan, M.D.; Lin, L.; Miller, C.A.; Mardis, E.R.; Ding, L.; Wilson, R.K. VarScan 2: Somatic mutation and copy number alteration discovery in cancer by exome sequencing. Genome Res. 2012, 22, 568–576. [Google Scholar] [CrossRef]
  40. Wang, K.; Li, M.; Hakonarson, H. ANNOVAR: Functional annotation of genetic variants from high-throughput sequencing data. Nucleic Acids Res. 2010, 38, e164. [Google Scholar] [CrossRef]
  41. Mayakonda, A.; Lin, D.-C.; Assenov, Y.; Plass, C.; Koeffler, H.P. Maftools: Efficient and comprehensive analysis of somatic variants in cancer. Genome Res. 2018, 28, 1747–1756. [Google Scholar] [CrossRef]
  42. Valle, F.D.; Giampieri, E.; Simonetti, G.; Padella, A.; Manfrini, M.; Ferrari, A.; Papayannidis, C.; Zironi, I.; Garonzi, M.; Bernardi, S.; et al. Optimized pipeline of MuTect and GATK tools to improve the detection of somatic single nucleotide polymorphisms in whole-exome sequencing data. BMC Bioinform. 2016, 17, 27–35. [Google Scholar] [CrossRef]
  43. Roura, A.-J.; Gielniewski, B.; Pilanc, P.; Szadkowska, P.; Maleszewska, M.; Krol, S.K.; Czepko, R.; Kaspera, W.; Wojtas, B.; Kaminska, B. Identification of the immune gene expression signature associated with recurrence of high-grade gliomas. Klin. Wochenschr. 2020, 99, 241–255. [Google Scholar] [CrossRef]
  44. Arnedo-Pac, C.; Mularoni, L.; Muiños, F.; Gonzalez-Perez, A.; Lopez-Bigas, N. OncodriveCLUSTL: A sequence-based clustering method to identify cancer drivers. Bioinformatics 2019, 35, 4788–4790. [Google Scholar] [CrossRef]
  45. Kim, H.; Zheng, S.; Amini, S.S.; Virk, S.M.; Mikkelsen, T.; Brat, D.J.; Grimsby, J.; Sougnez, C.; Muller, F.; Hu, J.; et al. Whole-genome and multisector exome sequencing of primary and post-treatment glioblastoma reveals patterns of tumor evolution. Genome Res. 2015, 25, 316–327. [Google Scholar] [CrossRef]
  46. Robinson, J.T.; Thorvaldsdóttir, H.; Winckler, W.; Guttman, M.; Lander, E.S.; Getz, G.; Mesirov, J.P. Integrative genomics viewer. Nat. Biotechnol. 2011, 29, 24–26. [Google Scholar] [CrossRef]
  47. Becker, A.P.; Sells, B.E.; Haque, S.J.; Chakravarti, A. tumor heterogeneity in glioblastomas: From light microscopy to molecular pathology. Cancers 2021, 13, 761. [Google Scholar] [CrossRef]
  48. Kim, Y.-W.; Koul, D.; Kim, S.H.; Lucio-Eterovic, A.K.; Freire, P.R.; Yao, J.; Wang, J.; Almeida, J.S.; Aldape, K.; Yung, W.A. Identification of prognostic gene signatures of glioblastoma: A study based on TCGA data analysis. Neuro-Oncology 2013, 15, 829–839. [Google Scholar] [CrossRef]
  49. Parikh, A.R.; Leshchiner, I.; Elagina, L.; Goyal, L.; Levovitz, C.; Siravegna, G.; Livitz, D.; Rhrissorrakrai, K.; Martin, E.E.; Van Seventer, E.E.; et al. Liquid versus tissue biopsy for detecting acquired resistance and tumor heterogeneity in gastrointestinal cancers. Nat. Med. 2019, 25, 1415–1421. [Google Scholar] [CrossRef]
  50. Bando, H.; Nakamura, Y.; Taniguchi, H.; Shiozawa, M.; Yasui, H.; Esaki, T.; Ohta, T.; Denda, T.; Satoh, T.; Yamazaki, K.; et al. Impact of a metastatic site on circulating tumor DNA (ctDNA) analysis in patients (pts) with metastatic colorectal cancer (mCRC). J. Clin. Oncol. 2021, 39, 3554. [Google Scholar] [CrossRef]
  51. Darrigues, L.; Pierga, J.-Y.; Bernard-Tessier, A.; Bièche, I.; Silveira, A.B.; Michel, M.; Loirat, D.; Cottu, P.; Cabel, L.; Dubot, C.; et al. Circulating tumor DNA as a dynamic biomarker of response to palbociclib and fulvestrant in metastatic breast cancer patients. Breast Cancer Res. 2021, 23, 31. [Google Scholar] [CrossRef]
  52. Marsavela, G.; McEvoy, A.C.; Pereira, M.R.; Reid, A.L.; Al-Ogaili, Z.; Warburton, L.; Khattak, M.A.; Abed, A.; Meniawy, T.M.; Millward, M.; et al. Detection of clinical progression through plasma ctDNA in metastatic melanoma patients: A comparison to radiological progression. Br. J. Cancer 2021, 126, 401–408. [Google Scholar] [CrossRef] [PubMed]
Figure 1. Summary of the patient cohort. (A) Numbers of specific tumor samples; (B) distribution of patients by age.
Cancers 14 03902 g001
Figure 2. Quality and quantity control of ccfDNA samples evaluated using a Bioanalyzer. (A) Representative electropherogram: blue range highlights DNA size of interest for which concentration was determined; (B) concentration values for 95 ccfDNA samples measured by a Bioanalyzer; (C) effects of immediate versus delayed isolation on the yield of ccfDNA (blood that was left aside for more than 24 h after collection before isolation versus <24 h isolation). Statistical significance was calculated using a two-tailed t-test (** p < 0.01).
Cancers 14 03902 g002
Figure 3. Comparison of yield of ccfDNA isolated from blood samples collected from the same patient before and after surgery. (A) Bioanalyzer electropherogram showing increased concentration in a sample of ccfDNA isolated from postsurgery (red) versus presurgery (blue); (B) comparison of total isolation yield shows significant increase in ccfDNA amounts isolated from postsurgical versus presurgery blood sample. Statistical significance was calculated using a paired t-test (** p < 0.01), N = 19.
Cancers 14 03902 g003
Figure 4. Bioanalyzer electropherograms illustrating quality control of ccfDNA after isolation and right-sided size selection. (A) ccfDNA sample containing no detectable material and excluded from the study; (B) ccfDNA sample that is strongly contaminated with fragmented genomic DNA and excluded from the study; (C) ccfDNA sample that contains some genomic DNA contamination and passed quality control; (D) ccfDNA derived libraries prior to hybridization and post first PCR, before (red) and after (blue) right-sided size selection.
Cancers 14 03902 g004
Figure 5. Somatic variants found in the tDNA: (A) mutational landscape plot of somatic variants found in the tumor tissue; (B) plot with size of the points proportional to a number of SNV clusters found in the gene. The x-axis indicates a fraction of the total variants identified in these clusters. Gene names are labeled along with the number of clusters found; (C) allele frequency variation between analyzed samples within a specific gene region.
Cancers 14 03902 g005
Figure 6. Somatic variants detected in ccfDNA and confirmed as somatic variants in tumor samples. The presence of specific alterations such as SNP, deletion, or insertion in a given patient sample is indicated.
Cancers 14 03902 g006
Figure 7. Detailed and schematic representation of genetic variants found in ccfDNA, but not in gDNA of brain tumor patients.
Cancers 14 03902 g007
Figure 8. COSMIC registered copy number alterations detected in ccfDNA, but not gDNA of 4 brain tumor patients. (A) Graphical representation summarizing copy-number gain found in ccfDNA versus gDNA. Amplifications are shown in various colors to mark a copy number gains. (B) Detailed description of identified copy number gains.
Cancers 14 03902 g008aCancers 14 03902 g008b
Table 1. Somatic variants detected in ccfDNA and in the tumor sample.
gDNATumor DNActDNA
GeneChrPositionIDRefAltDiagnostic InformationReadsAFReadsAFReadsAF
AllAltAllAltAllAlt
TP53chr17757712031CTGlioblastoma, Grade 4106001491440.971219110.009
SMARCA4chr191117065458GAPrimary Central Nervous System Lymphoma490055230.4260290.015
SMARCA4chr191114412559CTAnaplastic Thyroid Cancer Metastasis2030077550.7119794540.229
TP53chr177579372GCG32400128760.5917834350.244
SPENchr116260997GT23700141820.5823084580.198
KMT2Dchr1249438655CG21400153310.2022382290.102
LTBP2chr1475078119TG20001590.60279500.179
NF1chr1729560103GAG17600164420.2624442270.093
CDKN2Achr921971193GCG1480095660.6911991800.150
JAK3chr1917952151GT2900950.5612462700.217
NSD1chr517672093665GCAdenocarcinoma Lung Metastasis390004181910.468621830.212
EPHA6chr39672882971GGTTGlioblastoma, Grade 411002330.13618140.023
SMARCA4chr191114418274GAAstrocytoma Anaplasticum, Grade 34300259760.291602170.011
EGFRchr755210075TG12300302015140.5016944270.252
PCSK7;TAGLNchr11117076708108TCGlioblastoma, Grade 4120067100.1515393400.221
NF1chr1729563087126TGGlioblastoma, Grade 4670011230.032141360.017
TCF3chr191619749AAGGGTG380073150.2112813100.242
Table 2. Cosmic registered variants found in ccfDNA but not in gDNA.
gDNA (Maftools)ccfDNA (SureCall)
GeneChromPositionIDrs IDMAFAF 1000 GgnomADClinVar clinsig Diagnostic InformationReadsAFReadsAF
AllAltAllAlt
APCchr51121779016rs752654519---pathogenic/likely pathogenicGlioblastoma, Grade 42250020150.0249
TSC2chr16209864211rs397515228---pathogenicDiffuse Glioma, Grade 22040030360.0198
APCchr5112111411rs886039642---pathogenic/likely pathogenic1680017240.0233
TSC2chr16213620322rs45517360---pathogenicGlioblastoma, Grade 4530010160.0594
JAK3chr191795037530rs14575159900.00042 × 10−5uncertain significanceGlioblastoma, Grade 42120020040.02
NF1chr172967723331rs37766248300.00022 × 10−5uncertain significanceGlioblastoma, Grade 41290081490.0111
NF1chr172965455333rs876657714---pathogenicGlioblastoma, Grade 42520047040.00851
TP53chr177577586rs587781589---pathogenic2390034530.0087
NSD1chr5176637449rs587784080---pathogenic2500055750.00898
EGFRchr75523304334rs139236063--4 × 10⁻⁶likely pathogenicGlioblastoma, Grade 4120002897390.0135
NSD1chr517670952450rs587784169---pathogenicDiffuse Astrocytoma, Grade 21540042840.00935
NSD1chr517669663153rs794727176---pathogenicGlioblastoma, Grade 42390033530.00896
NF1chr172948607055rs746824139--0pathogenicGlioblastoma, Grade 41440042450.0118
PTENchr108971769564rs190070312---pathogenicGlioblastoma, Grade 42460043650.0115
PTENchr108971190065rs121913294---likely pathogenicAdenocarcinoma Lung Metastasis1390035230.00852
RECQL4chr814574140968rs54949781100.00022 × 10−5uncertain significanceGlioblastoma, Grade 42400056390.016
BRAFchr714045400870rs397516894---pathogenicGlioblastoma, Grade 42280037240.0108
NF1chr1729562981rs376576925--4 × 10⁻⁶pathogenic1950061360.00979
NF1chr1729560088rs878853884---pathogenic1180062680.0128
MTORchr11118457379rs587777894---pathogenic Glioblastoma with Oligodendroglioma Component, Grade 41330025080.032
NSD1chr5176673711rs570278338---pathogenic650013220.0152
PTENchr1089692793rs786204927---likely pathogenic990018070.0389
NF1chr172967722882rs53311047900.00023 × 10−5uncertain significanceGlioblastoma, Grade 42430043650.0115
KMT2Dchr124943806783rs886043414---pathogenicGlioblastoma, Grade 41440014320.014
TP53chr17757952985rs876658483---pathogenicGlioblastoma, Grade 41980034740.0115
TSC2chr162114342rs45517179---pathogenic2480039340.0102
MED12chrX70357138rs76265979400.00036 × 10−6uncertain significance1150016140.0248
PIK3CAchr317895208586rs121913279--4 × 10⁻⁶pathogenic FDA recognizedGiant Cell Glioblastoma, Grade 42450013920.0144
NOTCH1chr9139395108rs37141450100.00022 × 10−5uncertain significance1780016530.0182
SMARCA4chr1911094931rs56307962900.00025 × 10−5uncertain significance580013650.0368
NF1chr172958875187rs760703505--8 × 10⁻⁶pathogenic/likely pathogenicGlioblastoma, Grade 42410048540.00825
PTENchr108972076893rs746930141---pathogenicGlioblastoma, Grade 4700019920.0101
APCchr511217370499rs587779783---pathogenicDiffuse Astrocytoma, Grade 22500064360.00933
NF1chr1729490394100rs199474752---likely pathogenic Glioblastoma, Grade 41680035630.00843
BRAFchr7140453137105rs121913378---likely pathogenicPleomorphic Xanthoastrocytoma, Grade 22090027380.0293
PTENchr1089711968107rs587776670---pathogenicGlioblastoma, Grade 41040048240.0083
Table 3. Variants detected in ccfDNA, but not present in gDNA, confirmed as somatic in previous studies, tumor alterations.
gDNAccfDNATumor DNA
GeneIDrs IDCOSMIC (CNS)/Polyphen PredGMAFClinVar Clinsig Diagnostic InformationReadsAFReadsAFAF (Somatic in Other Patient)
AllAlt AllAlt
PTEN2rs12573787-/-0.16benignOligoastrocytoma, Grade 26000.0025580.0310.6923
32Oligodendroglioma Anaplasticum, Grade 37910.01150620.413
65Adenocarcinoma Lung Metastasis5510.0261330.541
85Glioblastoma, Grade 45610.022601400.538
109Anaplastic Pleomorphic Xantoastrocytoma, Grade 35700.00168130.077
110Glioblastoma, Grade 43920.052341440.615
111Glioblastoma, Grade 410710.01160680.425
117Glioblastoma, Grade 47310.012991440.482
118Glioblastoma, Grade 44010.032241140.509
121Giant Cell Glioblastoma, Grade 45200.003401640.482
TP5390rs121913343131/D-pathogenic/likely pathogenicGlioblastoma, Grade 414730.021313270.0210.2619
EGFR64rs105751982814/D-likely pathogenicGlioblastoma, Grade 422500.00612220.0360.4502
EGFR64rs14984019236/D-likely pathogenicGlioblastoma, Grade 418130.0270390.0130.248
Table 4. Variants detected in ccfDNA, but not present in gDNA, confirmed as somatic in current study, tumor alterations.
gDNA (Maftools)ccfDNA (SureCall)Tumor
GeneChrPositionRefAlt IDrs IDRegistered in COSMICClinVar Clinsig Diagnostic InformationReadsAFReadsAF# of Patients with Somatic Variant
AllAltAllAlt
SMARCA41911144125CT59 yes-Anaplastic Thyroid Cancer Metastasis1860019794540.2294091
PIK3CA3178952085AG86rs121913279-likely pathogenicGiant Cell Glioblastoma, Grade 42450013920.0143881
EPHA6397365038GA118rs301948--Glioblastoma, Grade 4199001328860.0647591
EPHA6397365074AG118rs301949yes-Glioblastoma, Grade 41790016111030.0639351
EGFR755210075TG74 yes-Astrocytoma Anaplasticum, Grade 32290016944270.2520662
EGFR755210075TG114 yes-Astrocytoma, Grade 324710.00427430.0109492
EGFR755224307CT114 yeslikely pathogenicAstrocytoma, Grade 32450041790.0215831
EGFR755221822CT64rs149840192yes-Glioblastoma, Grade 418130.016670390.0128023
Publisher’s Note: MDPI stays neutral with regard to jurisdictional claims in published maps and institutional affiliations.

