
Should Peak Dose Be Used to Prescribe Spatially Fractionated Radiation Therapy?—A Review of Preclinical Studies


Abstract
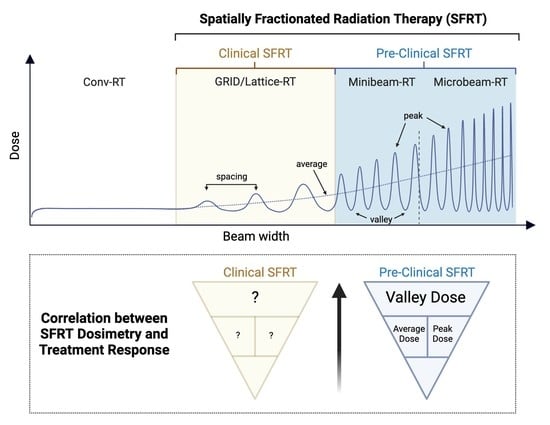
:Simple Summary
Abstract
1. Introduction
2. Materials and Methods
2.1. Background and Objective
2.2. Eligibility Criteria
- -
- Studies used a single array of MRT or MBRT;
- -
- Studies reported survival data as either mean or median survival;
- -
- Studies reported appropriate dosimetric information and radiation settings (peak dose, valley dose, peak width, and spacing);
- -
- Peak doses of less than 800 Gy were used in the studies (this criterion was intended to avoid confounding factors related to toxic effects of radiation exposure that are unlikely to be relevant to the clinical application of MRT or MBRT);
- -
- MRT or MBRT were not administered in combination with other therapies, such as nanoparticles or gene therapy.
2.3. Search Strategy
2.4. Data Curation
2.5. Data Analysis
- Small correlation: r ≤ 0.1
- Medium correlation: 0.1 > r < 0.5
- Large/strong correlation: r ≥ 0.5
3. Results
4. Discussion
5. Conclusions
Supplementary Materials
Author Contributions
Funding
Data Availability Statement
Acknowledgments
Conflicts of Interest
References
- Laissue, J.A.; Blattmann, H.; Slatkin, D.N. Alban Kohler (1874–1947): Inventor of grid therapy. Z. Med. Phys. 2011, 22, 90–99. [Google Scholar] [CrossRef] [PubMed]
- Mohiuddin, M.; Fujita, M.; Regine, W.F.; Megooni, A.S.; Ibbott, G.S.; Ahmed, M.M. High-dose spatially-fractionated radiation (GRID): A new paradigm in the management of advanced cancers. Int. J. Radiat. Oncol. Biol. Phys. 1999, 45, 721–727. [Google Scholar] [CrossRef]
- Slatkin, D.N.; Spanne, P.; Dilmanian, F.A.; Sandborg, M. Microbeam radiation therapy. Med. Phys. 1992, 19, 1395–1400. [Google Scholar] [CrossRef]
- Dilmanian, F.A.; Zhong, Z.; Bacarian, T.; Benveniste, H.; Romanelli, P.; Wang, R.; Welwart, J.; Yuasa, T.; Rosen, E.M.; Anschel, D.J. Interlaced X-ray microplanar beams: A radiosurgery approach with clinical potential. Proc. Natl. Acad. Sci. USA 2006, 103, 9709–9714. [Google Scholar] [CrossRef] [Green Version]
- Billena, C.; Khan, A.J. A Current Review of Spatial Fractionation: Back to the Future? Int. J. Radiat. Oncol. Biol. Phys. 2019, 104, 177–187. [Google Scholar] [CrossRef] [PubMed]
- Prezado, Y. Divide and conquer: Spatially fractionated radiation therapy. Expert Rev. Mol. Med. 2022, 24, e3. [Google Scholar] [CrossRef]
- Yan, W.; Khan, M.K.; Wu, X.; Simone, C.B., 2nd; Fan, J.; Gressen, E.; Zhang, X.; Limoli, C.L.; Bahig, H.; Tubin, S.; et al. Spatially fractionated radiation therapy: History, present and the future. Clin. Transl. Radiat. Oncol. 2020, 20, 30–38. [Google Scholar] [CrossRef] [PubMed] [Green Version]
- Zhang, H.; Wu, X.; Zhang, X.; Chang, S.X.; Megooni, A.; Donnelly, E.D.; Ahmed, M.M.; Griffin, R.J.; Welsh, J.S.; Simone, C.B., 2nd; et al. Photon GRID Radiation Therapy: A Physics and Dosimetry White Paper from the Radiosurgery Society (RSS) GRID/LATTICE, Microbeam and FLASH Radiotherapy Working Group. Radiat. Res. 2020, 194, 665–677. [Google Scholar] [CrossRef]
- Wu, X.; Perez, N.C.; Zheng, Y.; Li, X.; Jiang, L.; Amendola, B.E.; Xu, B.; Mayr, N.A.; Lu, J.J.; Hatoum, G.F.; et al. The Technical and Clinical Implementation of LATTICE Radiation Therapy (LRT). Radiat. Res. 2020, 194, 737–746. [Google Scholar] [CrossRef]
- Amendola, B.E.; Perez, N.C.; Wu, X.; Amendola, M.A.; Qureshi, I.Z. Safety and Efficacy of Lattice Radiotherapy in Voluminous Non-small Cell Lung Cancer. Cureus 2019, 11, e4263. [Google Scholar] [CrossRef] [Green Version]
- Amendola, B.E.; Perez, N.C.; Mayr, N.A.; Wu, X.; Amendola, M. Spatially Fractionated Radiation Therapy Using Lattice Radiation in Far-advanced Bulky Cervical Cancer: A Clinical and Molecular Imaging and Outcome Study. Radiat. Res. 2020, 194, 724–736. [Google Scholar] [CrossRef] [PubMed]
- Choi, J.I.; Daniels, J.; Cohen, D.; Li, Y.; Ha, C.S.; Eng, T.Y. Clinical Outcomes of Spatially Fractionated GRID Radiotherapy in the Treatment of Bulky Tumors of the Head and Neck. Cureus 2019, 11, e4637. [Google Scholar] [CrossRef] [PubMed] [Green Version]
- Poh, S.S.; Chua, M.L.; Wee, J.T. Why we should give spatially fractionated radiation therapy (GRID) a second look—Especially in nasopharyngeal carcinoma. Ann. Nasopharynx Cancer 2018, 2, 12–19. [Google Scholar] [CrossRef]
- Griffin, R.; Ahmed, M.M.; Amendola, B.E.; Relyakov, O.; Bentzen, S.M.; Butterworth, K.T.; Chang, S.; Coleman, C.N.; Djonov, V.; Formenti, S.C.; et al. Understanding High-Dose, Ultra-high Dose-Rate and Spatially fractionated radiotherapy. Int. J. Radiat. Oncol. Biol. Phys. 2020, 107, 766–778. [Google Scholar] [CrossRef] [PubMed]
- Fernandez-Palomo, C.; Fazzari, J.; Trappetti, V.; Smyth, L.; Janka, H.; Laissue, J.; Djonov, V. Animal Models in Microbeam Radiation Therapy: A Scoping Review. Cancers 2020, 12, 527. [Google Scholar] [CrossRef] [Green Version]
- Prezado, Y.; Jouvion, G.; Hardy, D.; Patriarca, A.; Nauraye, C.; Bergs, J.; Gonzalez, W.; Guardiola, C.; Juchaux, M.; Labiod, D.; et al. Proton minibeam radiation therapy spares normal rat brain: Long-Term Clinical, Radiological and Histopathological Analysis. Sci. Rep. 2017, 7, 14403. [Google Scholar] [CrossRef]
- Rivera, J.N.; Kierski, T.M.; Kasoji, S.K.; Abrantes, A.S.; Dayton, P.A.; Chang, S.X. Conventional dose rate spatially-fractionated radiation therapy (SFRT) treatment response and its association with dosimetric parameters—A preclinical study in a Fisher 344 rat model. PLoS ONE 2020, 15, e0229053. [Google Scholar] [CrossRef]
- Prezado, Y.; Deman, P.; Varlet, P.; Jouvion, G.; Gil, S.; Le Clec, H.C.; Bernard, H.; Le Duc, G.; Sarun, S. Tolerance to Dose Escalation in Minibeam Radiation Therapy Applied to Normal Rat Brain: Long-Term Clinical, Radiological and Histopathological Analysis. Radiat. Res. 2015, 184, 314–321. [Google Scholar] [CrossRef]
- Van der Sanden, B.; Brauer-Krisch, E.; Siegbahn, E.A.; Ricard, C.; Vial, J.C.; Laissue, J. Tolerance of arteries to microplanar X-ray beams. Int. J. Radiat. Oncol. Biol. Phys. 2010, 77, 1545–1552. [Google Scholar] [CrossRef] [Green Version]
- Laissue, J.A.; Blattmann, H.; Di Michiel, M.; Slatkin, D.N.; Lyubimova, N.; Guzman, R.; Zimmermann, W.; Birrer, S.; Bley, T.; Kircher, P.; et al. Weanling piglet cerebellum: A surrogate for tolerance to MRT (microbeam radiation therapy) in pediatric neuro-oncology. Proc. SPIE 2001, 4508, 65–73. [Google Scholar]
- Dilmanian, F.A.; Button, T.M.; Le Duc, G.; Zhong, N.; Pena, L.A.; Smith, J.A.; Martinez, S.R.; Bacarian, T.; Tammam, J.; Ren, B.; et al. Response of rat intracranial 9L gliosarcoma to microbeam radiation therapy. Neuro Oncol. 2002, 4, 26–38. [Google Scholar] [CrossRef]
- Potez, M.; Fernandez-Palomo, C.; Bouchet, A.; Trappetti, V.; Donzelli, M.; Krisch, M.; Laissue, J.; Volarevic, V.; Djonov, V. Synchrotron Microbeam Radiation Therapy as a New Approach for the Treatment of Radioresistant Melanoma: Potential Underlying Mechanisms. Int. J. Radiat. Oncol. Biol. Phys. 2019, 105, 1126–1136. [Google Scholar] [CrossRef] [Green Version]
- Bertho, A.; Ortiz, R.; Juchaux, M.; Gilbert, C.; Lamirault, C.; Pouzoulet, F.; Polledo, L.; Liens, A.; Warfving, N.; Sebrie, C.; et al. First Evaluation of Temporal and Spatial Fractionation in Proton Minibeam Radiation Therapy of Glioma-Bearing Rats. Cancers 2021, 13, 4865. [Google Scholar] [CrossRef]
- Eling, L.; Bouchet, A.; Ocadiz, A.; Adam, J.F.; Kershmiri, S.; Elleaume, H.; Krisch, M.; Verry, C.; Laissue, J.A.; Balosso, J.; et al. Unexpected Benefits of Multiport Synchrotron Microbeam Radiation Therapy for Brain Tumors. Cancers 2021, 13, 936. [Google Scholar] [CrossRef] [PubMed]
- Mohiuddin, M.; Curtis, D.L.; Grizos, W.T.; Komarnicky, L. Palliative treatment of advanced cancer using multiple nonconfluent pencil beam radiation. A pilot study. Cancer 1990, 66, 114–118. [Google Scholar] [CrossRef]
- Bentzen, S.M.; Constine, L.S.; Deasy, J.O.; Eisbruch, A.; Jackson, A.; Marks, L.B.; Ten Haken, R.K.; Yorke, E.D. Quantitative Analyses of Normal Tissue Effects in the Clinic (QUANTEC): An introduction to the scientific issues. Int. J. Radiat. Oncol. Biol. Phys. 2010, 76 (Suppl. 3), S3–S9. [Google Scholar] [CrossRef] [PubMed] [Green Version]
- Brahme, A. Dosimetric precision requirements in radiation therapy. Acta Radiol. Oncol. 1984, 23, 379–391. [Google Scholar] [CrossRef] [PubMed]
- Huhn, J.L.; Regine, W.F.; Valentino, J.P.; Meigooni, A.S.; Kudrimoti, M.; Mohiuddin, M. Spatially fractionated GRID radiation treatment of advanced neck disease associated with head and neck cancer. Technol. Cancer Res. Treat. 2006, 5, 607–612. [Google Scholar] [CrossRef] [Green Version]
- Cohen, J. Statistical Power Analysis for the Behavioural Sciences; L. Erlbaum Associates: New York, NY, USA, 1988. [Google Scholar]
- Mahmoudi, F.; Shahbazi-Gahrouei, D.; Chegeni, N. The role of the spatially fractionated radiation therapy in the management of advanced bulky tumors. Pol. J. Med. Phys. Eng. 2021, 27, 13. [Google Scholar] [CrossRef]


| Reference | Animal | Tumor Type | Width (µm) | Spacing (µm) | Peak Width/Valley Width | Peak-Dose (Gy) (at Depth) | Valley-Dose (Gy) (at Depth) | Average Dose (Gy) | PVDR | Increased Life Span (ILS) | Radiation Facility | ||
|---|---|---|---|---|---|---|---|---|---|---|---|---|---|
| (A Bouchet et al., 2013) | Rat | 9LGS | 50 | 200 | 0.33 | 400 | (7 mm) | 18 | (7 mm) | 113.5 | 22.2 | a 74 | ESRF |
| (Bouchet et al., 2016) | Rat | 9LGS | 50 | 200 | 0.33 | 200 | (7 mm) | 9 | (7 mm) | 56.5 | 23.0 | a 24 | ESRF |
| Rat | 50 | 200 | 0.33 | 400 | (7 mm) | 17 | (7 mm) | 113.1 | 23.0 | a 68 | ESRF | ||
| (Miura et al., 2006) | Mouse | SCCVII | 35 | 200 | 0.21 | 442 | entrance | a 317 | ESRF | ||||
| Mouse | 35 | 200 | 0.21 | 625 | entrance | a 383 | ESRF | ||||||
| Mouse | 35 | 200 | 0.21 | 884 | entrance | a 583 | ESRF | ||||||
| Mouse | 70 | 200 | 0.54 | 442 | entrance | a 533 | ESRF | ||||||
| (Régnard, Duc, et al., 2008) | Rat | 9LGS | 25 | 200 | 0.14 | 491 | (10 mm) | 12 | (10 mm) | 72.0 | 41 | a 100 | ESRF |
| Rat | 25 | 200 | 0.14 | 491 | (10 mm) | 12 | (10 mm) | 72.0 | 41 | a 110 | ESRF | ||
| Rat | 25 | 200 | 0.14 | 491 | (10 mm) | 12 | (10 mm) | 72.0 | 41 | a 93 | ESRF | ||
| Rat | 25 | 100 | 0.33 | 504 | (10 mm) | 36 | (10 mm) | 153.0 | 14 | a 235 | ESRF | ||
| (Régnard, Bräuer-Krisch, et al., 2008) | Rat | 9LGS | 25 | 200 | 0.14 | b 491 | (10 mm) | b 12 | (10 mm) | 72.0 | 41 | a 61 | ESRF |
| (Smilowitz et al., 2006) | Rat | 9LGS | c 27 | 211 | 0.15 | 625 | entrance | a 19 | ESRF | ||||
| (Fernandez-Palomo et al., 2020) | Mouse | B16-F10 | 50 | 200 | 0.33 | 401 | entrance | 7 | (0.3 mm) | 105.9 | 53.8 | a 67 | ESRF |
| (Eling et al., 2021) | Rat | 9LGS | 50 | 400 | 0.14 | 726 | (7 mm) | 10 | (7 mm) | 99.5 | 72.6 | a 114 | ESRF |
| Reference | Animal | Tumor Type | Width (µm) | Spacing (µm) | Peak Width/Valley Width | Peak-Dose (Gy) | Valley-Dose (Gy) | Average Dose (Gy) | PVDR | Increased Life Span (ILS) | Radiation Facility |
|---|---|---|---|---|---|---|---|---|---|---|---|
| Prezado et al., 2019 | Rat | RG2 | n.a. | n.a. | n.a. | 26 | 21 | 25 | 1.2 | 705 | Orsay proton therapy centre |
| Prezado et al., 2018 | Rat | RG2 | 1100 | 3200 | 0.52 | 70 | 10.8 | 25 | 6.5 | 63 | Orsay proton therapy centre |
| Lamirault et al., Rad Research | Rat | F98 | 1100 | 3200 | 0.52 | 70 | 11.5 | 30 | 6.0 | 106 | Orsay proton therapy centre |
| 1100 | 3200 | 0.52 | 58 | 9.5 | 25 | 6.0 | 58 | Orsay proton therapy centre | |||
| Sotiropoulous 2021 | Rat | RG2 | 700 | 1400 | 1.00 | 64 | 5.8 | 22 | 11.1 | 400 | Photon SARPP-Curie |
| accepted Int. J. Rad. Oncol. Biol. Phys. | Rat | RG2 | 700 | 1400 | 1.00 | 83 | 7 | 30 | 11.9 | 64 | Photon SARPP-Curie |
| Prezado jsr 2012 | Rat | 9L | 600 | 1200 | 1.00 | 100 | 9 | 54 | 11.1 | 228 | Photon SARPP-Curie |
| Rivera et al., 2020 | Rat | FSA | 310 | 1200 | 0.35 | 91 | 6.8 | 20 | 13.3 | 93 | Photon XRAD-UNC |
| 310 | 1200 | 0.35 | 225 | 16.7 | 50 | 13.3 | 185 | Photon XRAD-UNC | |||
| 2200 | 4000 | 1.22 | 34.5 | 6.2 | 17.63 | 5.6 | 165 | Photon XRAD-UNC | |||
| 10,000 | 20,000 | 1.00 | 39 | 3.1 | 20 | 12.6 | 92 | Photon XRAD-UNC |
| Pearson r/r2 (p-Value Summary) | ALL (n = 16) | MRT (ESRF) (n = 8) | MBRT (n = 8) |
|---|---|---|---|
| Width | −0.13/0.017 (ns) | 0.224/0.05 (ns) | −0.198/0.039 (ns) |
| Spacing | −0.152/0.023 (ns) | −0.138/0.019 (ns) | −0.243/0.059 (ns) |
| Peak width/valley width | 0.075/0.006 (ns) | 0.336/0.113 (ns) | 0.364/0.132 (ns) |
| Peak-dose | 0.127/0.016 (ns) | 0.485/0.236 (*) | −0.21/0.044 (ns) |
| Valley-dose | 0.32/0.103 (ns) | 0.822/0.675 (**) | 0.592/0.35 (*) |
| Average Dose | −0.198/0.039 (ns) | 0.683/0.467 (*) | 0.008/0 (ns) |
| PVDR | −0.347/0.121 (ns) | −0.158/0.025 (ns) | −0.453/0.205 (ns) |
| Pearson r/r2 (p-Value Summary) | MRT Brain Tumors Only n = 6 | MBRT (Protons + Photons) Brain Tumors Only n = 7 |
|---|---|---|
| Width | −0.401/0.16 (ns) | −0.611/0.373 (ns) |
| Spacing | −0.898/0.806 (***) | −0.617/0.381 (ns) |
| Peak width/valley width | 0.184/0.034 (ns) | 0.641/0.411 (ns) |
| Peak-dose | 0.239/0.057 (ns) | −0.661/0.437 (ns) |
| Valley-dose | 0.877/0.769 (**) | 0.656/0.430 (ns) |
| Average Dose | 0.727/0.529 (*) | −0.134/0.017 (ns) |
| PVDR | −0.318/0.101 (ns) | −0.442/0.195 (ns) |
| Pearson r/r2 (p-Value Summary) | Proton MBRT n = 4 | Photon MBRT n = 4 |
|---|---|---|
| Width | not enough points | −0.314/0.099 (ns) |
| Spacing | not enough points | −0.326/0.106 (ns) |
| Peak width/valley width | not enough points | 0.187/0.035 (ns) |
| Peak-dose | −0.949/0.901 (*) | 0.034/0.001 (ns) |
| Valley-dose | 0.994/0.988 (**) | 0.094/0.009 (ns) |
| Average Dose | −0.268/0.072 (ns) | 0.137/0.019 (ns) |
| PVDR | −0.996/0.992 (**) | −0.172/0.03 (ns) |
Publisher’s Note: MDPI stays neutral with regard to jurisdictional claims in published maps and institutional affiliations. |
© 2022 by the authors. Licensee MDPI, Basel, Switzerland. This article is an open access article distributed under the terms and conditions of the Creative Commons Attribution (CC BY) license (https://creativecommons.org/licenses/by/4.0/).
Share and Cite
Fernandez-Palomo, C.; Chang, S.; Prezado, Y. Should Peak Dose Be Used to Prescribe Spatially Fractionated Radiation Therapy?—A Review of Preclinical Studies. Cancers 2022, 14, 3625. https://doi.org/10.3390/cancers14153625
Fernandez-Palomo C, Chang S, Prezado Y. Should Peak Dose Be Used to Prescribe Spatially Fractionated Radiation Therapy?—A Review of Preclinical Studies. Cancers. 2022; 14(15):3625. https://doi.org/10.3390/cancers14153625
Chicago/Turabian StyleFernandez-Palomo, Cristian, Sha Chang, and Yolanda Prezado. 2022. "Should Peak Dose Be Used to Prescribe Spatially Fractionated Radiation Therapy?—A Review of Preclinical Studies" Cancers 14, no. 15: 3625. https://doi.org/10.3390/cancers14153625