
How Many Private Data Are Needed for Deep Learning in Lung Nodule Detection on CT Scans? A Retrospective Multicenter Study

 , , ,
, , ,
Abstract
:Simple Summary
Abstract
1. Introduction
2. Materials and Methods
2.1. Datasets
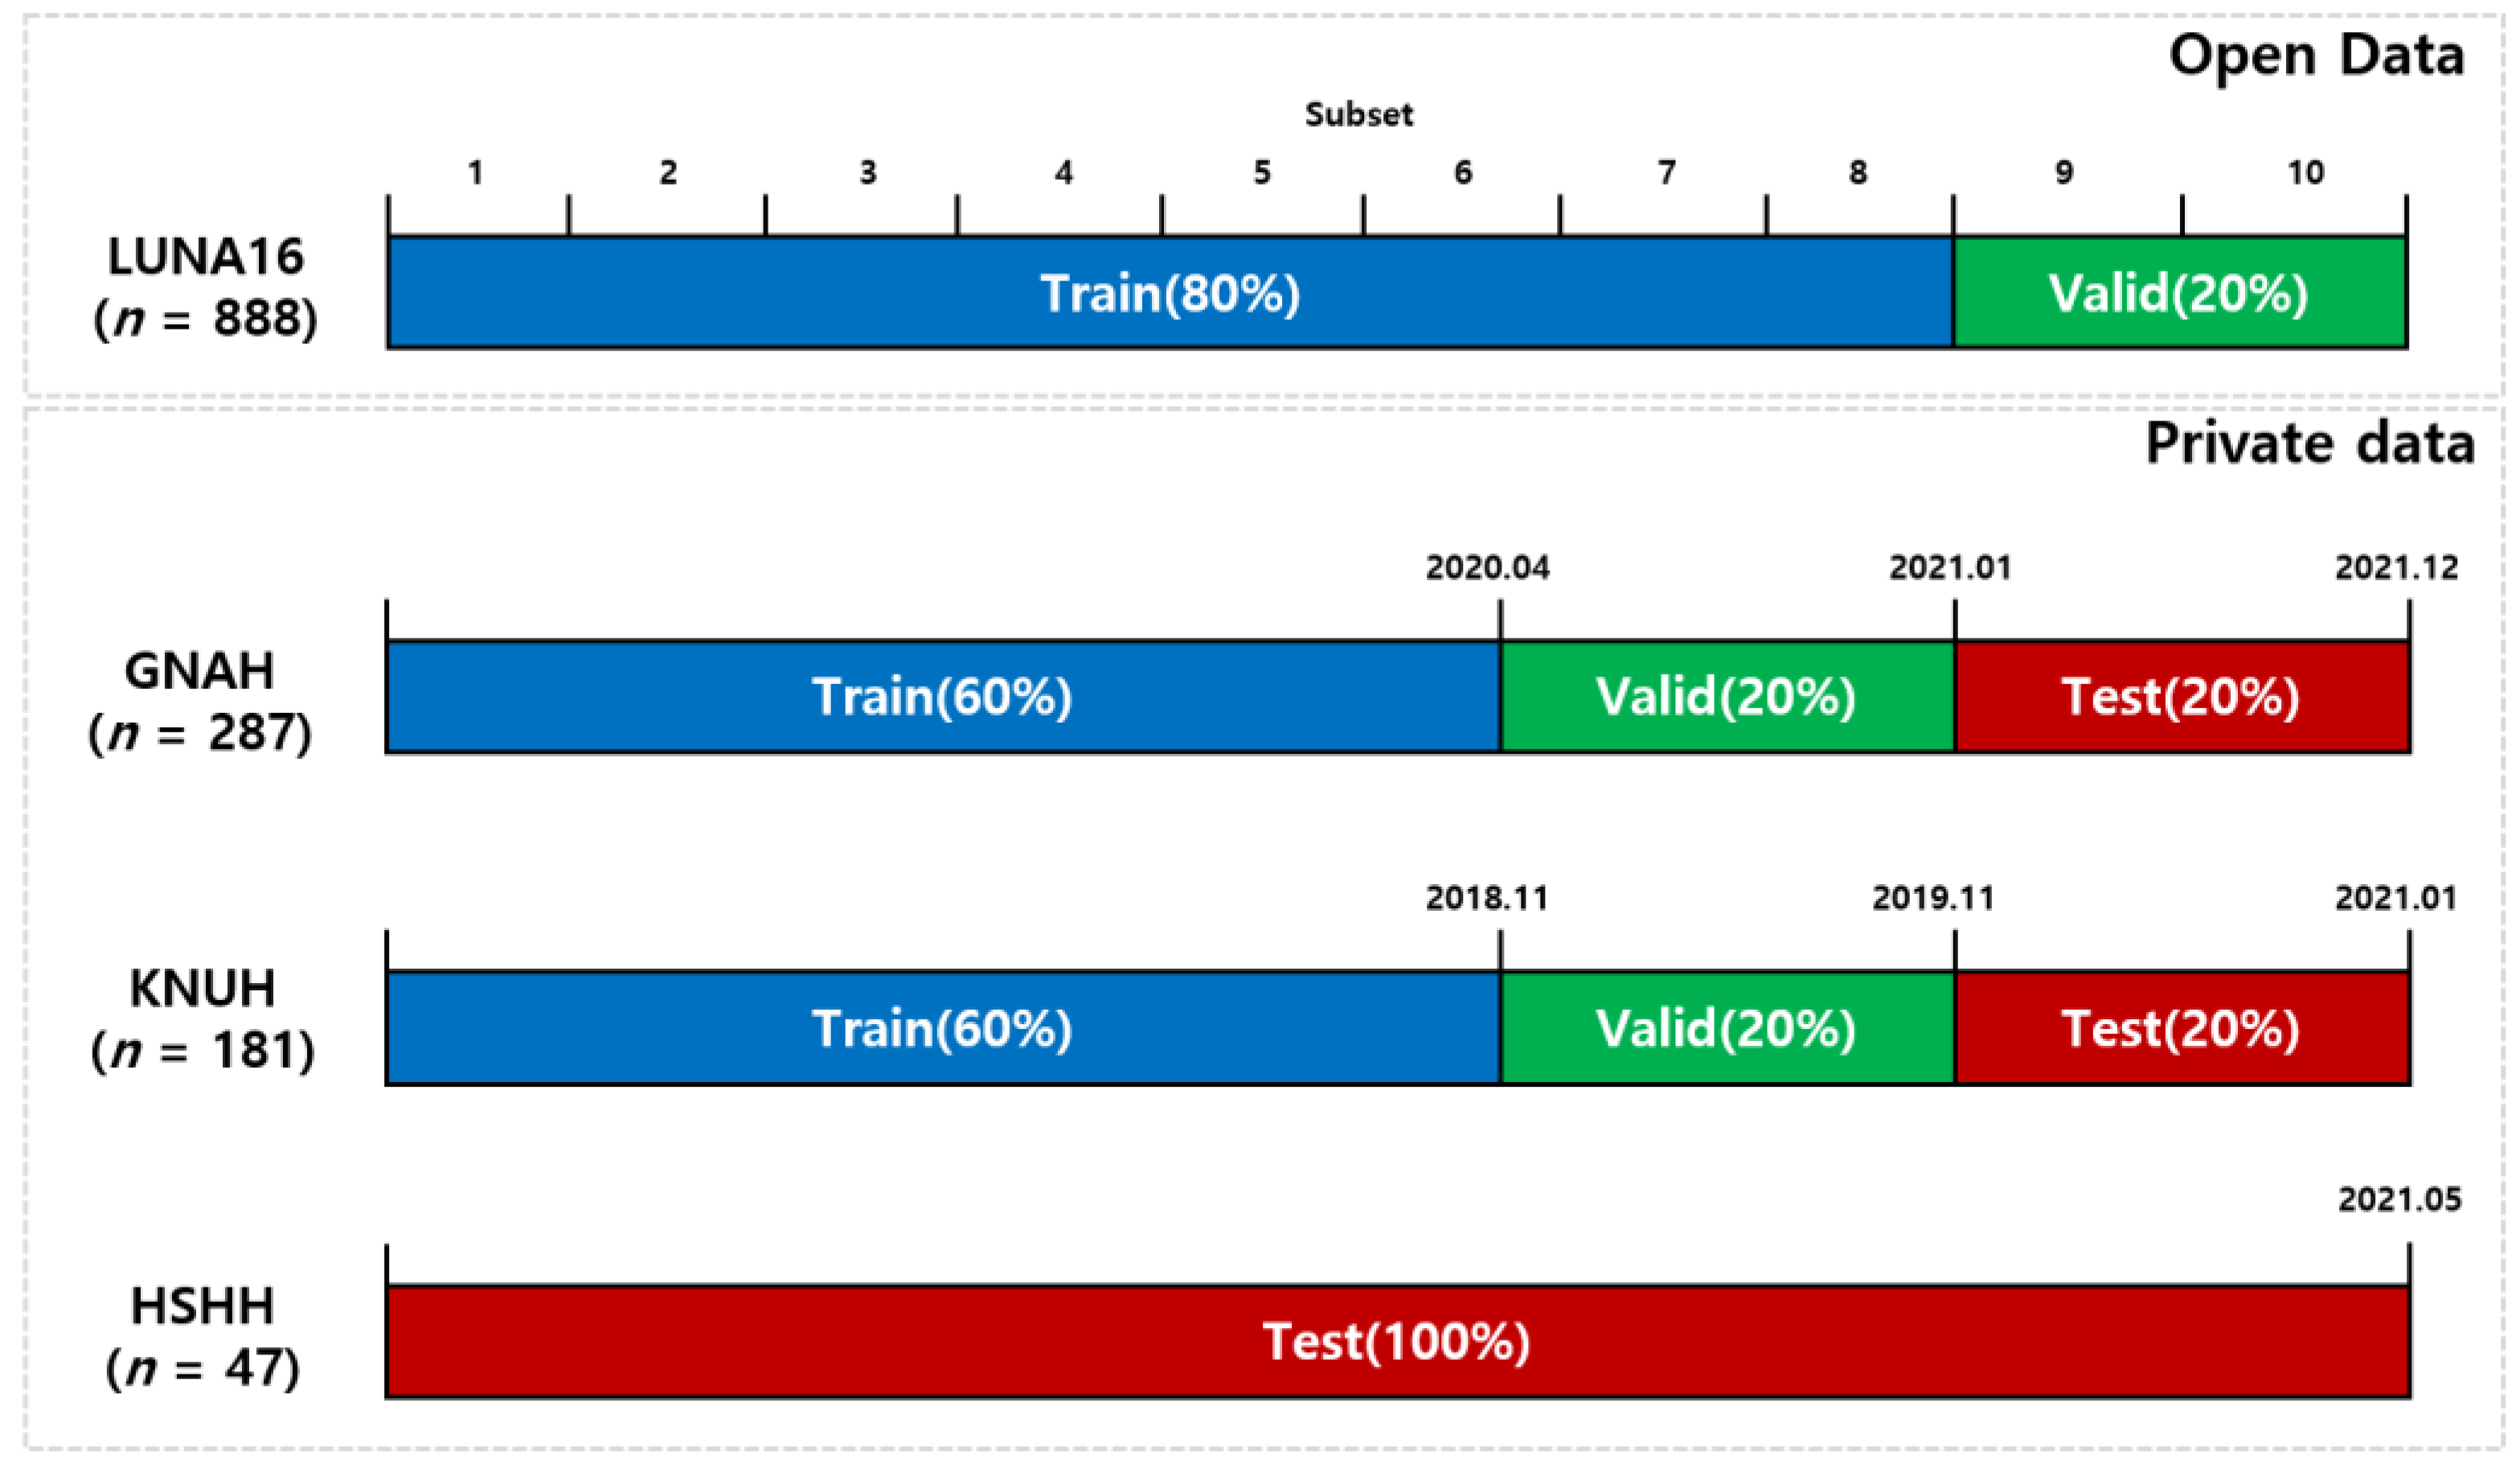
2.1.1. LUNA16
2.1.2. Private Dataset
- GNAH dataset: 287 nodules (102 benign SPNs, and 185 malignant SPNs);
- KNUH dataset: 181 nodules (36 benign SPNs, and 145 malignant SPNs);
- HSHH dataset: 47 nodules (17 benign SPNs, and 30 malignant SPNs).
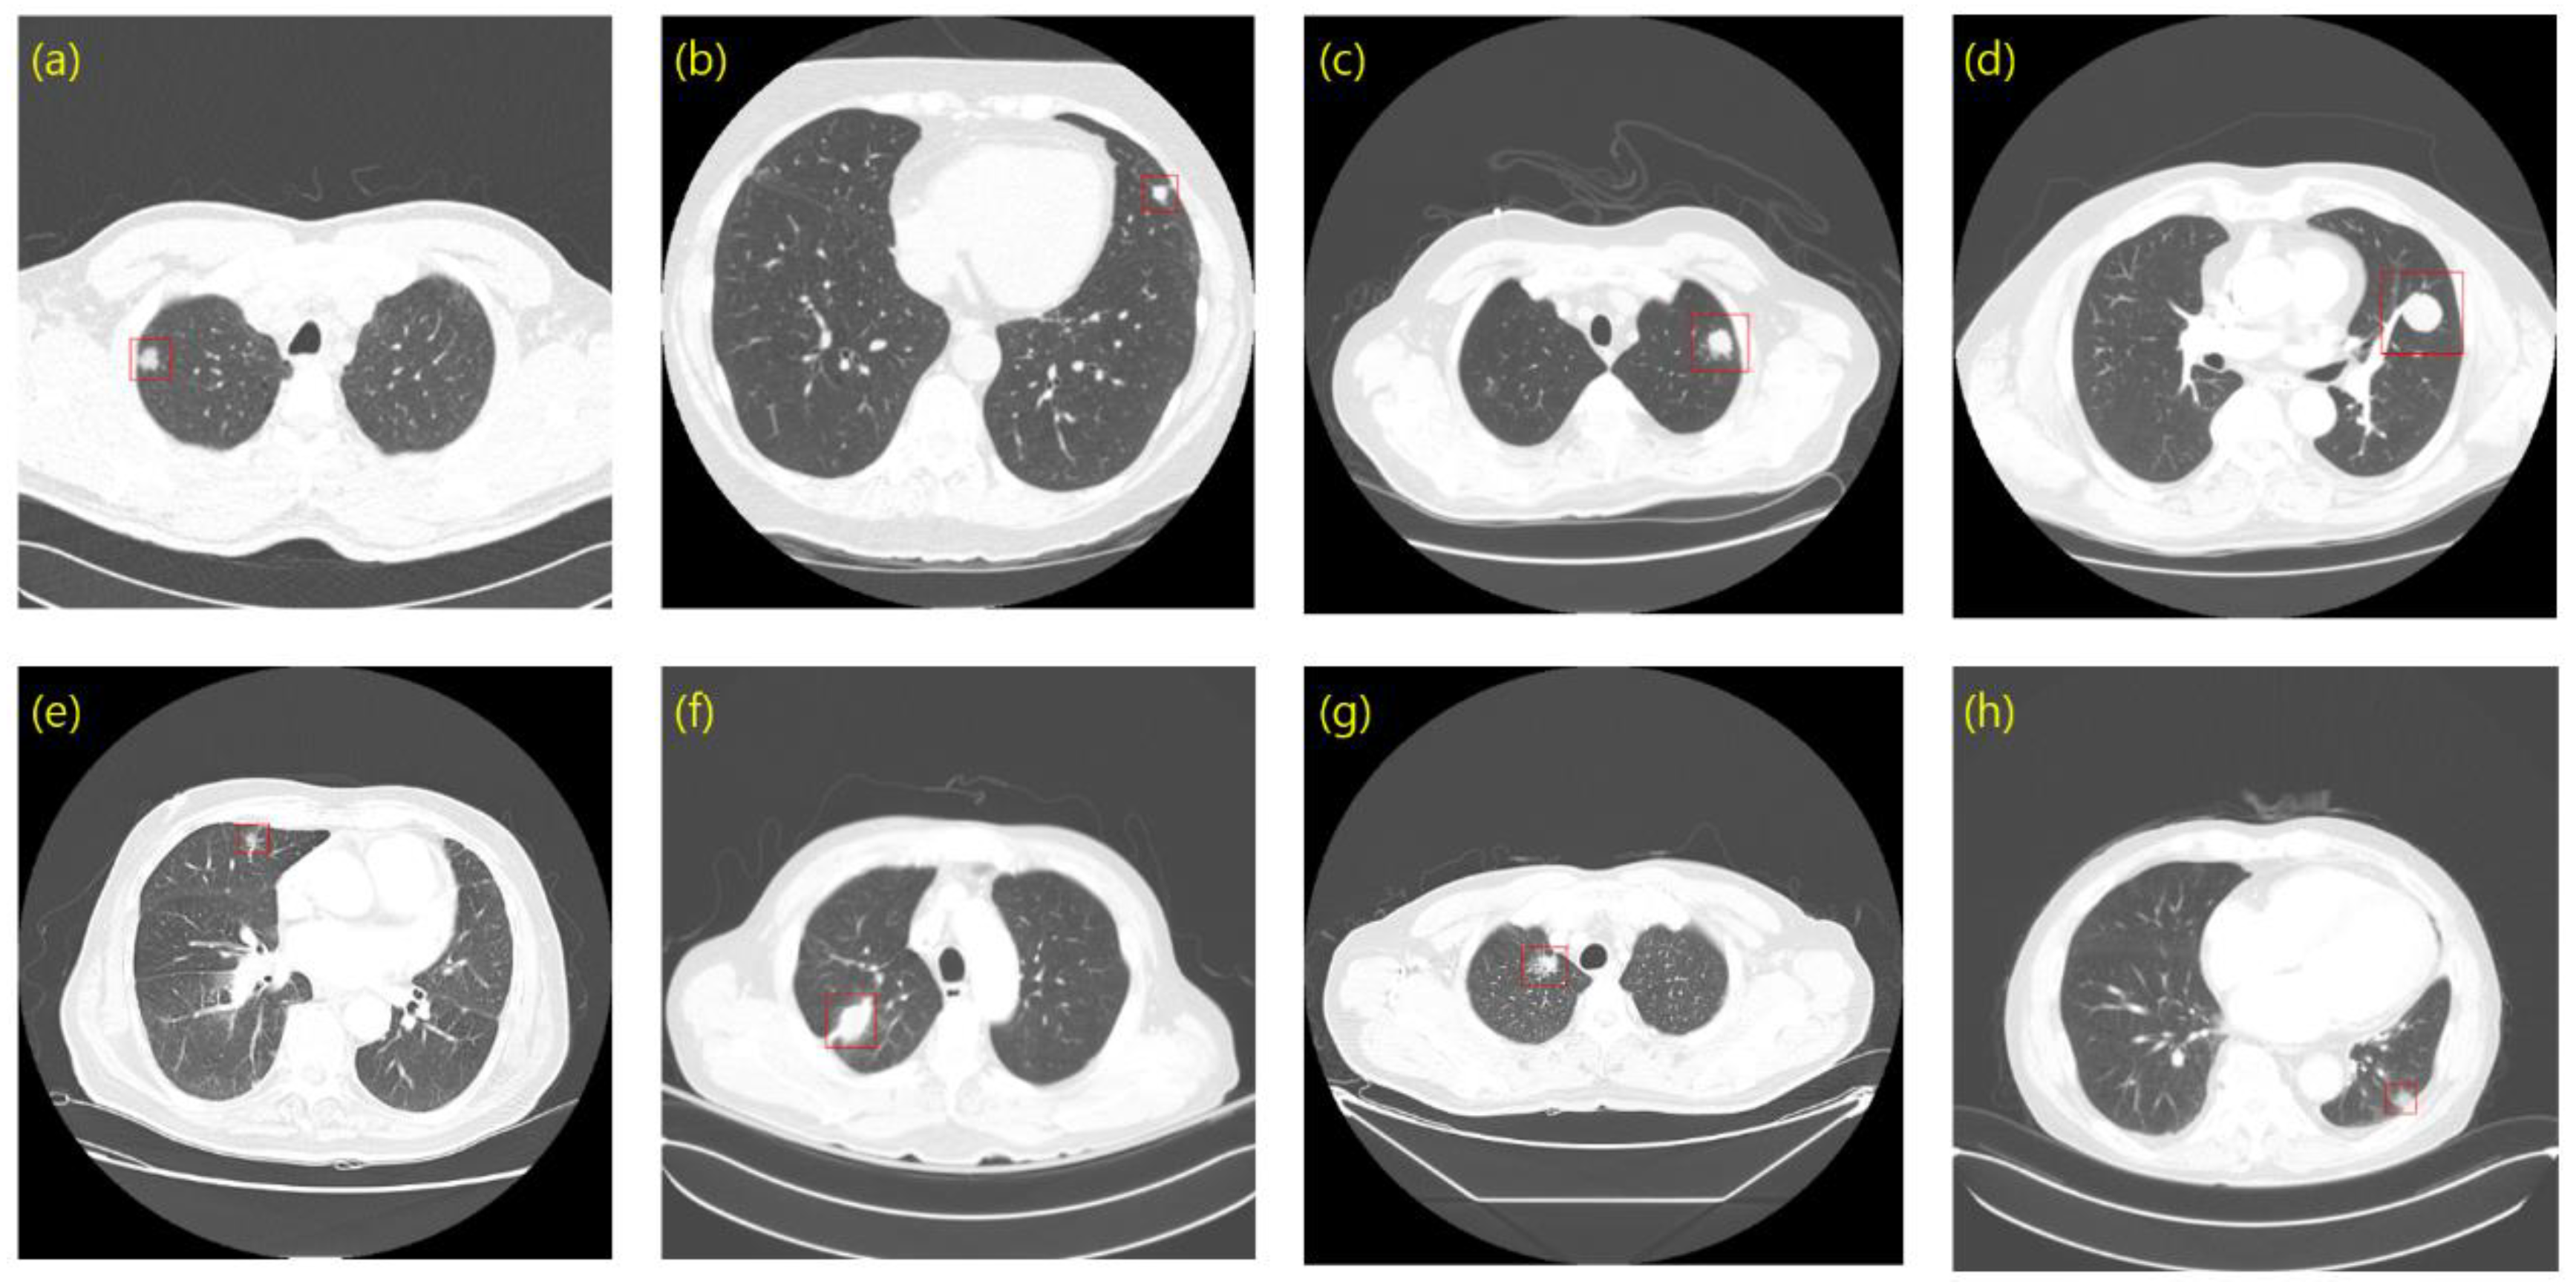
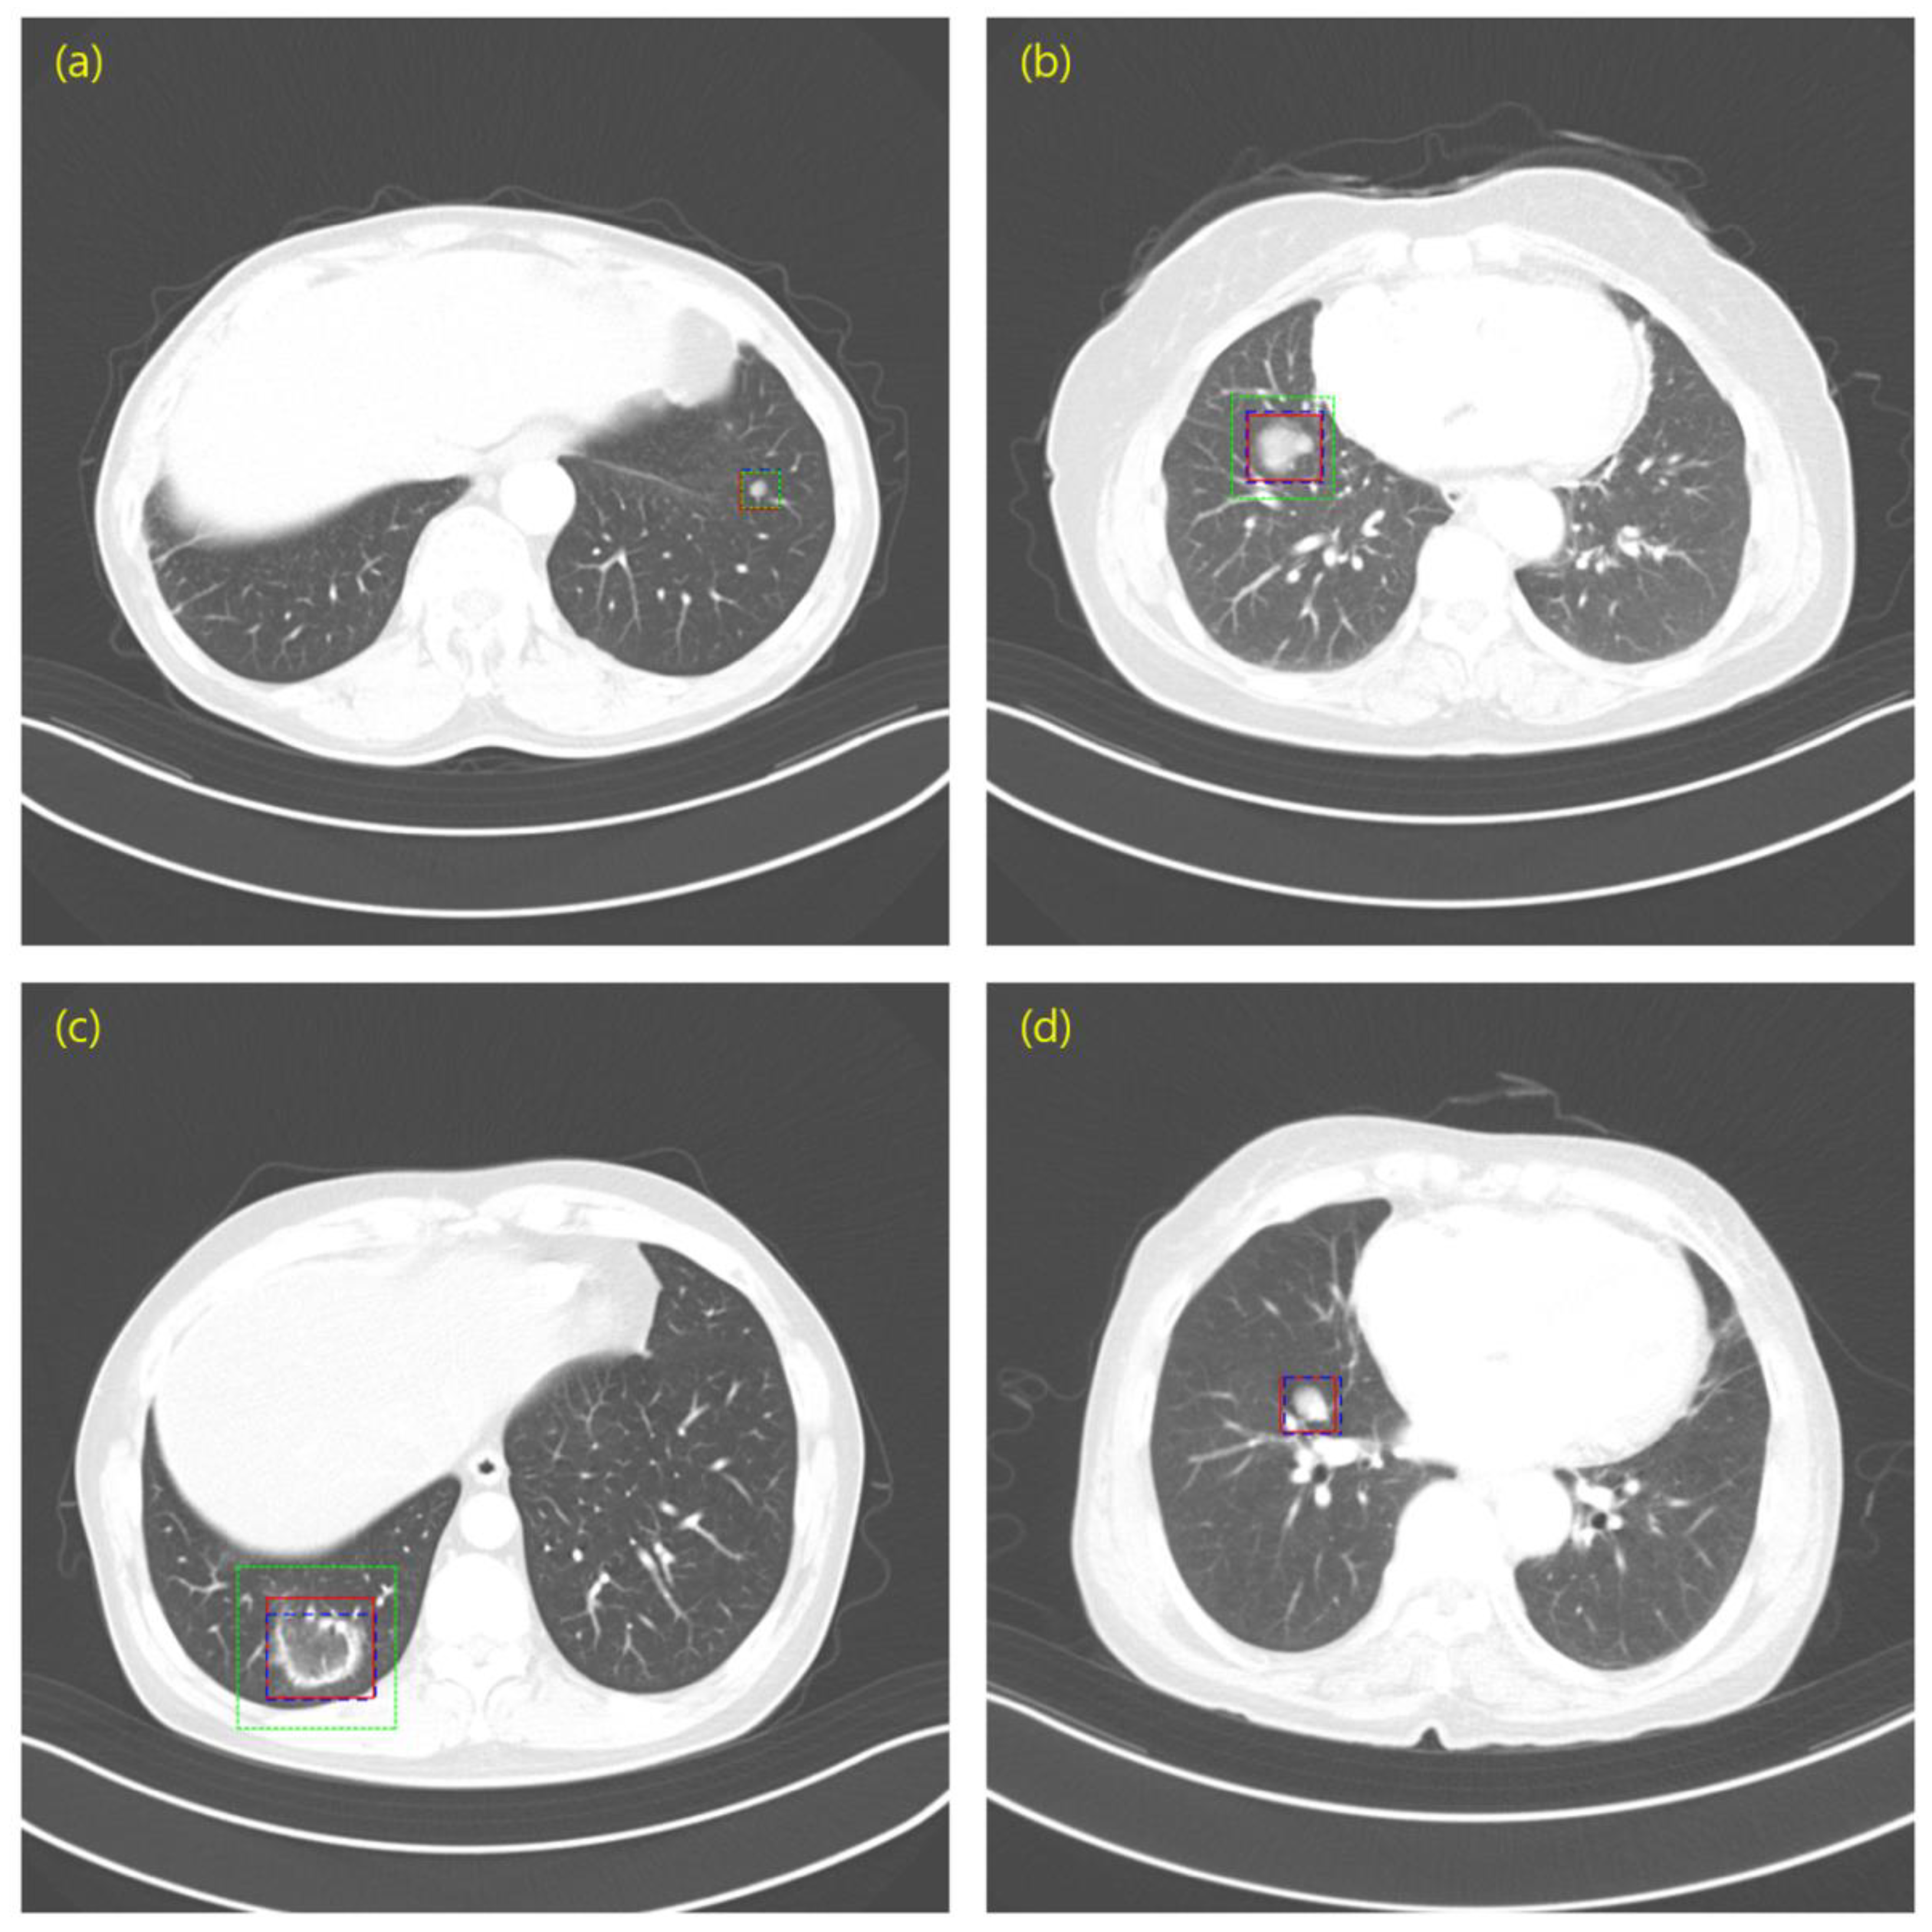
2.1.3. Annotation
2.1.4. Dataset Configuration
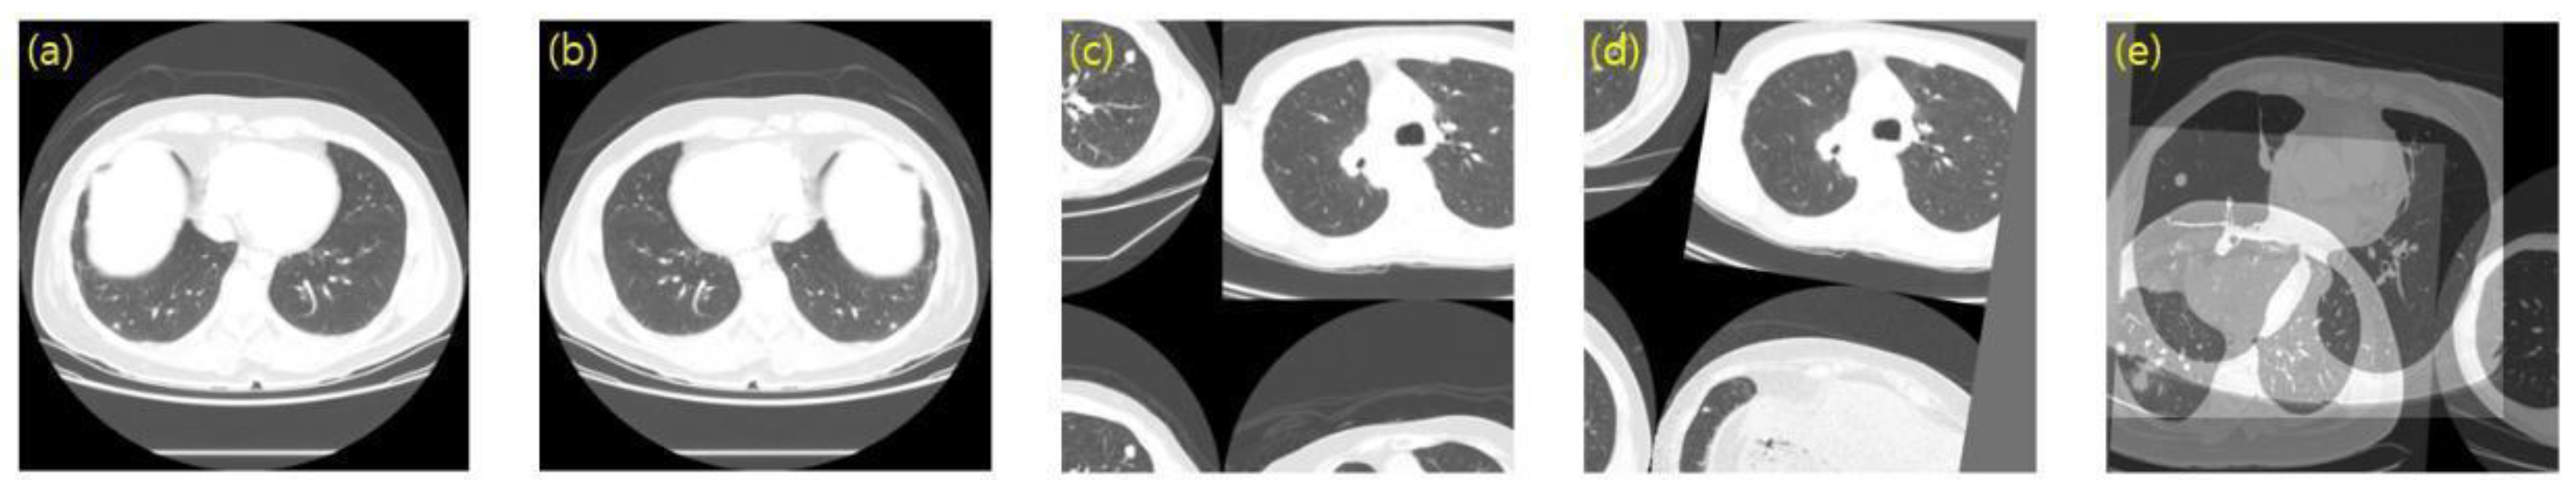
2.2. Preprocessing
2.3. Data Augmentation
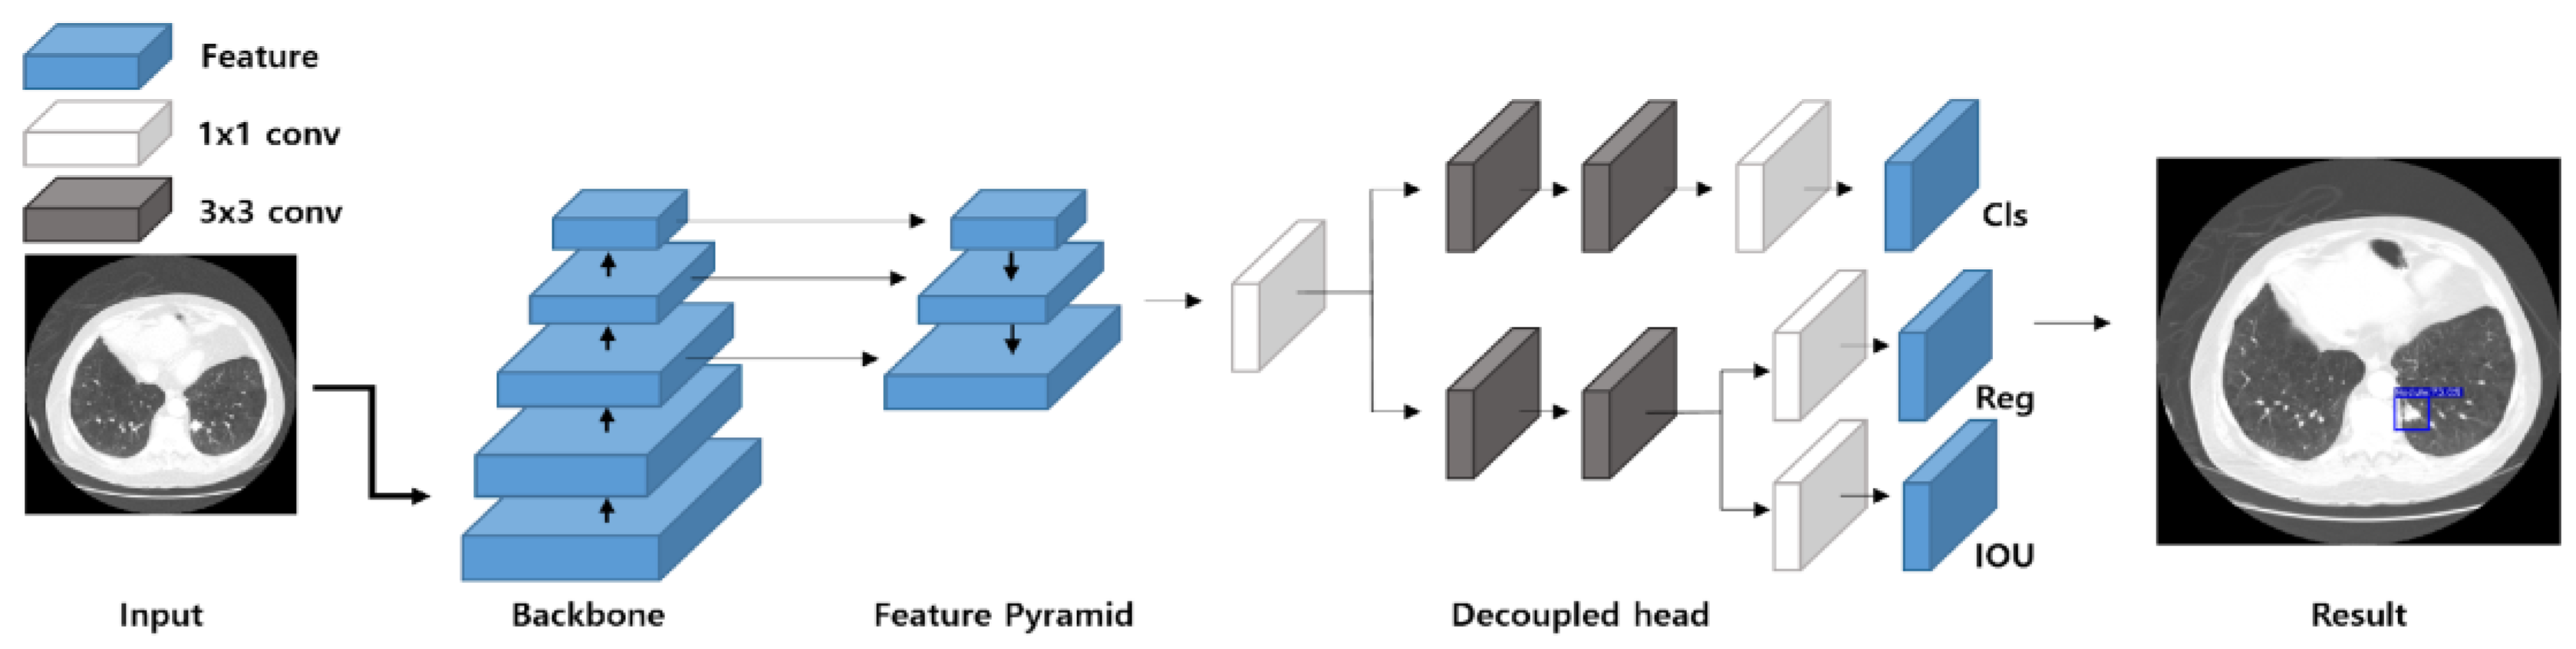
2.4. Object Detection and Deep Learning Model
2.5. Evaluation Metrics
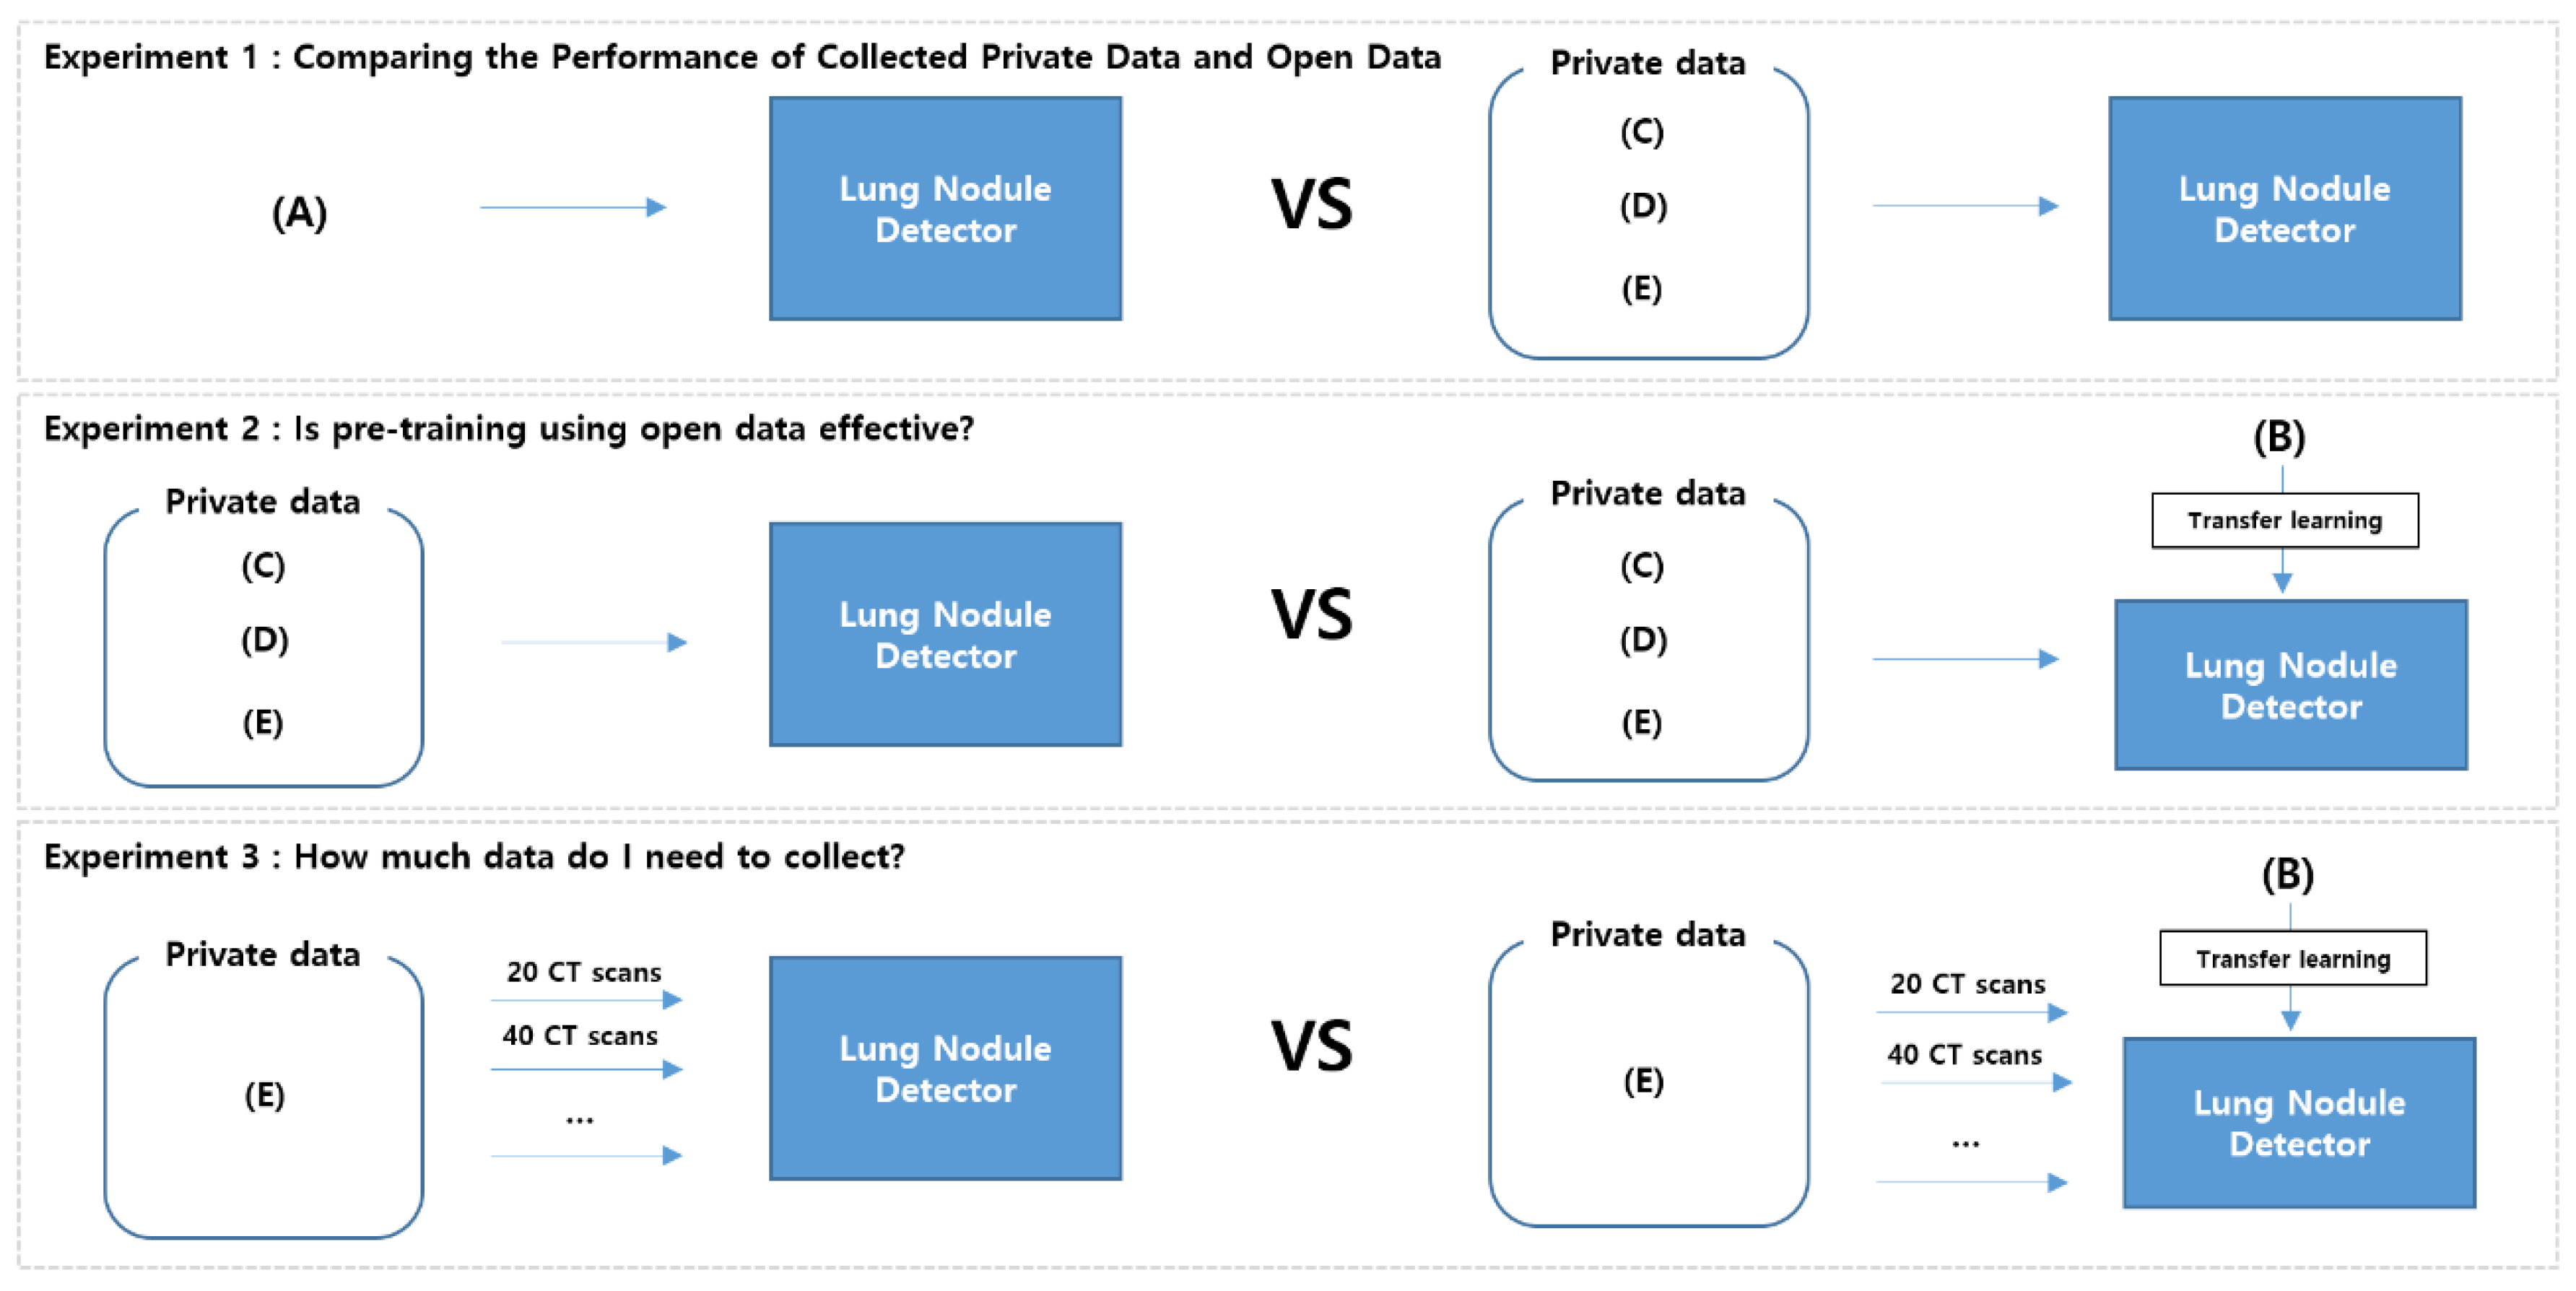
2.6. Dataset Configuration and Experimental Strategy
3. Results
3.1. Experiment 1: Comparing the Performance of Collected Private Data and Open Data
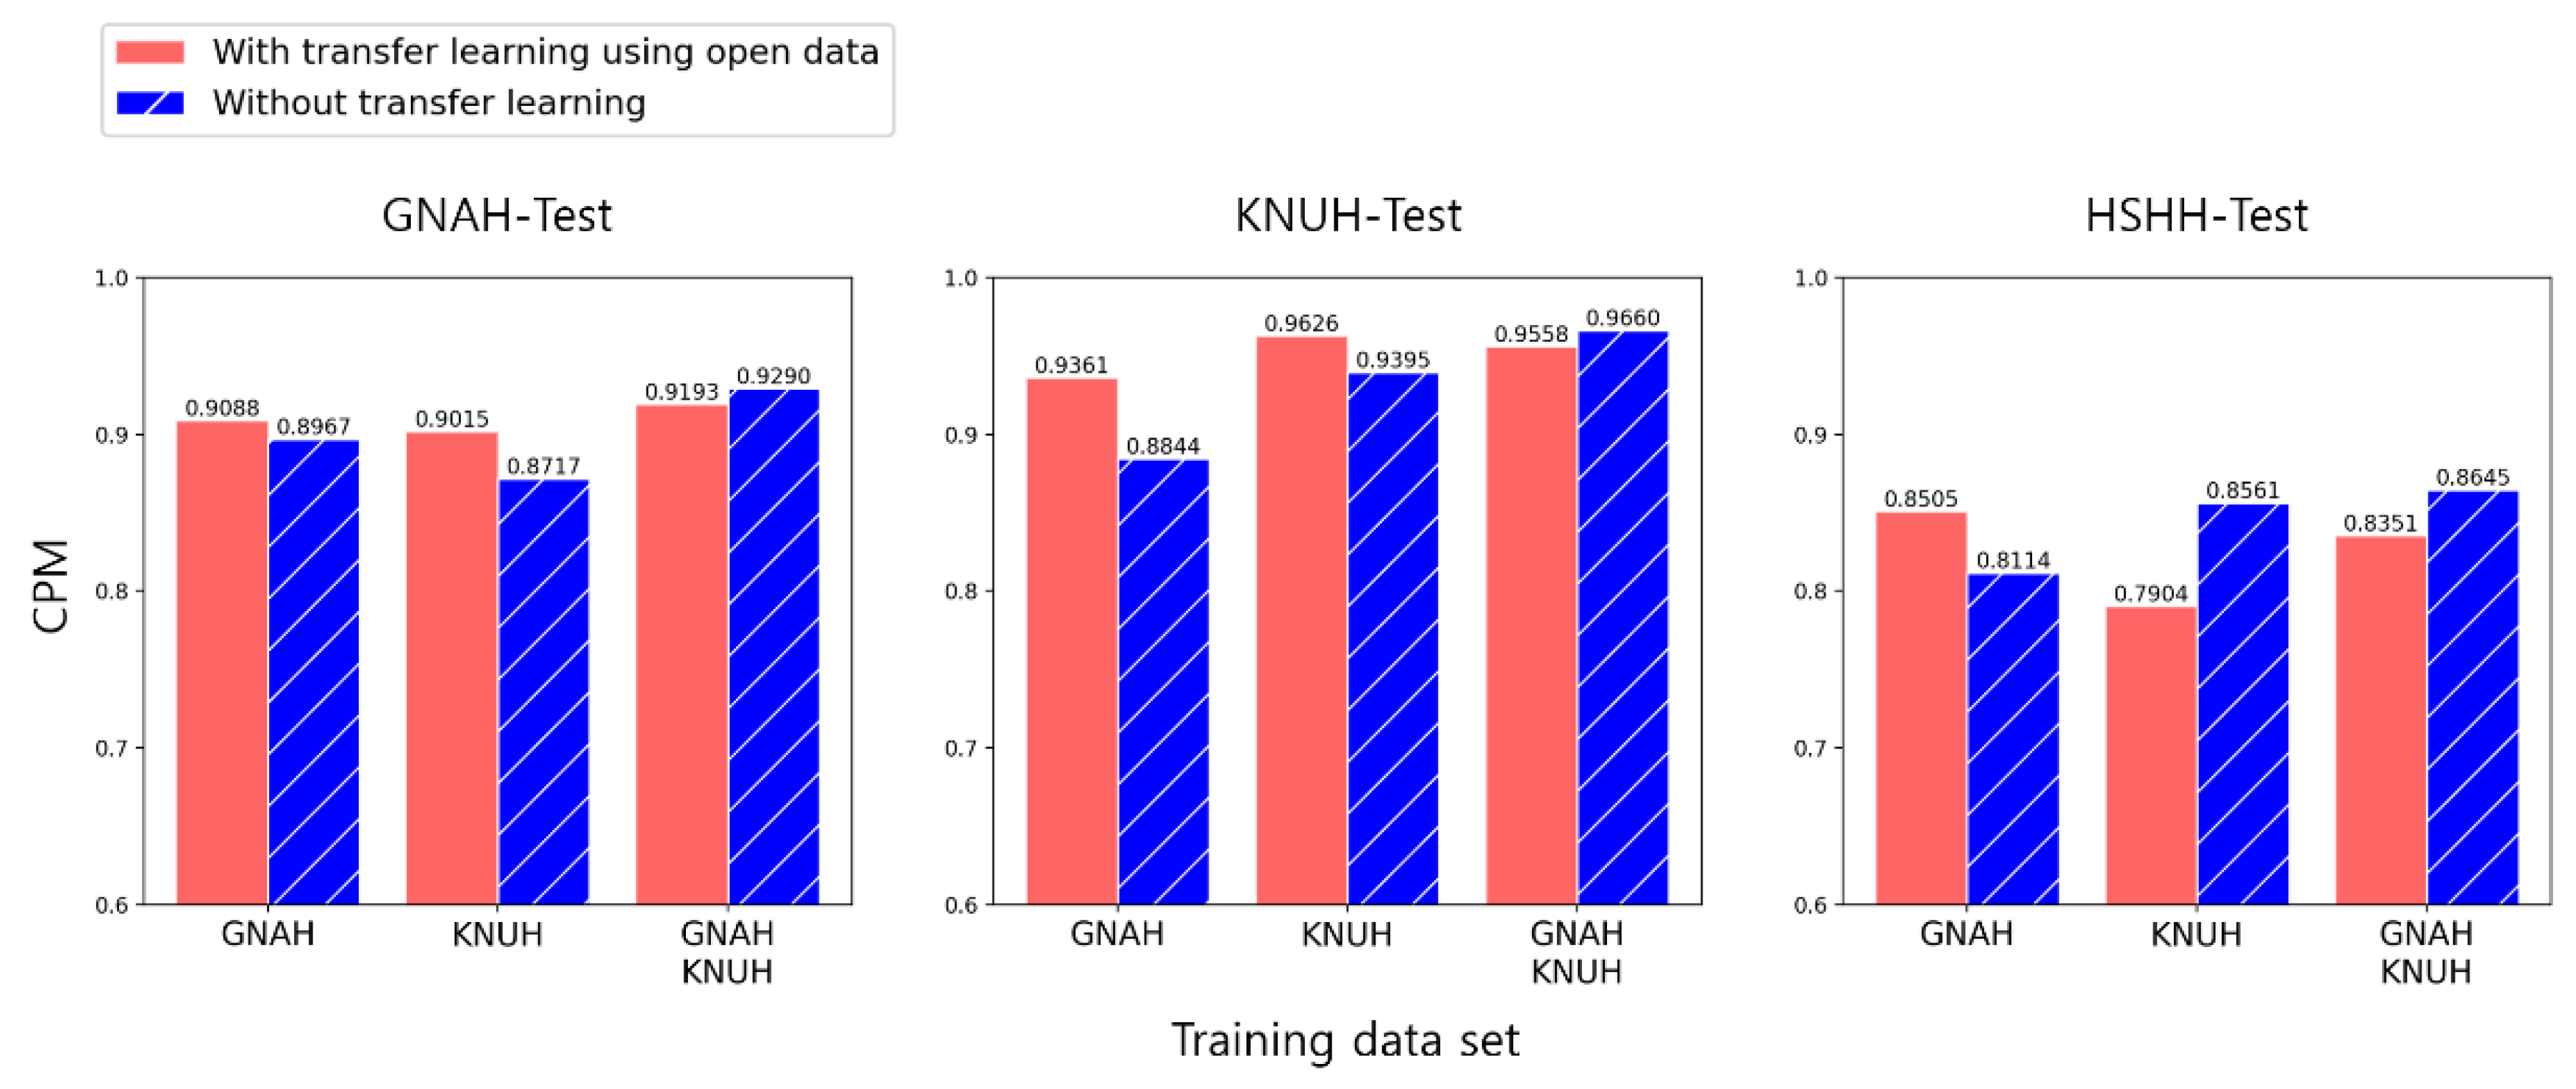
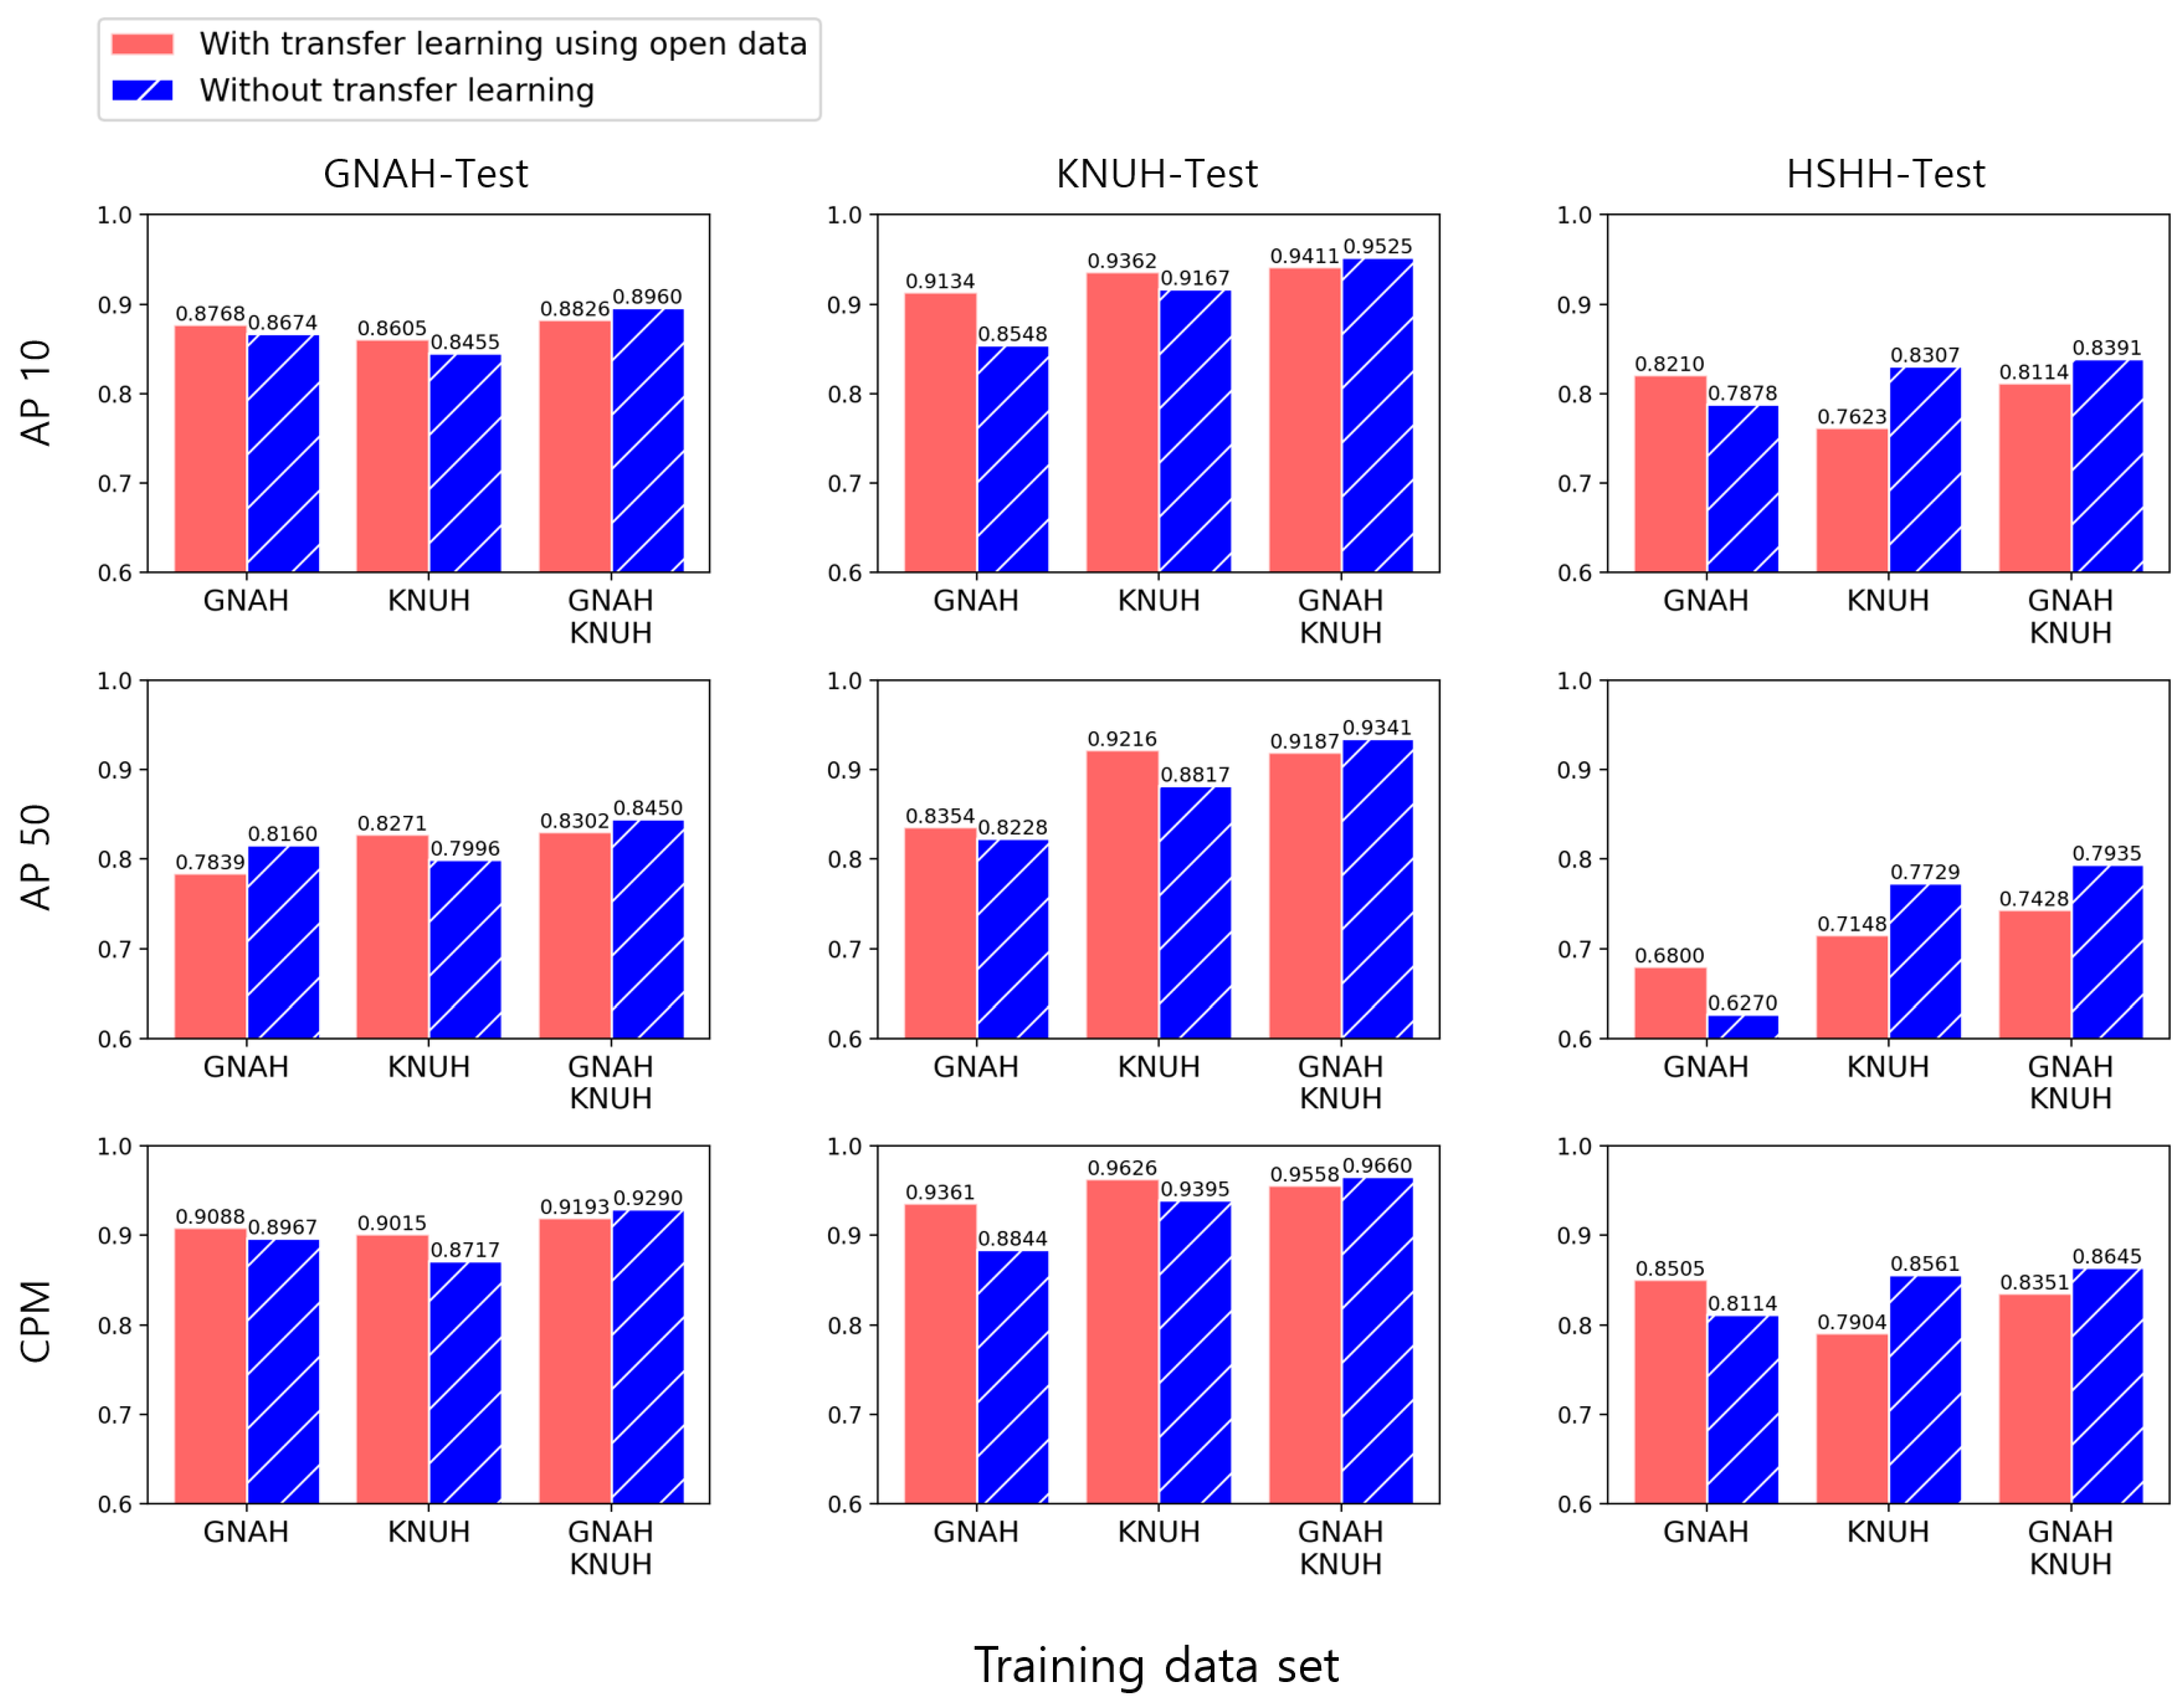
3.2. Experiment 2: Is Pre-Training Using Open Data Effective?
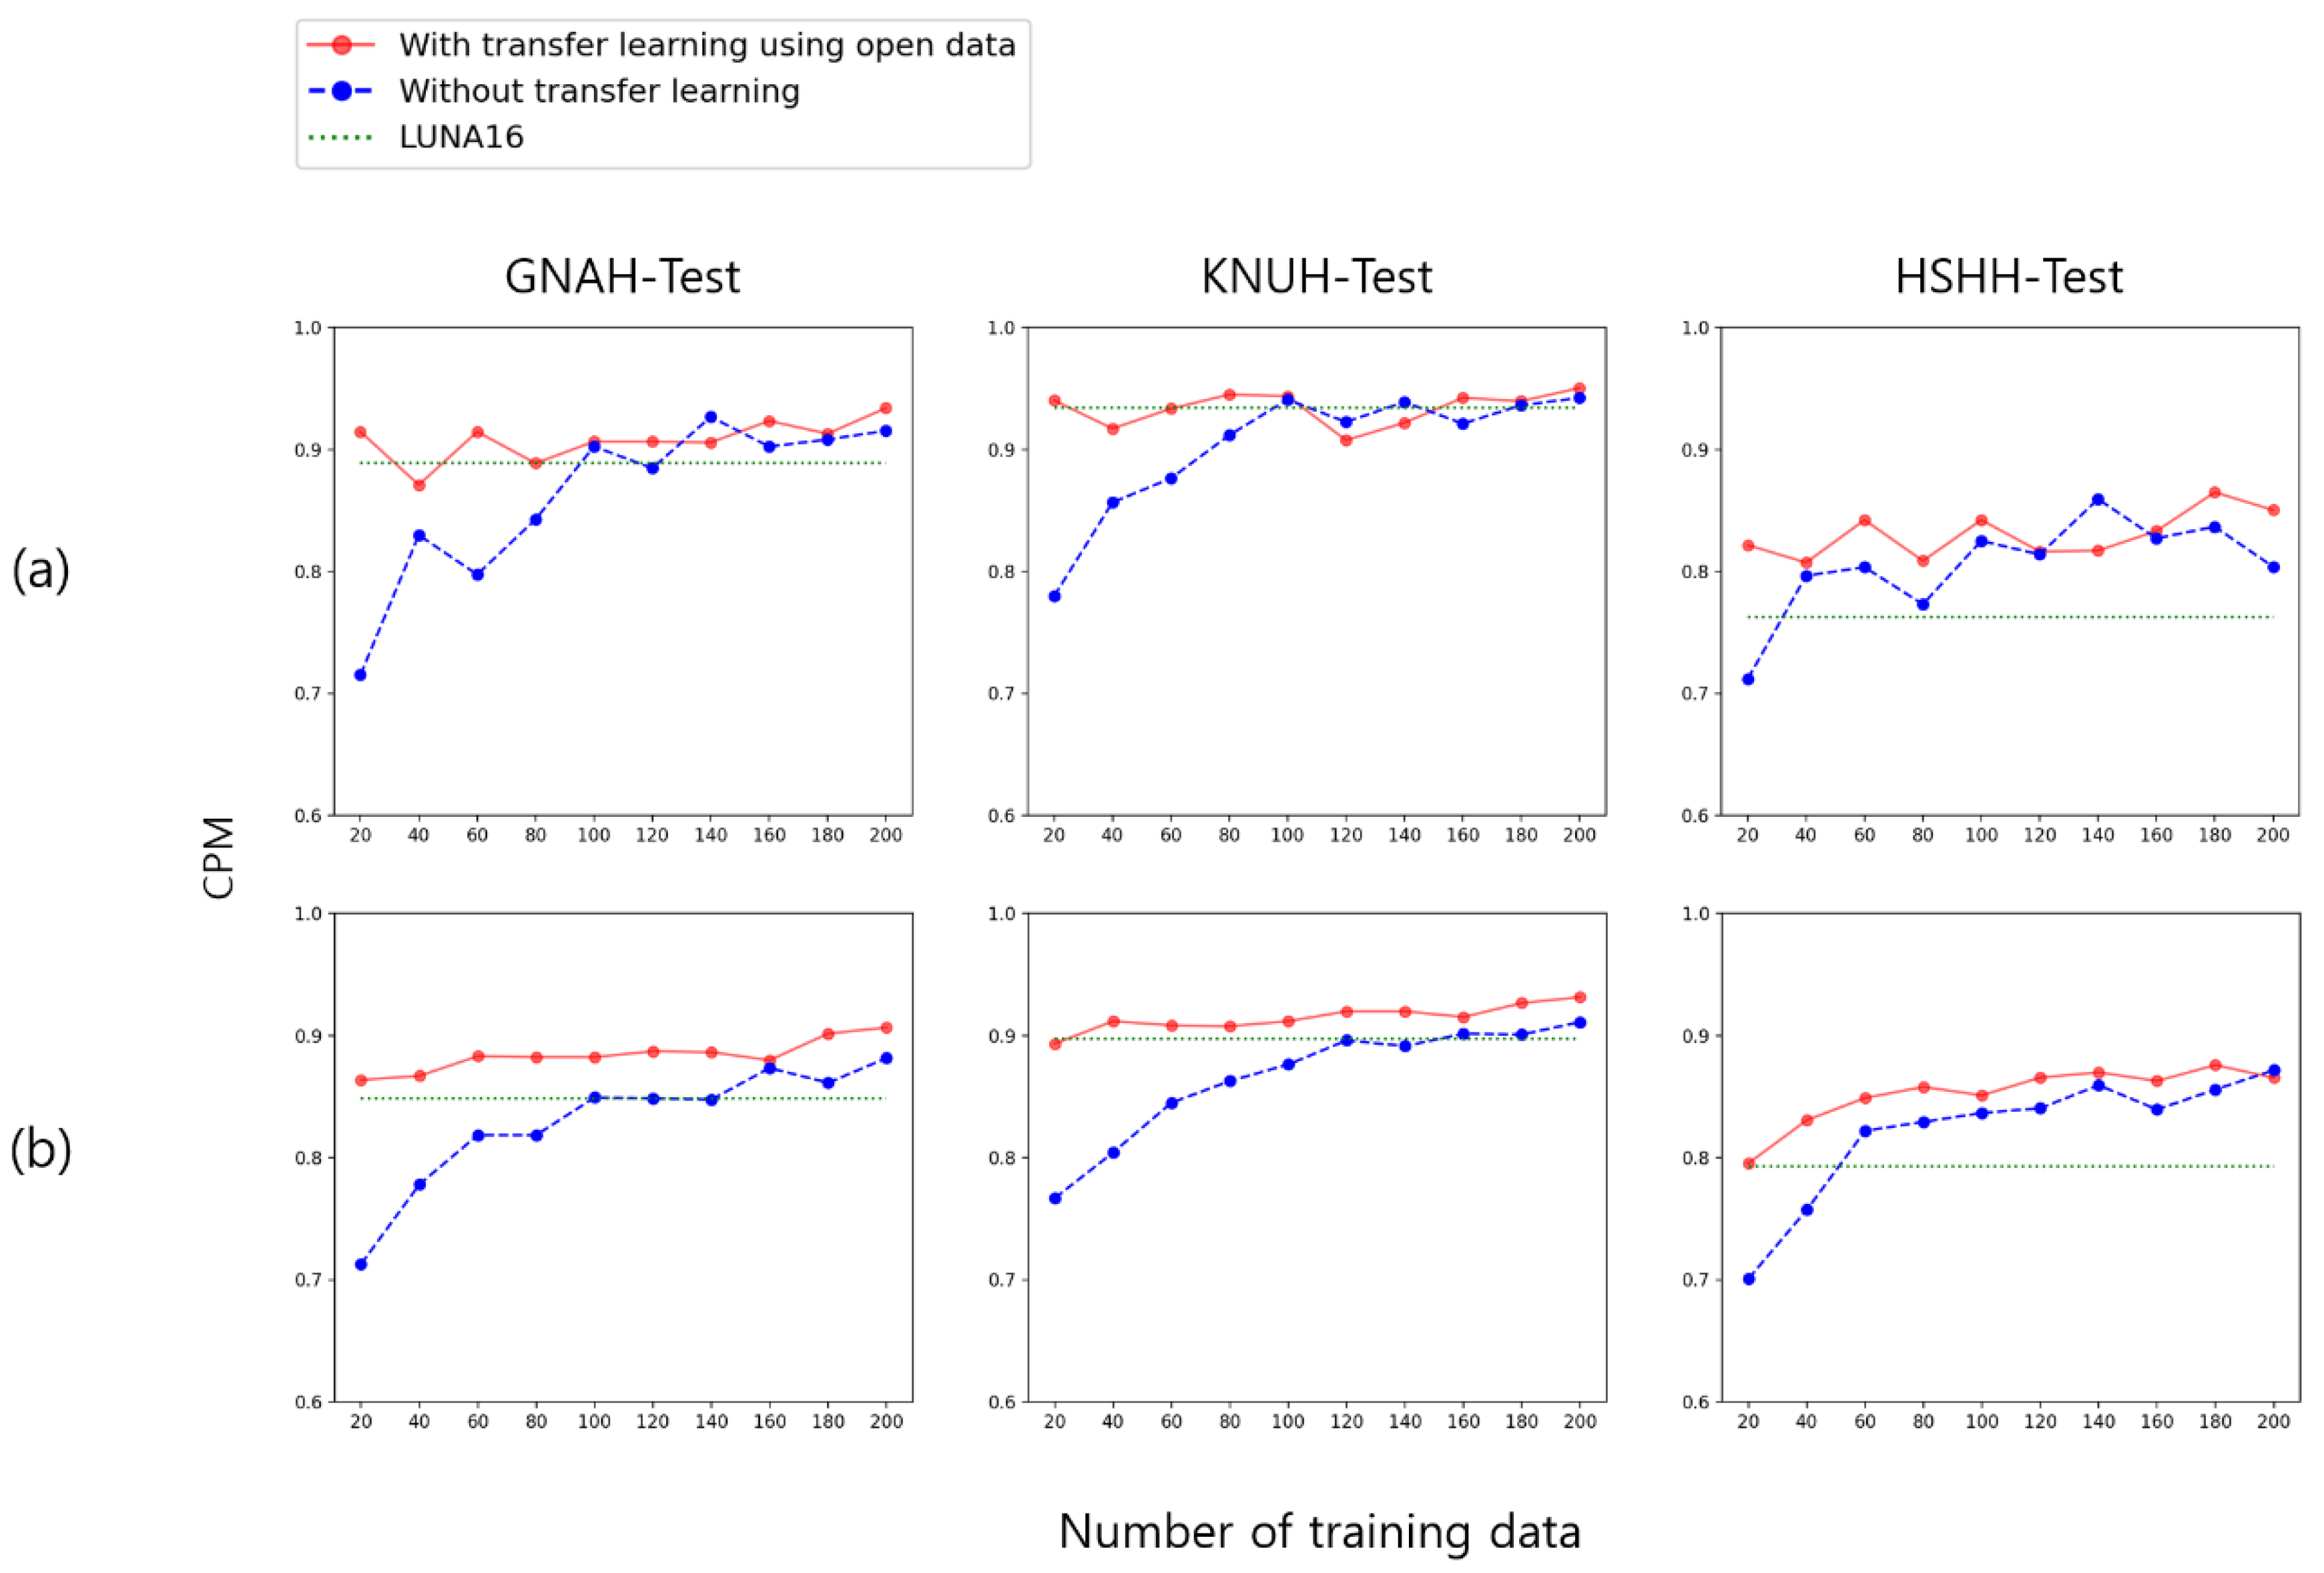
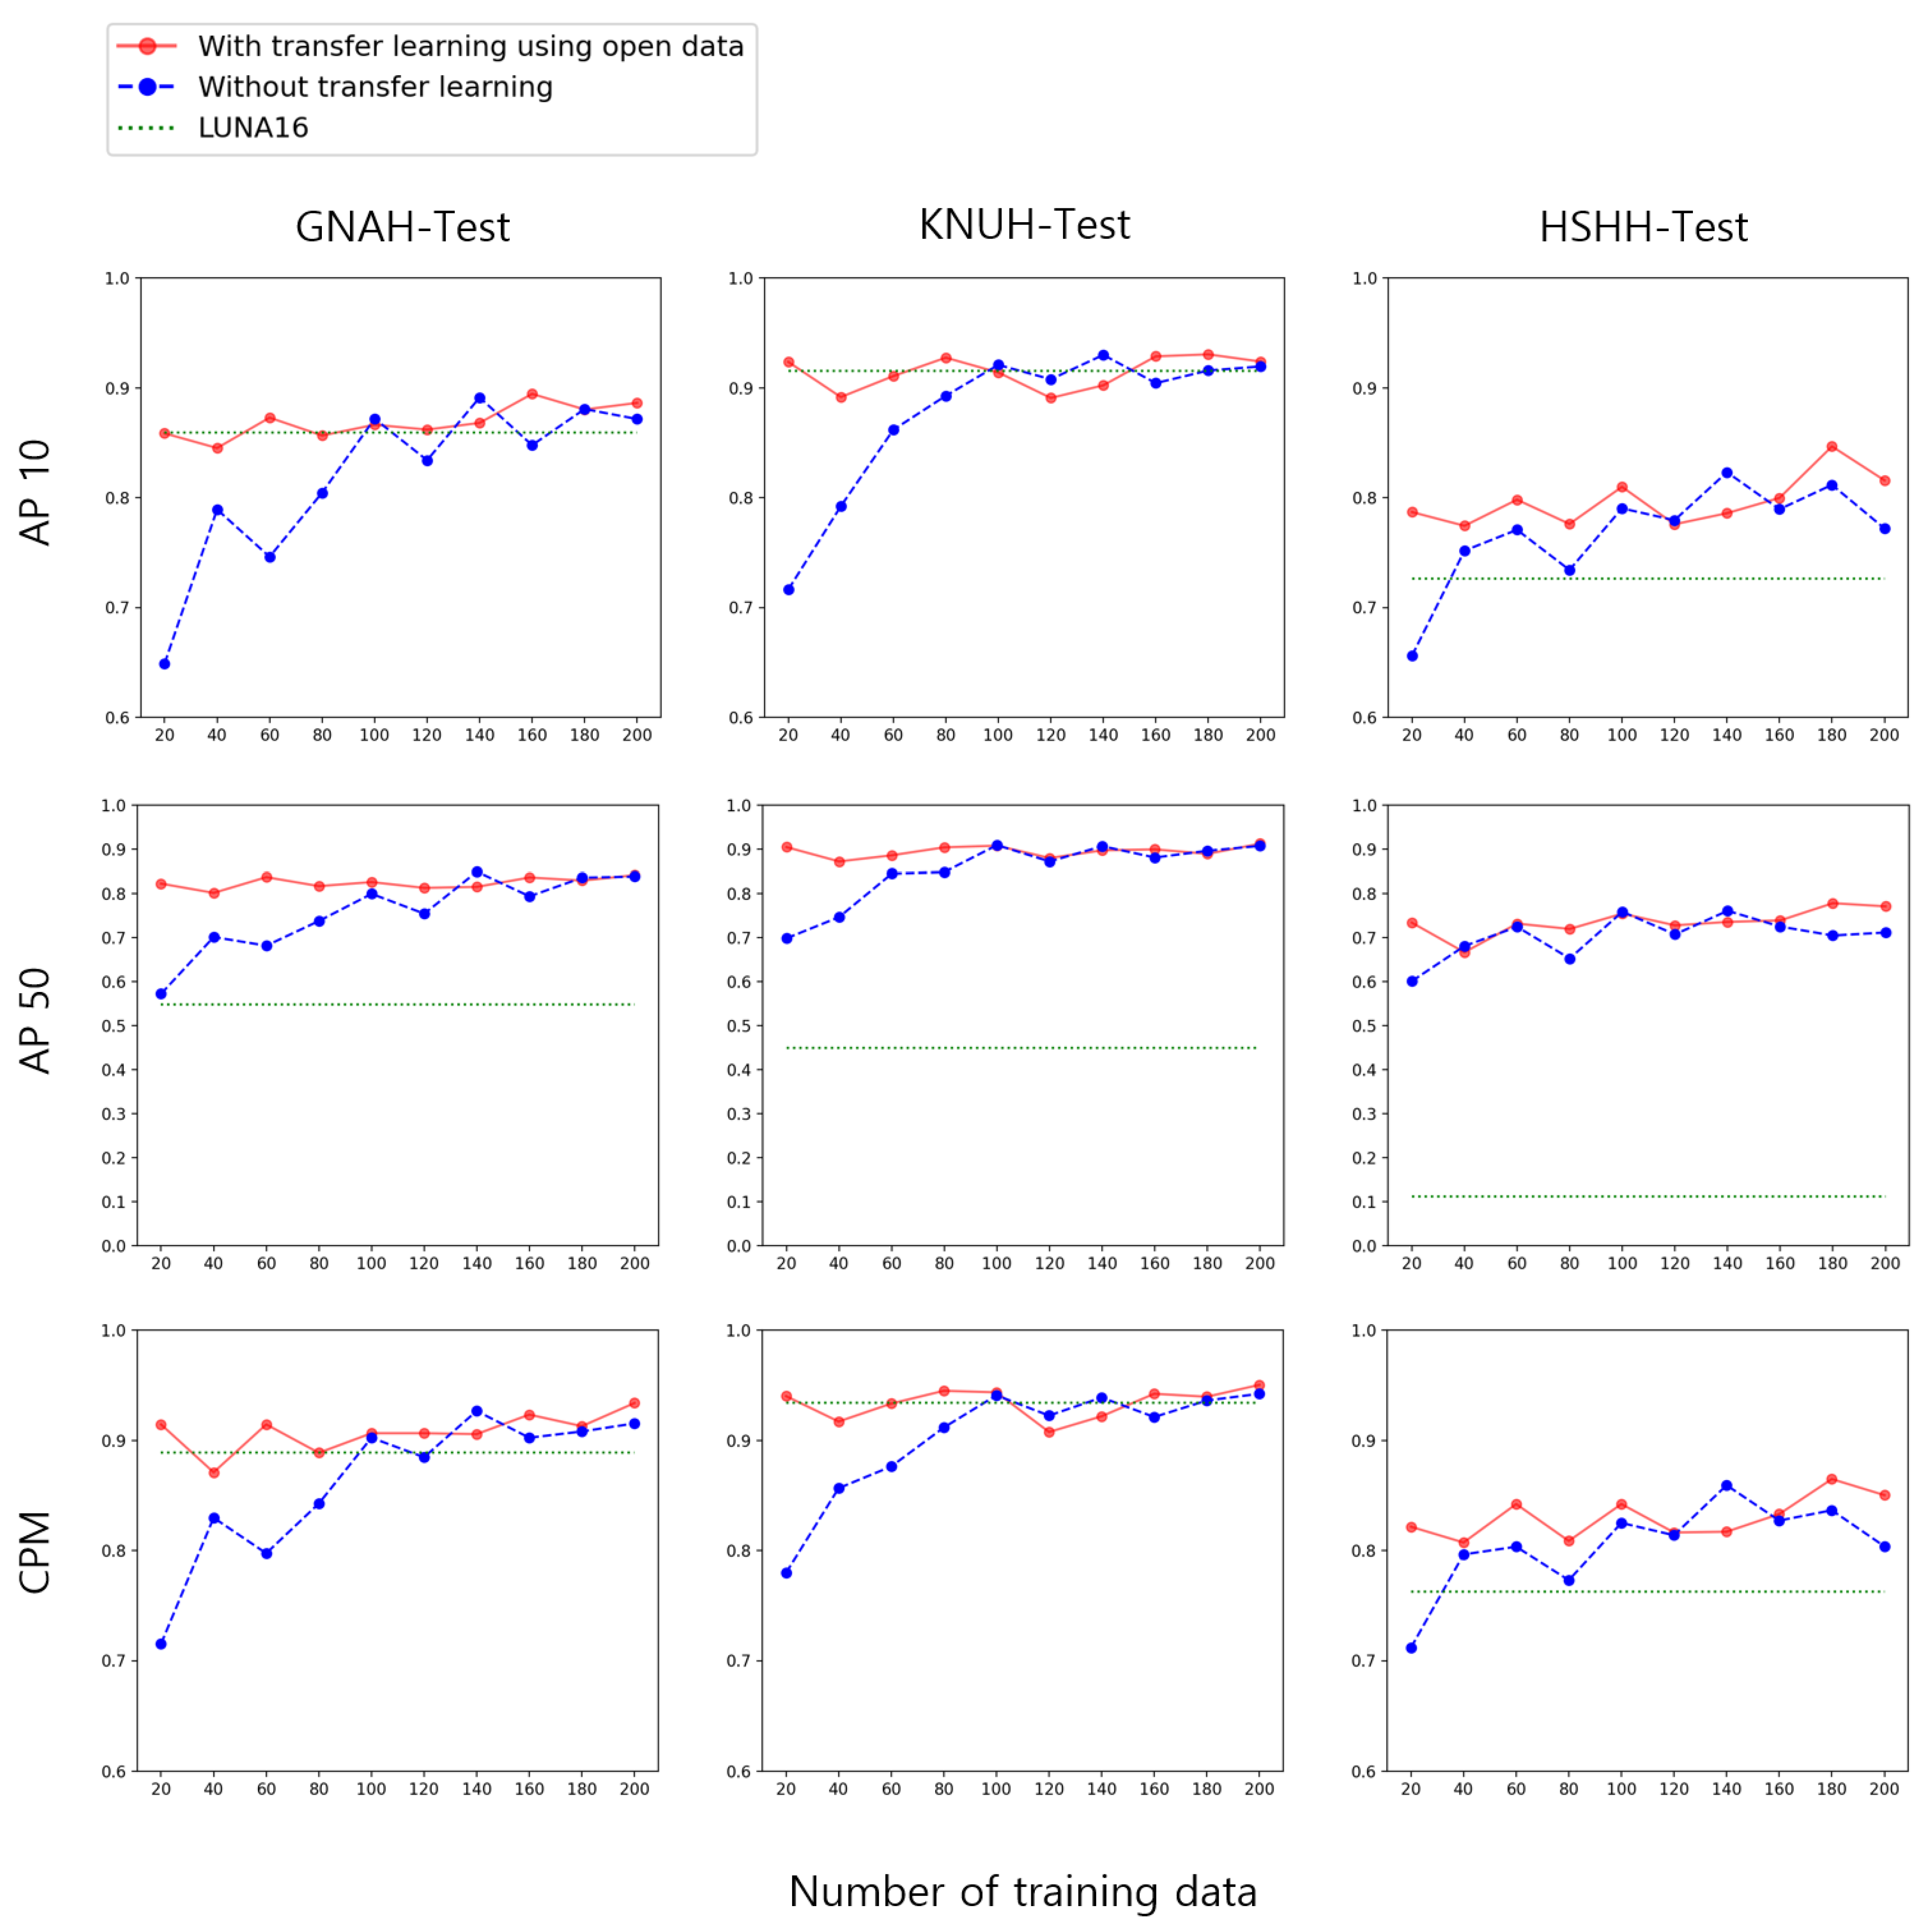
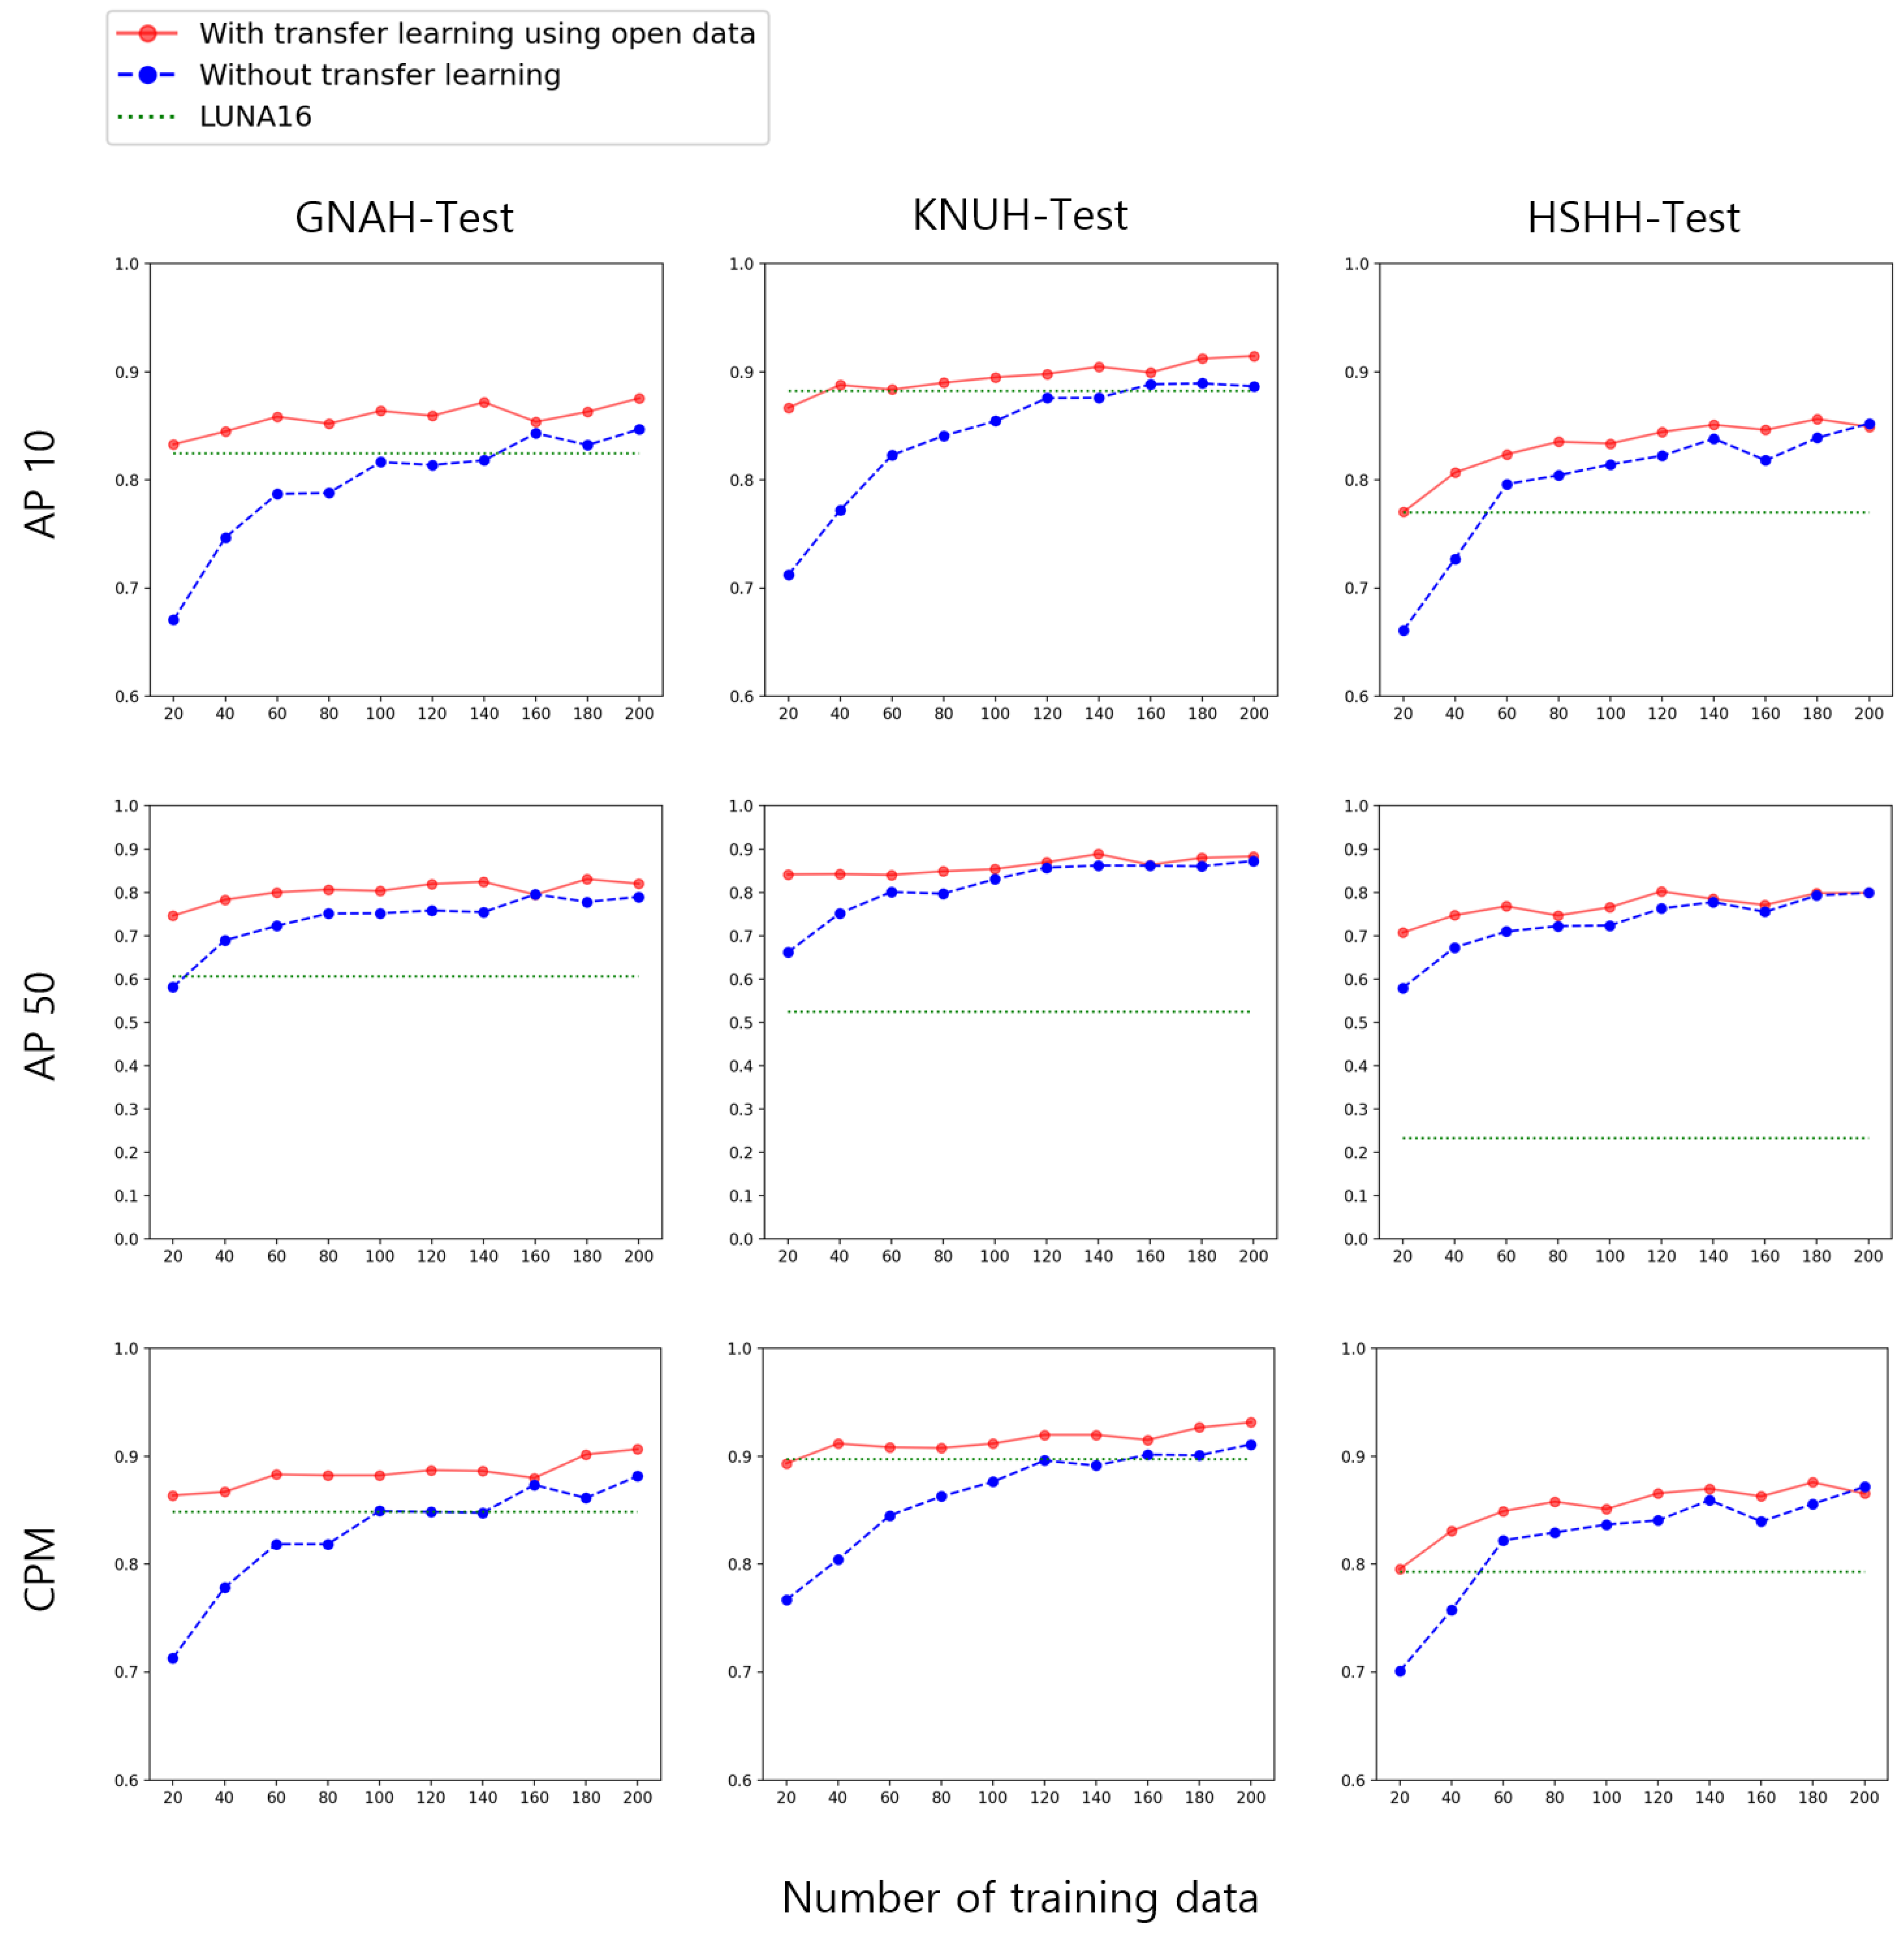
3.3. Experiment 3: How Much Data Do I Need to Collect?
4. Discussion
5. Conclusions
Author Contributions
Funding
Institutional Review Board Statement
Informed Consent Statement
Data Availability Statement
Conflicts of Interest
Appendix A

| Clinical Data | Total (n = 287) | Malignancy (n = 185) | Benign (n = 102) |
|---|---|---|---|
| Age, yr (min-max) | 67.5 (21–87) | 68.3 (32–87) | 66.1 (21–87) |
| Sex, male (%) | 181 (63.1) | 110 (59.5) | 71 (69.6) |
| Pathological diagnosis, n (%) | |||
| NSCLC | 145 (50.5) | 145 (78.4) | 0 |
| Adenocarcinoma | 107 (37.3) | 107 (57.8) | |
| Squamous cell carcinoma | 33 (11.5) | 33 (17.8) | |
| Adenosquamous carcinoma | 2 (0.7) | 2 (1.1) | |
| NSCLC | 3 (1.0) | 3 (1.6) | |
| SCLC | 9 (3.1) | 9 (4.9) | 0 |
| Other type of lung malignancy | 7 (2.4) | 7 (3.8) | 0 |
| Malignancy other than in the lung | 24 (8.4) | 24 (13.0) | 0 |
| Negative for malignancy | 58 (20.2) | 0 | 58 (56.9) |
| NA | 44 (15.3) | 0 | 44 (43.1) |
| Methods for pathological diagnosis | |||
| PCNA | 105 (36.6) | 57 (30.8) | 48 (47.1) |
| Surgical operation | 77 (26.8) | 71 (38.4) | 6 (5.9) |
| Bronchoscopy | 4 (1.4) | 4 (2.2) | 0 |
| EBUS-TBNA | 2 (0.7) | 2 (1.1) | 0 |
| Contrast-enhanced Chest CT (≥2 years) | |||
| No growth | 35 (12.2) | 0 | 35 (34.3) |
| Disappearance | 9 (3.1) | 0 | 9 (8.8) |
| Clinical Data | Total (n = 181) | Malignancy (n = 145) | Benign (n = 36) |
|---|---|---|---|
| Age, yr (min-max) | 67.2 (31–88) | 69.0 (46–88) | 60.3 (31–85) |
| Sex, male (%) | 116 (64.1) | 90 (62.1) | 26 (72.2) |
| Pathologic diagnosis, n (%) | |||
| NSCLC | 118 (65.2) | 118 (81.4) | 0 |
| Adenocarcinoma | 87 (48.1) | 87 (73.3) | |
| Squamous cell carcinoma | 25 (13.8) | 25 (21.1) | |
| Large cell endocrine carcinoma | 3 (1.7) | 3 (2.5) | |
| NSCLC | 3 (1.7) | 3 (2.5) | |
| SCLC | 5 (2.8) | 5 (3.4) | 0 |
| Other type of lung malignancy | 6 (3.3) | 6 (4.1) | 0 |
| Malignancy other than lung | 16 (8.8) | 16 (11.0) | 0 |
| Negative for malignancy | 33 (18.2) | 0 | 33 (91.7) |
| NA | 3 (1.7) | 0 | 3 (8.3) |
| Methods for pathologic diagnosis | |||
| PCNA | 92 (50.8) | 70 (48.3) | 22 (61.1) |
| Surgical operation | 86 (47.5) | 75 (51.7) | 11 (30.6) |
| Contrast-enhanced Chest CT (≥2 years) | |||
| No growth | 3 (1.7) | 3 (8.3) | |
| Disappearance | 0 | 0 |
| Clinical Data | Total (n = 47) | Malignancy (n = 30) | Benign (n = 17) |
|---|---|---|---|
| Age, yr (min-max) | 68.0 (35–88) | 70.4 (50–88) | 63.6 (35–87) |
| Sex, male (%) | 28 (63.1) | 18 (60.0) | 10 (58.8) |
| Pathologic diagnosis, n (%) | |||
| NSCLC | 24 (51.1) | 24 (80.0) | 0 |
| Adenocarcinoma | 17 (36.2) | 17 (56.7) | |
| Squamous cell carcinoma | 7 (14.9) | 7 (23.3) | |
| SCLC | 2 (4.3) | 2 (6.7) | 0 |
| Other type of lung malignancy | 3 (6.4) | 3 (10.0) | 0 |
| Malignancy | 1 (2.1) | 1 (3.3) | 0 |
| Negative for malignancy | 17 (36.2) | 0 | 17 (100.0) |
| Methods for pathologic diagnosis | |||
| PCNA | 19 (40.4) | 13 (43.3) | 6 (35.3) |
| Bronchoscopy | 16 (34.0) | 9 (30.0) | 7 (41.2) |
| Transbronchial lung biopsy | 5 (10.6) | 1 (3.3) | 4 (23.5) |
| Surgical operation | 3 (6.4) | 3 (10.0) | 0 |
| EBUS-TBNA | 1 (2.1) | 1 (3.3) | 0 |
| Unknown | 3 (6.4) | 2 (1.1) | 0 |
Appendix B


References
- World Health Organization. Available online: http://www.who.int/en/ (accessed on 5 September 2017).
- Bray, F.; Ferlay, J.; Soerjomataram, I.; Siegel, R.L.; Torre, L.A.; Jemal, A. Global cancer statistics 2018: GLOBOCAN estimates of incidence and mortality worldwide for 36 cancers in 185 countries. CA Cancer J. Clin. 2018, 68, 394–424. [Google Scholar] [CrossRef] [PubMed] [Green Version]
- Feng, R.M.; Zong, Y.N.; Cao, S.M.; Xu, R.H. Current cancer situation in China: Good or bad news from the 2018 Global Cancer Statistics? Cancer Commun. 2019, 39, 1–12. [Google Scholar] [CrossRef] [Green Version]
- Cancer Research UK. Available online: https://www.cancerresearchuk.org/ (accessed on 12 October 2017).
- The National Lung Screening Trial Research Team; Aberle, D.R.; Adams, A.M.; Berg, C.D.; Black, W.C.; Clapp, J.D.; Fagerstrom, R.M.; Gareen, I.F.; Gatsonis, C.; Marcus, P.M.; et al. Reduced lung-cancer mortality with low-dose computed tomographic screening. N. Engl. J. Med. 2011, 365, 395–409. [Google Scholar] [CrossRef] [PubMed] [Green Version]
- Demir, Ö.; Yılmaz Çamurcu, A. Computer-aided detection of lung nodules using outer surface features. Bio-Med. Mater. Eng. 2015, 26, S1213–S1222. [Google Scholar] [CrossRef] [PubMed] [Green Version]
- Bogoni, L.; Ko, J.P.; Alpert, J.; Anand, V.; Fantauzzi, J.; Florin, C.H.; Koo, C.W.; Mason, D.; Rom, W.; Shiau, M.; et al. Impact of a computer-aided detection (CAD) system integrated into a picture archiving and communication system (PACS) on reader sensitivity and efficiency for the detection of lung nodules in thoracic CT exams. J. Digit. Imaging 2012, 25, 771–781. [Google Scholar] [CrossRef] [PubMed] [Green Version]
- Al Mohammad, B.; Brennan, P.C.; Mello-Thoms, C. A review of lung cancer screening and the role of computer-aided detection. Clin. Radiol. 2017, 72, 433–442. [Google Scholar] [CrossRef] [PubMed]
- Armato, S.G., III; McLennan, G.; Bidaut, L.; McNitt-Gray, M.F.; Meyer, C.R.; Reeves, A.P.; Zhao, B.; Aberle, D.R.; Henschke, C.I.; Hoffman, E.A. The lung image database consortium (LIDC) and image database resource initiative (IDRI): A completed reference database of lung nodules on CT scans. Med. Phys. 2011, 38, 915–931. [Google Scholar] [CrossRef]
- Setio, A.A.A.; Traverso, A.; De Bel, T.; Berens, M.S.; Van Den Bogaard, C.; Cerello, P.; Chen, H.; Dou, Q.; Fantacci, M.E.; Geurts, B. Validation, comparison, and combination of algorithms for automatic detection of pulmonary nodules in computed tomography images: The LUNA16 challenge. Med. Image Anal. 2017, 42, 1–13. [Google Scholar] [CrossRef] [Green Version]
- Zarogoulidis, K.; Zarogoulidis, P.; Darwiche, K.; Boutsikou, E.; Machairiotis, N.; Tsakiridis, K.; Katsikogiannis, N.; Kougioumtzi, I.; Karapantzos, I.; Huang, H. Treatment of non-small cell lung cancer (NSCLC). J. Thorac. Dis. 2013, 5, S389. [Google Scholar]
- ELCAP Public Lung Image Database. Available online: http://www.via/cornell.edu/lungdb.html (accessed on 21 January 2022).
- Van Ginneken, B.; Armato, S.G., III; de Hoop, B.; van Amelsvoort-van de Vorst, S.; Duindam, T.; Niemeijer, M.; Murphy, K.; Schilham, A.; Retico, A.; Fantacci, M.E. Comparing and combining algorithms for computer-aided detection of pulmonary nodules in computed tomography scans: The ANODE09 study. Med. Image Anal. 2010, 14, 707–722. [Google Scholar] [CrossRef] [Green Version]
- Li, R.; Xiao, C.; Huang, Y.; Hassan, H.; Huang, B. Deep Learning Applications in Computed Tomography Images for Pulmonary Nodule Detection and Diagnosis: A Review. Diagnostics 2022, 12, 298. [Google Scholar] [CrossRef] [PubMed]
- Mu, R.; Zeng, X. A review of deep learning research. KSII Trans. Internet Inf. Syst. (TIIS) 2019, 13, 1738–1764. [Google Scholar]
- Voulodimos, A.; Doulamis, N.; Doulamis, A.; Protopapadakis, E. Deep learning for computer vision: A brief review. Comput. Intell. Neurosci. 2018, 2018. [Google Scholar] [CrossRef] [PubMed]
- Howard, J.; Ruder, S. Universal language model fine-tuning for text classification. arXiv 2018, arXiv:1801.06146. [Google Scholar]
- Xiong, W.; Wu, L.; Alleva, F.; Droppo, J.; Huang, X.; Stolcke, A. The Microsoft 2017 conversational speech recognition system. In Proceedings of the 2018 IEEE International Conference on Acoustics, Speech and Signal Processing (ICASSP), Calgary, AB, Canada, 15–20 April 2018; pp. 5934–5938. [Google Scholar]
- Lundervold, A.S.; Lundervold, A. An overview of deep learning in medical imaging focusing on MRI. Z. Med. Phys. 2019, 29, 102–127. [Google Scholar] [CrossRef]
- Razzak, M.I.; Naz, S.; Zaib, A. Deep learning for medical image processing: Overview, challenges and the future. Classif. BioApps 2018, 323–350. [Google Scholar] [CrossRef] [Green Version]
- Ren, S.; He, K.; Girshick, R.; Sun, J. Faster R-CNN: Towards real-time object detection with region proposal networks. In Proceedings of the International Conference on Neural Information Processing Systems, Montreal, QC, Canada, 7–12 December 2015; pp. 91–99. [Google Scholar]
- Lin, T.-Y.; Goyal, P.; Girshick, R.; He, K.; Dollár, P. Focal loss for dense object detection. In Proceedings of the IEEE International Conference on Computer Vision, Venice, Italy, 22–29 October 2017; pp. 2980–2988. [Google Scholar]
- Tan, M.; Pang, R.; Le, Q.V. Efficientdet: Scalable and efficient object detection. In Proceedings of the IEEE/CVF Conference on Computer Vision and Pattern Recognition, Seattle, WA, USA, 13–19 June 2020; pp. 10781–10790. [Google Scholar]
- Ge, Z.; Liu, S.; Wang, F.; Li, Z.; Sun, J. Yolox: Exceeding yolo series in 2021. arXiv 2021, arXiv:2107.08430. [Google Scholar]
- Weiss, K.; Khoshgoftaar, T.M.; Wang, D. A survey of transfer learning. J. Big Data 2016, 3, 1–40. [Google Scholar] [CrossRef] [Green Version]
- Fleischner Society. Available online: https://fleischner.memberclicks.net/ (accessed on 16 October 2017).
- MacMahon, H.; Naidich, D.P.; Goo, J.M.; Lee, K.S.; Leung, A.N.C.; Mayo, J.R.; Mehta, A.C.; Ohno, Y.; Powell, C.A.; Prokop, M.; et al. Guidelines for Management of Incidental Pulmonary Nodules Detected on CT Images: From the Fleischner Society 2017. Radiology 2017, 284, 228–243. [Google Scholar] [CrossRef] [Green Version]
- Everingham, M.; Van Gool, L.; Williams, C.K.; Winn, J.; Zisserman, A. The pascal visual object classes (voc) challenge. Int. J. Comput. Vis. 2010, 88, 303–338. [Google Scholar] [CrossRef] [Green Version]
- Cho, H.-H.; Lee, H.Y.; Kim, E.; Lee, G.; Kim, J.; Kwon, J.; Park, H. Radiomics-guided deep neural networks stratify lung adenocarcinoma prognosis from CT scans. Commun. Biol. 2021, 4, 1286. [Google Scholar] [CrossRef] [PubMed]
- Song, Y.; Zheng, S.; Li, L.; Zhang, X.; Zhang, X.; Huang, Z.; Chen, J.; Wang, R.; Zhao, H.; Chong, Y. Deep learning enables accurate diagnosis of novel coronavirus (COVID-19) with CT images. IEEE/ACM Trans. Comput. Biol. Bioinform. 2021, 18, 2775–2780. [Google Scholar] [CrossRef] [PubMed]
- Ahn, Y.; Lee, S.M.; Noh, H.N.; Kim, W.; Choe, J.; Do, K.-H.; Seo, J.B. Use of a commercially available deep learning algorithm to measure the solid portions of lung cancer manifesting as subsolid lesions at CT: Comparisons with radiologists and invasive component size at pathologic examination. Radiology 2021, 299, 202–210. [Google Scholar] [CrossRef] [PubMed]
- Kim, H.; Goo, J.M.; Lee, K.H.; Kim, Y.T.; Park, C.M. Preoperative CT-based deep learning model for predicting disease-free survival in patients with lung adenocarcinomas. Radiology 2020, 296, 216–224. [Google Scholar] [CrossRef]
- Shorten, C.; Khoshgoftaar, T.M. A survey on image data augmentation for deep learning. J. Big Data 2019, 6, 60. [Google Scholar] [CrossRef]
- Bochkovskiy, A.; Wang, C.-Y.; Liao, H.-Y.M. Yolov4: Optimal speed and accuracy of object detection. arXiv 2020, arXiv:2004.10934. [Google Scholar]
- Zhang, H.; Cisse, M.; Dauphin, Y.N.; Lopez-Paz, D. mixup: Beyond empirical risk minimization. arXiv 2017, arXiv:1710.09412. [Google Scholar]
- He, K.; Zhang, X.; Ren, S.; Sun, J. Spatial pyramid pooling in deep convolutional networks for visual recognition. IEEE Trans. Pattern Anal. Mach. Intell. 2015, 37, 1904–1916. [Google Scholar] [CrossRef] [Green Version]
- Lin, T.Y.; Dollár, P.; Girshick, R.; He, K.; Hariharan, B.; Belongie, S. Feature pyramid networks for object detection. In Proceedings of the IEEE Conference on Computer Vision and Pattern Recognition, Honolulu, HI, USA, 21–26 July 2017; pp. 936–944. [Google Scholar]
- Wu, Y.; Chen, Y.; Yuan, L.; Liu, Z.; Wang, L.; Li, H.; Fu, Y. Rethinking classification and localization for object detection. In Proceedings of the IEEE/CVF Conference on Computer Vision and Pattern Recognition, Seattle, WA, USA, 13–19 June 2020; pp. 10186–10195. [Google Scholar]
- Niemeijer, M.; Loog, M.; Abramoff, M.D.; Viergever, M.A.; Prokop, M.; van Ginneken, B. On combining computer-aided detection systems. IEEE Trans. Med. Imaging 2010, 30, 215–223. [Google Scholar] [CrossRef]
- Matuszewski, D.J.; Sintorn, I.-M. TEM virus images: Benchmark dataset and deep learning classification. Comput. Methods Programs Biomed. 2021, 209, 106318. [Google Scholar] [CrossRef]
- Kerner, H. Too many AI researchers think real-world problems are not relevant. Opin. MIT Technol. Rev. 2020, 1–15. Available online: https://www.technologyreview.com/2020/08/18/1007196/ai-research-machine-learning-applications-problems-opinion/ (accessed on 23 June 2022).
- Wagstaff, K. Machine learning that matters. arXiv 2012, arXiv:1206.4656. [Google Scholar]
- Gong, J.; Liu, J.; Li, H.; Zhu, H.; Wang, T.; Hu, T.; Li, M.; Xia, X.; Hu, X.; Peng, W. Deep Learning-Based Stage-Wise Risk Stratification for Early Lung Adenocarcinoma in CT Images: A Multi-Center Study. Cancers 2021, 13, 3300. [Google Scholar] [CrossRef] [PubMed]
- Xu, Y.; Wang, S.; Sun, X.; Yang, Y.; Fan, J.; Jin, W.; Li, Y.; Su, F.; Zhang, W.; Cui, Q.; et al. Identification of Benign and Malignant Lung Nodules in CT Images Based on Ensemble Learning Method. Interdiscip. Sci. 2022, 14, 130–140. [Google Scholar] [CrossRef] [PubMed]


| CT Protocols | GNAH Dataset | KNUH Dataset | HSHH Dataset |
|---|---|---|---|
| Name | SIEMENS/SOMATOM Definition Edge 2 (128 ch) | SIEMENS/SOMATOM Definition & Definition Flash | SIEMENS/SOMATOM Flash (128 ch) |
| kVp/mAs | 120/35 | 120/110 | 120/35 |
| kernel | B41f medium | B41f | B40f medium |
| slice/gap (mm) | 5 | 3 | 3 |
| Dataset | Training | Validation | Test |
|---|---|---|---|
| (A) | LUNA16 (subsets 1–8) | LUNA16 (subsets 9, 10) | GNAH (20%) KNUH (20%) HSHH (100%) |
| (B) | LUNA16 pre-train (100%) | GNAH (20%) KNUH (20%) | |
| (C) | GNAH (60%) | GNAH (20%) | |
| (D) | KNUH (60%) | KNUH (20%) | |
| (E) | GNAH (60%), KNUH (60%) | GNAH (20%) KNUH (20%) |
| Training Dataset | Test Dataset | AP10 | AP50 | CPM |
|---|---|---|---|---|
| LUNA16 | GNAH | 0.8590 (+0.0) | 0.5482 (+0.0) | 0.8886 (+0.0) |
| KNUH | 0.9151 (+0.0) | 0.4499 (+0.0) | 0.9340 (+0.0) | |
| HSHH | 0.7262 (+0.0) | 0.1111 (+0.0) | 0.7628 (+0.0) | |
| GNAH | GNAH | 0.8674 (+0.0084) | 0.8160 (+0.2678) | 0.8967 (+0.0081) |
| KNUH | 0.8548 (−0.0603) | 0.8228 (+0.3729) | 0.8844 (−0.0496) | |
| HSHH | 0.7878 (+0.0616) | 0.6270 (+0.5159) | 0.8114 (+0.0486) | |
| KNUH | GNAH | 0.8455 (−0.0135) | 0.7996 (+0.2514) | 0.8717 (−0.0169) |
| KNUH | 0.9167 (+0.0016) | 0.8817 (+0.4318) | 0.9395 (+0.0055) | |
| HSHH | 0.8307 (+0.1045) | 0.7729 (+0.6618) | 0.8561 (+0.0933) | |
| GNAH KNUH | GNAH | 0.8960 (+0.0370) | 0.8450 (+0.2968) | 0.9290 (+0.0404) |
| KNUH | 0.9525 (+0.0374) | 0.9341 (+0.4842) | 0.9660 (+0.0320) | |
| HSHH | 0.8391 (+0.1129) | 0.7935 (+0.6824) | 0.8645 (+0.1017) |
Publisher’s Note: MDPI stays neutral with regard to jurisdictional claims in published maps and institutional affiliations. |
© 2022 by the authors. Licensee MDPI, Basel, Switzerland. This article is an open access article distributed under the terms and conditions of the Creative Commons Attribution (CC BY) license (https://creativecommons.org/licenses/by/4.0/).
Share and Cite
Son, J.W.; Hong, J.Y.; Kim, Y.; Kim, W.J.; Shin, D.-Y.; Choi, H.-S.; Bak, S.H.; Moon, K.M. How Many Private Data Are Needed for Deep Learning in Lung Nodule Detection on CT Scans? A Retrospective Multicenter Study. Cancers 2022, 14, 3174. https://doi.org/10.3390/cancers14133174
Son JW, Hong JY, Kim Y, Kim WJ, Shin D-Y, Choi H-S, Bak SH, Moon KM. How Many Private Data Are Needed for Deep Learning in Lung Nodule Detection on CT Scans? A Retrospective Multicenter Study. Cancers. 2022; 14(13):3174. https://doi.org/10.3390/cancers14133174
Chicago/Turabian StyleSon, Jeong Woo, Ji Young Hong, Yoon Kim, Woo Jin Kim, Dae-Yong Shin, Hyun-Soo Choi, So Hyeon Bak, and Kyoung Min Moon. 2022. "How Many Private Data Are Needed for Deep Learning in Lung Nodule Detection on CT Scans? A Retrospective Multicenter Study" Cancers 14, no. 13: 3174. https://doi.org/10.3390/cancers14133174