
Ovarian Adnexal Reporting Data System (O-RADS) for Classifying Adnexal Masses: A Systematic Review and Meta-Analysis

 , and
, and
Abstract
:Simple Summary
Abstract
1. Introduction
2. Materials and Methods
2.1. Protocol and Registration
2.2. Data Sources and Searches
2.3. Study Selection and Data Collection
- (1)
- Prospective and retrospective cohort study including patients diagnosed as having at least one adnexal mass classified using the O-RADS system after transvaginal/transabdominal ultrasound assessment as the index test.
- (2)
- Report of histologic diagnosis of the adnexal mass after surgical removal or conservative management demonstrating spontaneous resolution or persistence in cases of benign appearing masses after follow-up scan as the reference standard.
- (3)
- Presence of data reported that would allow constructing a 2 × 2 table to estimate true positive, true negative, false positive, and false negative cases for the O-RADS system.
2.4. Risk of Bias in Individual Studies
2.5. Statistical Analysis
3. Results
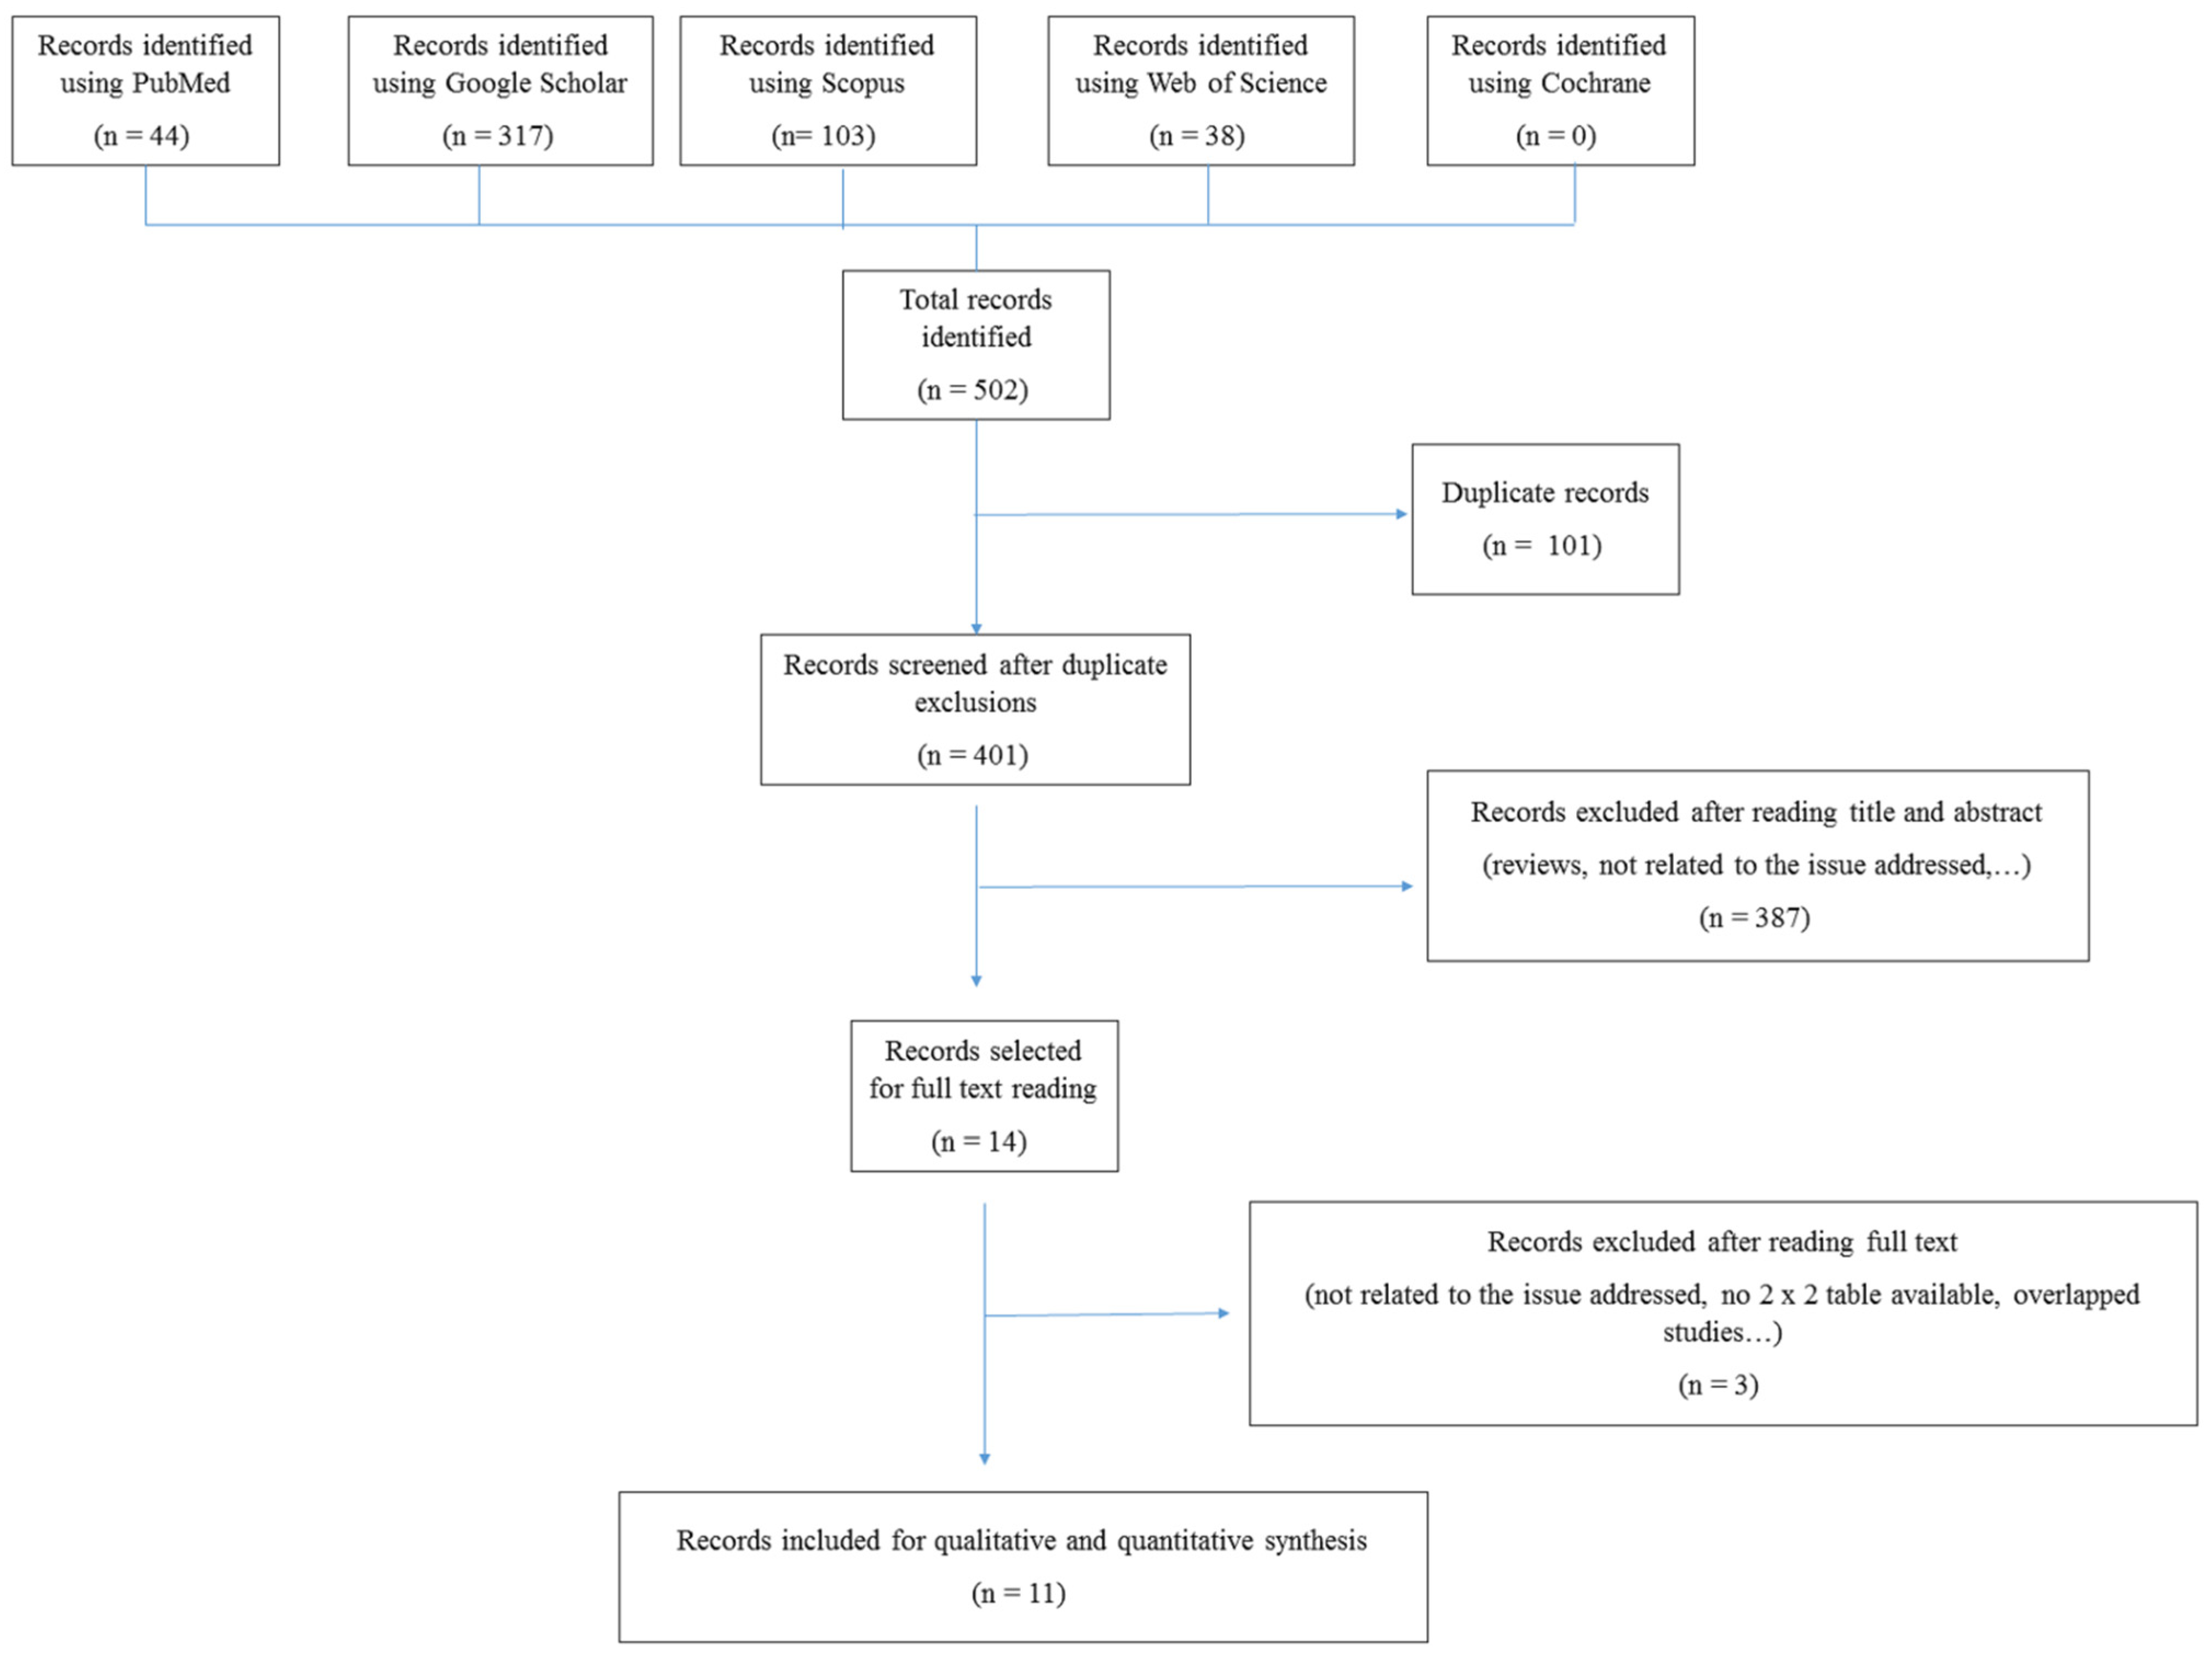
3.1. Search Results
3.2. Characteristics of Included Studies
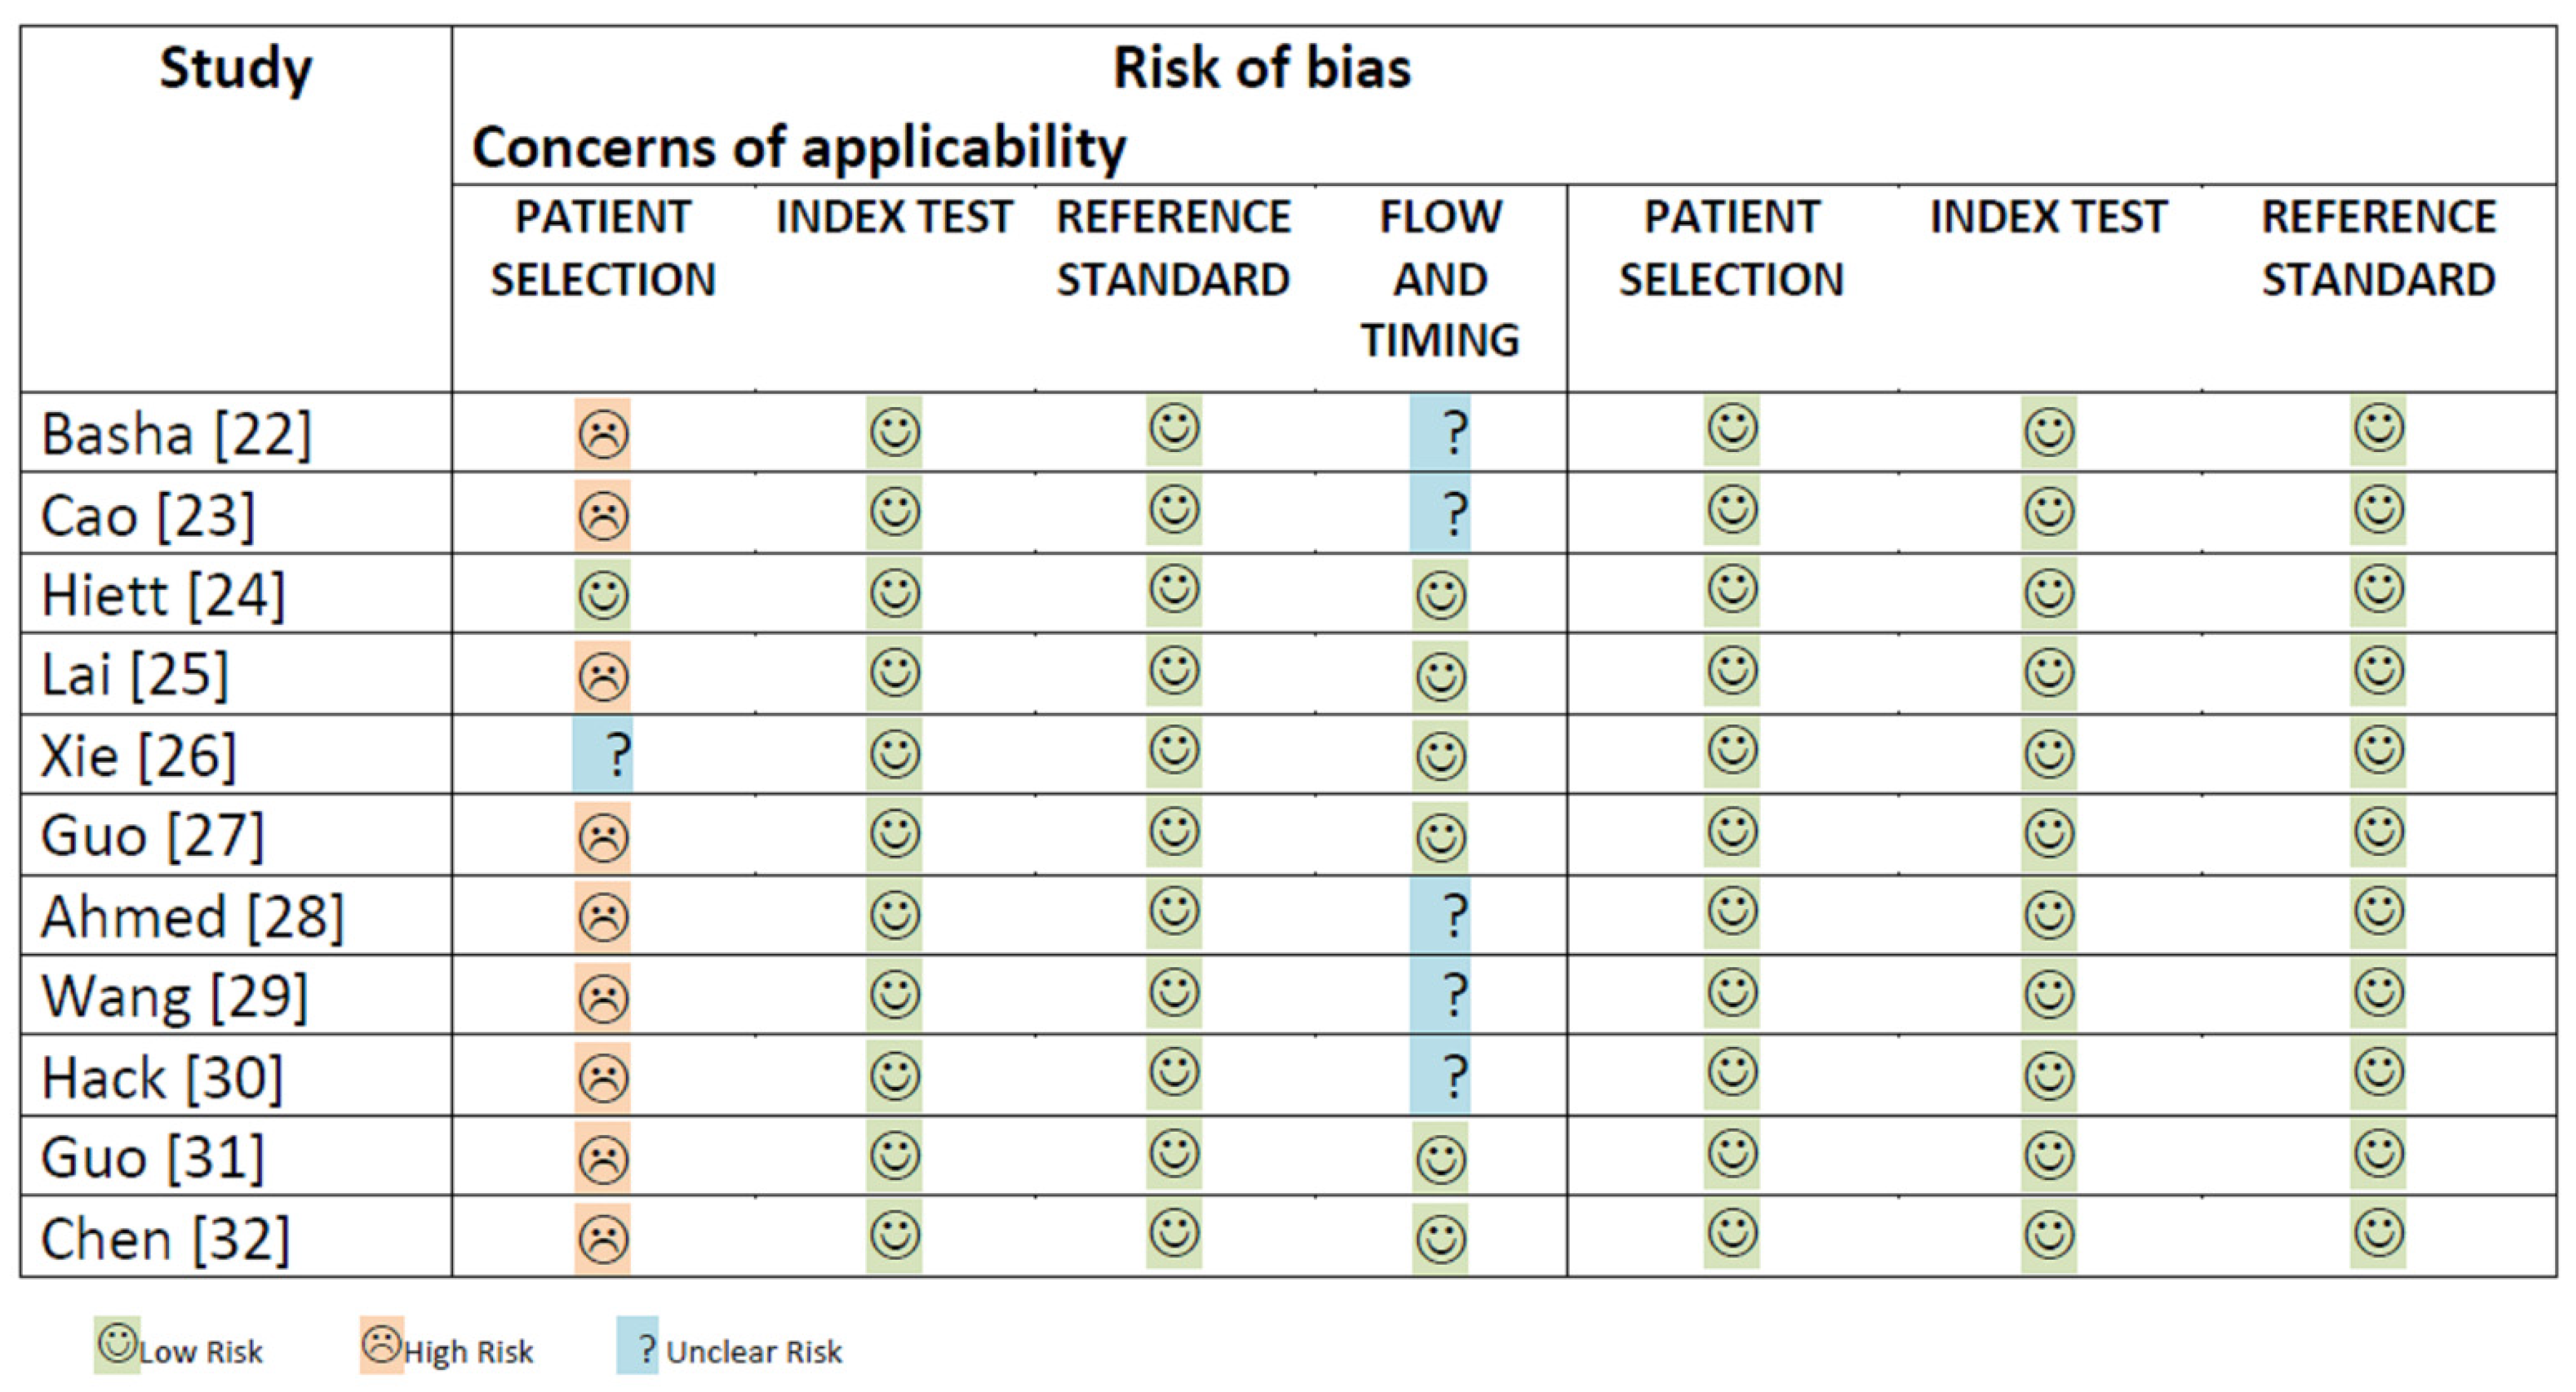
3.3. Methodological Quality of Included Studies
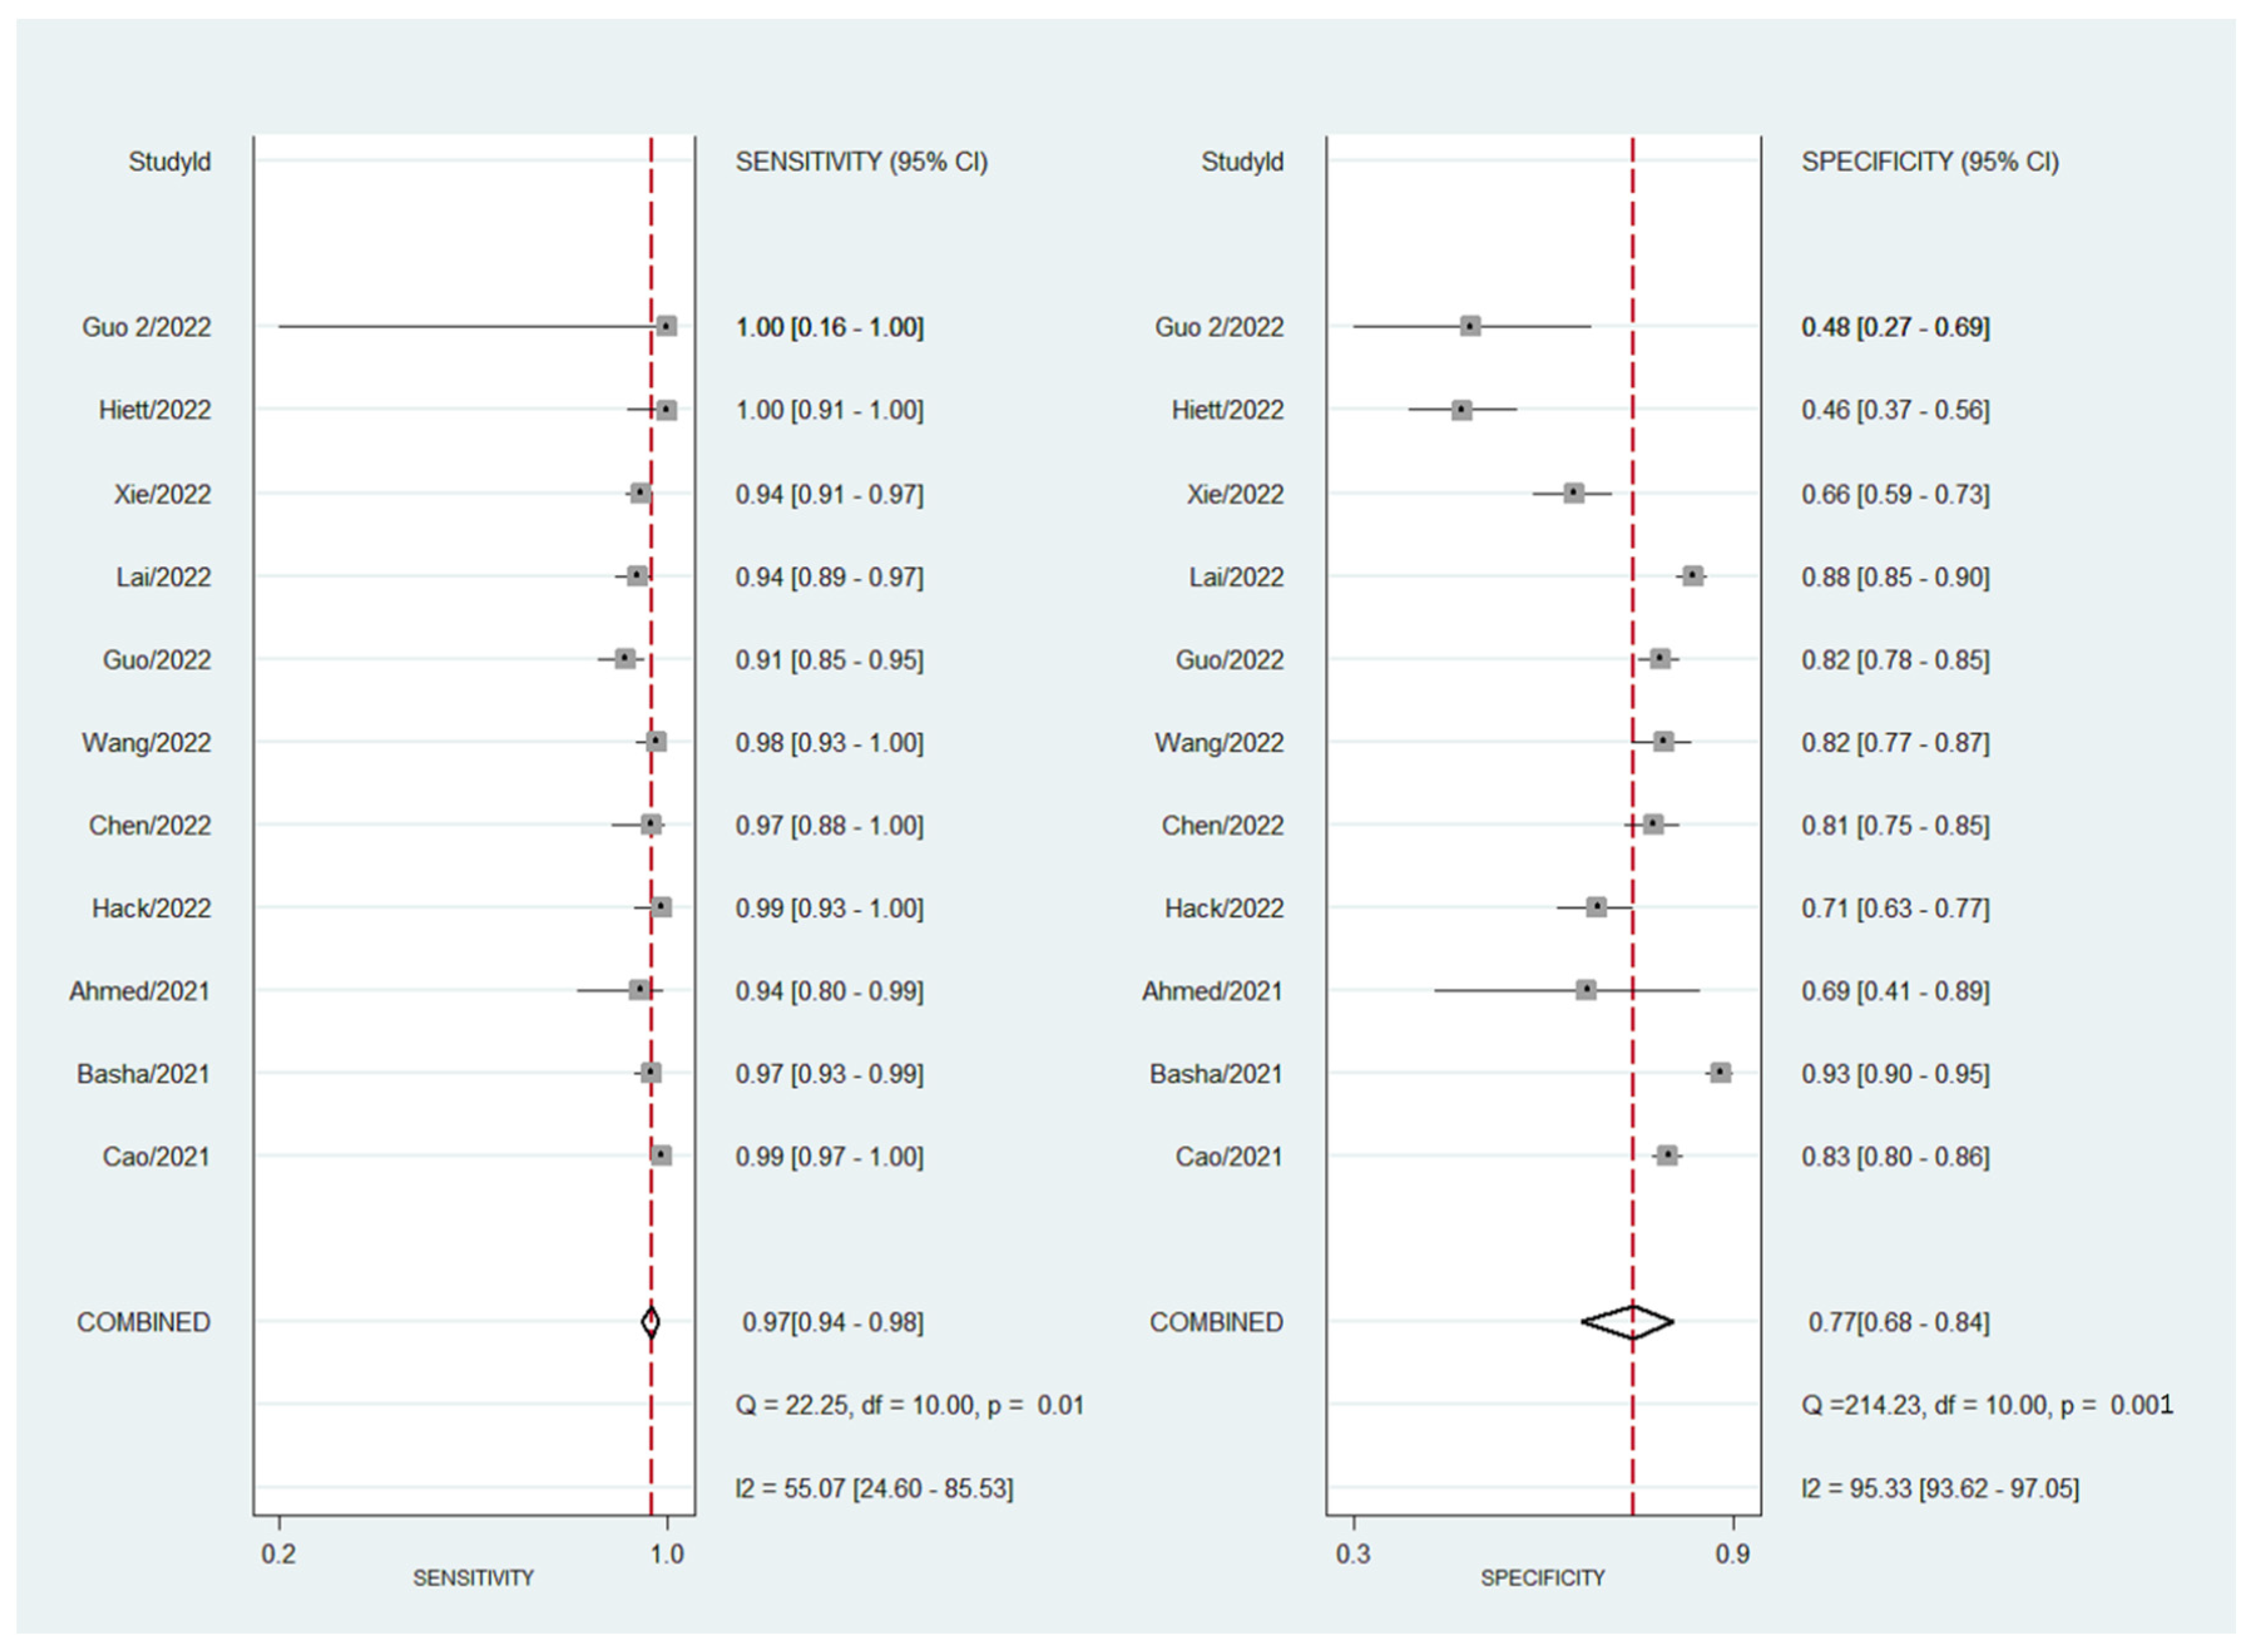
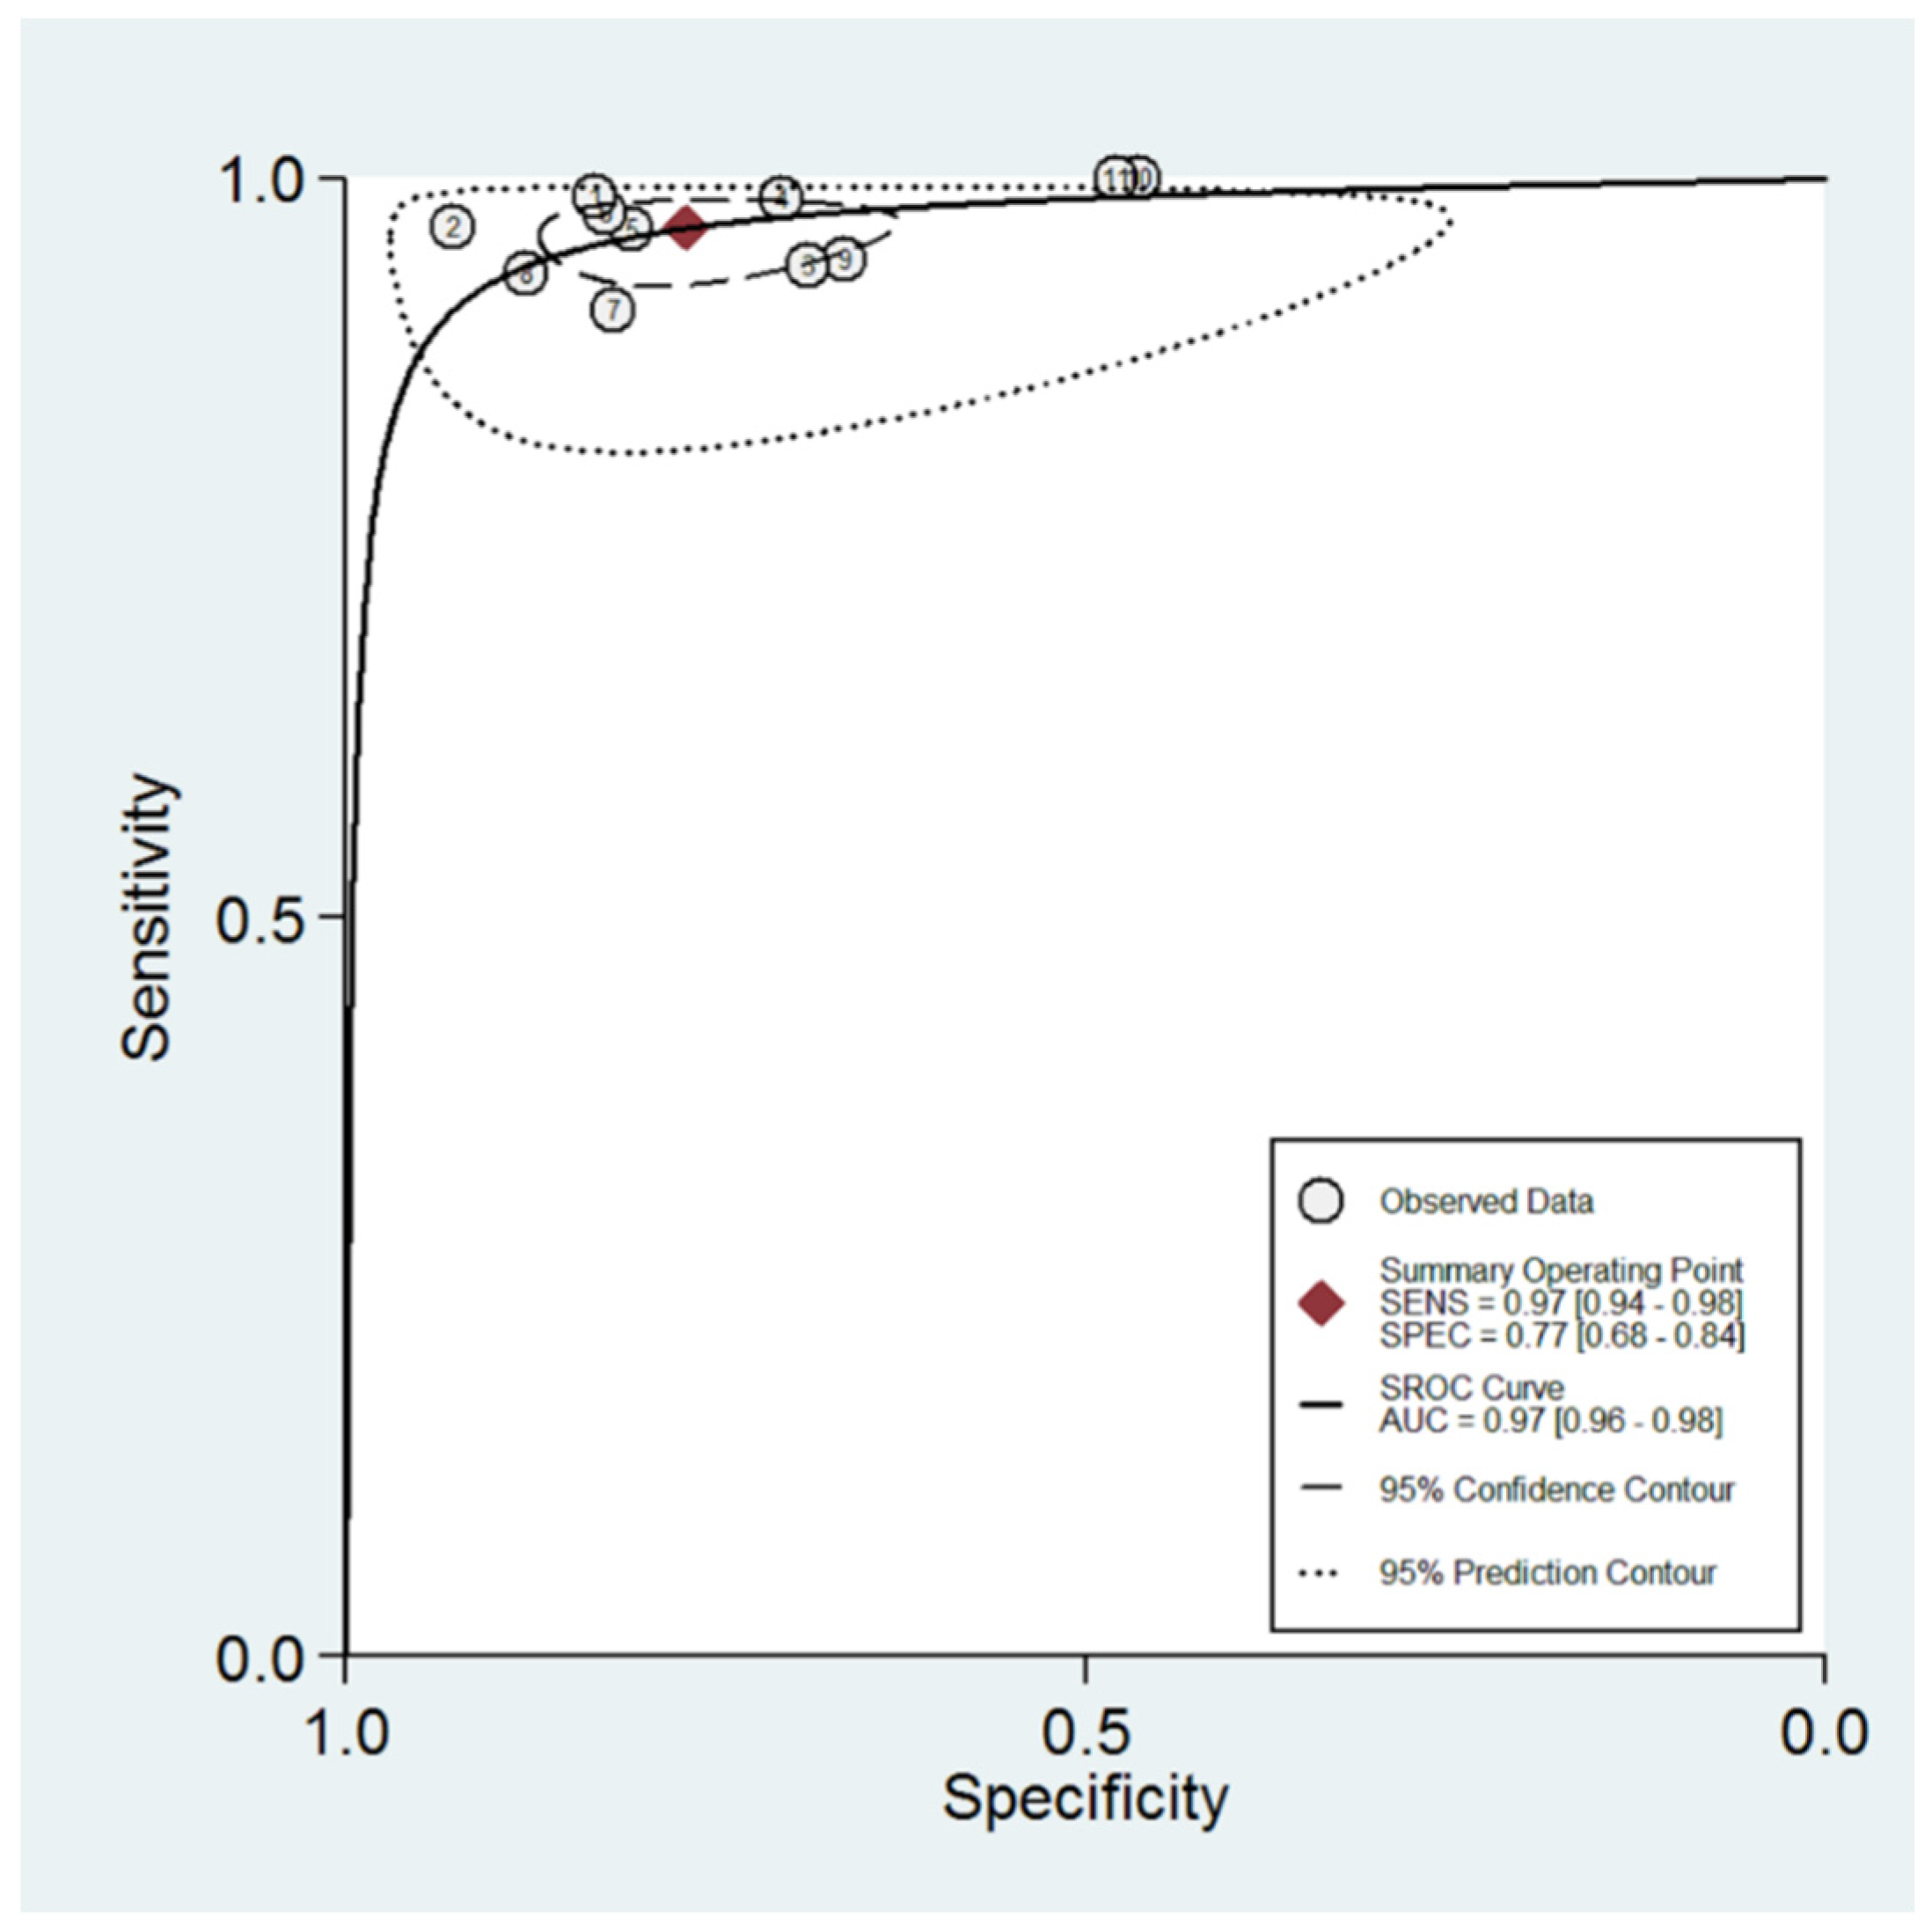
3.4. Diagnostic Performance of O-RADS System for Classifying Adnexal Masses
4. Discussion
4.1. Summary of Evidence
4.2. Limitations and Strengths
4.3. Interpretation of Results
4.4. Future Research Agenda
5. Conclusions
Author Contributions
Funding
Data Availability Statement
Conflicts of Interest
References
- Froyman, W.; Landolfo, C.; de Cock, B.; Wynants, L.; Sladkevicius, P.; Testa, A.C.; van Holsbeke, C.; Domali, E.; Fruscio, R.; Epstein, E.; et al. Risk of complications in patients with conservatively managed ovarian tumours (IOTA5): A 2-year interim analysis of a multicentre, prospective, cohort study. Lancet Oncol. 2019, 20, 448–458. [Google Scholar] [CrossRef]
- Canis, M.; Rabischong, B.; Houlle, C.; Botchorishvili, R.; Jardon, K.; Safi, A.; Wattiez, A.; Mage, G.; Pouly, J.L.; Bruhat, M.A. Laparoscopic management of adnexal masses: A gold standard? Curr. Opin. Obstet. Gynecol. 2002, 14, 423–428. [Google Scholar] [CrossRef]
- Vernooij, F.; Heintz, P.; Witteveen, E.; van der Graaf, Y. The outcomes of ovarian cancer treatment are better when provided by gynecologic oncologists and in specialized hospitals: A systematic review. Gynecol. Oncol. 2007, 105, 801–812. [Google Scholar] [CrossRef] [PubMed]
- The American College of Obstetricians and Gynecologists. American College of Obstetricians and Gynecologists’ Committee on Practice Bulletins—Gynecology. Practice Bulletin No. 174: Evaluation and Management of Adnexal Masses. Obstet. Gynecol. 2016, 128, e210–e226. [Google Scholar] [CrossRef] [PubMed]
- Alcázar, J.L.; Aubá, M.; Ruiz-Zambrana, A.; Olartecoechea, B.; Diaz, D.; Hidalgo, J.J.; Pineda, L.; Utrilla-Layna, J. Ultrasound assessment in adnexal masses: An update. Expert Rev. Obstet. Gynecol. 2012, 7, 441–449. [Google Scholar] [CrossRef]
- Van Holsbeke, C.; Daemen, A.; Yazbek, J.; Holland, T.K.; Bourne, T.; Mesens, T.; Lannoo, L.; Boes, A.-S.; Joos, A.; van de Vijver, A.; et al. Ultrasound Experience Substantially Impacts on Diagnostic Performance and Confidence when Adnexal Masses Are Classified Using Pattern Recognition. Gynecol. Obstet. Investig. 2010, 69, 160–168. [Google Scholar] [CrossRef]
- Jacobs, I.; Oram, D.; Fairbanks, J.; Turner, J.; Frost, C.; Grudzinskas, J.G. A risk of malignancy index incorporating CA 125, ultrasound and menopausal status for the accurate preoperative diagnosis of ovarian cancer. Br. J. Obstet Gynaecol. 1990, 97, 922–929. [Google Scholar] [CrossRef]
- Alcázar, J.L.; Mercé, L.T.; Laparte, C.; Jurado, M.; López-García, G. A new scoring system to differentiate benign from malignant adnexal masses. Am. J. Obstet Gynecol. 2003, 188, 685–692. [Google Scholar] [CrossRef]
- Timmerman, D.; Testa, A.C.; Bourne, T.; Ferrazzi, E.; Ameye, L.; Konstantinovic, M.L.; van Calster, B.; Collins, W.P.; Vergote, I.; van Huffel, S.; et al. Logistic regression model to distinguish between the benign and malignant adnexal mass before surgery: A multicenter study by the International Ovarian Tumor Analysis Group. J. Clin. Oncol. 2005, 23, 8794–8801. [Google Scholar] [CrossRef]
- Timmerman, D.; Testa, A.C.; Bourne, T.; Ameye, L.; Jurkovic, D.; van Holsbeke, C.; Paladini, D.; van Calster, B.; Vergote, I.; van Huffel, S.; et al. Simple ultrasound-based rules for the diagnosis of ovarian cancer. Ultrasound Obstet. Gynecol. 2008, 31, 681–690. [Google Scholar] [CrossRef]
- Chacón, E.; Dasí, J.; Caballero, C.; Alcázar, J.L. Risk of Ovarian Malignancy Algorithm versus Risk Malignancy Index-I for Preoperative Assessment of Adnexal Masses: A Systematic Review and Meta-Analysis. Gynecol. Obstet. Investig. 2019, 84, 591–598. [Google Scholar] [CrossRef] [PubMed]
- Van Calster, B.; van Hoorde, K.; Valentin, L.; Testa, A.C.; Fischerova, D.; van Holsbeke, C.; Savelli, L.; Franchi, D.; Epstein, E.; Kaijser, J.; et al. Evaluating the risk of ovarian cancer before surgery using the ADNEX model to differentiate between benign, borderline, early and advanced stage invasive, and secondary metastatic tumours: Prospective multicentre diagnostic study. BMJ 2014, 349, g5920. [Google Scholar] [CrossRef] [PubMed] [Green Version]
- Van Calster, B.; Valentin, L.; Froyman, W.; Landolfo, C.; Ceusters, J.; Testa, A.C.; Wynants, L.; Sladkevicius, P.; van Holsbeke, C.; Domali, E.; et al. Validation of models to diagnose ovarian cancer in patients managed surgically or conservatively: Multicentre cohort study. BMJ 2020, 370, m2614. [Google Scholar] [CrossRef] [PubMed]
- Le, T.; Al Fayadh, R.; Menard, C.; Hicks-Boucher, W.; Faught, W.; Hopkins, L.; Fung-Kee-Fung, M. Variations in Ultrasound Reporting on Patients Referred for Investigation of Ovarian Masses. J. Obstet. Gynaecol. Can. 2008, 30, 902–906. [Google Scholar] [CrossRef]
- Andreotti, R.F.; Timmerman, D.; Strachowski, L.M.; Froyman, W.; Benacerraf, B.R.; Bennett, G.L.; Bourne, T.; Brown, D.L.; Coleman, B.G.; Frates, M.C.; et al. O-RADS US Risk Stratification and Management System: A Consensus Guideline from the ACR Ovarian-Adnexal Reporting and Data System Committee. Radiology 2020, 294, 168–185. [Google Scholar] [CrossRef] [Green Version]
- Page, M.J.; McKenzie, J.E.; Bossuyt, P.M.; Boutron, I.; Hoffmann, T.C.; Mulrow, C.D.; Shamseer, L.; Tetzlaff, J.M.; Akl, E.A.; Brennan, S.E.; et al. PRISMA 2020 explanation and elaboration: Updated guidance and exemplars for reporting systematic reviews. BMJ 2021, 372, n160. [Google Scholar] [CrossRef]
- Sotiriadis, A.; Papatheodorou, S.I.; Martins, W.P. Synthesizing Evidence from Diagnostic Accuracy TEsts: The SEDATE guideline. Ultrasound Obstet. Gynecol. 2016, 47, 386–395. [Google Scholar] [CrossRef] [Green Version]
- Whiting, P.F.; Rutjes, A.W.; Westwood, M.E.; Mallett, S.; Deeks, J.J.; Reitsma, J.B.; Leeflang, M.M.; Sterne, J.A.; Bossuyt, P.M.; QUADAS-2 Group. QUADAS-2: A revised tool for the quality assessment of diagnostic accuracy studies. Ann. Intern. Med. 2011, 155, 529–536. [Google Scholar] [CrossRef]
- Deeks, J.J.; Altman, D.G. Diagnostic tests 4: Likelihood ratios. BMJ 2004, 329, 168–169. [Google Scholar] [CrossRef] [Green Version]
- Higgins, J.P.; Thompson, S.G.; Deeks, J.J.; Altman, D.G. Measuring inconsistency in meta-analyses. BMJ 2003, 327, 557–560. [Google Scholar] [CrossRef] [Green Version]
- Deeks, J.J.; Macaskill, P.; Irwig, L. The performance of tests of publication bias and other sample size effects in systematic reviews of diagnostic test accuracy was assessed. J. Clin. Epidemiol. 2005, 58, 882–893. [Google Scholar] [CrossRef] [PubMed]
- Basha, M.A.A.; Metwally, M.I.; Gamil, S.A.; Khater, H.M.; Aly, S.A.; El Sammak, A.A.; Zaitoun, M.M.A.; Khattab, E.M.; Azmy, T.M.; Alayouty, N.A.; et al. Comparison of O-RADS, GI-RADS, and IOTA simple rules regarding malignancy rate, validity, and reliability for diagnosis of adnexal masses. Eur. Radiol. 2021, 31, 674–684. [Google Scholar] [CrossRef] [PubMed]
- Cao, L.; Wei, M.; Liu, Y.; Fu, J.; Zhang, H.; Huang, J.; Pei, X.; Zhou, J. Validation of American College of Radiology Ovarian-Adnexal Reporting and Data System Ultrasound (O-RADS US): Analysis on 1054 adnexal masses. Gynecol. Oncol. 2021, 162, 107–112. [Google Scholar] [CrossRef] [PubMed]
- Hiett, A.K.; Sonek, J.D.; Guy, M.; Reid, T.J. Performance of IOTA Simple Rules, Simple Rules risk assessment, ADNEX model and O-RADS in differentiating between benign and malignant adnexal lesions in North American women. Ultrasound Obstet. Gynecol. 2022, 59, 668–676. [Google Scholar] [CrossRef] [PubMed]
- Lai, H.W.; Lyu, G.R.; Kang, Z.; Li, L.Y.; Zhang, Y.; Huang, Y.J. Comparison of O-RADS, GI-RADS, and ADNEX for Diagnosis of Adnexal Masses: An External Validation Study Conducted by Junior Sonologists. J. Ultrasound Med. 2022, 41, 1497–1507. [Google Scholar] [CrossRef] [PubMed]
- Xie, W.T.; Wang, Y.Q.; Xiang, Z.S.; Du, Z.S.; Huang, S.X.; Chen, Y.J.; Tang, L.N. Efficacy of IOTA simple rules, O-RADS, and CA125 to distinguish benign and malignant adnexal masses. J. Ovarian Res. 2022, 15, 15. [Google Scholar] [CrossRef] [PubMed]
- Guo, Y.; Zhao, B.; Zhou, S.; Wen, L.; Liu, J.; Fu, Y.; Xu, F.; Liu, M. A comparison of the diagnostic performance of the O-RADS, RMI4, IOTA LR2, and IOTA SR systems by senior and junior doctors. Ultrasonography 2022. [Google Scholar] [CrossRef] [PubMed]
- Ahmed, H.A.K.; Mustafa, F.A. The Usefulness of The Ultrasound Diagnosis of Ovarian Masses Based on the O-RADS Classification System. AIMJ 2021, 2, 1–6. [Google Scholar] [CrossRef]
- Wang, R.; Wang, X.; Yang, Z. Comparison of O-RADS Classification, GI-RADS Classification and Simple Rules in the Diagnosis of Adnexal Tumors. Adv. Clin. Med. 2022, 12, 2171–2177. [Google Scholar] [CrossRef]
- Hack, K.; Gandhi, N.; Bouchard-Fortier, G.; Chawla, T.P.; Ferguson, S.E.; Li, S.; Kahn, D.; Tyrrell, P.N.; Glanc, P. External Validation of O-RADS US Risk Stratification and Management System. Radiology 2022, 304, 114–120. [Google Scholar] [CrossRef]
- Guo, Y.; Zhou, S.; Zhao, B.; Wen, L.; Liu, M. Ultrasound Findings and O-RADS Malignancy Risk Stratification of Ovarian Collision Tumors. J. Ultrasound Med. 2021. [Google Scholar] [CrossRef] [PubMed]
- Chen, G.-Y.; Hsu, T.-F.; Chan, I.-S.; Liu, C.-H.; Chao, W.-T.; Shih, Y.-C.; Jiang, L.-Y.; Chang, Y.-H.; Wang, P.-H.; Chen, Y.-J. Comparison of the O-RADS and ADNEX models regarding malignancy rate and validity in evaluating adnexal lesions. Eur. Radiol. 2022. [Google Scholar] [CrossRef] [PubMed]
- Meys, E.; Kaijser, J.; Kruitwagen, R.; Slangen, B.; van Calster, B.; Aertgeerts, B.; Verbakel, J.; Timmerman, D.; van Gorp, T. Subjective assessment versus ultrasound models to diagnose ovarian cancer: A systematic review and meta-analysis. Eur. J. Cancer 2016, 58, 17–29. [Google Scholar] [CrossRef] [PubMed]
- Kaijser, J.; Sayasneh, A.; van Hoorde, K.; Ghaem-Maghami, S.; Bourne, T.; Timmerman, D.; van Calster, B. Presurgical diagnosis of adnexal tumours using mathematical models and scoring systems: A systematic review and meta-analysis. Hum. Reprod. Updat. 2014, 20, 449–462. [Google Scholar] [CrossRef] [Green Version]
- Ilundain, A.; Salas, A.; Chacon, E.; Manzour, N.; Alcazar, J.L. IOTA Simple Rules for the differential diagnosis of ovarian adnexal masses: Systematic review and meta-analysis. Prog. Obstet. Ginecol. 2018, 61, 390–400. [Google Scholar]
- Huang, X.; Wang, Z.; Zhang, M.; Luo, H. Diagnostic Accuracy of the ADNEX Model for Ovarian Cancer at the 15% Cut-Off Value: A Systematic Review and Meta-Analysis. Front. Oncol. 2021, 11, 684257. [Google Scholar] [CrossRef]
- Yue, X.; Zhong, L.; Wang, Y.; Zhang, C.; Chen, X.; Wang, S.; Hu, J.; Hu, J.; Wang, C.; Liu, X. Value of Assessment of Different Neoplasias in the Adnexa in the Differential Diagnosis of Malignant Ovarian Tumor and Benign Ovarian Tumor: A Meta-analysis. Ultrasound Med. Biol. 2022, 48, 730–742. [Google Scholar] [CrossRef]
- Westwood, M.; Ramaekers, B.; Lang, S.; Grimm, S.; Deshpande, S.; de Kock, S.; Armstrong, N.; Joore, M.; Kleijnen, J. Risk scores to guide referral decisions for people with suspected ovarian cancer in secondary care: A systematic review and cost-effectiveness analysis. Health Technol. Assess. 2018, 22, 1–264. [Google Scholar] [CrossRef]
- Timmerman, D.; Planchamp, F.; Bourne, T.; Landolfo, C.; du Bois, A.; Chiva, L.; Cibula, D.; Concin, N.; Fischerova, D.; Froyman, W.; et al. ESGO/ISUOG/IOTA/ESGE Consensus Statement on pre-operative diagnosis of ovarian tumors. Int. J. Gynecol. Cancer 2021, 31, 961–982. [Google Scholar] [CrossRef]


| Author | Year | Country | Number of Patients | Number of Masses | Malignant Cases | Patients’ Mean Age (Years) Benign Tumors | Patients’ Mean Age (Years) Malignant Tumors | Number of Examiners | Study’s Design | Index Test | Reference Test | Time Elapsed from US to Surgery | Examiner Blinded |
|---|---|---|---|---|---|---|---|---|---|---|---|---|---|
| Basha [22] | 2021 | Egypt | 609 | 647 | 178 | NA | NA | Five | Retrospective | O-RADS IOTA features | Histology/Follow-up | NA | Yes |
| Cao [23] | 2021 | China | 1035 | 1054 | 304 | 37 | 53 | Two | Retrospective | O-RADS IOTA features | Histology | NA | Yes |
| Ahmed [28] | 2021 | Egypt | 50 | 50 | 35 | NA | NA | One | Prospective | O-RADS IOTA features | Histology/Follow-up | NA | Yes |
| Hiett [24] | 2022 | USA | 150 | 150 | 40 | 47 | 48 | Two | Retrospective | O-RADS ADNEX model | Histology | <180 days | Yes |
| Lai [25] | 2022 | China | 734 | 734 | 170 | 35 | 48 | Two | Retrospective | O-RADS IOTA features | Histology | <120 days | Yes |
| Xie [26] | 2022 | China | 453 | 453 | 269 | 45 | 51 | Two | Retrospective | O-RADS IOTA features | Histology | <120 days | Yes |
| Guo [31] | 2022 | China | 25 | 25 | 2 | NA | NA | Two | Retrospective | O-RADS IOTA features | Histology | <90 days | Yes |
| Guo [27] | 2022 | China | 575 | 592 | 145 | 37 | 46 | Two | Retrospective | O-RADS IOTA features | Histology/Follow-up | <30 days | Yes |
| Wang [29] | 2022 | China | 345 | 345 | 128 | 40 | 52 | Two | NA | O-RADS IOTA features | Histology | NA | NA |
| Hack [30] | 2022 | USA | 227 | 262 | 75 | NA | NA | Two | Retrospective | O-RADS IOTA features | Histology/Follow-up | NA | Yes |
| Chen [32] | 2022 | Taiwan | 322 | 322 | 58 | NA | NA | Two | Retrospective | O-RADS IOTA features | Histology | <120 days | Yes |
| Author | Year | Number of Masses | Malignant Cases | O-RADS 1–2 | O-RADS 3 | O-RADS 4 | O-RADS 5 | ||||
|---|---|---|---|---|---|---|---|---|---|---|---|
| Benign | Malignant | Benign | Malignant | Benign | Malignant | Benign | Malignant | ||||
| Basha [22] | 2021 | 647 | 178 | 261 | 1 | 174 | 5 | 26 | 11 | 8 | 161 |
| Cao [23] | 2021 | 1054 | 304 | 445 | 1 | 179 | 3 | 97 | 51 | 29 | 249 |
| Ahmed [28] | 2021 | 50 | 35 | 0 | 0 | 11 | 2 | 3 | 15 | 2 | 19 |
| Hiett [24] | 2022 | 150 | 40 | 17 | 0 | 34 | 0 | 52 | 14 | 7 | 26 |
| Lai [25] | 2022 | 734 | 170 | 364 | 5 | 131 | 6 | 65 | 90 | 4 | 69 |
| Xie [26] | 2022 | 453 | 269 | 74 | 4 | 48 | 11 | 52 | 82 | 10 | 172 |
| Guo [31] | 2022 | 25 | 2 | 7 | 0 | 4 | 0 | 13 | 1 | 1 | 1 |
| Guo [27] | 2022 | 592 | 155 | 294 | 6 | 72 | 7 | 73 | 80 | 8 | 52 |
| Wang [29] | 2022 | 345 | 128 | 93 | 1 | 86 | 2 | 27 | 44 | 11 | 81 |
| Hack [30] | 2022 | 262 | 75 | 100 | 0 | 31 | 1 | 41 | 22 | 15 | 52 |
| Chen [32] | 2022 | 322 | 58 | 149 | 0 | 66 | 2 | 69 | 26 | 38 | 30 |
| Histology | O-RADS 2 | O-RADS 3 | O-RADS 4 | O-RADS 5 | Total |
|---|---|---|---|---|---|
| Benign | |||||
| Functional cyst | 33 | 7 | 6 | 1 | 47 |
| Hemorrhagic cyst | 5 | 4 | 3 | 0 | 12 |
| Endometrioma | 312 | 80 | 24 | 2 | 418 |
| Dermoid cyst | 320 | 98 | 39 | 4 | 461 |
| Serous/mucinous cystadenoma | 114 | 115 | 87 | 6 | 322 |
| Para-ovarian cyst | 7 | 2 | 1 | 0 | 10 |
| Hydrosalpinx/TOA | 20 | 15 | 17 | 11 | 63 |
| Fibroma/fibrothecoma/thecoma | 4 | 14 | 23 | 6 | 47 |
| Struma ovarii | 0 | 2 | 3 | 0 | 5 |
| Other benign lesions | 14 | 7 | 9 | 8 | 38 |
| Malignant | |||||
| Borderline tumor | 7 | 8 | 63 | 35 | 113 |
| Epithelial carcinoma | 0 | 0 | 69 | 245 | 314 |
| Germ cell tumor | 0 | 0 | 4 | 4 | 8 |
| Sex-cord tumor | 0 | 0 | 6 | 7 | 13 |
| Metastatic tumor | 0 | 0 | 10 | 27 | 37 |
| Other malignant lesions | 0 | 0 | 5 | 27 | 32 |
| Total | 839 | 357 | 383 | 385 | 1964 |
Publisher’s Note: MDPI stays neutral with regard to jurisdictional claims in published maps and institutional affiliations. |
© 2022 by the authors. Licensee MDPI, Basel, Switzerland. This article is an open access article distributed under the terms and conditions of the Creative Commons Attribution (CC BY) license (https://creativecommons.org/licenses/by/4.0/).
Share and Cite
Vara, J.; Manzour, N.; Chacón, E.; López-Picazo, A.; Linares, M.; Pascual, M.Á.; Guerriero, S.; Alcázar, J.L. Ovarian Adnexal Reporting Data System (O-RADS) for Classifying Adnexal Masses: A Systematic Review and Meta-Analysis. Cancers 2022, 14, 3151. https://doi.org/10.3390/cancers14133151
Vara J, Manzour N, Chacón E, López-Picazo A, Linares M, Pascual MÁ, Guerriero S, Alcázar JL. Ovarian Adnexal Reporting Data System (O-RADS) for Classifying Adnexal Masses: A Systematic Review and Meta-Analysis. Cancers. 2022; 14(13):3151. https://doi.org/10.3390/cancers14133151
Chicago/Turabian StyleVara, Julio, Nabil Manzour, Enrique Chacón, Ana López-Picazo, Marta Linares, Maria Ángela Pascual, Stefano Guerriero, and Juan Luis Alcázar. 2022. "Ovarian Adnexal Reporting Data System (O-RADS) for Classifying Adnexal Masses: A Systematic Review and Meta-Analysis" Cancers 14, no. 13: 3151. https://doi.org/10.3390/cancers14133151