
Hypoxia Selectively Increases a SMAD3 Signaling Axis to Promote Cancer Cell Invasion


Abstract
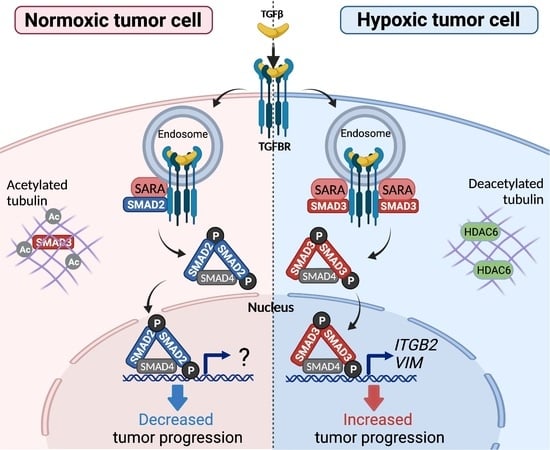
:Simple Summary
Abstract
1. Introduction
2. Materials and Methods
2.1. Plasmid DNA
2.2. Antibodies and Reagents
2.3. Cell Culture and Treatment
2.4. Immunofluorescence Staining and Analysis
2.5. Chorioallantoic Membrane (CAM) Xenograft Tumor Assay
2.6. Xenograft Immunofluorescence and Quantitation
2.7. Genomic DNA Extraction and Alu-Repeats qPCR
2.8. Cell Transfection and Transduction
2.9. Invadopodia Assay
2.10. Mutagenesis
2.11. RNA Extraction, Reverse Transcription and Real-time qPCR
2.12. Western Blotting and Co-Immunoprecipitation
2.13. RT2 Profiler PCR Array
2.14. TCGA Data Analysis
2.15. Statistical Analysis
3. Results
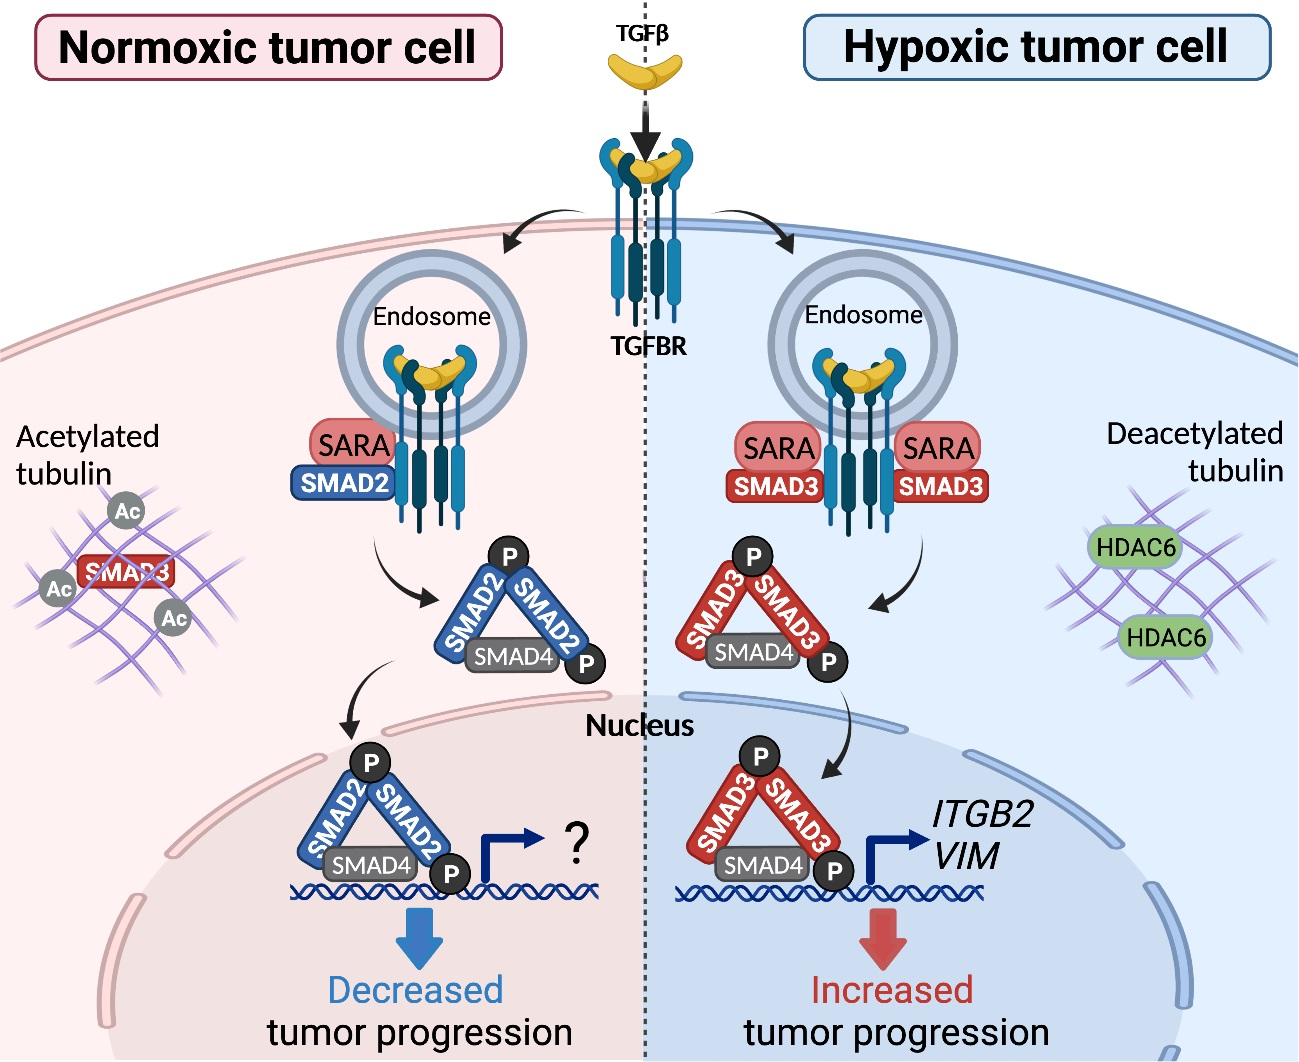
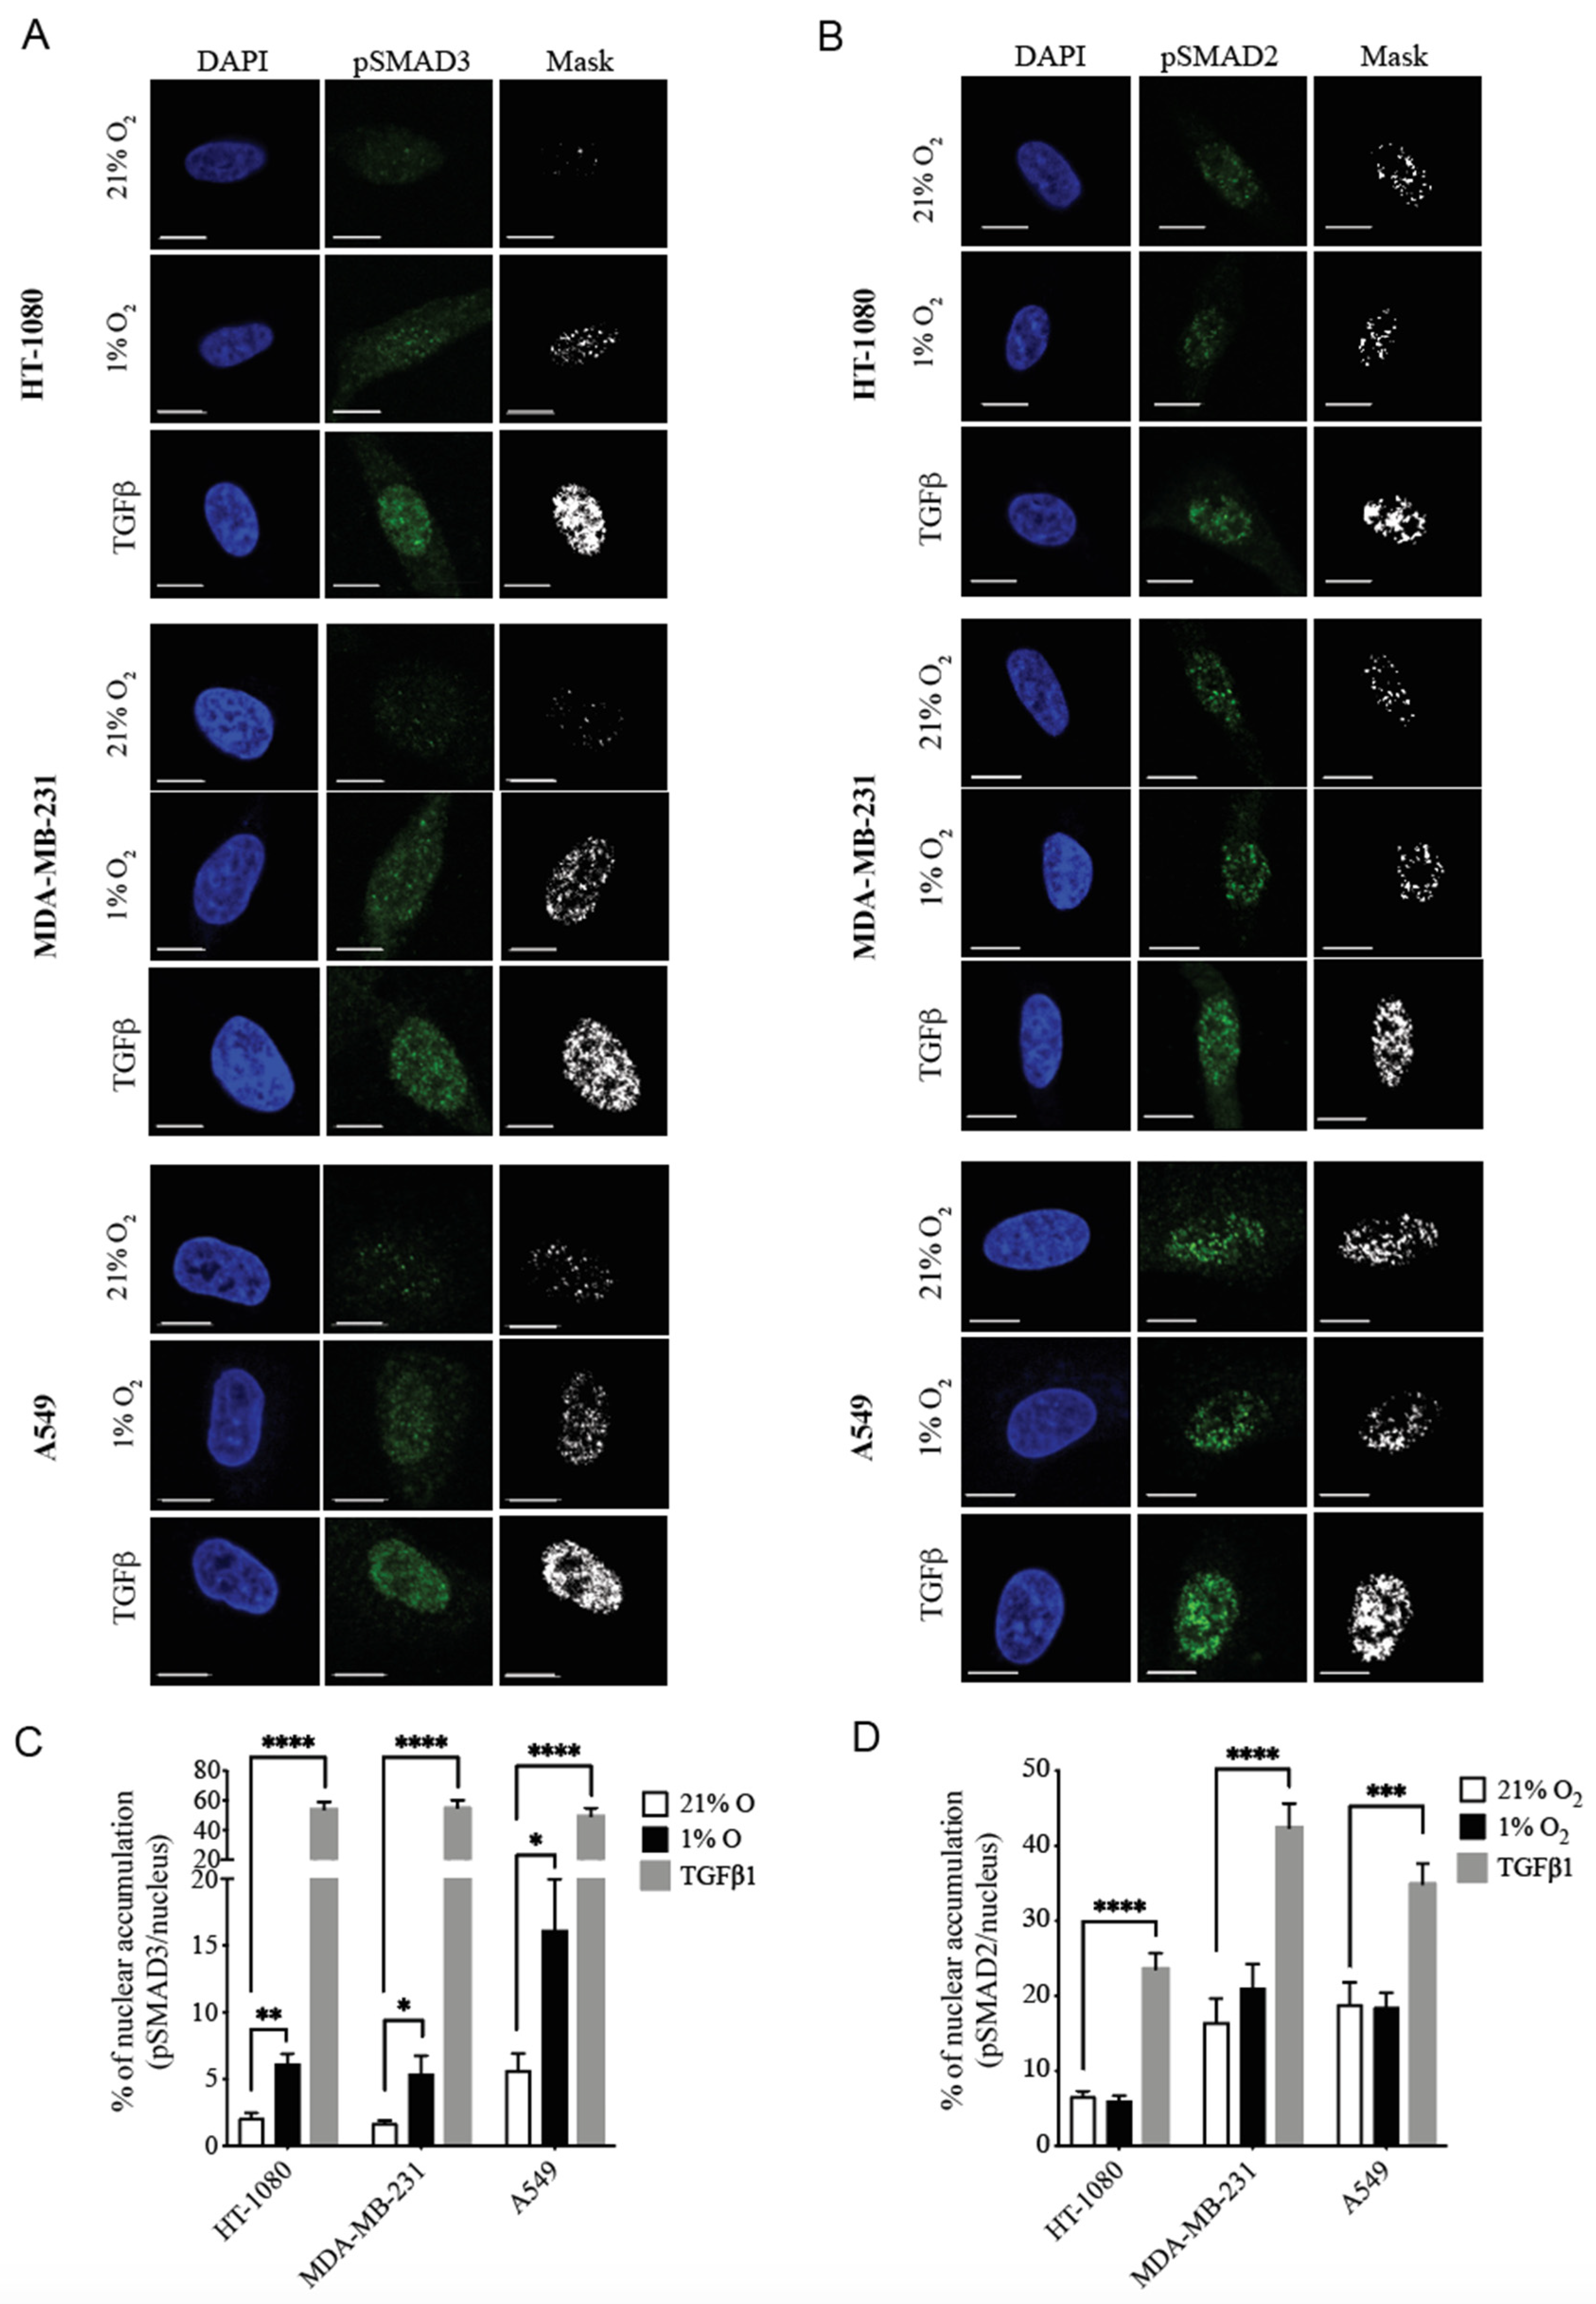
3.1. Hypoxia Selectively Increases pSMAD3 Levels in Different Types of Cancer
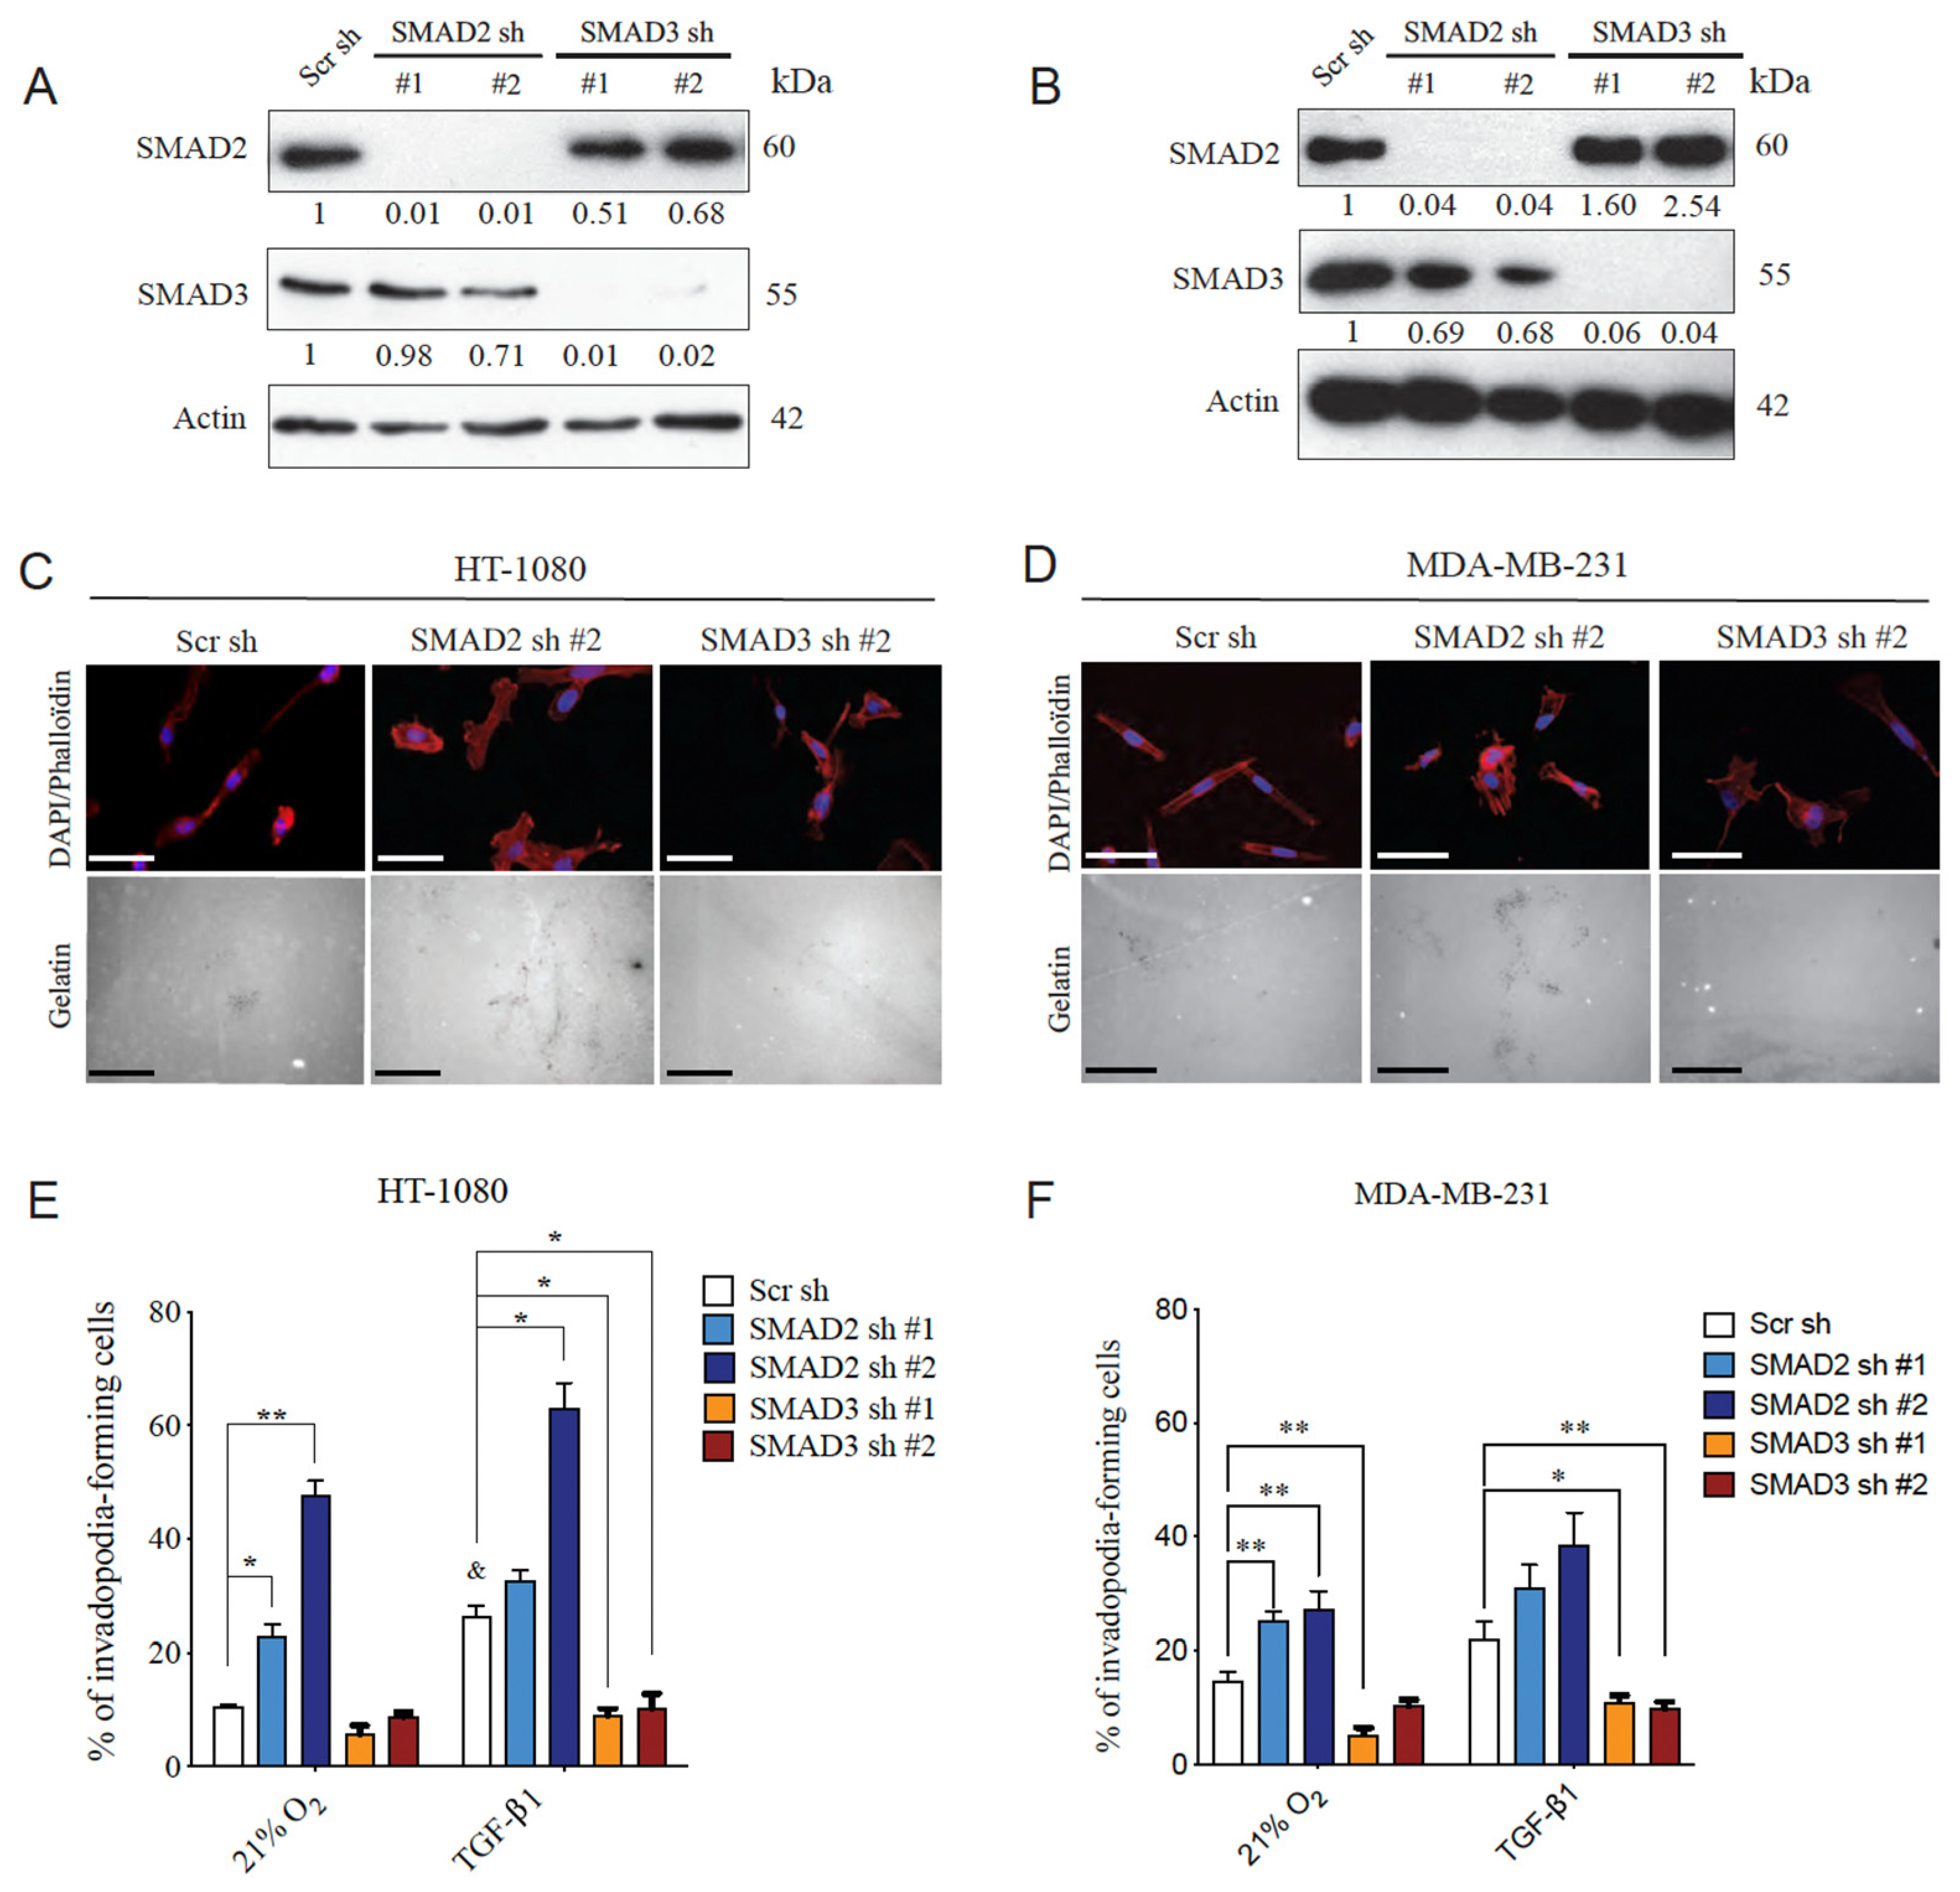
3.2. SMAD2 and SMAD3 Display Opposing Roles in Cancer Cell Invasion
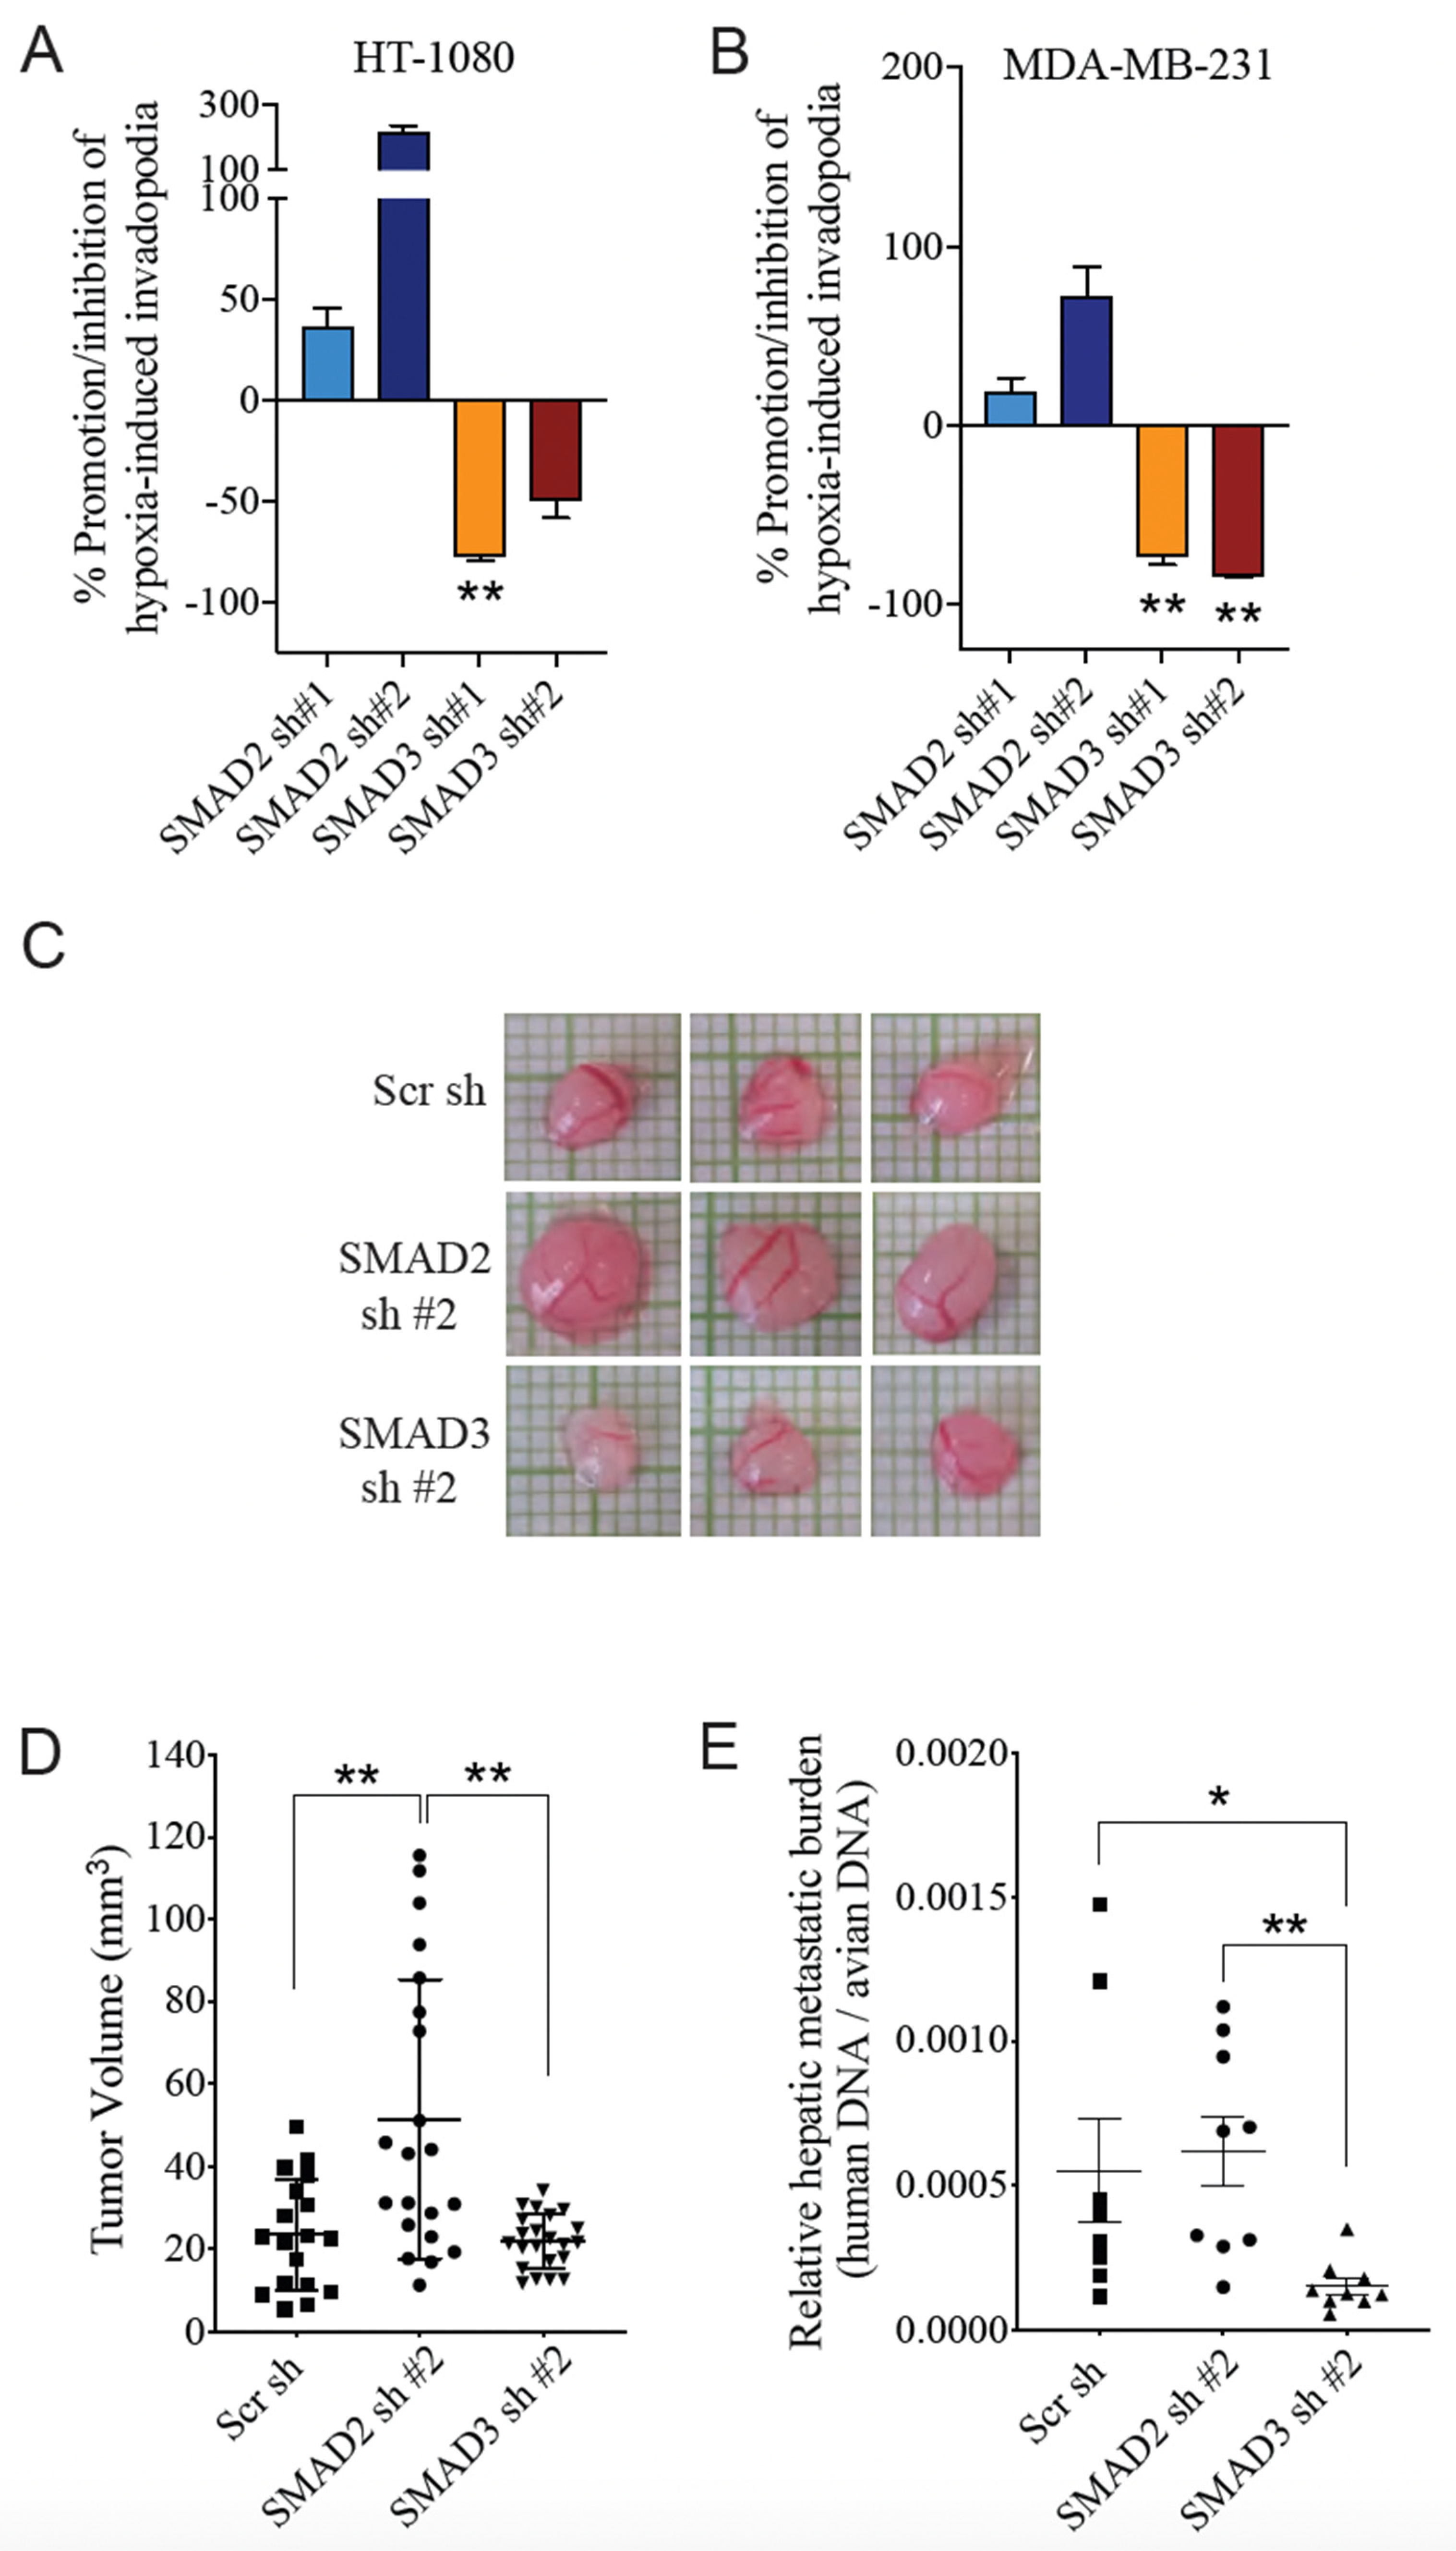
3.3. SMAD3 Is Essential for Hypoxia-Induced Cell Invasion and Tumor Progression
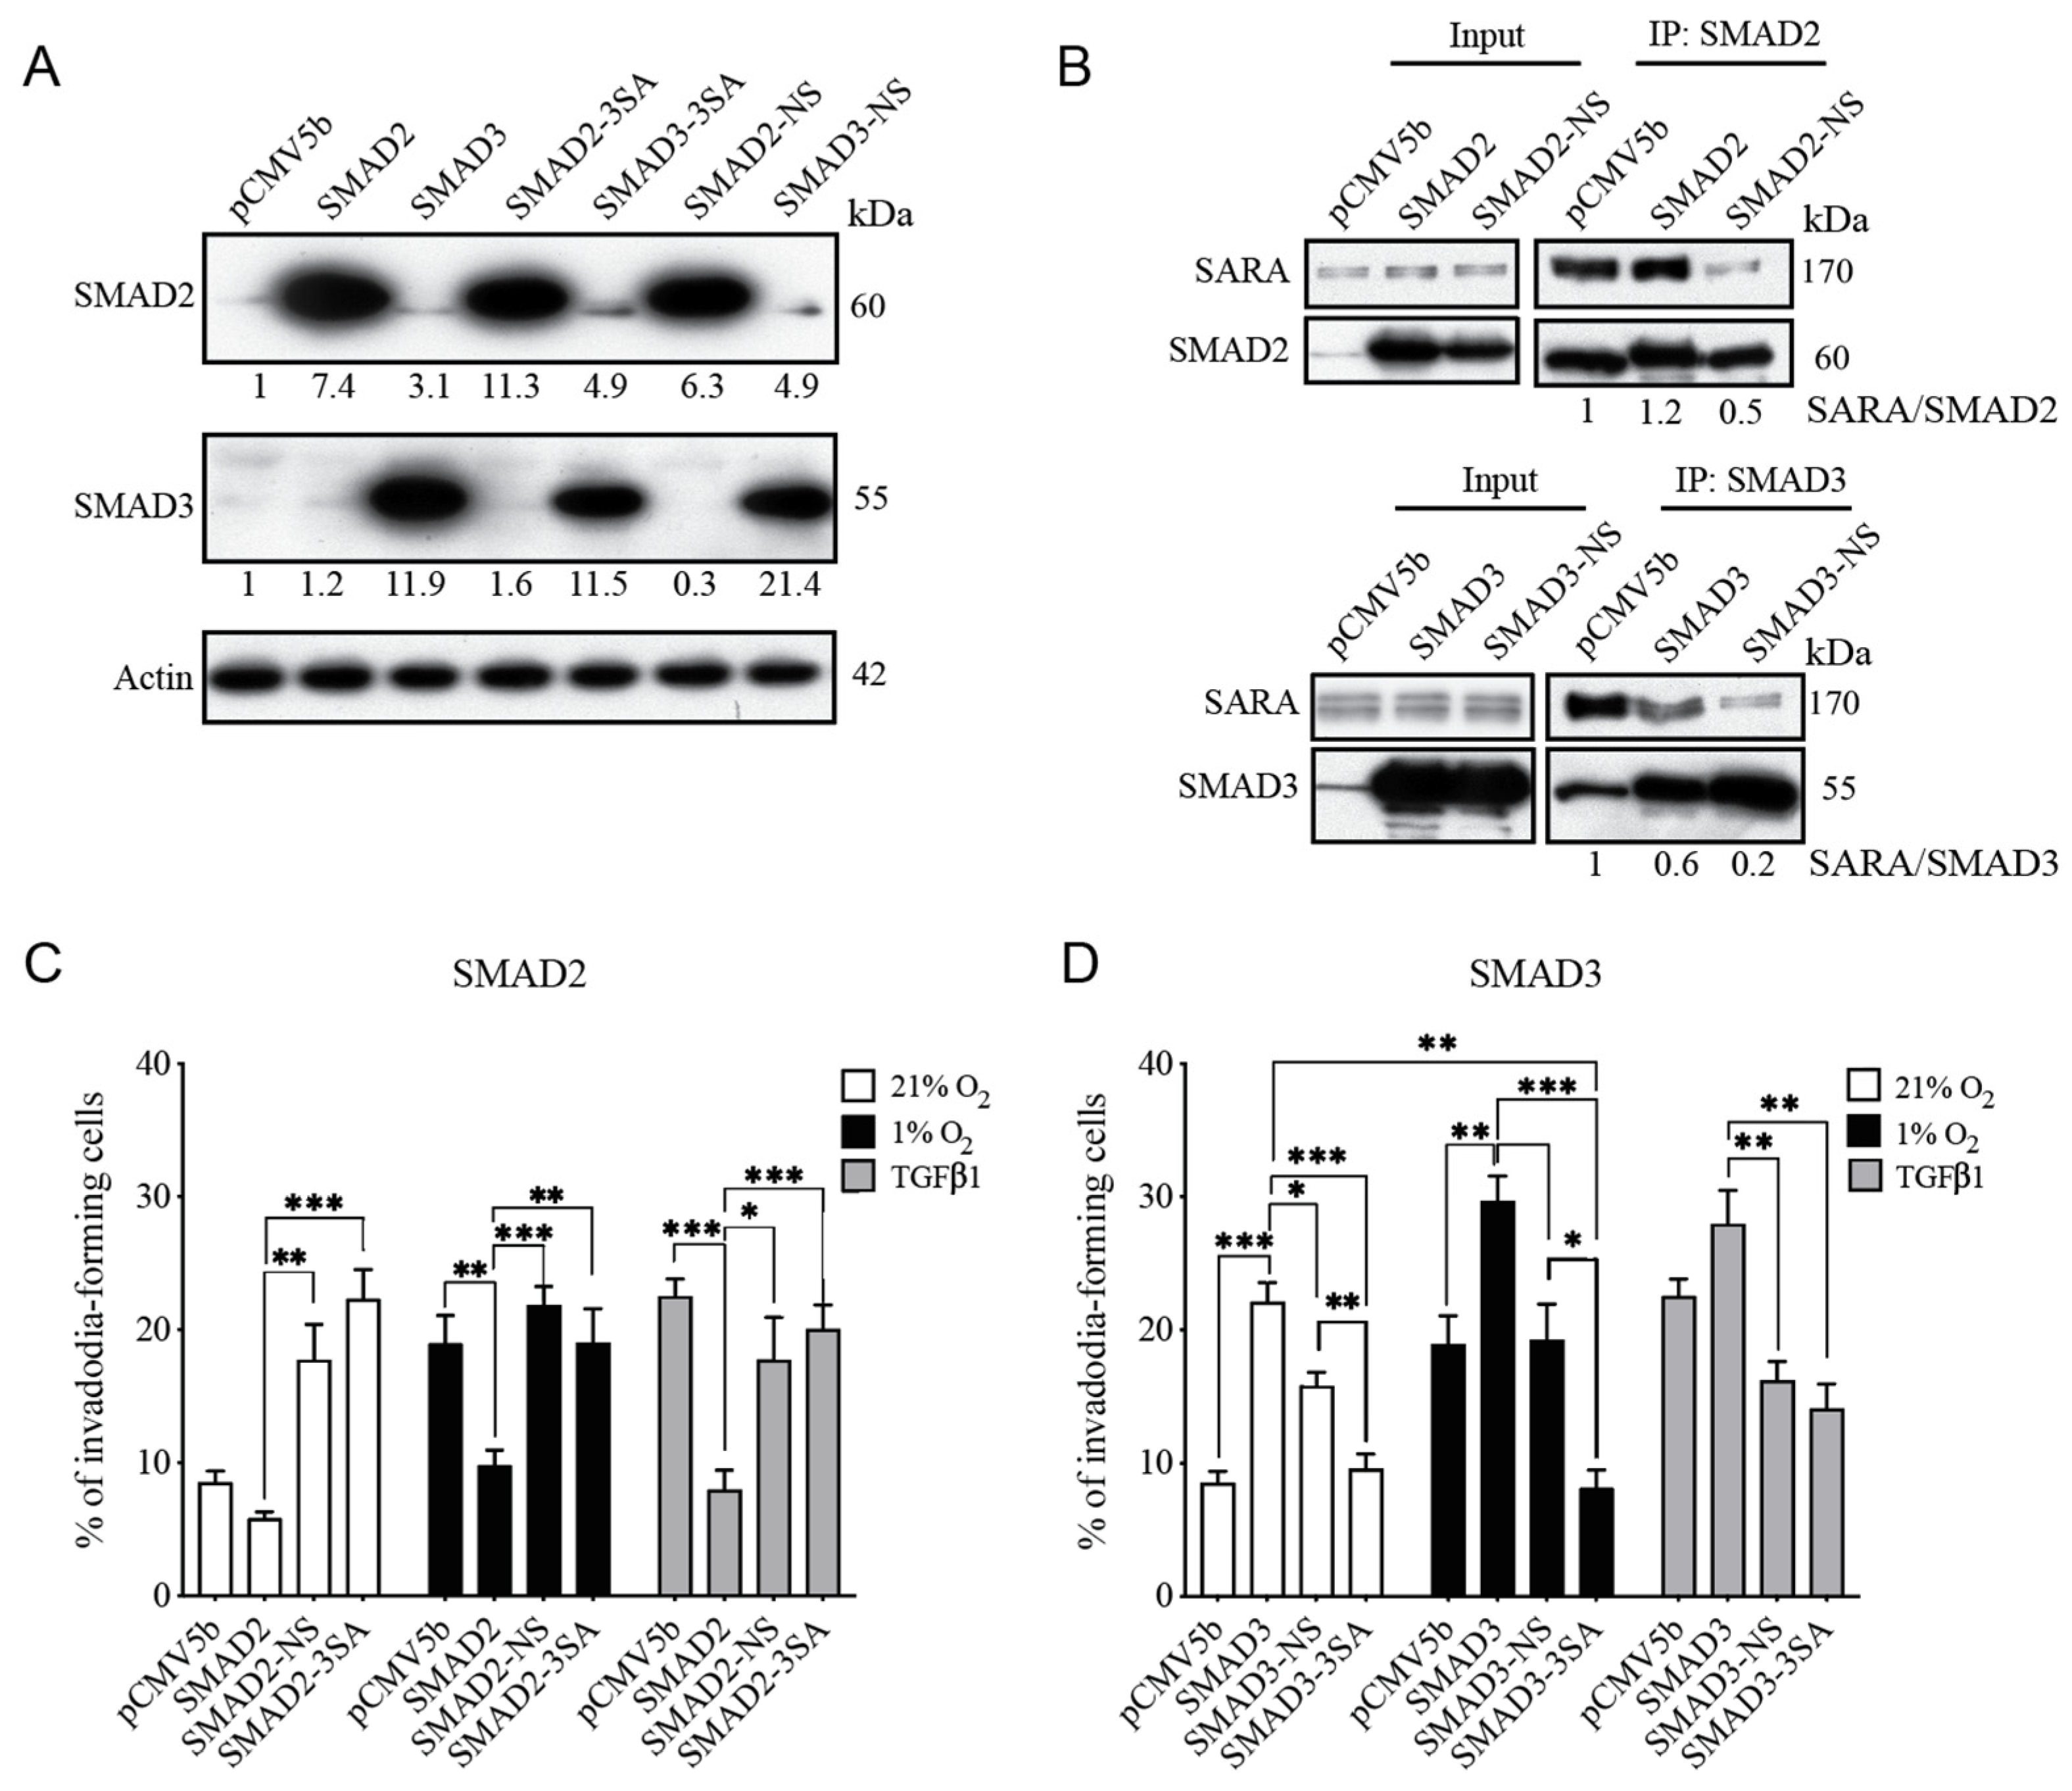
3.4. SMAD3-SARA Binding Is Important for Hypoxia-Induced Invadopodia Production
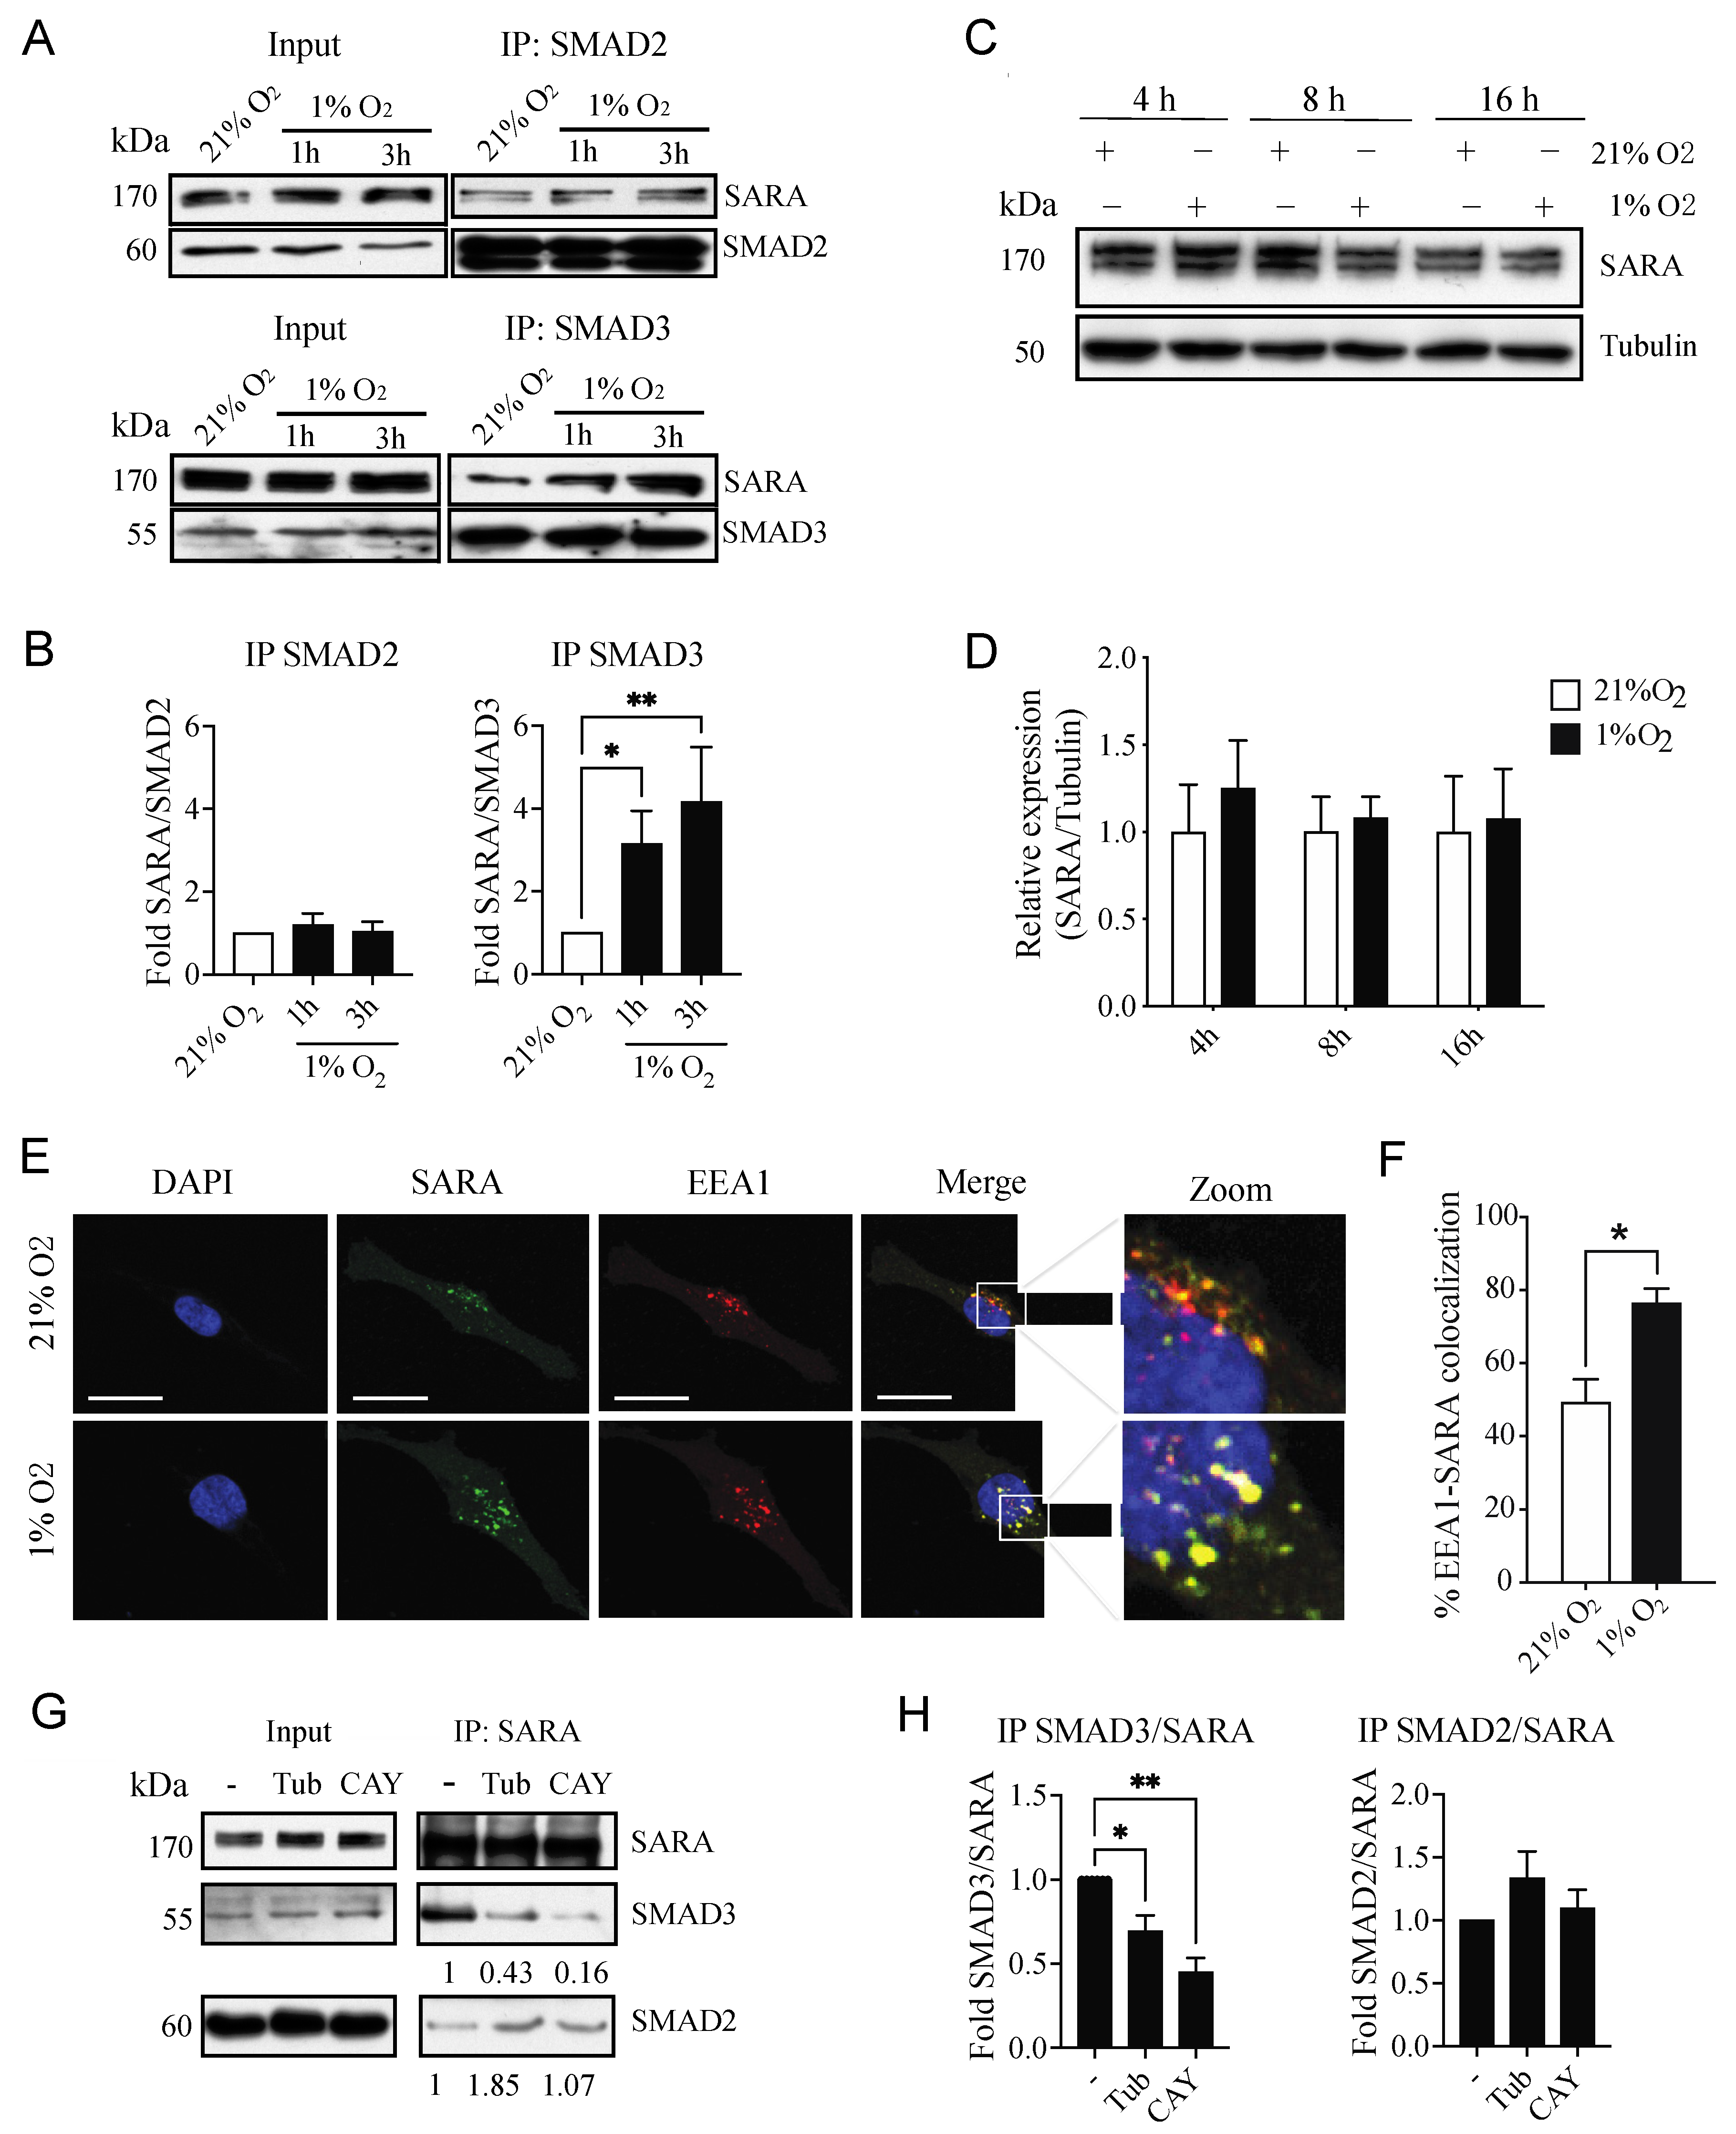
3.5. Hypoxia Selectively Increases the Interaction between SARA and SMAD3, an Event Linked to Increased SMAD3 Bioavailability
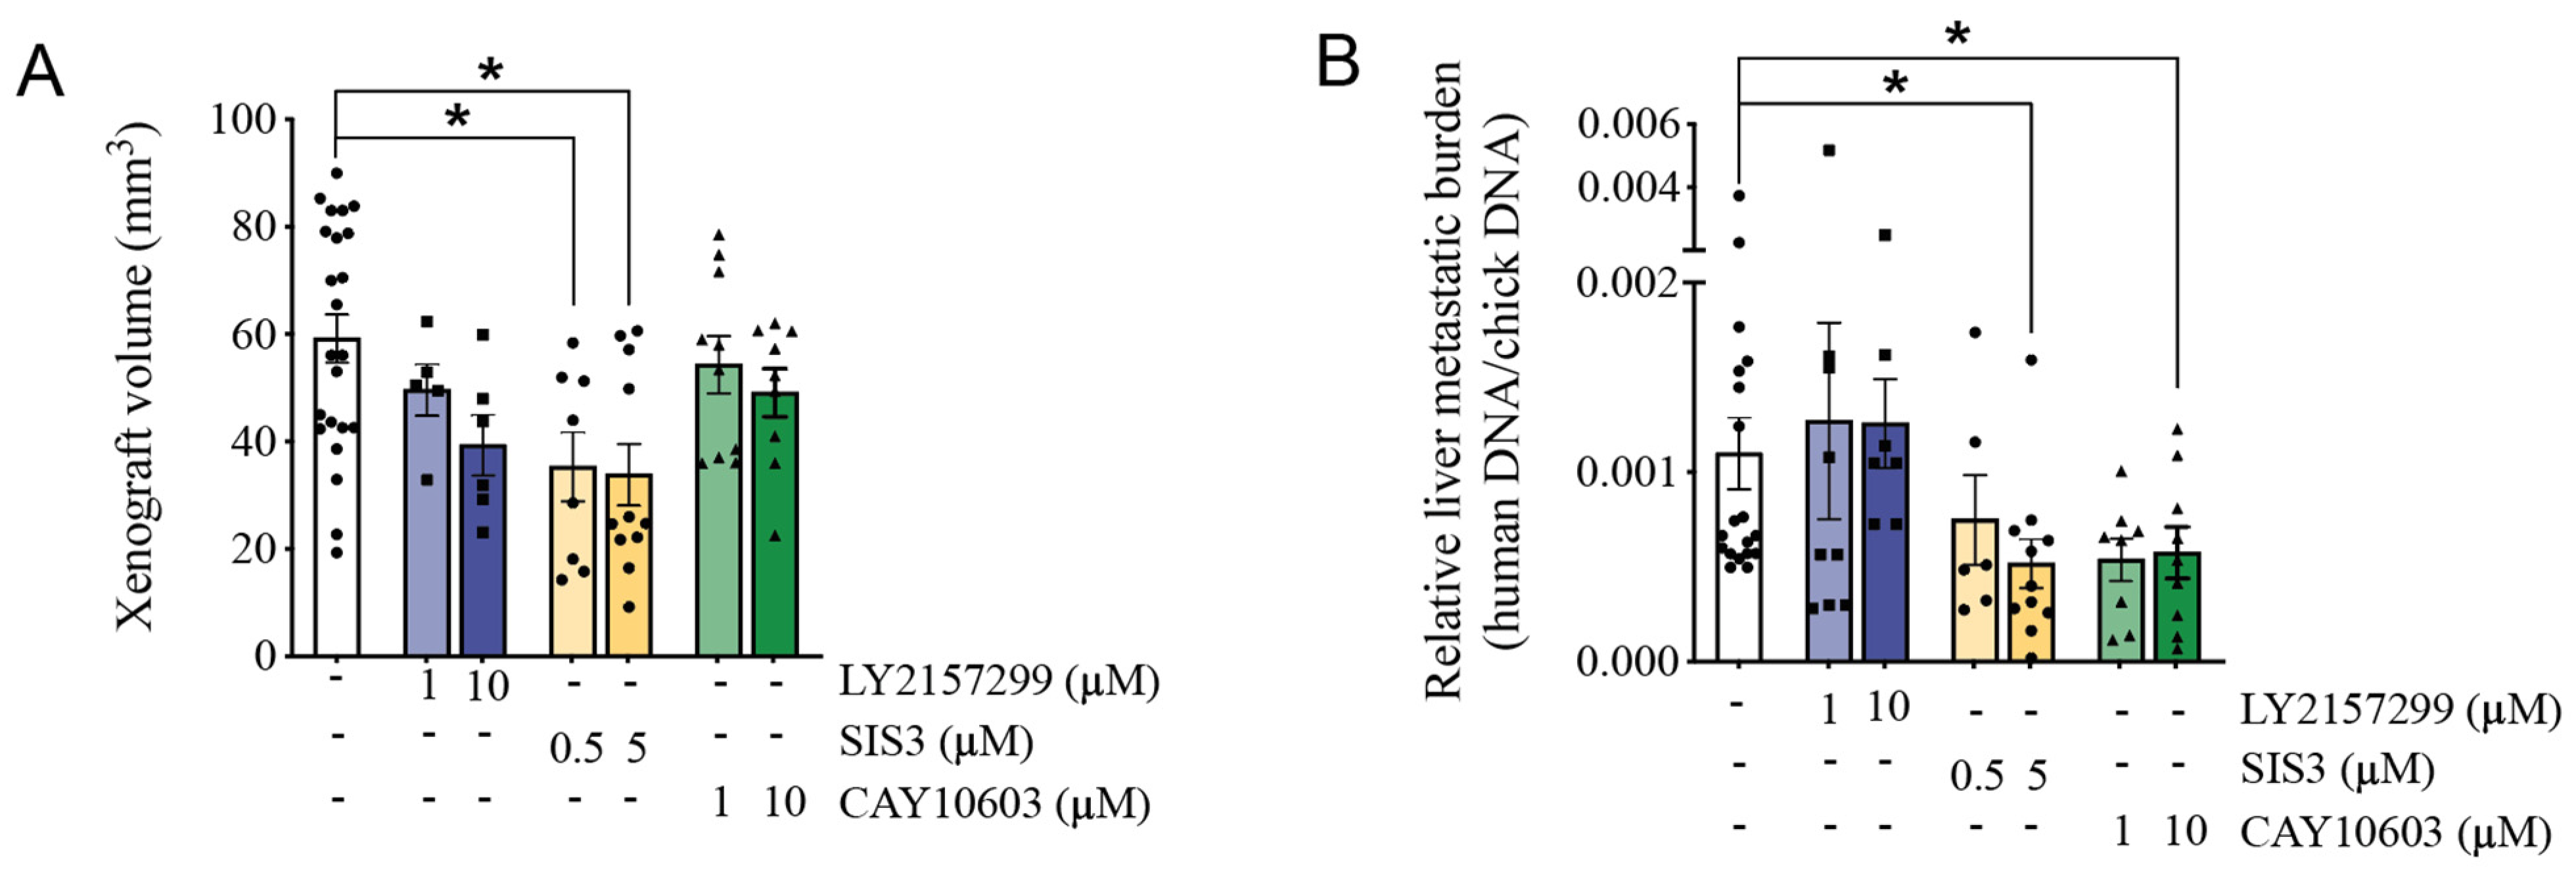
3.6. Pharmacological Inhibition of HDAC6 and SMAD3 Impedes Tumor Progression
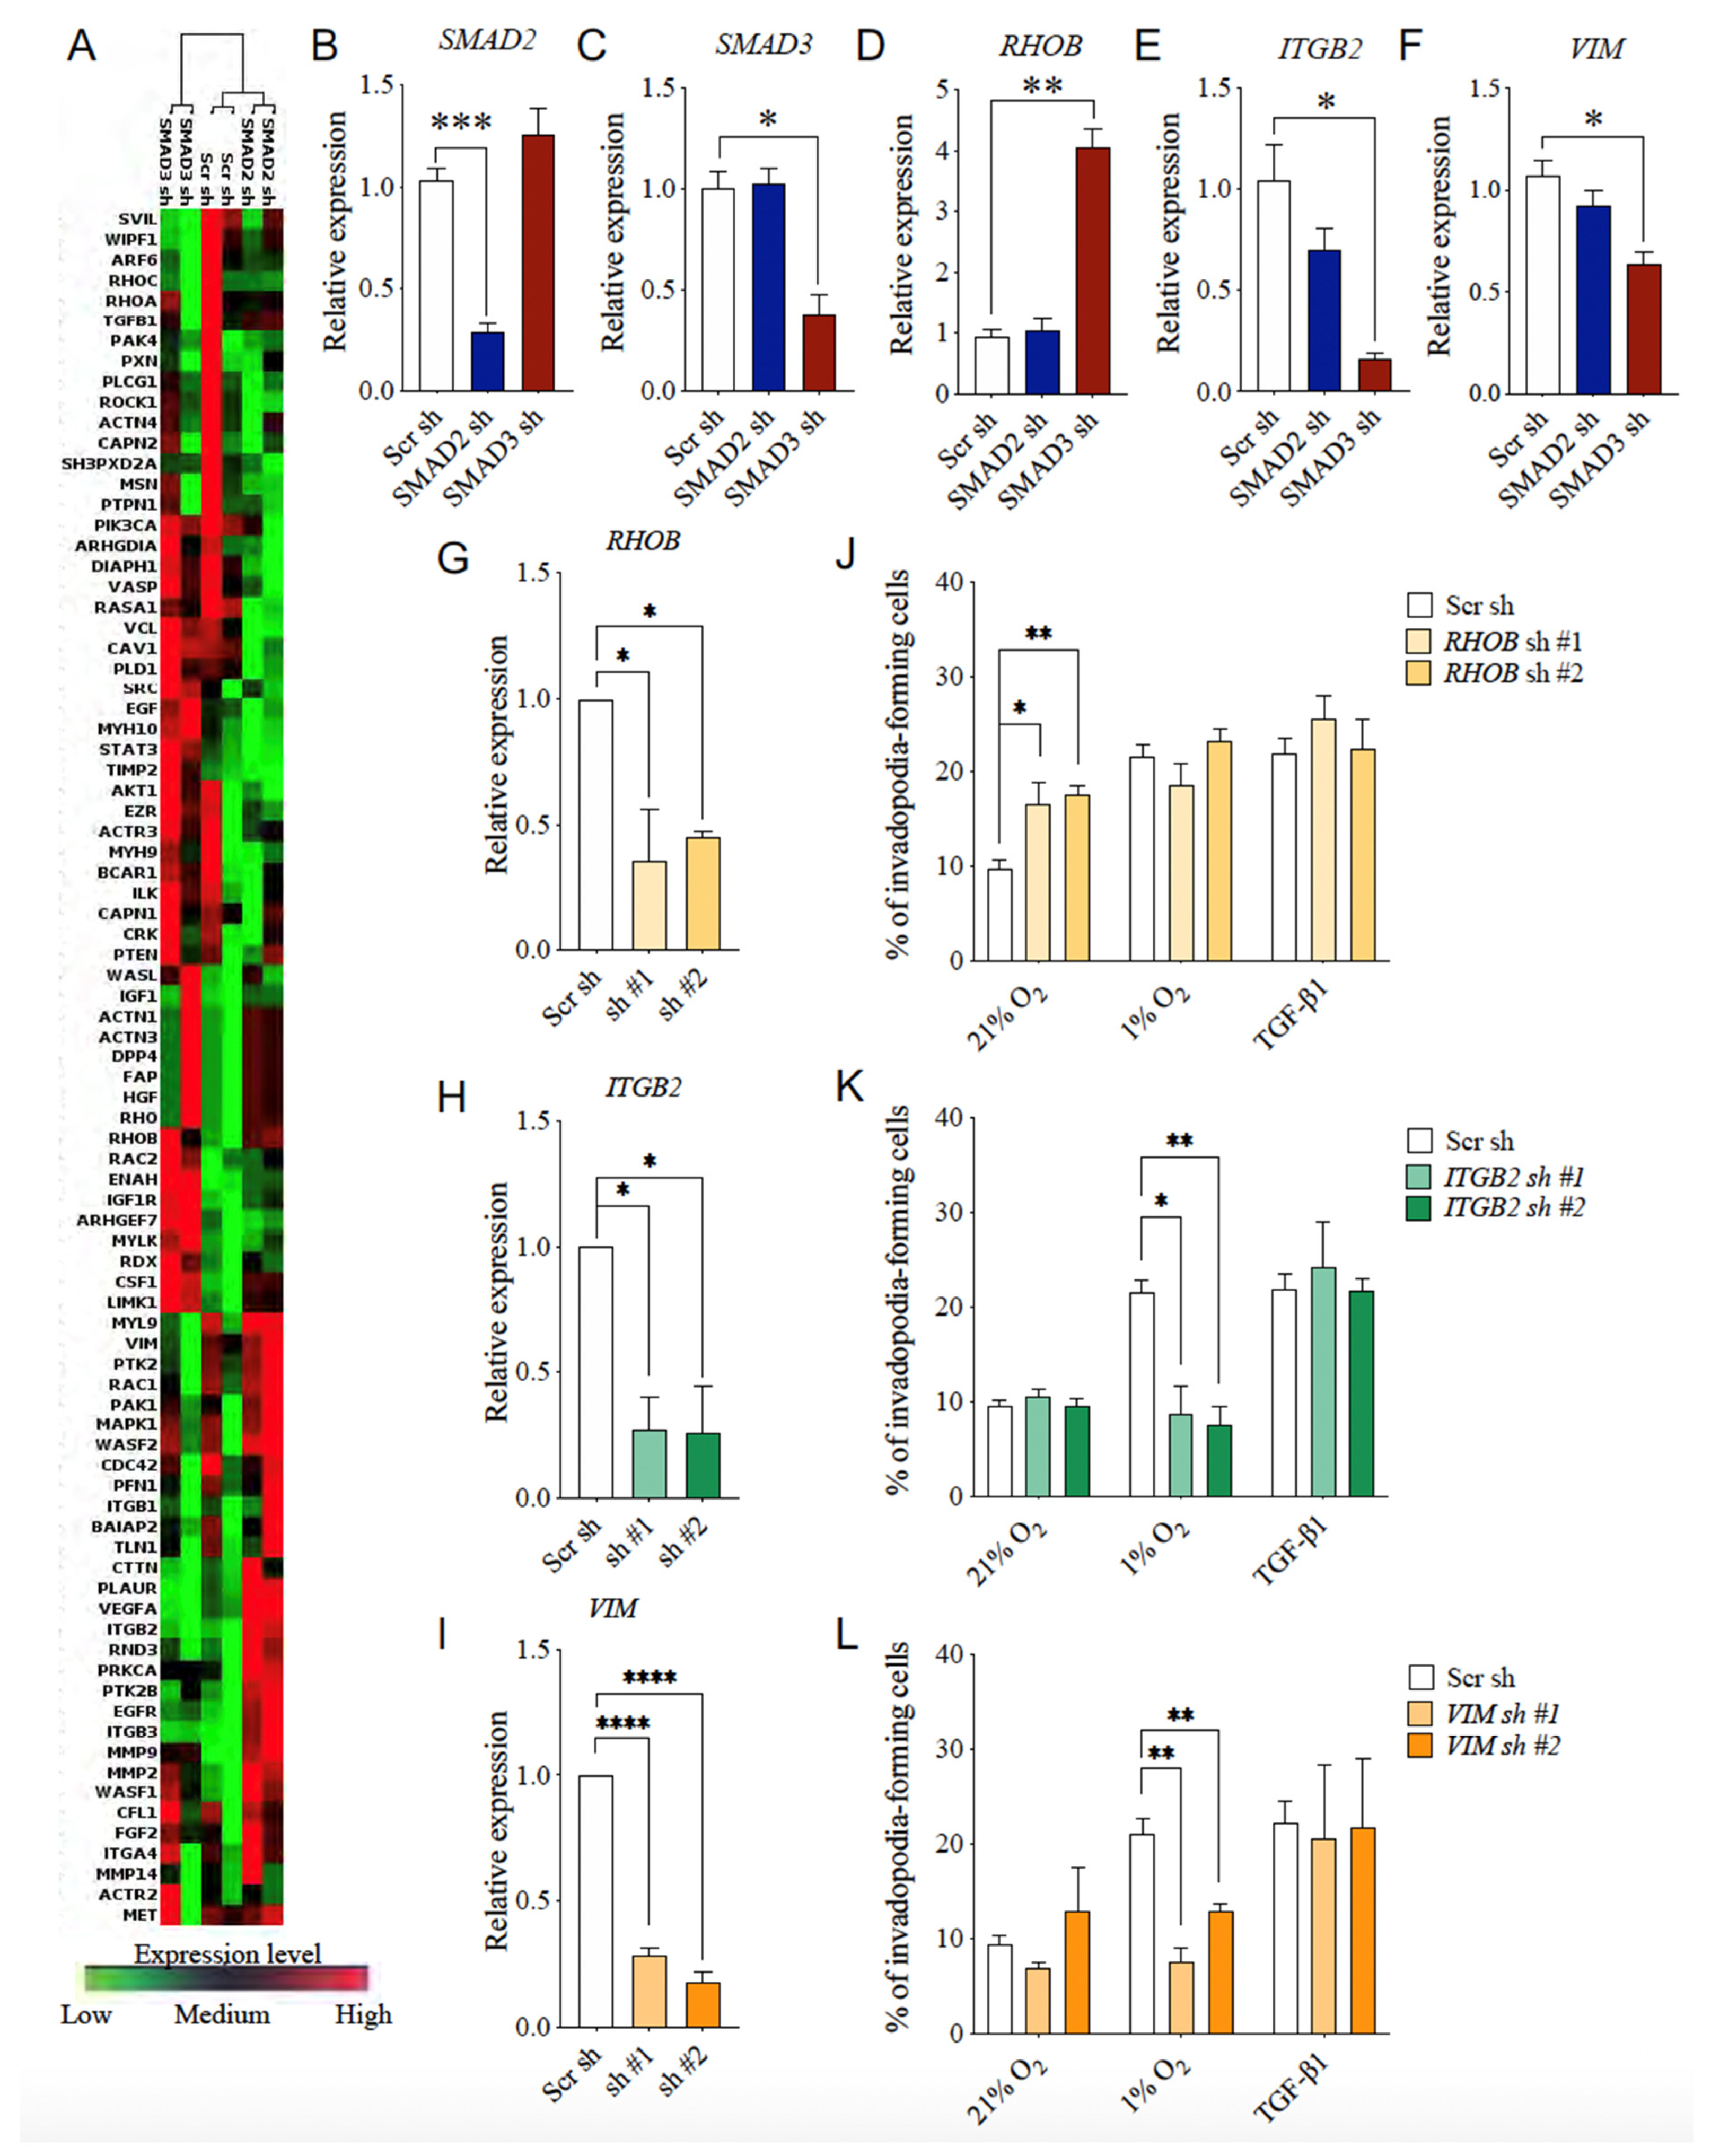
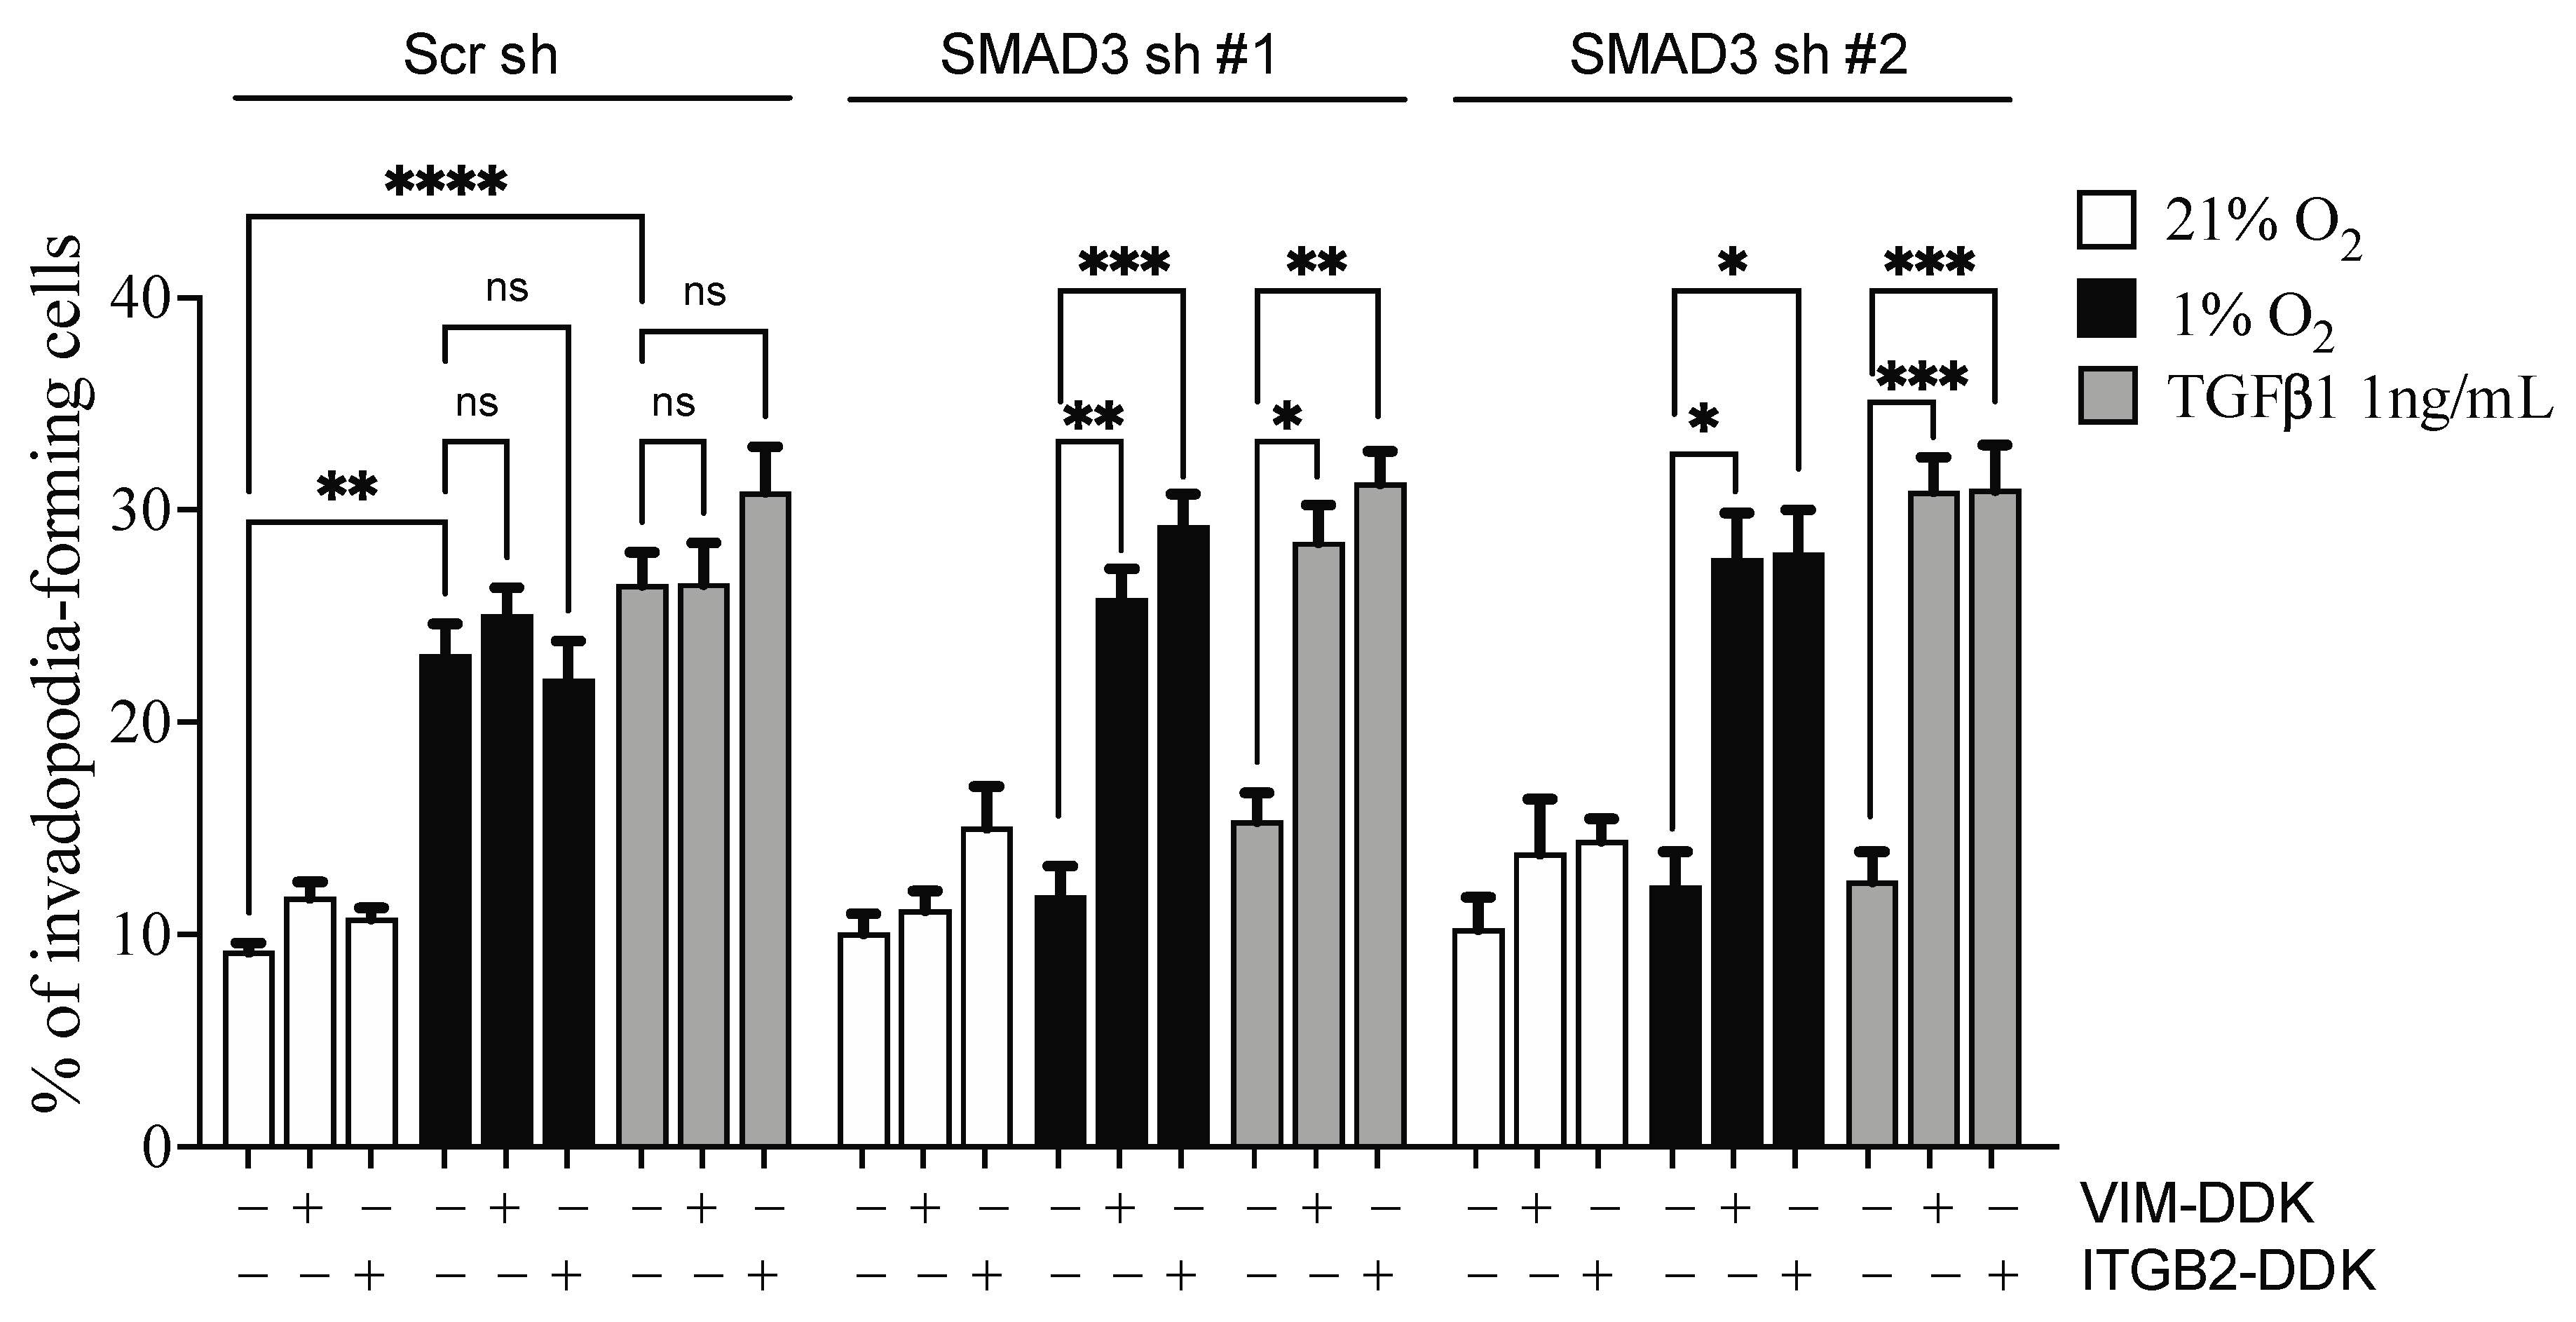
3.7. Selective SMAD3-Modulated Genes Participate in Hypoxia-Induced Invadopodia Formation
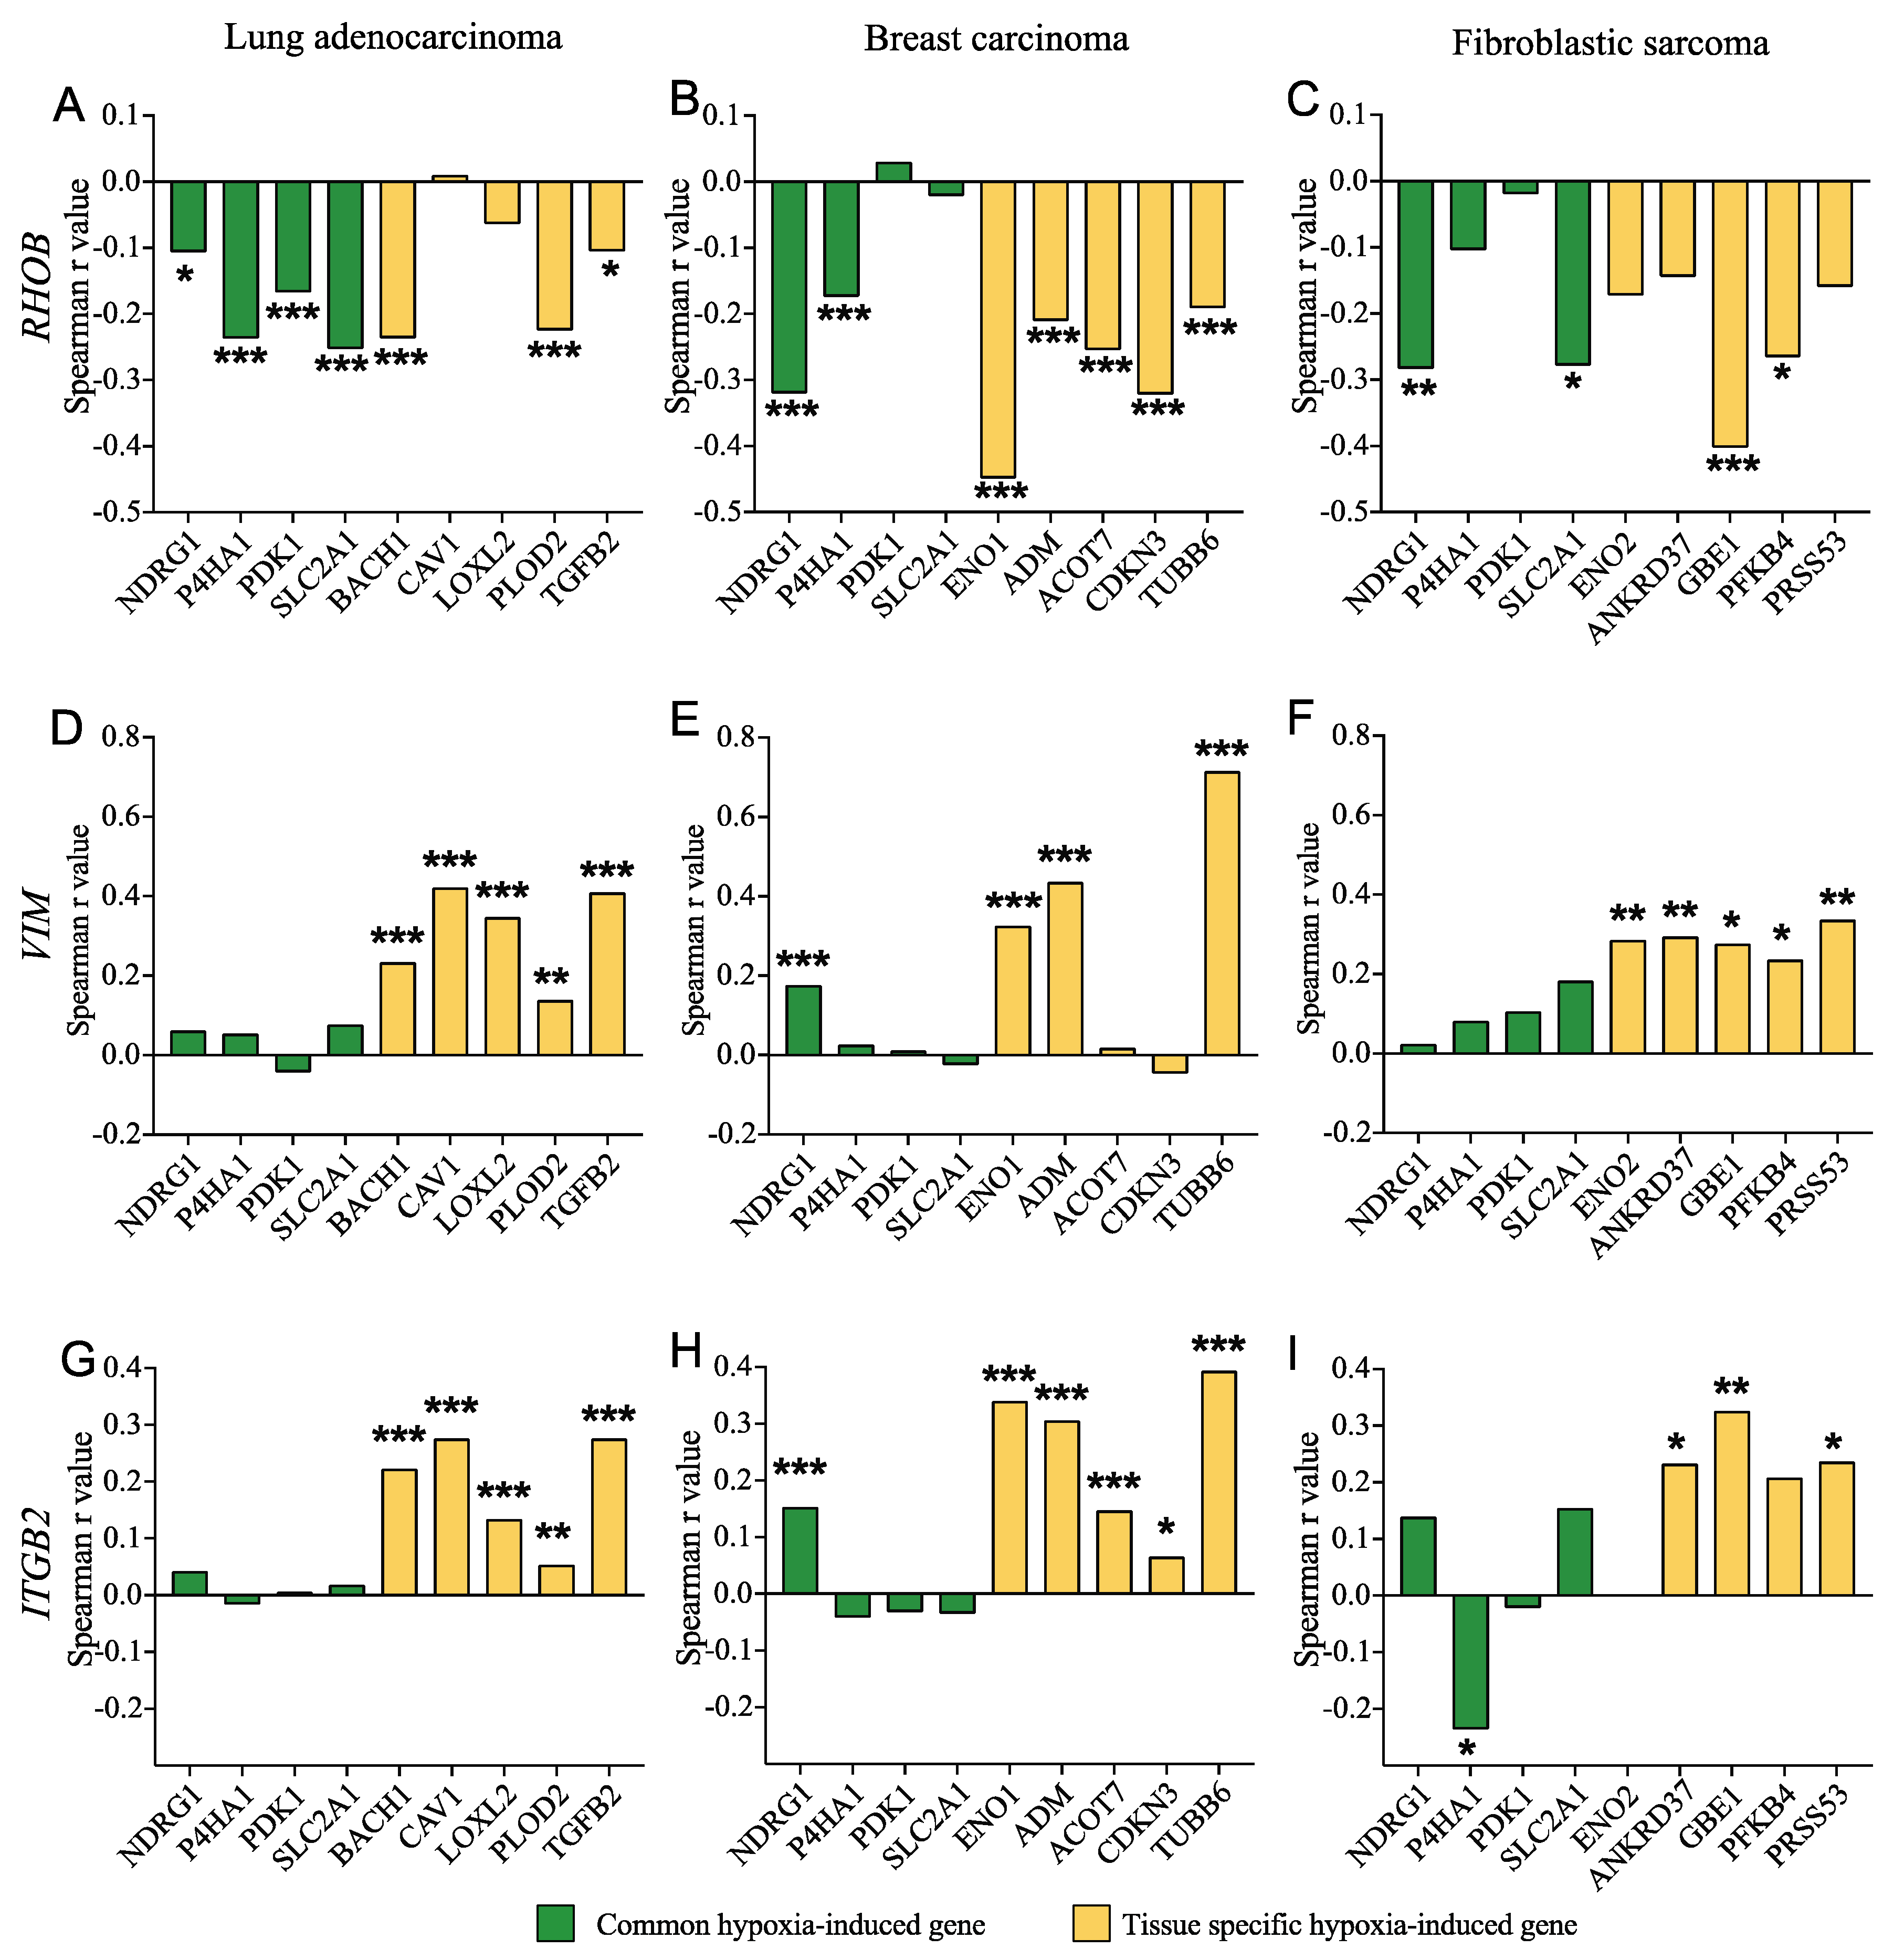
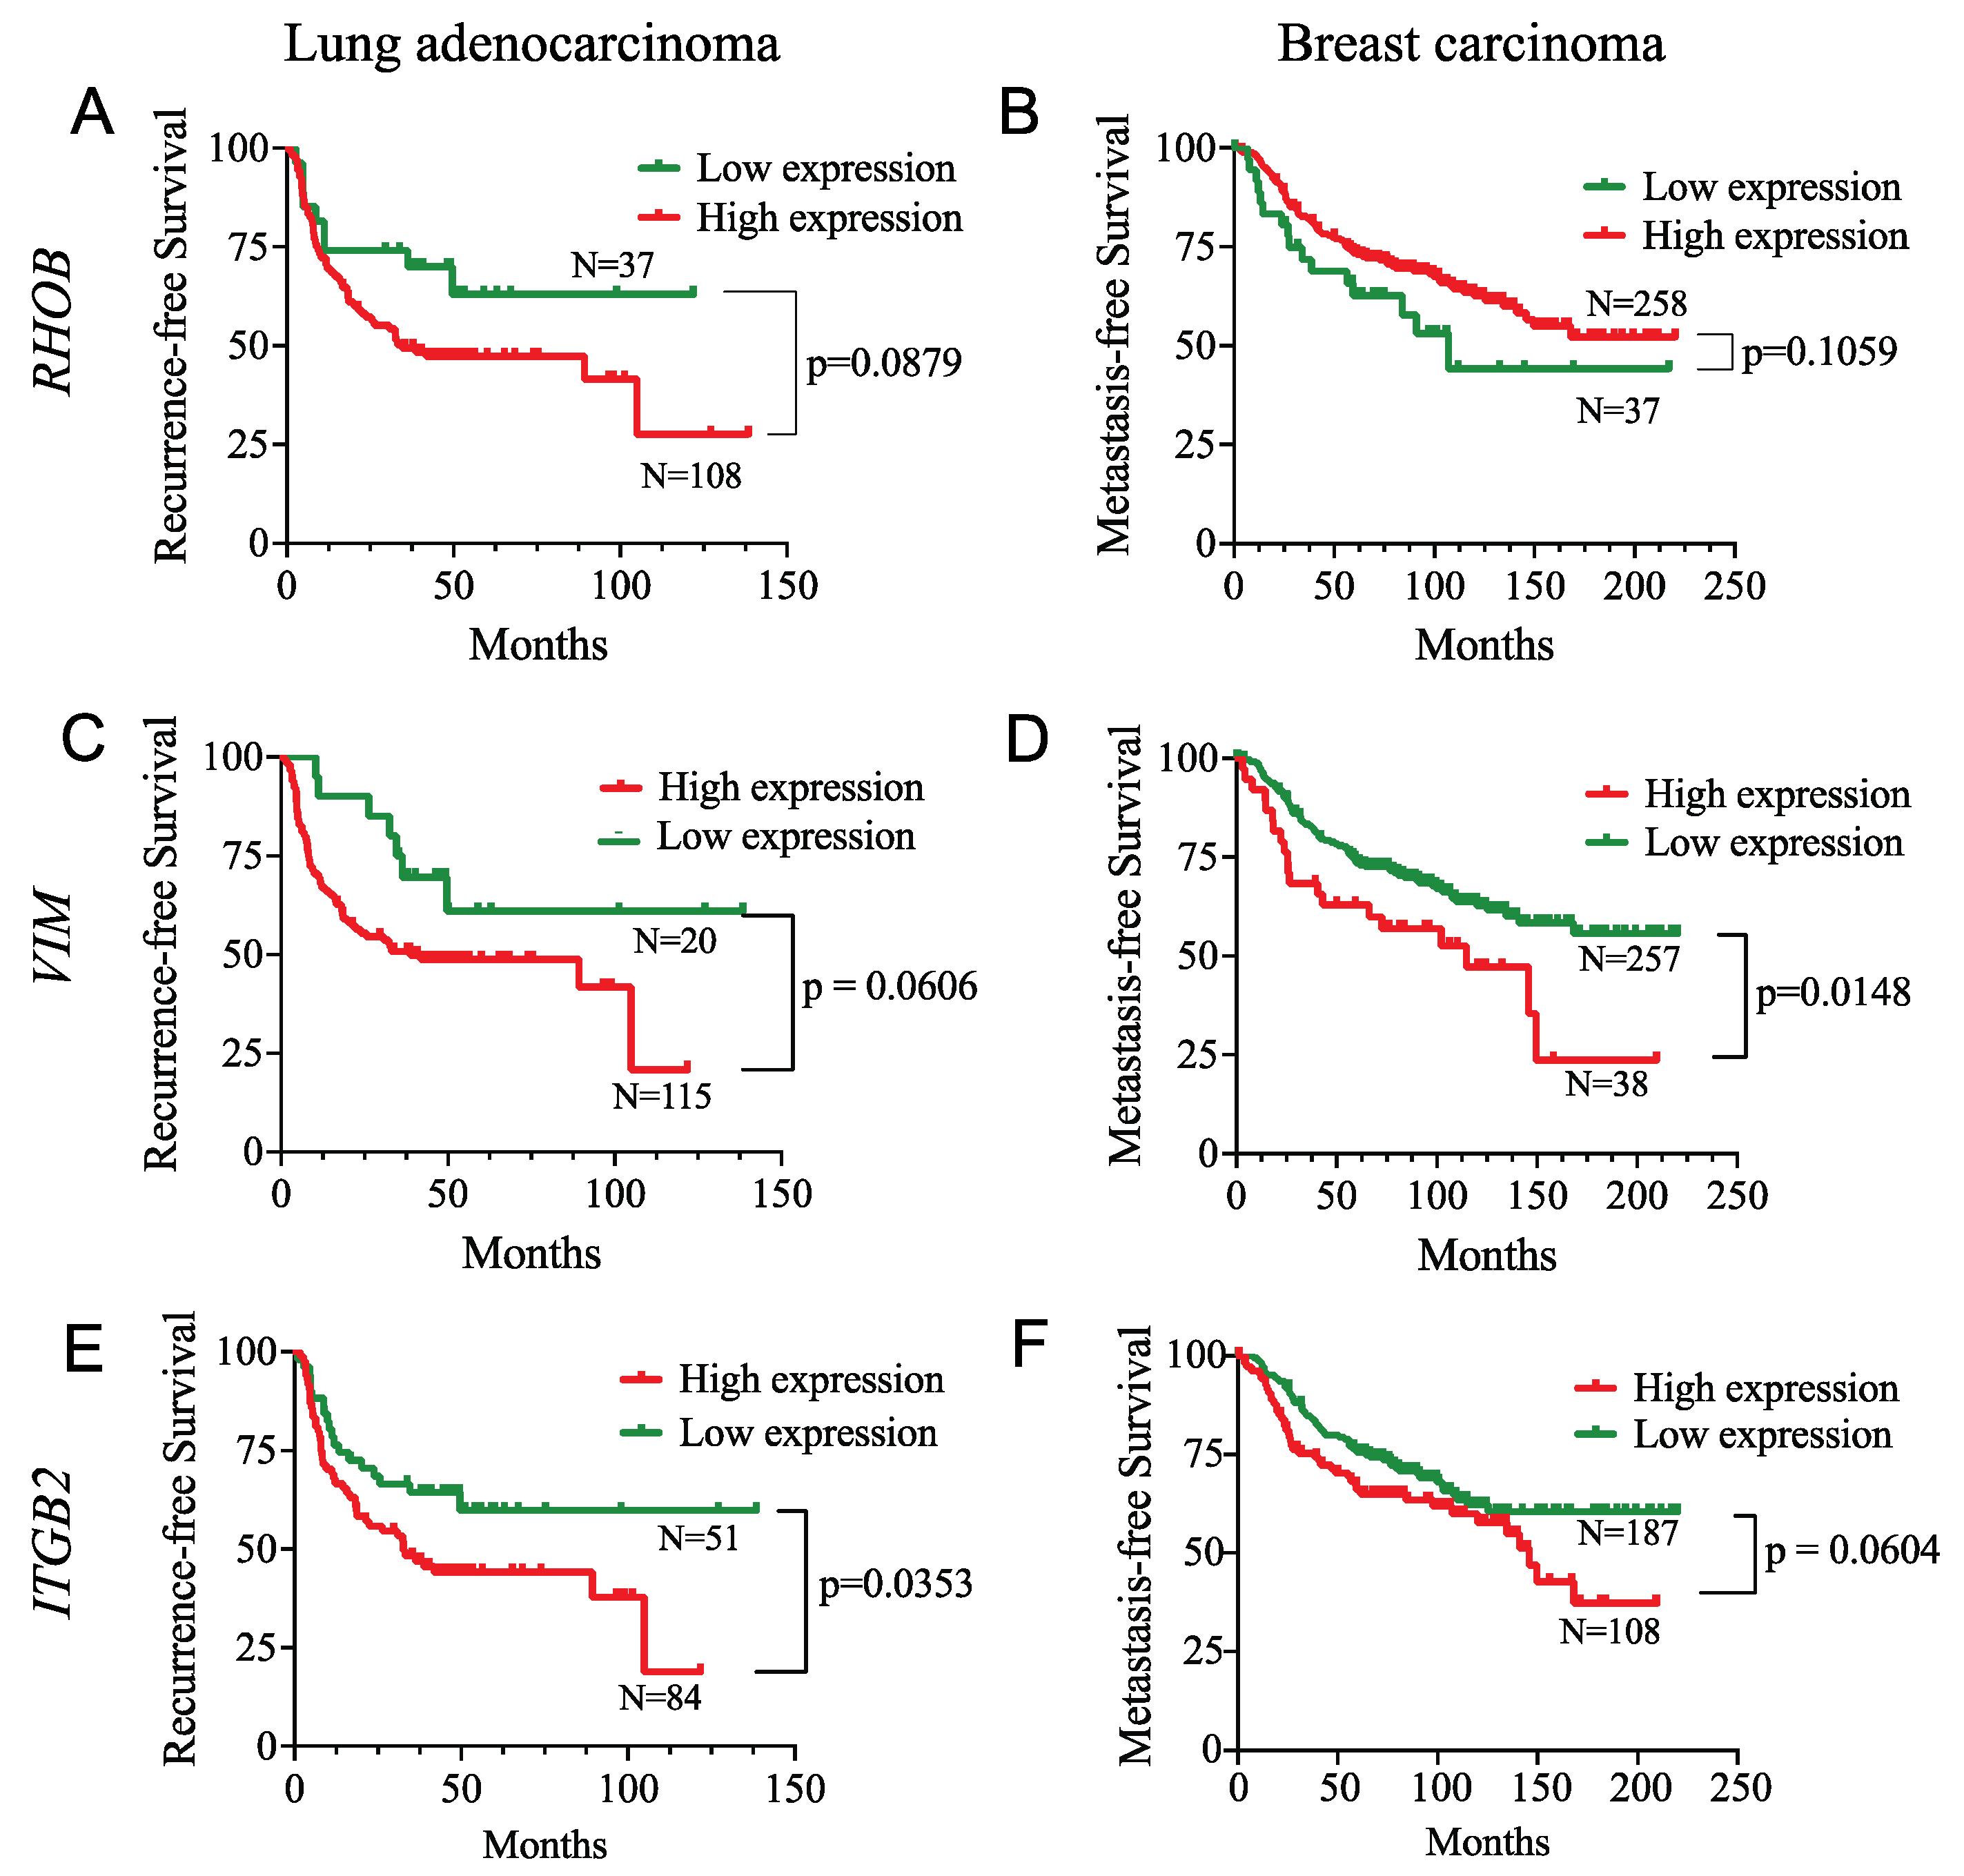
3.8. SMAD3 Proinvasive Gene Signature Correlates with a Hypoxic Gene Signature and Prognosis in Cancer Patients
4. Discussion
5. Conclusions
Supplementary Materials
Author Contributions
Funding
Institutional Review Board Statement
Data Availability Statement
Acknowledgments
Conflicts of Interest
References
- Massagué, J. TGFbeta in Cancer. Cell 2008, 134, 215–230. [Google Scholar] [CrossRef] [PubMed] [Green Version]
- Seoane, J.; Gomis, R.R. TGF-β Family Signaling in Tumor Suppression and Cancer Progression. Cold Spring Harb Perspect. Biol. 2017, 9, a022277. [Google Scholar] [CrossRef] [PubMed] [Green Version]
- Friedman, E.; Gold, L.I.; Klimstra, D.; Zeng, Z.S.; Winawer, S.; Cohen, A. High Levels of Transforming Growth Factor Beta 1 Correlate with Disease Progression in Human Colon Cancer. Cancer Epidemiol. Biomark. Prev. 1995, 4, 549–554. [Google Scholar]
- Tsushima, H.; Kawata, S.; Tamura, S.; Ito, N.; Shirai, Y.; Kiso, S.; Imai, Y.; Shimomukai, H.; Nomura, Y.; Matsuda, Y.; et al. High Levels of Transforming Growth Factor Beta 1 in Patients with Colorectal Cancer: Association with Disease Progression. Gastroenterology 1996, 110, 375–382. [Google Scholar] [CrossRef]
- Walker, R.A.; Dearing, S.J. Transforming Growth Factor Beta 1 in Ductal Carcinoma in Situ and Invasive Carcinomas of the Breast. Eur. J. Cancer 1992, 28, 641–644. [Google Scholar] [CrossRef]
- Wikström, P.; Stattin, P.; Franck-Lissbrant, I.; Damber, J.E.; Bergh, A. Transforming Growth Factor Beta1 Is Associated with Angiogenesis, Metastasis, and Poor Clinical Outcome in Prostate Cancer. Prostate 1998, 37, 19–29. [Google Scholar] [CrossRef]
- Buck, M.B.; Fritz, P.; Dippon, J.; Zugmaier, G.; Knabbe, C. Prognostic Significance of Transforming Growth Factor Beta Receptor II in Estrogen Receptor-Negative Breast Cancer Patients. Clin. Cancer Res. 2004, 10, 491–498. [Google Scholar] [CrossRef] [Green Version]
- Dalal, B.I.; Keown, P.A.; Greenberg, A.H. Immunocytochemical Localization of Secreted Transforming Growth Factor-Beta 1 to the Advancing Edges of Primary Tumors and to Lymph Node Metastases of Human Mammary Carcinoma. Am. J. Pathol. 1993, 143, 381–389. [Google Scholar]
- Padua, D.; Zhang, X.H.-F.; Wang, Q.; Nadal, C.; Gerald, W.L.; Gomis, R.R.; Massagué, J. TGFbeta Primes Breast Tumors for Lung Metastasis Seeding through Angiopoietin-like 4. Cell 2008, 133, 66–77. [Google Scholar] [CrossRef] [Green Version]
- Ciardiello, D.; Elez, E.; Tabernero, J.; Seoane, J. Clinical Development of Therapies Targeting TGFβ: Current Knowledge and Future Perspectives. Ann. Oncol. 2020, 31, 1336–1349. [Google Scholar] [CrossRef]
- Teixeira, A.F.; ten Dijke, P.; Zhu, H.-J. On-Target Anti-TGF-β Therapies Are Not Succeeding in Clinical Cancer Treatments: What Are Remaining Challenges? Front. Cell Dev. Biol. 2020, 8, 605. [Google Scholar] [CrossRef] [PubMed]
- Brandes, A.A.; Carpentier, A.F.; Kesari, S.; Sepulveda-Sanchez, J.M.; Wheeler, H.R.; Chinot, O.; Cher, L.; Steinbach, J.P.; Capper, D.; Specenier, P.; et al. A Phase II Randomized Study of Galunisertib Monotherapy or Galunisertib plus Lomustine Compared with Lomustine Monotherapy in Patients with Recurrent Glioblastoma. Neuro-Oncology 2016, 18, 1146–1156. [Google Scholar] [CrossRef] [Green Version]
- Akhurst, R.J.; Derynck, R. TGF-Beta Signaling in Cancer—A Double-Edged Sword. Trends Cell Biol. 2001, 11, S44–S51. [Google Scholar] [CrossRef] [PubMed]
- Lebrun, J.-J. The Dual Role of TGFβ in Human Cancer: From Tumor Suppression to Cancer Metastasis. ISRN Mol. Biol. 2012, 2012, 381428. [Google Scholar] [CrossRef] [Green Version]
- Hill, C.S. Transcriptional Control by the SMADs. Cold Spring Harb. Perspect. Biol. 2016, 8, a022079. [Google Scholar] [CrossRef] [PubMed] [Green Version]
- Tian, F.; Byfield, S.D.; Parks, W.T.; Stuelten, C.H.; Nemani, D.; Zhang, Y.E.; Roberts, A.B. Smad-Binding Defective Mutant of Transforming Growth Factor Beta Type I Receptor Enhances Tumorigenesis but Suppresses Metastasis of Breast Cancer Cell Lines. Cancer Res. 2004, 64, 4523–4530. [Google Scholar] [CrossRef] [Green Version]
- Singha, P.K.; Pandeswara, S.; Geng, H.; Lan, R.; Venkatachalam, M.A.; Dobi, A.; Srivastava, S.; Saikumar, P. Increased Smad3 and Reduced Smad2 Levels Mediate the Functional Switch of TGF-β from Growth Suppressor to Growth and Metastasis Promoter through TMEPAI/PMEPA1 in Triple Negative Breast Cancer. Genes Cancer 2019, 10, 134–149. [Google Scholar] [CrossRef] [Green Version]
- Hoot, K.E.; Lighthall, J.; Han, G.; Lu, S.-L.; Li, A.; Ju, W.; Kulesz-Martin, M.; Bottinger, E.; Wang, X.-J. Keratinocyte-Specific Smad2 Ablation Results in Increased Epithelial-Mesenchymal Transition during Skin Cancer Formation and Progression. J. Clin. Investig. 2008, 118, 2722–2732. [Google Scholar] [CrossRef] [Green Version]
- Chen, Y.; Xing, P.; Chen, Y.; Zou, L.; Zhang, Y.; Li, F.; Lu, X. High P-Smad2 Expression in Stromal Fibroblasts Predicts Poor Survival in Patients with Clinical Stage I to IIIA Non-Small Cell Lung Cancer. World J. Surg. Oncol. 2014, 12, 328. [Google Scholar] [CrossRef] [Green Version]
- Cho, S.Y.; Ha, S.Y.; Huang, S.-M.; Kim, J.H.; Kang, M.S.; Yoo, H.-Y.; Kim, H.; Park, C.-K.; Um, S.-H.; Kim, K.-H.; et al. The Prognostic Significance of Smad3, Smad4, Smad3 Phosphoisoform Expression in Esophageal Squamous Cell Carcinoma. Med. Oncol. 2014, 31, 236. [Google Scholar] [CrossRef]
- Sferra, R.; Pompili, S.; Festuccia, C.; Marampon, F.; Gravina, G.L.; Ventura, L.; Di Cesare, E.; Cicchinelli, S.; Gaudio, E.; Vetuschi, A. The Possible Prognostic Role of Histone Deacetylase and Transforming Growth Factor β/Smad Signaling in High Grade Gliomas Treated by Radio-Chemotherapy: A Preliminary Immunohistochemical Study. Eur. J. Histochem. 2017, 61, 2732. [Google Scholar] [CrossRef] [PubMed] [Green Version]
- Petersen, M.; Pardali, E.; van der Horst, G.; Cheung, H.; van den Hoogen, C.; van der Pluijm, G.; Ten Dijke, P. Smad2 and Smad3 Have Opposing Roles in Breast Cancer Bone Metastasis by Differentially Affecting Tumor Angiogenesis. Oncogene 2010, 29, 1351–1361. [Google Scholar] [CrossRef] [PubMed] [Green Version]
- Ungefroren, H.; Groth, S.; Sebens, S.; Lehnert, H.; Gieseler, F.; Fändrich, F. Differential Roles of Smad2 and Smad3 in the Regulation of TGF-Β1-Mediated Growth Inhibition and Cell Migration in Pancreatic Ductal Adenocarcinoma Cells: Control by Rac1. Mol. Cancer 2011, 10, 67. [Google Scholar] [CrossRef] [PubMed] [Green Version]
- Mingyuan, X.; Qianqian, P.; Shengquan, X.; Chenyi, Y.; Rui, L.; Yichen, S.; Jinghong, X. Hypoxia-Inducible Factor-1α Activates Transforming Growth Factor-Β1/Smad Signaling and Increases Collagen Deposition in Dermal Fibroblasts. Oncotarget 2017, 9, 3188–3197. [Google Scholar] [CrossRef] [Green Version]
- Mori, Y.; Chen, S.J.; Varga, J. Modulation of Endogenous Smad Expression in Normal Skin Fibroblasts by Transforming Growth Factor-Beta. Exp. Cell Res. 2000, 258, 374–383. [Google Scholar] [CrossRef]
- Dong, C.; Li, Z.; Alvarez, R.; Feng, X.H.; Goldschmidt-Clermont, P.J. Microtubule Binding to Smads May Regulate TGF Beta Activity. Mol. Cell 2000, 5, 27–34. [Google Scholar] [CrossRef]
- Watanabe, Y.; Itoh, S.; Goto, T.; Ohnishi, E.; Inamitsu, M.; Itoh, F.; Satoh, K.; Wiercinska, E.; Yang, W.; Shi, L.; et al. TMEPAI, a Transmembrane TGF-Beta-Inducible Protein, Sequesters Smad Proteins from Active Participation in TGF-Beta Signaling. Mol. Cell 2010, 37, 123–134. [Google Scholar] [CrossRef] [Green Version]
- Hsieh, C.-H.; Shyu, W.-C.; Chiang, C.-Y.; Kuo, J.-W.; Shen, W.-C.; Liu, R.-S. NADPH Oxidase Subunit 4-Mediated Reactive Oxygen Species Contribute to Cycling Hypoxia-Promoted Tumor Progression in Glioblastoma Multiforme. PLoS ONE 2011, 6, e23945. [Google Scholar] [CrossRef]
- Rofstad, E.K.; Gaustad, J.-V.; Egeland, T.A.M.; Mathiesen, B.; Galappathi, K. Tumors Exposed to Acute Cyclic Hypoxic Stress Show Enhanced Angiogenesis, Perfusion and Metastatic Dissemination. Int. J. Cancer 2010, 127, 1535–1546. [Google Scholar] [CrossRef]
- Lu, Y.; Hu, J.; Sun, W.; Duan, X.; Chen, X. Hypoxia-Mediated Immune Evasion of Pancreatic Carcinoma Cells. Mol. Med. Rep. 2015, 11, 3666–3672. [Google Scholar] [CrossRef]
- Cairns, R.A.; Hill, R.P. Acute Hypoxia Enhances Spontaneous Lymph Node Metastasis in an Orthotopic Murine Model of Human Cervical Carcinoma. Cancer Res. 2004, 64, 2054–2061. [Google Scholar] [CrossRef] [Green Version]
- Hung, S.-P.; Yang, M.-H.; Tseng, K.-F.; Lee, O.K. Hypoxia-Induced Secretion of TGF-Β1 in Mesenchymal Stem Cell Promotes Breast Cancer Cell Progression. Cell Transplant. 2013, 22, 1869–1882. [Google Scholar] [CrossRef] [PubMed] [Green Version]
- Arsenault, D.; Lucien, F.; Dubois, C.M. Hypoxia Enhances Cancer Cell Invasion through Relocalization of the Proprotein Convertase Furin from the Trans-Golgi Network to the Cell Surface. J. Cell. Physiol. 2012, 227, 789–800. [Google Scholar] [CrossRef] [PubMed]
- McMahon, S.; Grondin, F.; McDonald, P.P.; Richard, D.E.; Dubois, C.M. Hypoxia-Enhanced Expression of the Proprotein Convertase Furin Is Mediated by Hypoxia-Inducible Factor-1: Impact on the Bioactivation of Proproteins. J. Biol. Chem. 2005, 280, 6561–6569. [Google Scholar] [CrossRef] [Green Version]
- Cui, W.; Zhou, J.; Dehne, N.; Brüne, B. Hypoxia Induces Calpain Activity and Degrades SMAD2 to Attenuate TGFβ Signaling in Macrophages. Cell Biosci. 2015, 5, 36. [Google Scholar] [CrossRef] [Green Version]
- Zhang, H.; Akman, H.O.; Smith, E.L.P.; Zhao, J.; Murphy-Ullrich, J.E.; Batuman, O.A. Cellular Response to Hypoxia Involves Signaling via Smad Proteins. Blood 2003, 101, 2253–2260. [Google Scholar] [CrossRef] [PubMed]
- Arsenault, D.; Brochu-Gaudreau, K.; Charbonneau, M.; Dubois, C.M. HDAC6 Deacetylase Activity Is Required for Hypoxia-Induced Invadopodia Formation and Cell Invasion. PLoS ONE 2013, 8, e55529. [Google Scholar] [CrossRef] [Green Version]
- Abdollah, S.; Macías-Silva, M.; Tsukazaki, T.; Hayashi, H.; Attisano, L.; Wrana, J.L. TbetaRI Phosphorylation of Smad2 on Ser465 and Ser467 Is Required for Smad2-Smad4 Complex Formation and Signaling. J. Biol. Chem. 1997, 272, 27678–27685. [Google Scholar] [CrossRef] [Green Version]
- Lucien, F.; Pelletier, P.-P.; Lavoie, R.R.; Lacroix, J.-M.; Roy, S.; Parent, J.-L.; Arsenault, D.; Harper, K.; Dubois, C.M. Hypoxia-Induced Mobilization of NHE6 to the Plasma Membrane Triggers Endosome Hyperacidification and Chemoresistance. Nat. Commun. 2017, 8, 15884. [Google Scholar] [CrossRef] [Green Version]
- Zijlstra, A.; Mellor, R.; Panzarella, G.; Aimes, R.T.; Hooper, J.D.; Marchenko, N.D.; Quigley, J.P. A Quantitative Analysis of Rate-Limiting Steps in the Metastatic Cascade Using Human-Specific Real-Time Polymerase Chain Reaction. Cancer Res. 2002, 62, 7083–7092. [Google Scholar]
- Baldassarre, M.; Ayala, I.; Beznoussenko, G.; Giacchetti, G.; Machesky, L.M.; Luini, A.; Buccione, R. Actin Dynamics at Sites of Extracellular Matrix Degradation. Eur. J. Cell Biol. 2006, 85, 1217–1231. [Google Scholar] [CrossRef]
- Wu, G.; Chen, Y.G.; Ozdamar, B.; Gyuricza, C.A.; Chong, P.A.; Wrana, J.L.; Massagué, J.; Shi, Y. Structural Basis of Smad2 Recognition by the Smad Anchor for Receptor Activation. Science 2000, 287, 92–97. [Google Scholar] [CrossRef] [PubMed]
- Harper, K.; Arsenault, D.; Boulay-Jean, S.; Lauzier, A.; Lucien, F.; Dubois, C.M. Autotaxin Promotes Cancer Invasion via the Lysophosphatidic Acid Receptor 4: Participation of the Cyclic AMP/EPAC/Rac1 Signaling Pathway in Invadopodia Formation. Cancer Res. 2010, 70, 4634–4643. [Google Scholar] [CrossRef] [PubMed] [Green Version]
- Liu, J.; Lichtenberg, T.; Hoadley, K.A.; Poisson, L.M.; Lazar, A.J.; Cherniack, A.D.; Kovatich, A.J.; Benz, C.C.; Levine, D.A.; Lee, A.V.; et al. An Integrated TCGA Pan-Cancer Clinical Data Resource to Drive High-Quality Survival Outcome Analytics. Cell 2018, 173, 400–416.e11. [Google Scholar] [CrossRef] [PubMed] [Green Version]
- Buffa, F.M.; Harris, A.L.; West, C.M.; Miller, C.J. Large Meta-Analysis of Multiple Cancers Reveals a Common, Compact and Highly Prognostic Hypoxia Metagene. Br. J. Cancer 2010, 102, 428–435. [Google Scholar] [CrossRef]
- Chen, Y.-L.; Zhang, Y.; Wang, J.; Chen, N.; Fang, W.; Zhong, J.; Liu, Y.; Qin, R.; Yu, X.; Sun, Z.; et al. A 17 Gene Panel for Non-Small-Cell Lung Cancer Prognosis Identified through Integrative Epigenomic-Transcriptomic Analyses of Hypoxia-Induced Epithelial-Mesenchymal Transition. Mol. Oncol. 2019, 13, 1490–1502. [Google Scholar] [CrossRef] [Green Version]
- Yang, L.; Forker, L.; Irlam, J.J.; Pillay, N.; Choudhury, A.; West, C.M.L. Validation of a Hypoxia Related Gene Signature in Multiple Soft Tissue Sarcoma Cohorts. Oncotarget 2018, 9, 3946–3955. [Google Scholar] [CrossRef] [Green Version]
- Chibon, F.; Lagarde, P.; Salas, S.; Pérot, G.; Brouste, V.; Tirode, F.; Lucchesi, C.; de Reynies, A.; Kauffmann, A.; Bui, B.; et al. Validated Prediction of Clinical Outcome in Sarcomas and Multiple Types of Cancer on the Basis of a Gene Expression Signature Related to Genome Complexity. Nat. Med. 2010, 16, 781–787. [Google Scholar] [CrossRef]
- Lee, E.-S.; Son, D.-S.; Kim, S.-H.; Lee, J.; Jo, J.; Han, J.; Kim, H.; Lee, H.J.; Choi, H.Y.; Jung, Y.; et al. Prediction of Recurrence-Free Survival in Postoperative Non-Small Cell Lung Cancer Patients by Using an Integrated Model of Clinical Information and Gene Expression. Clin. Cancer Res. 2008, 14, 7397–7404. [Google Scholar] [CrossRef] [Green Version]
- Van’t Veer, L.J.; Dai, H.; van de Vijver, M.J.; He, Y.D.; Hart, A.A.M.; Mao, M.; Peterse, H.L.; van der Kooy, K.; Marton, M.J.; Witteveen, A.T.; et al. Gene Expression Profiling Predicts Clinical Outcome of Breast Cancer. Nature 2002, 415, 530–536. [Google Scholar] [CrossRef] [Green Version]
- Aguirre-Gamboa, R.; Gomez-Rueda, H.; Martínez-Ledesma, E.; Martínez-Torteya, A.; Chacolla-Huaringa, R.; Rodriguez-Barrientos, A.; Tamez-Peña, J.G.; Treviño, V. SurvExpress: An Online Biomarker Validation Tool and Database for Cancer Gene Expression Data Using Survival Analysis. PLoS ONE 2013, 8, e74250. [Google Scholar] [CrossRef] [PubMed] [Green Version]
- Sugiyama, Y.; Kakoi, K.; Kimura, A.; Takada, I.; Kashiwagi, I.; Wakabayashi, Y.; Morita, R.; Nomura, M.; Yoshimura, A. Smad2 and Smad3 Are Redundantly Essential for the Suppression of INOS Synthesis in Macrophages by Regulating IRF3 and STAT1 Pathways. Int. Immunol. 2012, 24, 253–265. [Google Scholar] [CrossRef] [PubMed]
- Takimoto, T.; Wakabayashi, Y.; Sekiya, T.; Inoue, N.; Morita, R.; Ichiyama, K.; Takahashi, R.; Asakawa, M.; Muto, G.; Mori, T.; et al. Smad2 and Smad3 Are Redundantly Essential for the TGF-Beta-Mediated Regulation of Regulatory T Plasticity and Th1 Development. J. Immunol. 2010, 185, 842–855. [Google Scholar] [CrossRef] [PubMed] [Green Version]
- Brown, K.A.; Pietenpol, J.A.; Moses, H.L. A Tale of Two Proteins: Differential Roles and Regulation of Smad2 and Smad3 in TGF-Beta Signaling. J. Cell. Biochem. 2007, 101, 9–33. [Google Scholar] [CrossRef] [PubMed]
- Piek, E.; Ju, W.J.; Heyer, J.; Escalante-Alcalde, D.; Stewart, C.L.; Weinstein, M.; Deng, C.; Kucherlapati, R.; Bottinger, E.P.; Roberts, A.B. Functional Characterization of Transforming Growth Factor Beta Signaling in Smad2- and Smad3-Deficient Fibroblasts. J. Biol. Chem. 2001, 276, 19945–19953. [Google Scholar] [CrossRef] [Green Version]
- Zhang, L.-H.; Tian, B.; Diao, L.-R.; Xiong, Y.-Y.; Tian, S.-F.; Zhang, B.-H.; Li, W.-M.; Ren, H.; Li, Y.; Ji, J.-F. Dominant Expression of 85-KDa Form of Cortactin in Colorectal Cancer. J. Cancer Res. Clin. Oncol. 2006, 132, 113–120. [Google Scholar] [CrossRef]
- Hirooka, S.; Akashi, T.; Ando, N.; Suzuki, Y.; Ishida, N.; Kurata, M.; Takizawa, T.; Kayamori, K.; Sakamoto, K.; Fujiwara, N.; et al. Localization of the Invadopodia-Related Proteins Actinin-1 and Cortactin to Matrix-Contact-Side Cytoplasm of Cancer Cells in Surgically Resected Lung Adenocarcinomas. Pathobiology 2011, 78, 10–23. [Google Scholar] [CrossRef]
- Leong, H.S.; Robertson, A.E.; Stoletov, K.; Leith, S.J.; Chin, C.A.; Chien, A.E.; Hague, M.N.; Ablack, A.; Carmine-Simmen, K.; McPherson, V.A.; et al. Invadopodia Are Required for Cancer Cell Extravasation and Are a Therapeutic Target for Metastasis. Cell Rep. 2014, 8, 1558–1570. [Google Scholar] [CrossRef] [Green Version]
- Harper, K.; Yatsyna, A.; Charbonneau, M.; Brochu-Gaudreau, K.; Perreault, A.; Jeldres, C.; McDonald, P.P.; Dubois, C.M. The Chicken Chorioallantoic Membrane Tumor Assay as a Relevant In Vivo Model to Study the Impact of Hypoxia on Tumor Progression and Metastasis. Cancers 2021, 13, 1093. [Google Scholar] [CrossRef]
- Tsukazaki, T.; Chiang, T.A.; Davison, A.F.; Attisano, L.; Wrana, J.L. SARA, a FYVE Domain Protein That Recruits Smad2 to the TGFbeta Receptor. Cell 1998, 95, 779–791. [Google Scholar] [CrossRef] [Green Version]
- Runyan, C.E.; Schnaper, H.W.; Poncelet, A.-C. The Role of Internalization in Transforming Growth Factor Beta1-Induced Smad2 Association with Smad Anchor for Receptor Activation (SARA) and Smad2-Dependent Signaling in Human Mesangial Cells. J. Biol. Chem. 2005, 280, 8300–8308. [Google Scholar] [CrossRef] [PubMed] [Green Version]
- Tang, W.; Ling, G.; Sun, L.; Liu, F.-Y. Smad Anchor for Receptor Activation (SARA) in TGF-Beta Signaling. Front. Biosci. (Elite Ed) 2010, 2, 857–860. [Google Scholar] [PubMed] [Green Version]
- Tang, W.; Ling, G.; Sun, L.; Zhang, K.; Zhu, X.; Zhou, X.; Liu, F. Smad Anchor for Receptor Activation Regulates High Glucose-Induced EMT via Modulation of Smad2 and Smad3 Activities in Renal Tubular Epithelial Cells. Nephron 2015, 130, 213–220. [Google Scholar] [CrossRef] [PubMed]
- Goto, D.; Nakajima, H.; Mori, Y.; Kurasawa, K.; Kitamura, N.; Iwamoto, I. Interaction between Smad Anchor for Receptor Activation and Smad3 Is Not Essential for TGF-Beta/Smad3-Mediated Signaling. Biochem. Biophys. Res. Commun. 2001, 281, 1100–1105. [Google Scholar] [CrossRef] [PubMed]
- Henke, R.M.; Dastidar, R.G.; Shah, A.; Cadinu, D.; Yao, X.; Hooda, J.; Zhang, L. Hypoxia Elicits Broad and Systematic Changes in Protein Subcellular Localization. Am. J. Physiol. Cell Physiol. 2011, 301, C913–C928. [Google Scholar] [CrossRef]
- Bensellam, M.; Maxwell, E.L.; Chan, J.Y.; Luzuriaga, J.; West, P.K.; Jonas, J.-C.; Gunton, J.E.; Laybutt, D.R. Hypoxia Reduces ER-to-Golgi Protein Trafficking and Increases Cell Death by Inhibiting the Adaptive Unfolded Protein Response in Mouse Beta Cells. Diabetologia 2016, 59, 1492–1502. [Google Scholar] [CrossRef] [Green Version]
- Di Guglielmo, G.M.; Le Roy, C.; Goodfellow, A.F.; Wrana, J.L. Distinct Endocytic Pathways Regulate TGF-Beta Receptor Signalling and Turnover. Nat. Cell Biol. 2003, 5, 410–421. [Google Scholar] [CrossRef]
- Hayes, S.; Chawla, A.; Corvera, S. TGF Beta Receptor Internalization into EEA1-Enriched Early Endosomes: Role in Signaling to Smad2. J. Cell Biol. 2002, 158, 1239–1249. [Google Scholar] [CrossRef] [Green Version]
- Penheiter, S.G.; Mitchell, H.; Garamszegi, N.; Edens, M.; Doré, J.J.E.; Leof, E.B. Internalization-Dependent and -Independent Requirements for Transforming Growth Factor Beta Receptor Signaling via the Smad Pathway. Mol. Cell. Biol. 2002, 22, 4750–4759. [Google Scholar] [CrossRef] [Green Version]
- Chalmers, K.A.; Love, S. Neurofibrillary Tangles May Interfere with Smad 2/3 Signaling in Neurons. J. Neuropathol. Exp. Neurol. 2007, 66, 158–167. [Google Scholar] [CrossRef] [Green Version]
- Xu, L.; Liu, N.; Gu, H.; Wang, H.; Shi, Y.; Ma, X.; Ma, S.; Ni, J.; Tao, M.; Qiu, A.; et al. Histone Deacetylase 6 Inhibition Counteracts the Epithelial-Mesenchymal Transition of Peritoneal Mesothelial Cells and Prevents Peritoneal Fibrosis. Oncotarget 2017, 8, 88730–88750. [Google Scholar] [CrossRef] [PubMed] [Green Version]
- Melisi, D.; Garcia-Carbonero, R.; Macarulla, T.; Pezet, D.; Deplanque, G.; Fuchs, M.; Trojan, J.; Oettle, H.; Kozloff, M.; Cleverly, A.; et al. Galunisertib plus Gemcitabine vs. Gemcitabine for First-Line Treatment of Patients with Unresectable Pancreatic Cancer. Br. J. Cancer 2018, 119, 1208–1214. [Google Scholar] [CrossRef] [PubMed] [Green Version]
- Faivre, S.; Santoro, A.; Kelley, R.K.; Gane, E.; Costentin, C.E.; Gueorguieva, I.; Smith, C.; Cleverly, A.; Lahn, M.M.; Raymond, E.; et al. Novel Transforming Growth Factor Beta Receptor I Kinase Inhibitor Galunisertib (LY2157299) in Advanced Hepatocellular Carcinoma. Liver Int. 2019, 39, 1468–1477. [Google Scholar] [CrossRef] [PubMed]
- Harris, B.H.L.; Barberis, A.; West, C.M.L.; Buffa, F.M. Gene Expression Signatures as Biomarkers of Tumour Hypoxia. Clin. Oncol. (R. Coll. Radiol.) 2015, 27, 547–560. [Google Scholar] [CrossRef]
- Tannehill-Gregg, S.H.; Kusewitt, D.F.; Rosol, T.J.; Weinstein, M. The Roles of Smad2 and Smad3 in the Development of Chemically Induced Skin Tumors in Mice. Vet. Pathol. 2004, 41, 278–282. [Google Scholar] [CrossRef] [PubMed] [Green Version]
- Xie, W.; Mertens, J.C.; Reiss, D.J.; Rimm, D.L.; Camp, R.L.; Haffty, B.G.; Reiss, M. Alterations of Smad Signaling in Human Breast Carcinoma Are Associated with Poor Outcome: A Tissue Microarray Study. Cancer Res. 2002, 62, 497–505. [Google Scholar]
- Tian, F.; DaCosta Byfield, S.; Parks, W.T.; Yoo, S.; Felici, A.; Tang, B.; Piek, E.; Wakefield, L.M.; Roberts, A.B. Reduction in Smad2/3 Signaling Enhances Tumorigenesis but Suppresses Metastasis of Breast Cancer Cell Lines. Cancer Res. 2003, 63, 8284–8292. [Google Scholar]
- Liu, N.; Qi, D.; Jiang, J.; Zhang, J.; Yu, C. Expression Pattern of P-Smad2/Smad4 as a Predictor of Survival in Invasive Breast Ductal Carcinoma. Oncol. Lett. 2020, 19, 1789–1798. [Google Scholar] [CrossRef] [Green Version]
- Wu, Y.; Li, Q.; Zhou, X.; Yu, J.; Mu, Y.; Munker, S.; Xu, C.; Shen, Z.; Müllenbach, R.; Liu, Y.; et al. Decreased Levels of Active SMAD2 Correlate with Poor Prognosis in Gastric Cancer. PLoS ONE 2012, 7, e35684. [Google Scholar] [CrossRef] [Green Version]
- Zhang, H.-W.; Guo, Y.; Sun, L.; Ni, F.; Xu, K. Prognostic Value of Small Mother against Decapentaplegic Expression in Human Gastric Cancer. Bioengineered 2021, 12, 2534–2549. [Google Scholar] [CrossRef]
- Itoh, F.; Divecha, N.; Brocks, L.; Oomen, L.; Janssen, H.; Calafat, J.; Itoh, S.; ten Dijke, P. The FYVE Domain in Smad Anchor for Receptor Activation (SARA) Is Sufficient for Localization of SARA in Early Endosomes and Regulates TGF-Beta/Smad Signalling. Genes Cells 2002, 7, 321–331. [Google Scholar] [CrossRef] [PubMed]
- He, J.; Vora, M.; Haney, R.M.; Filonov, G.S.; Musselman, C.A.; Burd, C.G.; Kutateladze, A.G.; Verkhusha, V.V.; Stahelin, R.V.; Kutateladze, T.G. Membrane Insertion of the FYVE Domain Is Modulated by PH. Proteins 2009, 76, 852–860. [Google Scholar] [CrossRef] [PubMed] [Green Version]
- Lucien, F.; Harper, K.; Pelletier, P.-P.; Volkov, L.; Dubois, C.M. Simultaneous pH Measurement in Endocytic and Cytosolic Compartments in Living Cells Using Confocal Microscopy. J. Vis. Exp. 2014, 86, e51395. [Google Scholar] [CrossRef] [PubMed] [Green Version]
- Panopoulou, E.; Gillooly, D.J.; Wrana, J.L.; Zerial, M.; Stenmark, H.; Murphy, C.; Fotsis, T. Early Endosomal Regulation of Smad-Dependent Signaling in Endothelial Cells. J. Biol. Chem. 2002, 277, 18046–18052. [Google Scholar] [CrossRef] [Green Version]
- Bakkebø, M.; Huse, K.; Hilden, V.I.; Forfang, L.; Myklebust, J.H.; Smeland, E.B.; Oksvold, M.P. SARA Is Dispensable for Functional TGF-β Signaling. FEBS Lett. 2012, 586, 3367–3372. [Google Scholar] [CrossRef] [Green Version]
- Rozés-Salvador, V.; Wilson, C.; Olmos, C.; Gonzalez-Billault, C.; Conde, C. Fine-Tuning the TGFβ Signaling Pathway by SARA During Neuronal Development. Front. Cell Dev. Biol. 2020, 8, 550267. [Google Scholar] [CrossRef]
- Huang, C.; Du, R.; Zhang, P.; Meng, H.; Jia, H.; Song, Y.; Li, M.; Zhang, Y.; Sun, S. Expression, Purification, and Functional Characterization of Recombinant PTD-SARA. Acta Biochim. Biophys. Sin. 2011, 43, 110–117. [Google Scholar] [CrossRef] [Green Version]
- Zhao, B.M.; Hoffmann, F.M. Inhibition of Transforming Growth Factor-Beta1-Induced Signaling and Epithelial-to-Mesenchymal Transition by the Smad-Binding Peptide Aptamer Trx-SARA. Mol. Biol. Cell 2006, 17, 3819–3831. [Google Scholar] [CrossRef] [Green Version]
- Richardson, A.M.; Havel, L.S.; Koyen, A.E.; Konen, J.M.; Shupe, J.; Wiles, W.G.; Martin, W.D.; Grossniklaus, H.E.; Sica, G.; Gilbert-Ross, M.; et al. Vimentin Is Required for Lung Adenocarcinoma Metastasis via Heterotypic Tumor Cell-Cancer-Associated Fibroblast Interactions during Collective Invasion. Clin. Cancer Res. 2018, 24, 420–432. [Google Scholar] [CrossRef] [Green Version]
- Liu, S.; Liu, L.; Ye, W.; Ye, D.; Wang, T.; Guo, W.; Liao, Y.; Xu, D.; Song, H.; Zhang, L.; et al. High Vimentin Expression Associated with Lymph Node Metastasis and Predicated a Poor Prognosis in Oral Squamous Cell Carcinoma. Sci. Rep. 2016, 6, 38834. [Google Scholar] [CrossRef]
- Wang, R.; Du, X.; Zhi, Y. Screening of Critical Genes Involved in Metastasis and Prognosis of High-Grade Serous Ovarian Cancer by Gene Expression Profile Data. J. Comput. Biol. 2020, 27, 1104–1114. [Google Scholar] [CrossRef]
- Liu, H.; Dai, X.; Cao, X.; Yan, H.; Ji, X.; Zhang, H.; Shen, S.; Si, Y.; Zhang, H.; Chen, J.; et al. PRDM4 Mediates YAP-Induced Cell Invasion by Activating Leukocyte-Specific Integrin Β2 Expression. EMBO Rep. 2018, 19, e45180. [Google Scholar] [CrossRef] [PubMed]
- Wang, A.; Chen, M.; Wang, H.; Huang, J.; Bao, Y.; Gan, X.; Liu, B.; Lu, X.; Wang, L. Cell Adhesion-Related Molecules Play a Key Role in Renal Cancer Progression by Multinetwork Analysis. Biomed. Res. Int. 2019, 2019, 2325765. [Google Scholar] [CrossRef] [PubMed]
- Zhu, S.; He, C.; Deng, S.; Li, X.; Cui, S.; Zeng, Z.; Liu, M.; Zhao, S.; Chen, J.; Jin, Y.; et al. MiR-548an, Transcriptionally Downregulated by HIF1α/HDAC1, Suppresses Tumorigenesis of Pancreatic Cancer by Targeting Vimentin Expression. Mol. Cancer Ther. 2016, 15, 2209–2219. [Google Scholar] [CrossRef] [PubMed] [Green Version]
- Kong, T.; Eltzschig, H.K.; Karhausen, J.; Colgan, S.P.; Shelley, C.S. Leukocyte Adhesion during Hypoxia Is Mediated by HIF-1-Dependent Induction of Beta2 Integrin Gene Expression. Proc. Natl. Acad. Sci. USA 2004, 101, 10440–10445. [Google Scholar] [CrossRef] [Green Version]
- Liu, T.; Guevara, O.E.; Warburton, R.R.; Hill, N.S.; Gaestel, M.; Kayyali, U.S. Regulation of Vimentin Intermediate Filaments in Endothelial Cells by Hypoxia. Am. J. Physiol. Cell Physiol. 2010, 299, C363–C373. [Google Scholar] [CrossRef] [Green Version]
- Rogel, M.R.; Soni, P.N.; Troken, J.R.; Sitikov, A.; Trejo, H.E.; Ridge, K.M. Vimentin Is Sufficient and Required for Wound Repair and Remodeling in Alveolar Epithelial Cells. FASEB J. 2011, 25, 3873–3883. [Google Scholar] [CrossRef] [PubMed] [Green Version]
- Vasilaki, E.; Papadimitriou, E.; Tajadura, V.; Ridley, A.J.; Stournaras, C.; Kardassis, D. Transcriptional Regulation of the Small GTPase RhoB Gene by TGF{beta}-Induced Signaling Pathways. FASEB J. 2010, 24, 891–905. [Google Scholar] [CrossRef]
- Jang, H.-R.; Shin, S.-B.; Kim, C.-H.; Won, J.-Y.; Xu, R.; Kim, D.-E.; Yim, H. PLK1/Vimentin Signaling Facilitates Immune Escape by Recruiting Smad2/3 to PD-L1 Promoter in Metastatic Lung Adenocarcinoma. Cell Death Differ. 2021, 28, 2745–2764. [Google Scholar] [CrossRef]
- Yoshida, K.; Saito, T.; Kamida, A.; Matsumoto, K.; Saeki, K.; Mochizuki, M.; Sasaki, N.; Nakagawa, T. Transforming Growth Factor-β Transiently Induces Vimentin Expression and Invasive Capacity in a Canine Mammary Gland Tumor Cell Line. Res. Vet. Sci. 2013, 94, 539–541. [Google Scholar] [CrossRef]
- Yoon, S.-O.; Shin, S.; Mercurio, A.M. Hypoxia Stimulates Carcinoma Invasion by Stabilizing Microtubules and Promoting the Rab11 Trafficking of the Alpha6beta4 Integrin. Cancer Res. 2005, 65, 2761–2769. [Google Scholar] [CrossRef] [PubMed] [Green Version]
- Blaschke, F.; Stawowy, P.; Goetze, S.; Hintz, O.; Gräfe, M.; Kintscher, U.; Fleck, E.; Graf, K. Hypoxia Activates Beta(1)-Integrin via ERK 1/2 and P38 MAP Kinase in Human Vascular Smooth Muscle Cells. Biochem. Biophys. Res. Commun. 2002, 296, 890–896. [Google Scholar] [CrossRef]
- Bourseau-Guilmain, E.; Menard, J.A.; Lindqvist, E.; Indira Chandran, V.; Christianson, H.C.; Cerezo Magaña, M.; Lidfeldt, J.; Marko-Varga, G.; Welinder, C.; Belting, M. Hypoxia Regulates Global Membrane Protein Endocytosis through Caveolin-1 in Cancer Cells. Nat. Commun. 2016, 7, 11371. [Google Scholar] [CrossRef] [PubMed]
- Kim, B.-G.; Malek, E.; Choi, S.H.; Ignatz-Hoover, J.J.; Driscoll, J.J. Novel Therapies Emerging in Oncology to Target the TGF-β Pathway. J. Hematol. Oncol. 2021, 14, 55. [Google Scholar] [CrossRef] [PubMed]
- Gómez-Gil, V. Therapeutic Implications of TGFβ in Cancer Treatment: A Systematic Review. Cancers 2021, 13, 379. [Google Scholar] [CrossRef] [PubMed]
- Jinnin, M.; Ihn, H.; Tamaki, K. Characterization of SIS3, a Novel Specific Inhibitor of Smad3, and Its Effect on Transforming Growth Factor-Beta1-Induced Extracellular Matrix Expression. Mol. Pharmacol. 2006, 69, 597–607. [Google Scholar] [CrossRef]
- Kang, J.-H.; Jung, M.-Y.; Yin, X.; Andrianifahanana, M.; Hernandez, D.M.; Leof, E.B. Cell-Penetrating Peptides Selectively Targeting SMAD3 Inhibit Profibrotic TGF-β Signaling. J. Clin. Investig. 2017, 127, 2541–2554. [Google Scholar] [CrossRef] [Green Version]
- Liu, X.; Wang, W.; Hu, H.; Tang, N.; Zhang, C.; Liang, W.; Wang, M. Smad3 Specific Inhibitor, Naringenin, Decreases the Expression of Extracellular Matrix Induced by TGF-Beta1 in Cultured Rat Hepatic Stellate Cells. Pharm. Res. 2006, 23, 82–89. [Google Scholar] [CrossRef]
- Li, J.; Qu, X.; Yao, J.; Caruana, G.; Ricardo, S.D.; Yamamoto, Y.; Yamamoto, H.; Bertram, J.F. Blockade of Endothelial-Mesenchymal Transition by a Smad3 Inhibitor Delays the Early Development of Streptozotocin-Induced Diabetic Nephropathy. Diabetes 2010, 59, 2612–2624. [Google Scholar] [CrossRef] [Green Version]
- Meng, J.; Qin, Y.; Chen, J.; Wei, L.; Huang, X.; Yu, X.; Lan, H. Treatment of Hypertensive Heart Disease by Targeting Smad3 Signaling in Mice. Mol. Ther.-Methods Clin. Dev. 2020, 18, 791–802. [Google Scholar] [CrossRef]
- Lian, G.-Y.; Wang, Q.-M.; Mak, T.S.-K.; Huang, X.-R.; Yu, X.-Q.; Lan, H.-Y. Inhibition of Tumor Invasion and Metastasis by Targeting TGF-β-Smad-MMP2 Pathway with Asiatic Acid and Naringenin. Mol. Ther. Oncolytics 2021, 20, 277–289. [Google Scholar] [CrossRef] [PubMed]


| Construct | Primer Sequence |
|---|---|
| pCMV5b-SMAD2-N381S | |
| Forward | CAAGGGTCGACAATCGTCCATCTTG |
| Mutant forward | GTTCATCTTCAGACTACAGCCTGGTGG |
| Mutant reverse | CCACCAGGCTGTAGTCTGAAGATCAAC |
| Reverse | GATGCCACCCGGGTCTAGATTATGAC |
| pCMV5b-SMAD3-N339S | |
| Forward | CAAGGGTCGACTGTCGTCCATC |
| Mutant forward | GATCTTCAGGCTGCATCCTGGTG |
| Mutant reverse | CACCAGGATGCAGCCTGAAGATC |
| Reverse | GATGCCACCCGGGTCTACACTAAG |
| Gene | Forward Primer Sequence | Reverse Primer Sequence |
|---|---|---|
| SMAD2 | CGAAATGCCACGGTAGAAATG | GGGCTCTGCACAAAGATTG |
| SMAD3 | TCCATCCCCGAAAACACTAAC | CATCTTCACTCAGGTAGCCAG |
| RHOB | ATCCAAGCCTACGACTACCT | AGTTGATGCAGCCGTTCT |
| ITGB2 | GTGAACACGCACCCTGATAA | GGAGTTGTTGGTCAGCTTCA |
| VIM | GATTCACTCCCTCTGGTTGATAC | GTCATCGTGATGCTGAGAAGT |
| RPLP0 | GATTACACCTTCCCACTGC | CCAAATCCCATATCCTCGTCCG |
| SARA | GGATTCTCAGGCTCCAAATTGC | GGCTGAGCCACATTCATTAGC |
| SMAD2 sh | SMAD3 sh | |||
|---|---|---|---|---|
| Gene | Fold Regulation | p-Value | Fold Regulation | p-Value |
| SMAD3 regulated genes | ||||
| RHOB | 1.54 | ns | 1.58 | 0.002 |
| ITGB2 | −1.28 | ns | −1.80 | 0.013 |
| VIM | −1.25 | 0.009 | −1.53 | 0.001 |
| SMAD2 and SMAD3 regulated genes | ||||
| CSF1 | 1.81 | 0.002 | 2.91 | <0.001 |
| ARF6 | −1.55 | 0.011 | −1.52 | 0.018 |
Publisher’s Note: MDPI stays neutral with regard to jurisdictional claims in published maps and institutional affiliations. |
© 2022 by the authors. Licensee MDPI, Basel, Switzerland. This article is an open access article distributed under the terms and conditions of the Creative Commons Attribution (CC BY) license (https://creativecommons.org/licenses/by/4.0/).
Share and Cite
Brochu-Gaudreau, K.; Charbonneau, M.; Harper, K.; Dubois, C.M. Hypoxia Selectively Increases a SMAD3 Signaling Axis to Promote Cancer Cell Invasion. Cancers 2022, 14, 2751. https://doi.org/10.3390/cancers14112751
Brochu-Gaudreau K, Charbonneau M, Harper K, Dubois CM. Hypoxia Selectively Increases a SMAD3 Signaling Axis to Promote Cancer Cell Invasion. Cancers. 2022; 14(11):2751. https://doi.org/10.3390/cancers14112751
Chicago/Turabian StyleBrochu-Gaudreau, Karine, Martine Charbonneau, Kelly Harper, and Claire M. Dubois. 2022. "Hypoxia Selectively Increases a SMAD3 Signaling Axis to Promote Cancer Cell Invasion" Cancers 14, no. 11: 2751. https://doi.org/10.3390/cancers14112751