
Disentangling ERBB Signaling in Breast Cancer Subtypes—A Model-Based Analysis

 , , ,
, , ,  , , and
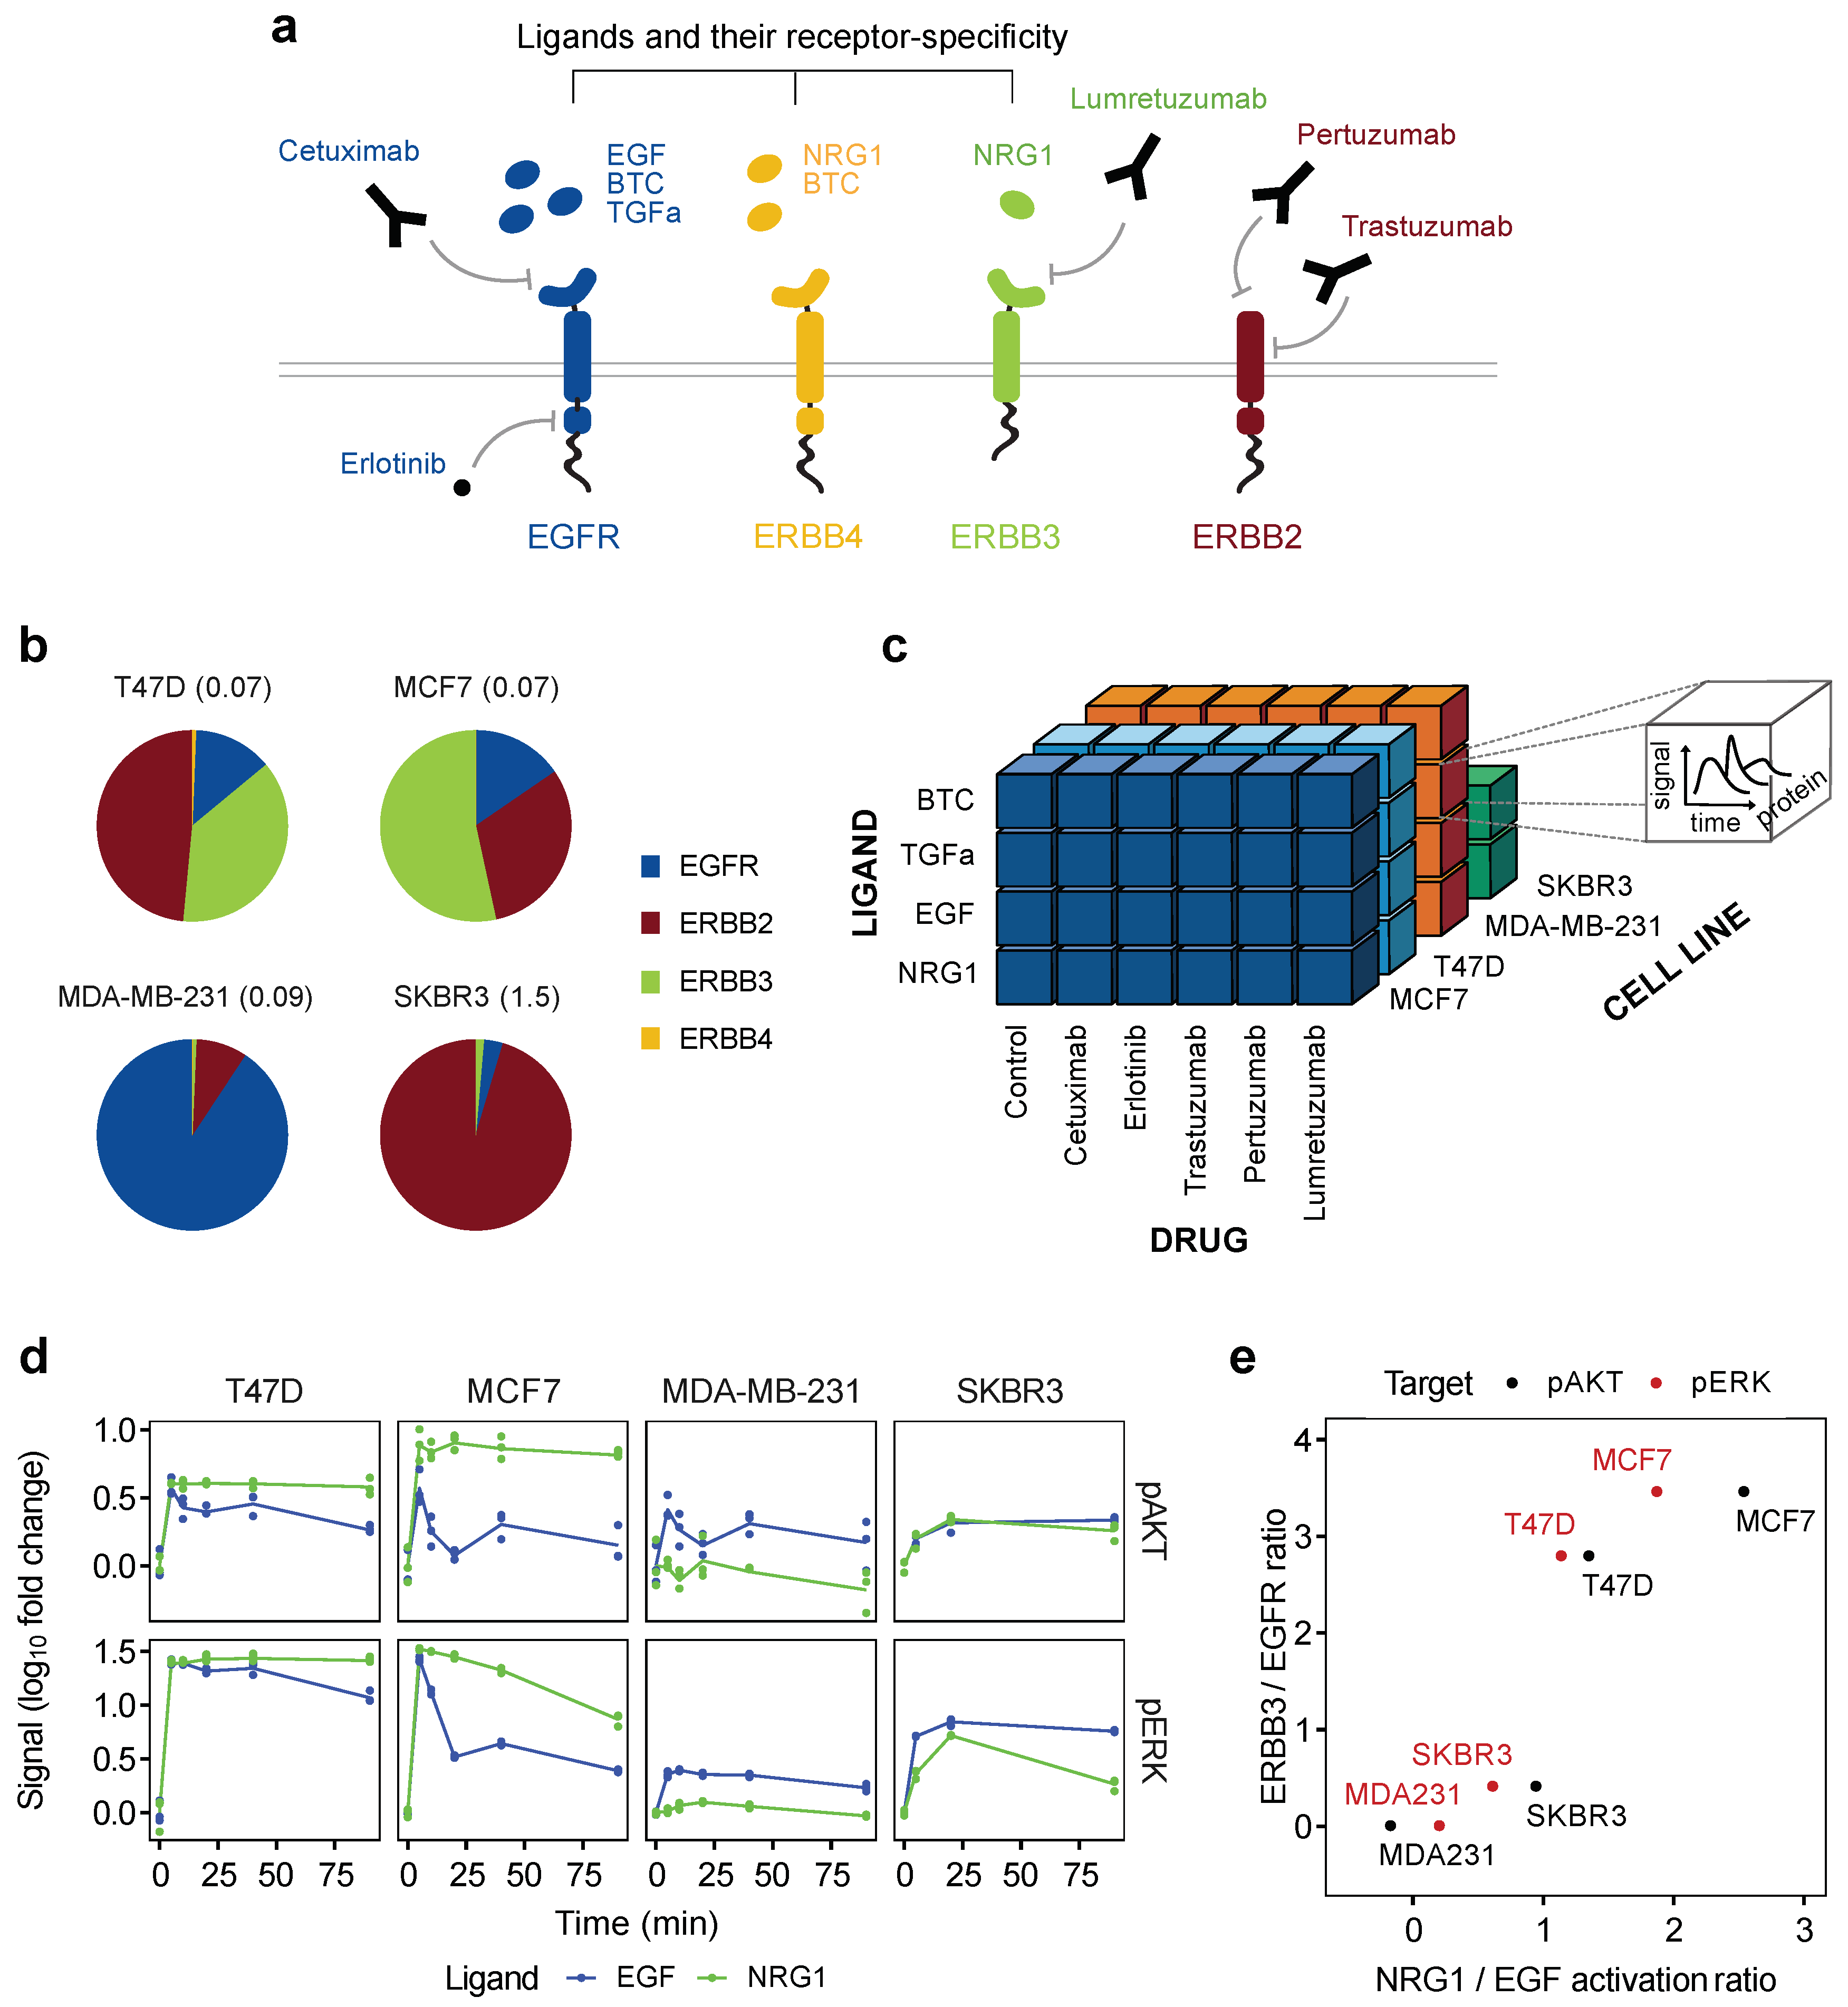
Abstract
:Simple Summary
Abstract
1. Introduction
2. Materials and Methods
2.1. Cell Culture
2.2. Antibodies, Drugs and Ligands
2.3. Time-Resolved Experiments
2.4. Reverse Phase Protein Array (RPPA)
2.5. Viability Assays
2.6. Mechanistic Modeling
2.7. Parameter Estimation and Uncertainty Analysis
2.8. Regression Modeling
2.9. Growth Predictions
2.10. L1 Regularization for ODE Models
2.11. Flux Analysis
3. Results
3.1. ERBB Downstream Activation Correlates with Receptor Composition
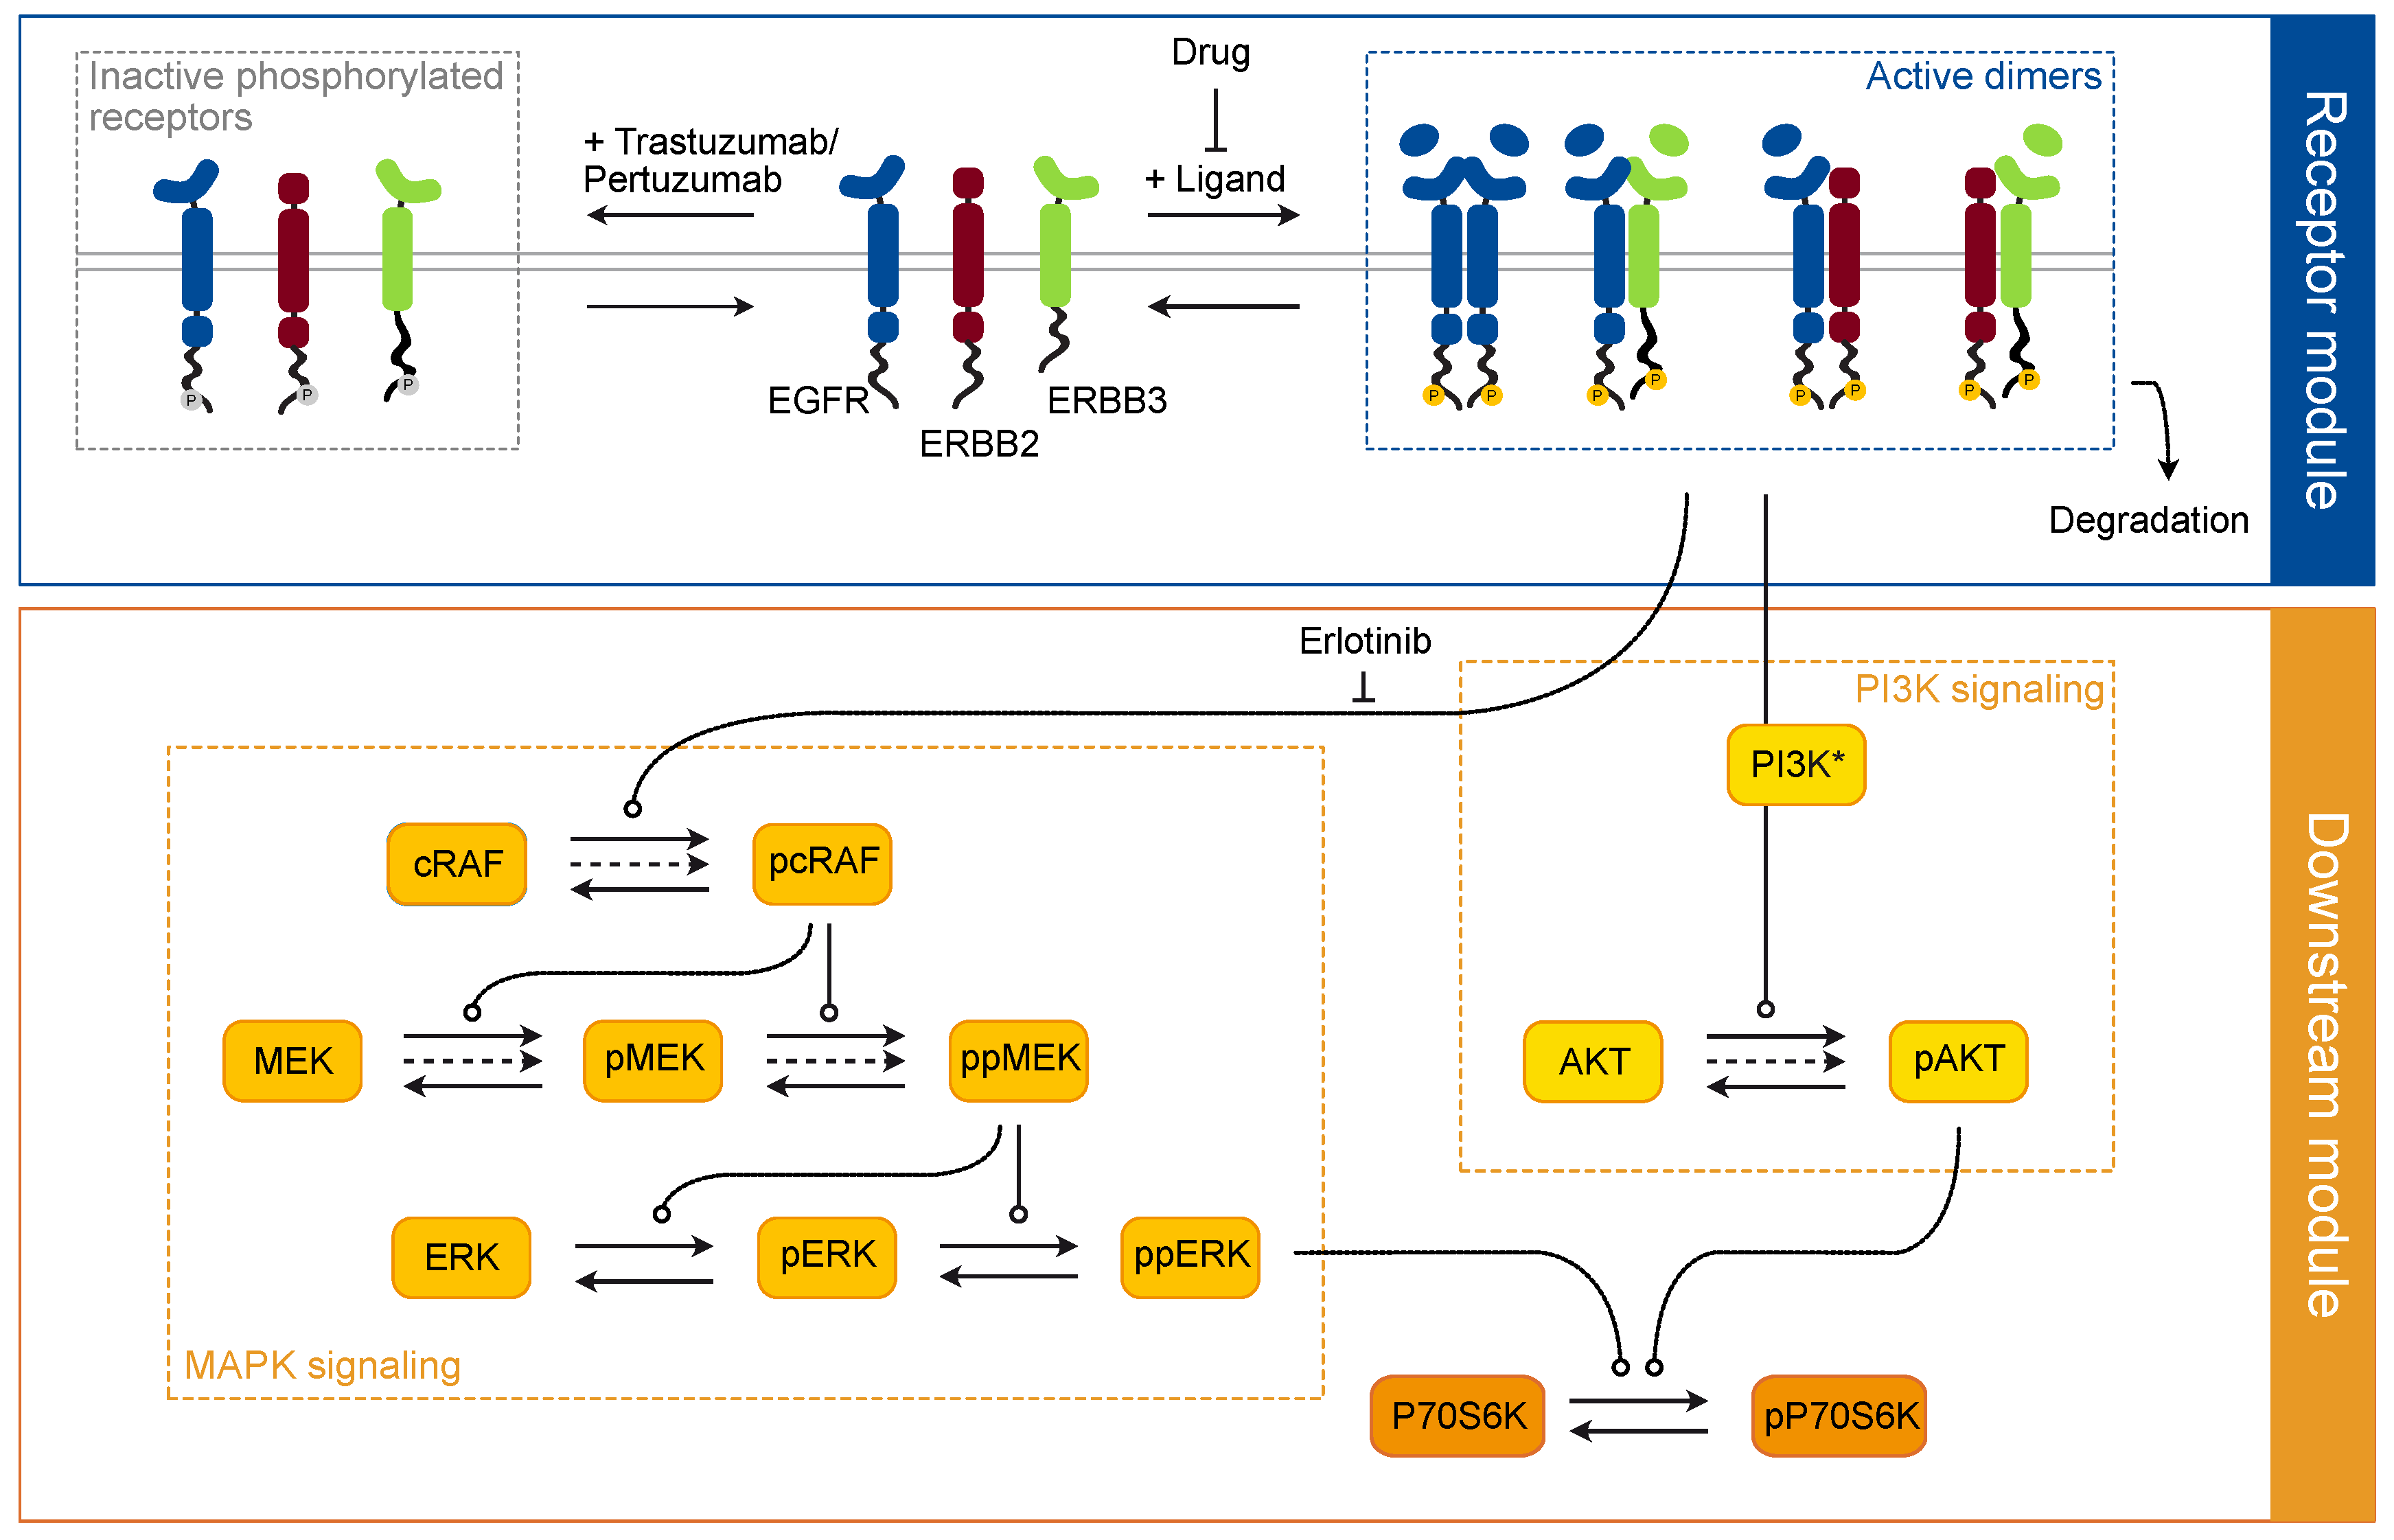
3.2. Development of a Mechanistic Model of the ERBB Signaling Network
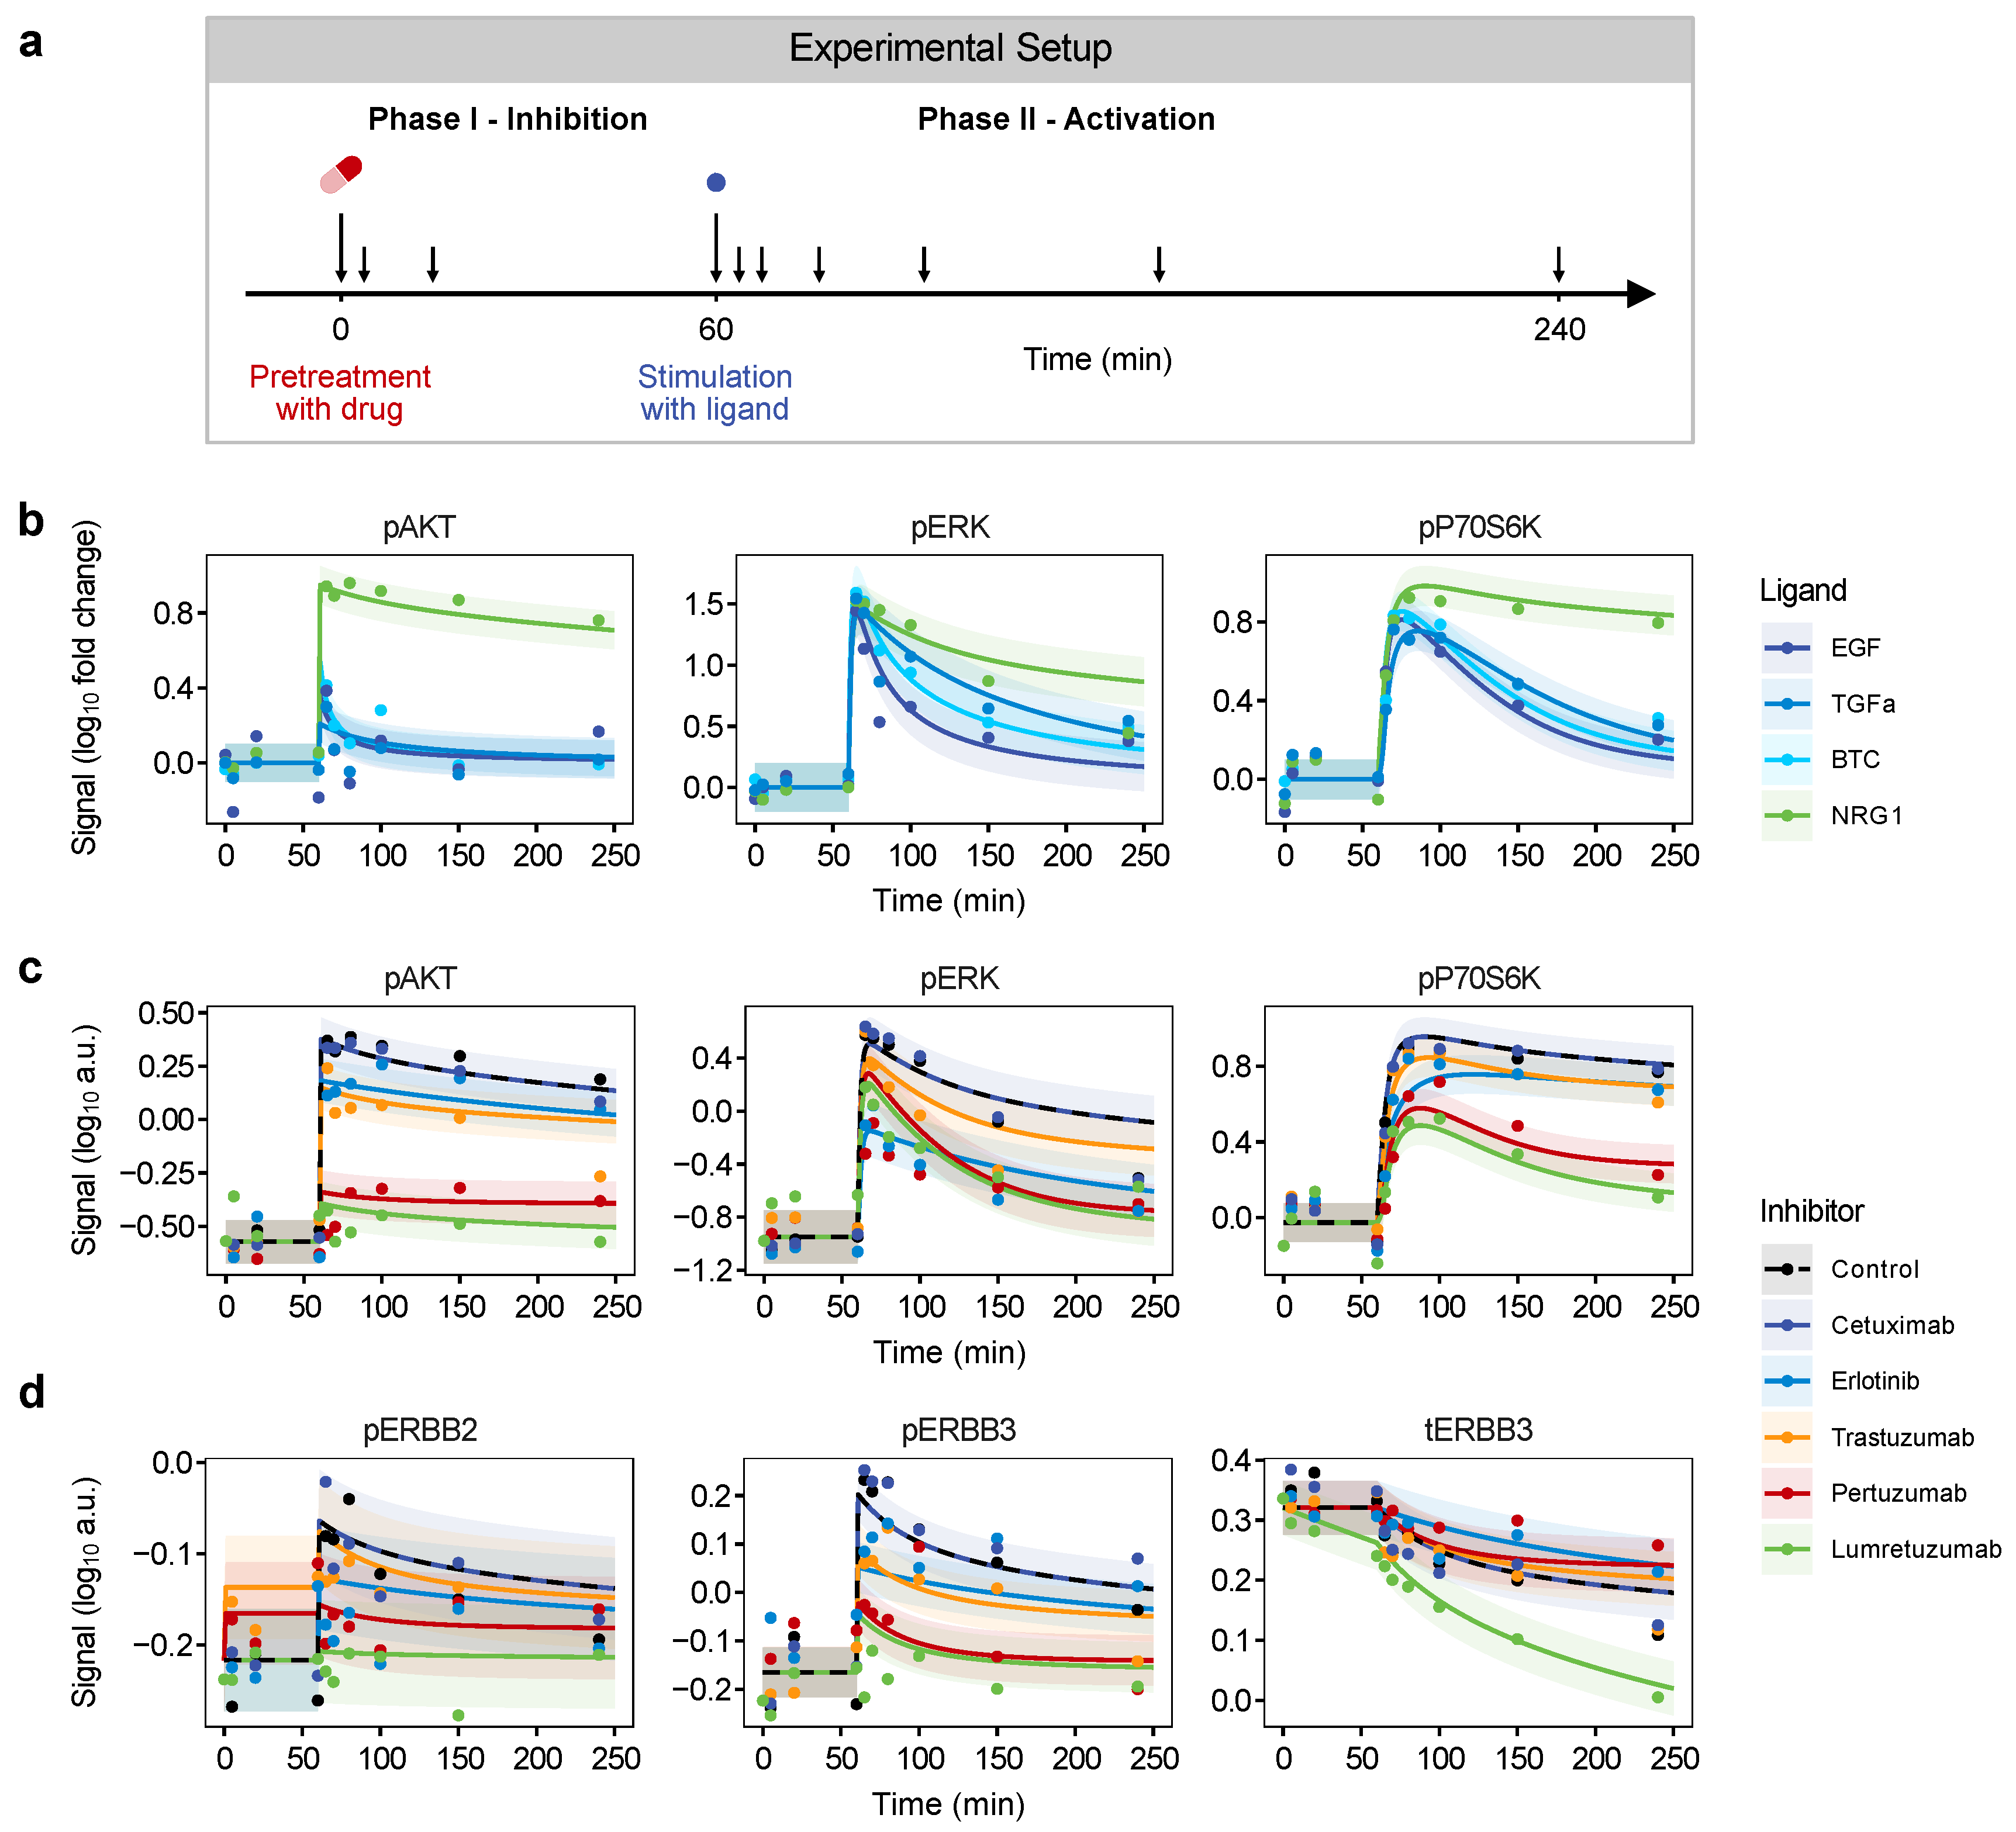
3.3. Impact of ERBB Inhibitors
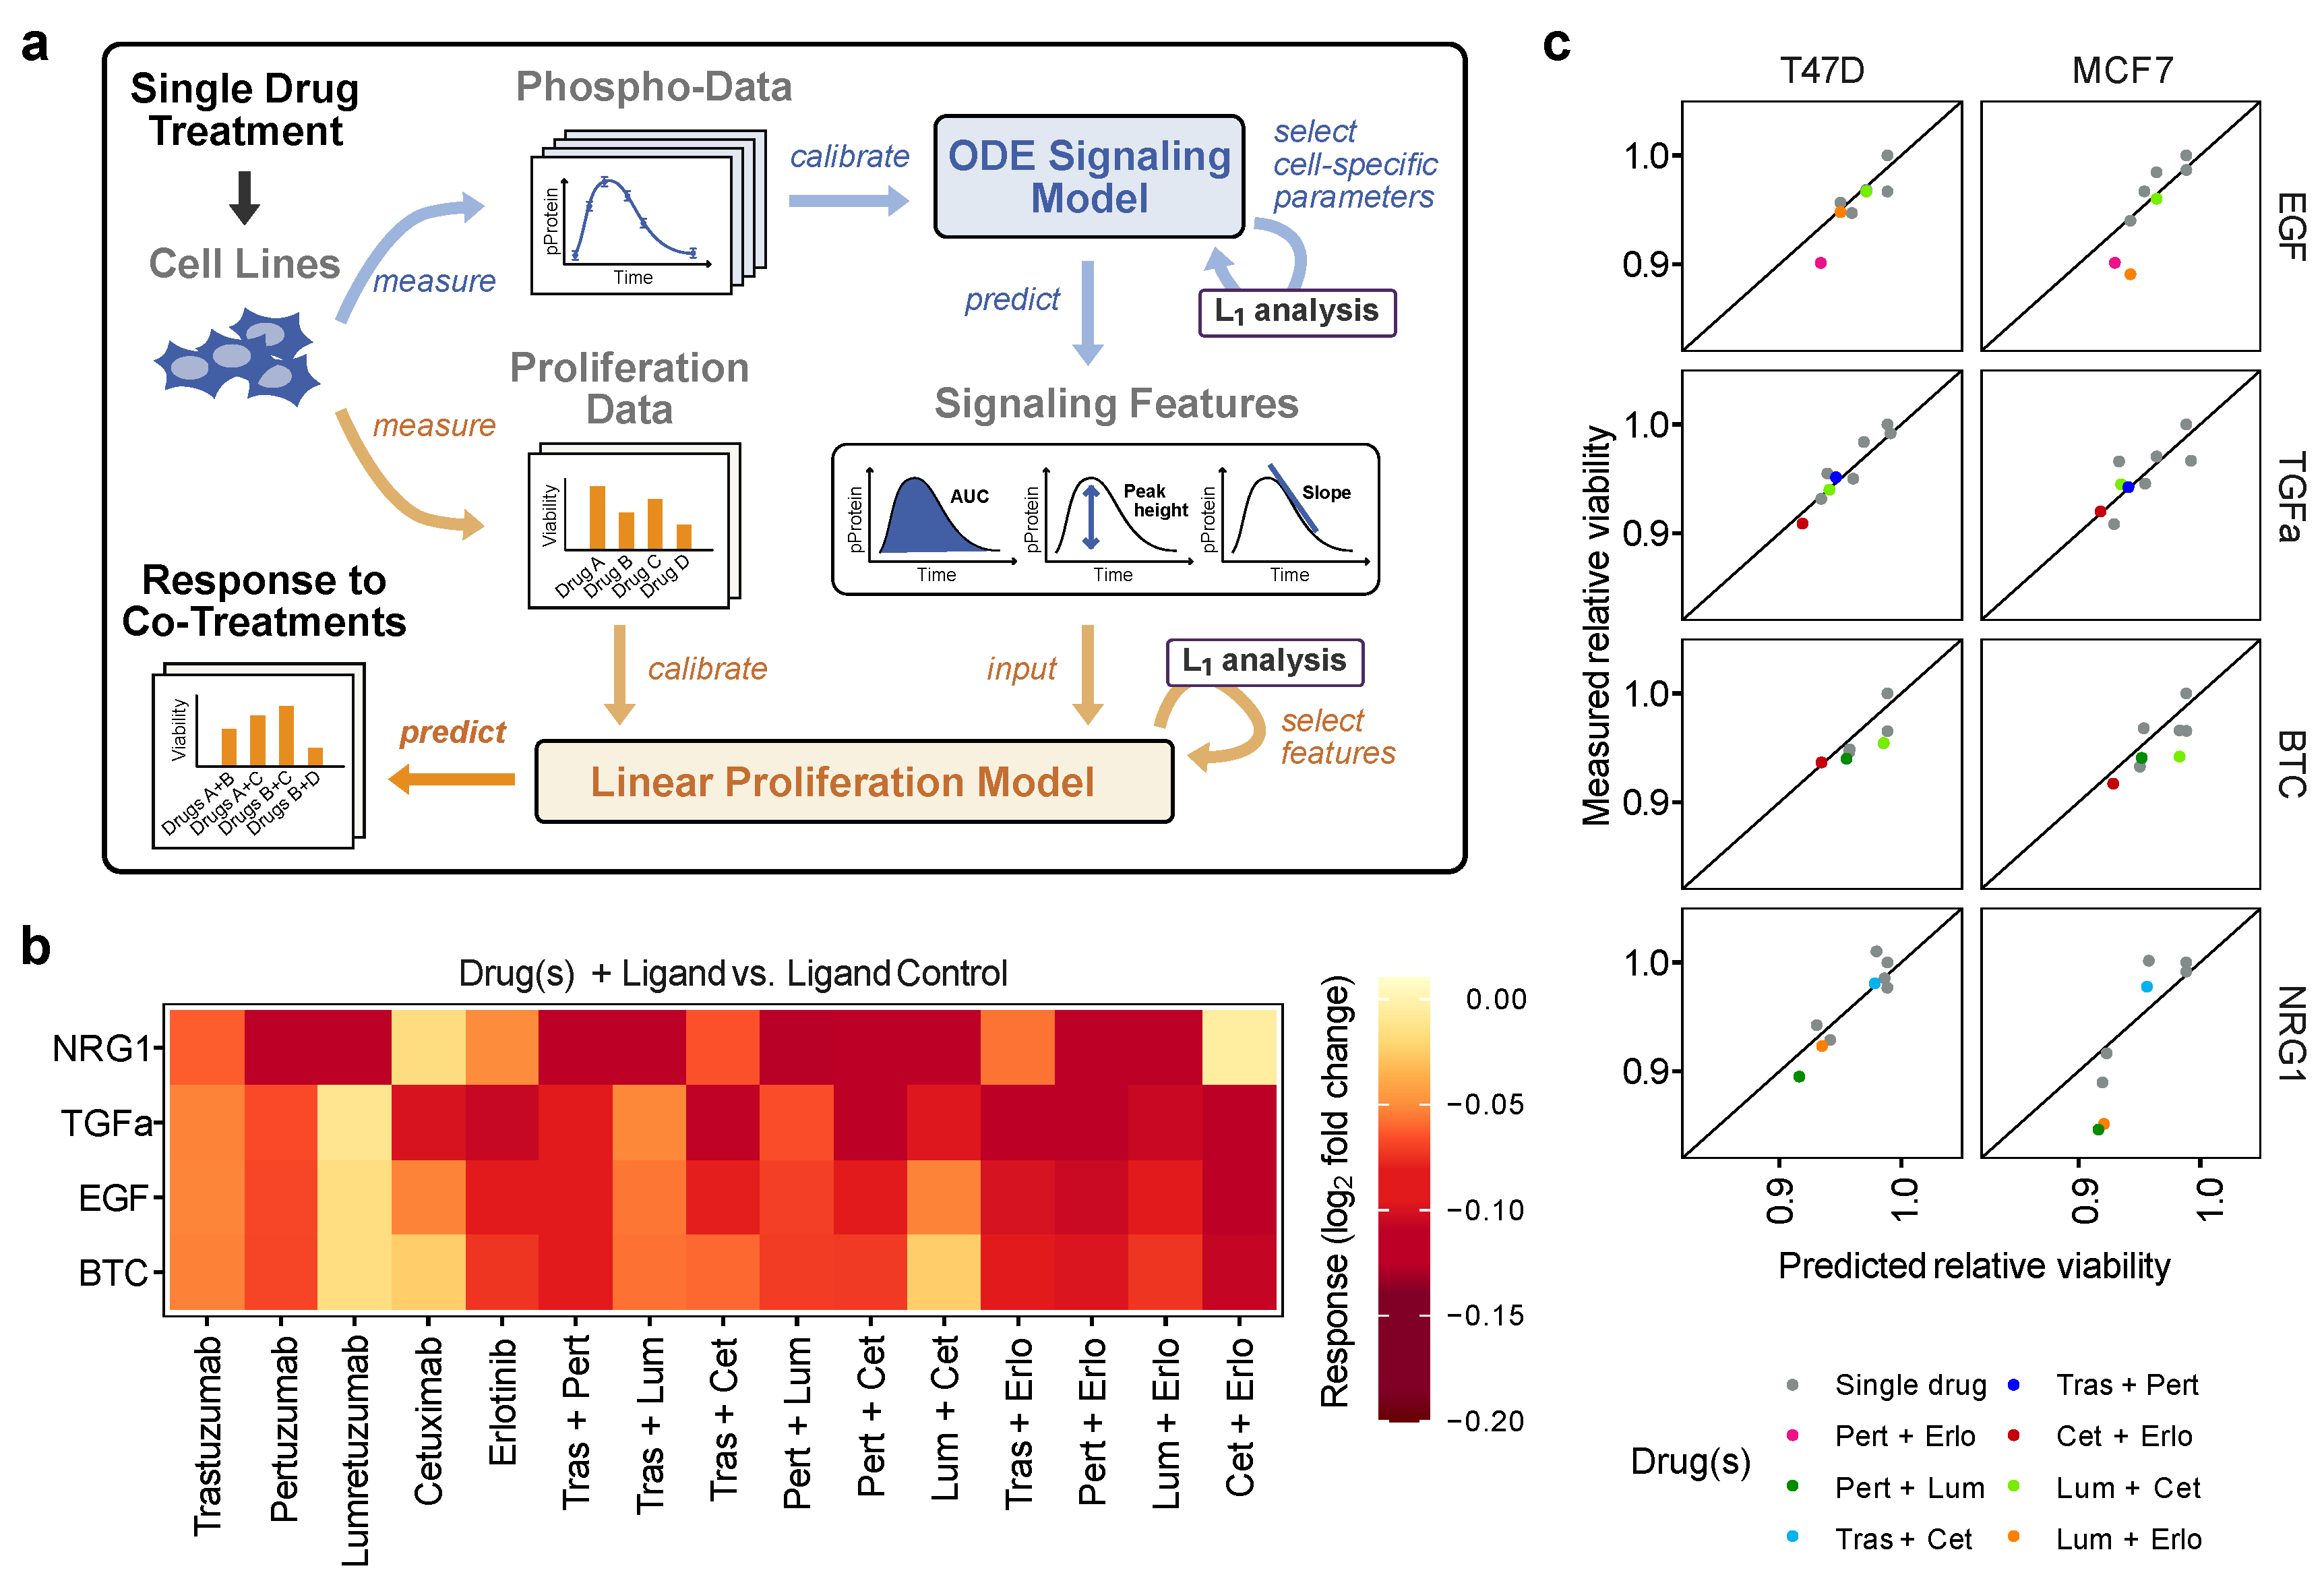
3.4. Predicting Drug Effects on Ligand-Dependent Proliferation
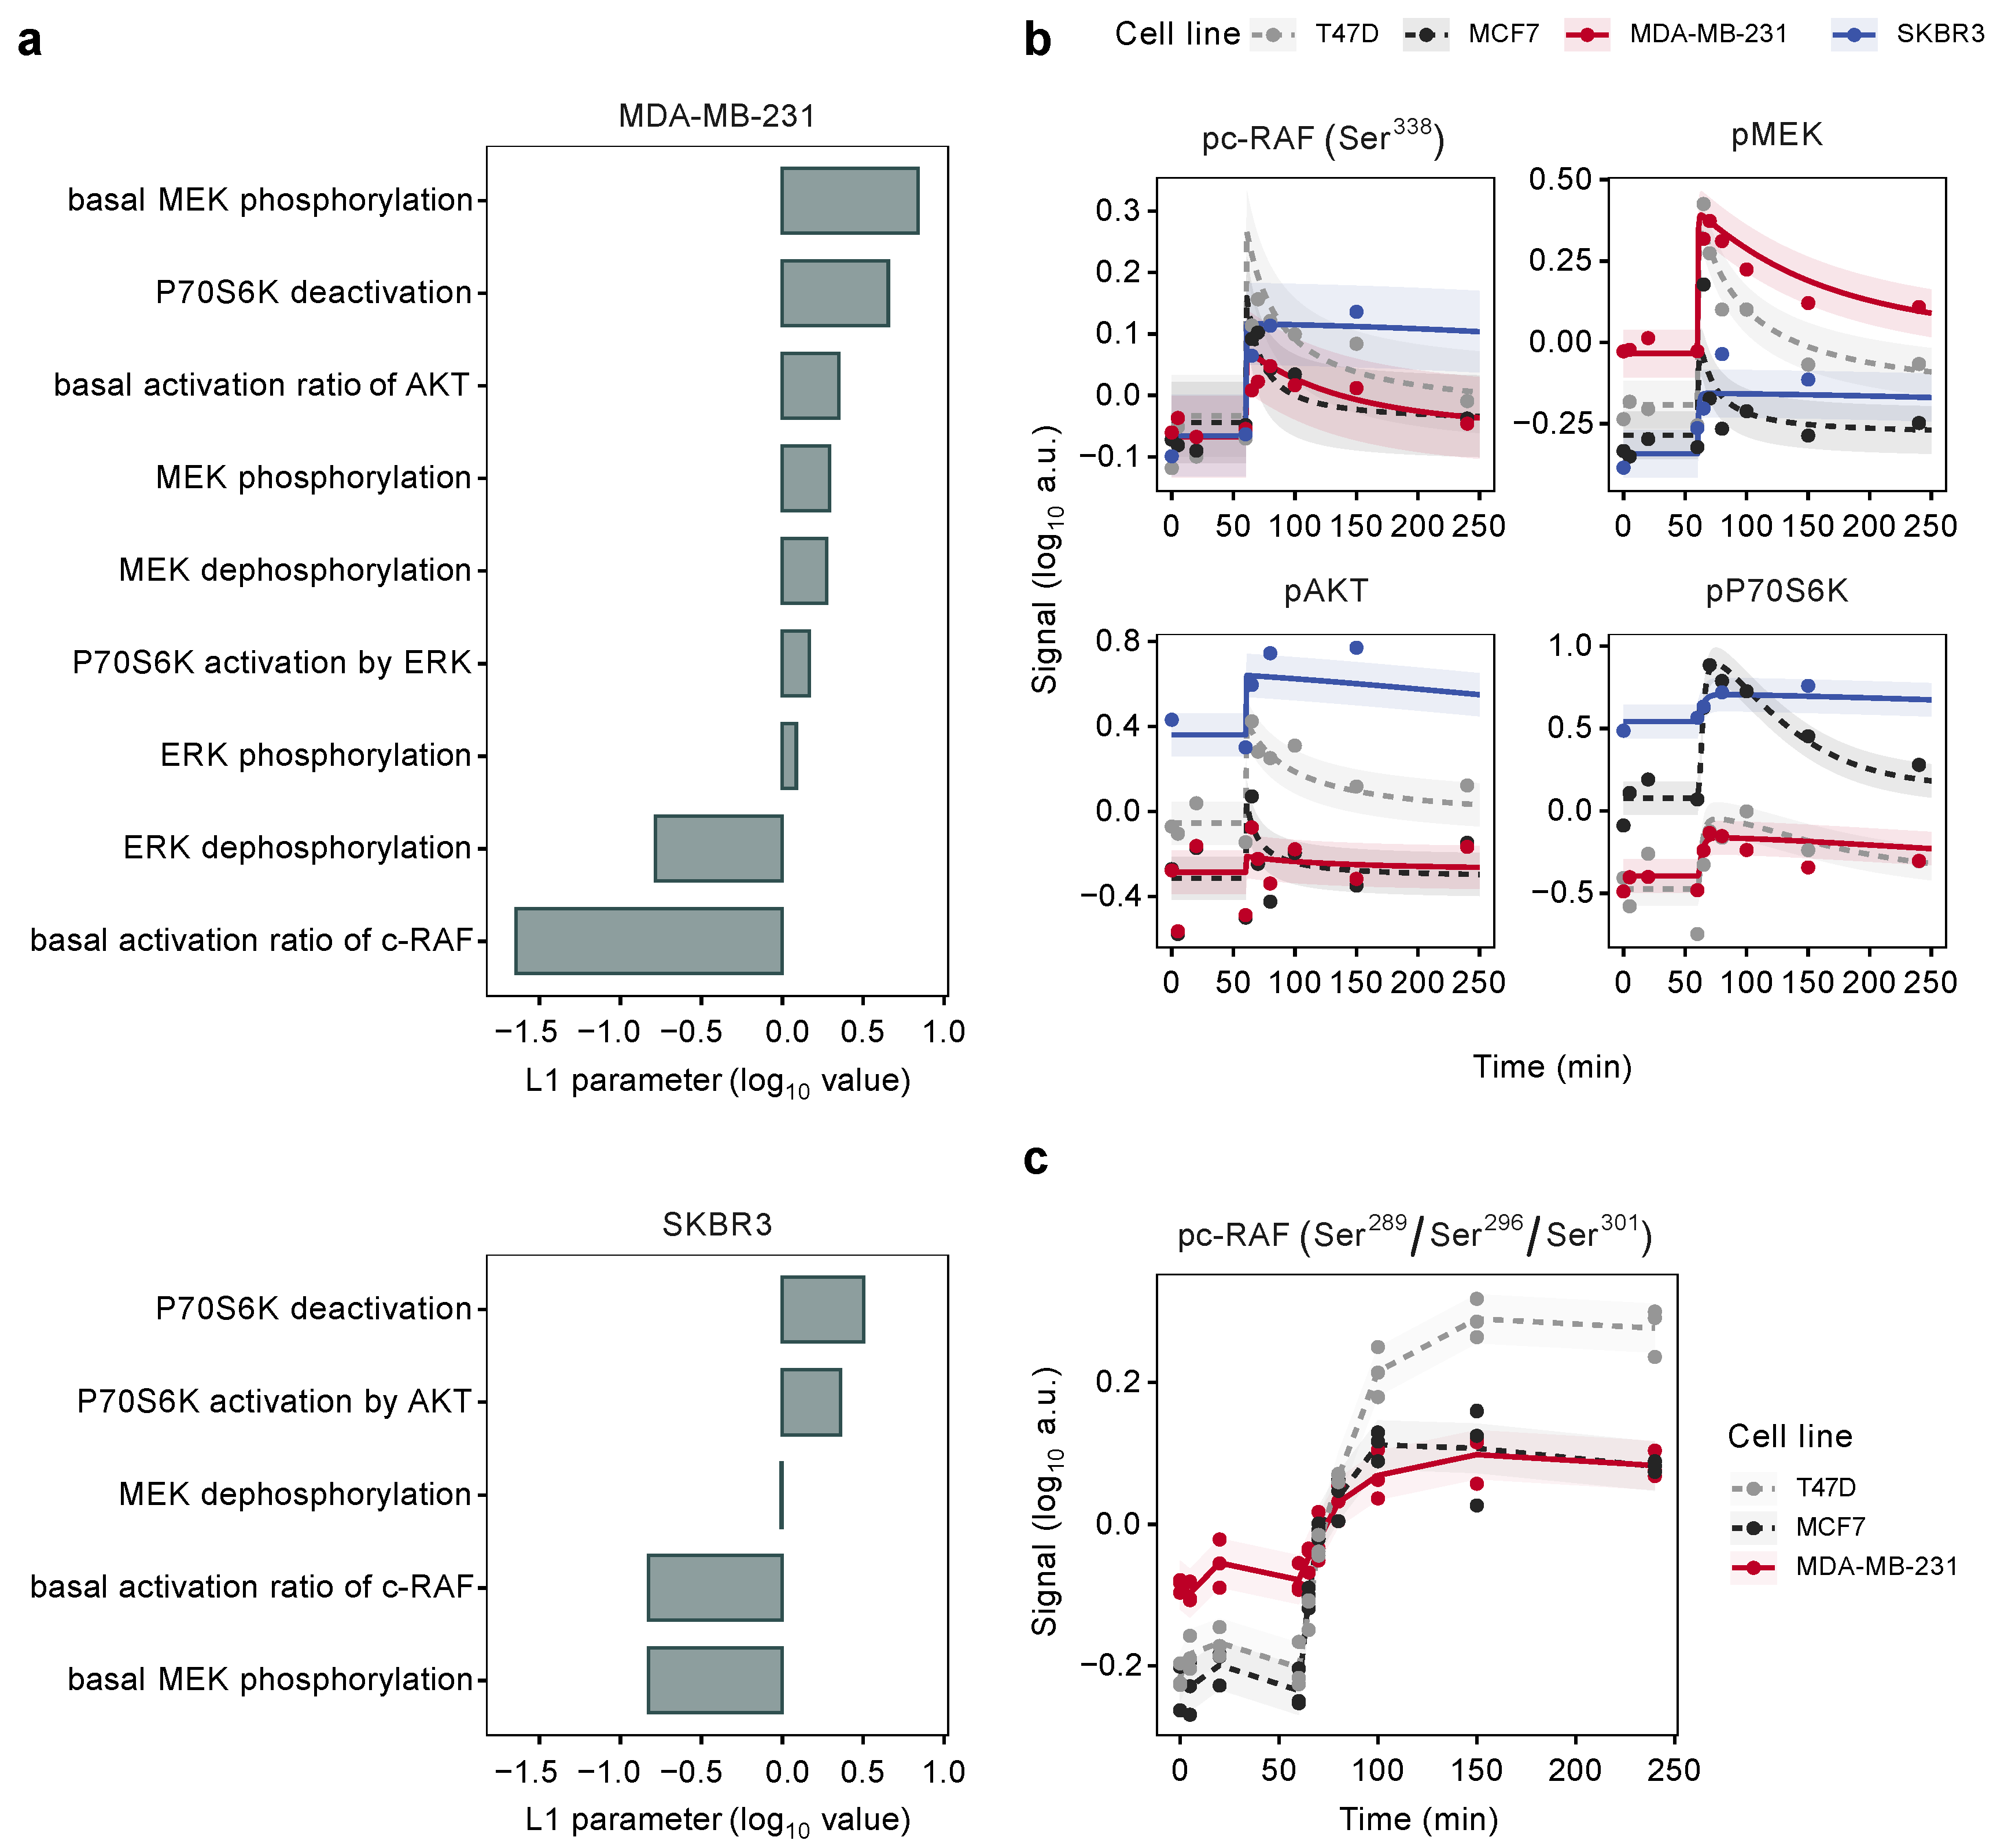
3.5. Model-Based Analysis of Cell Line-Specific Activation Kinetics beyond the Luminal Subtype
3.6. Mutation States Impact the Dynamics of Signaling
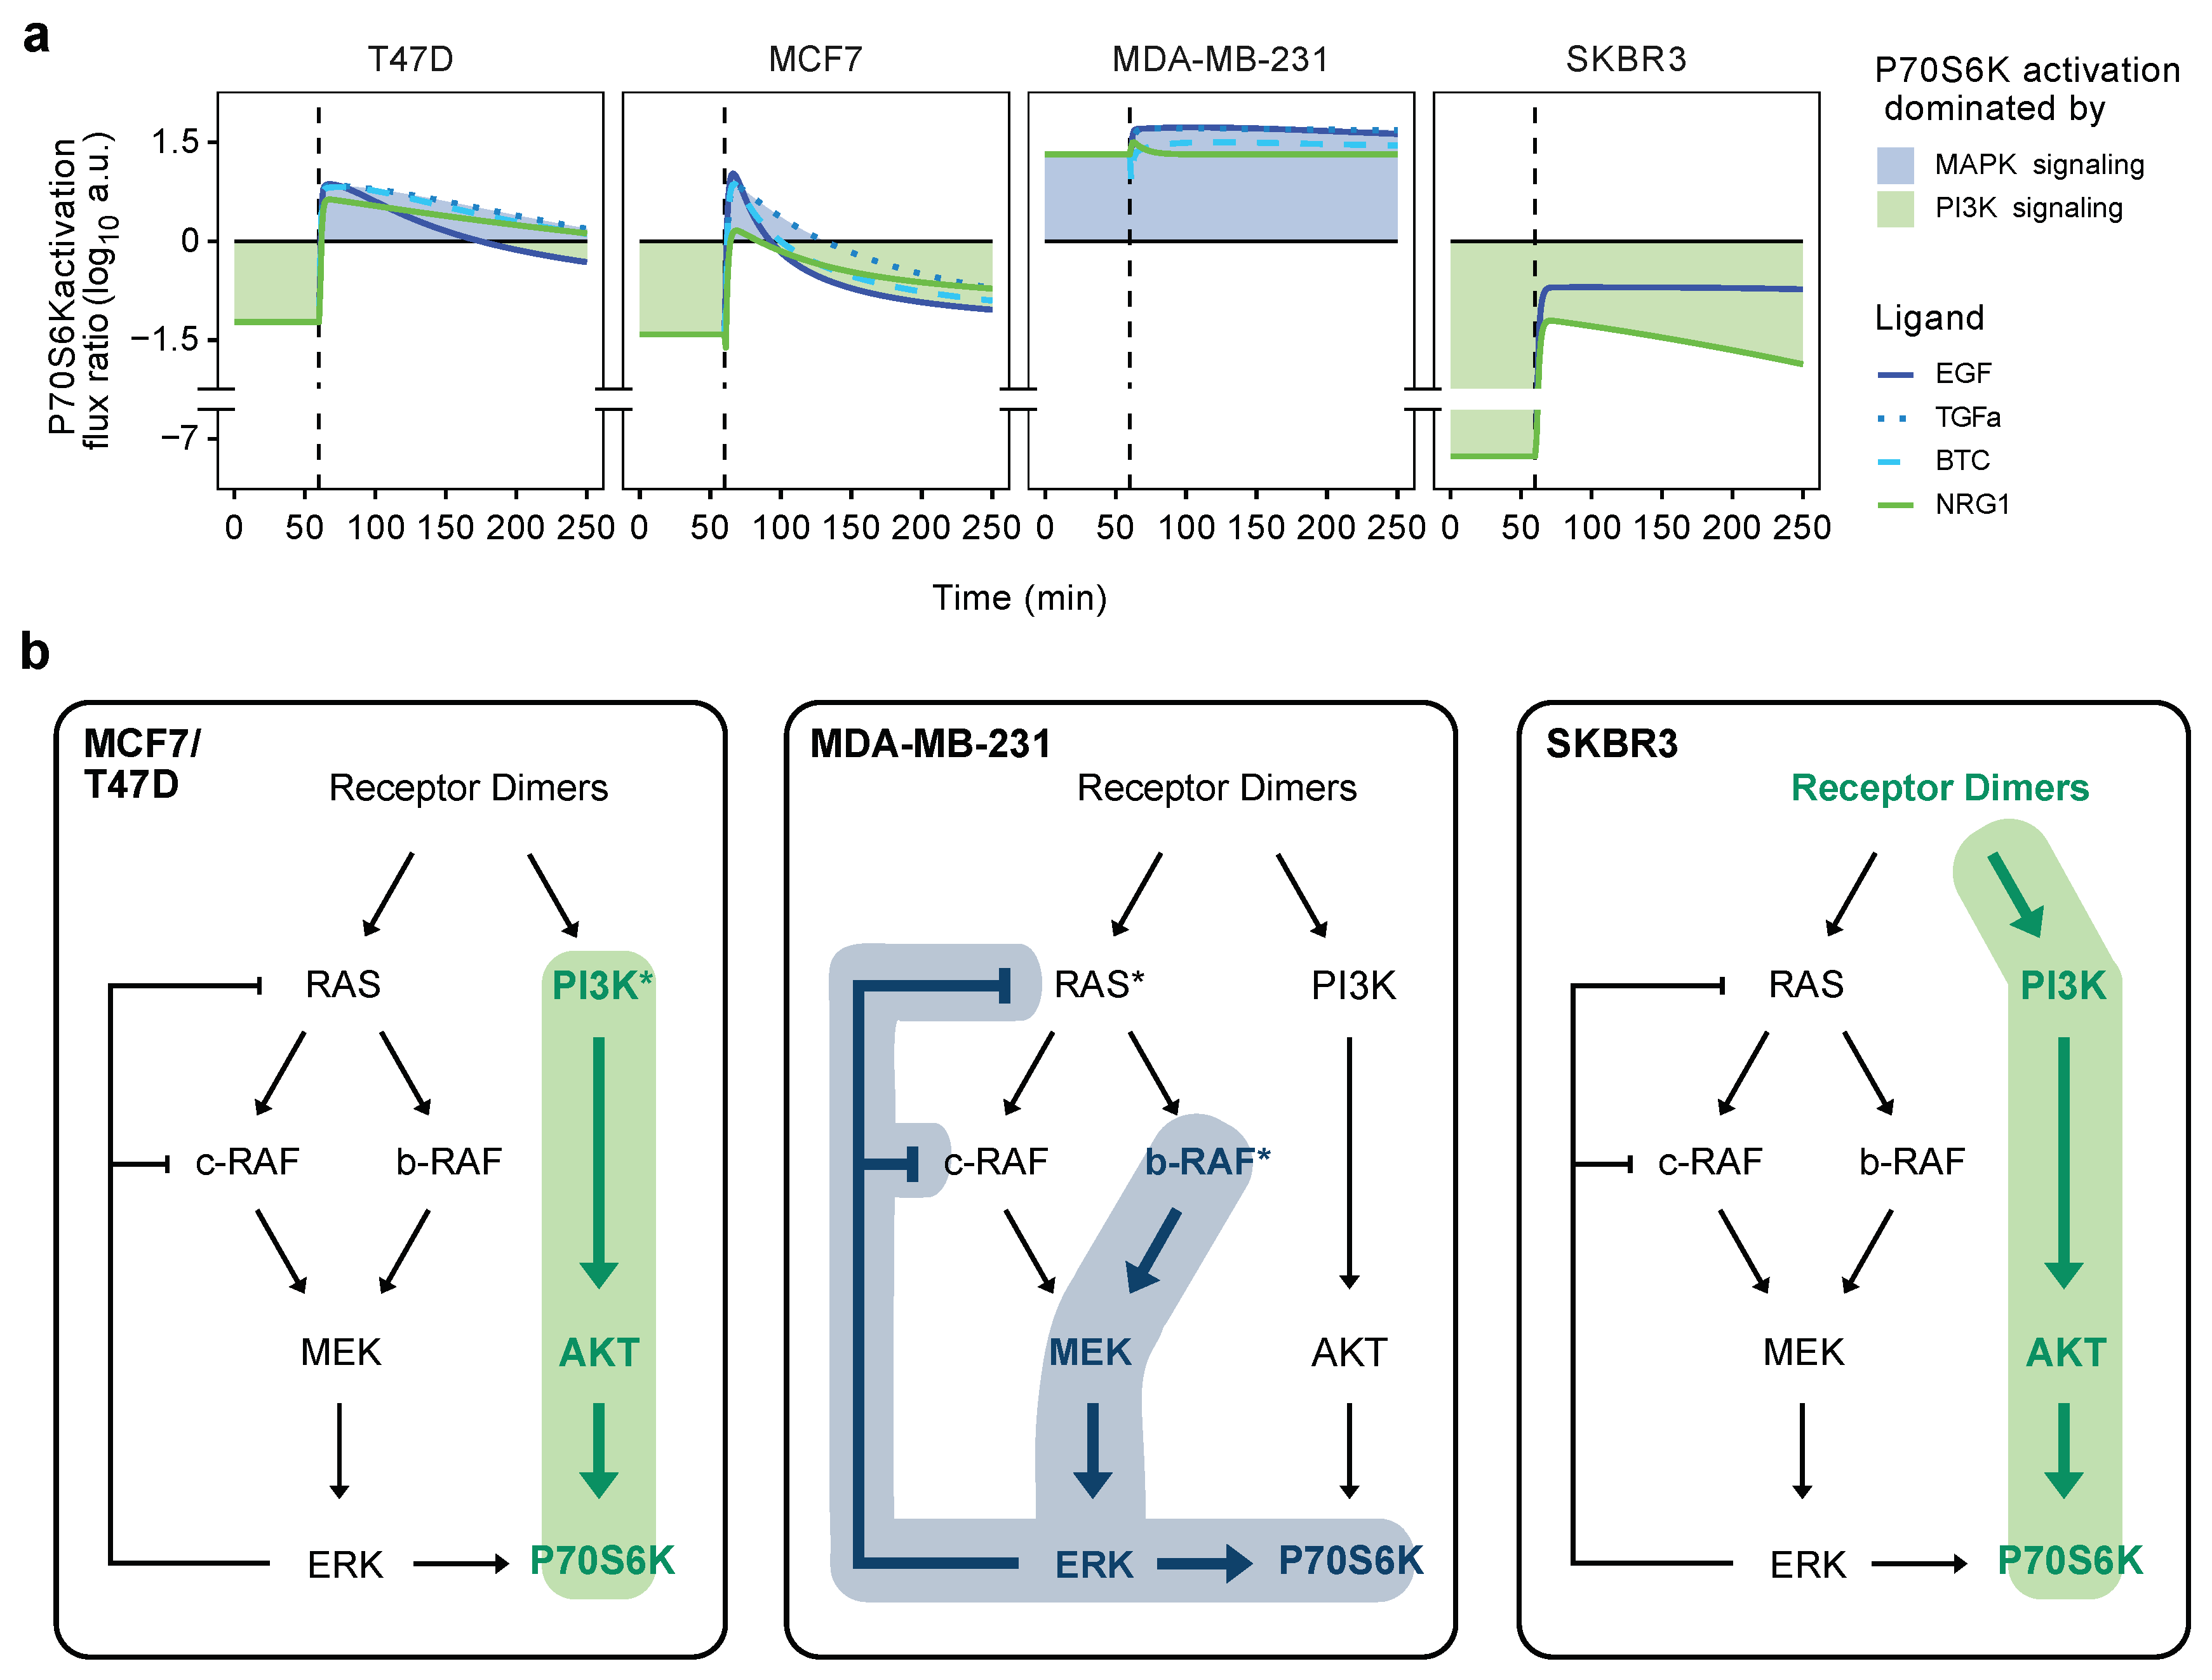
3.7. Flux-Analysis of MAPK versus AKT Signaling
4. Discussion
5. Conclusions
Supplementary Materials
Author Contributions
Funding
Institutional Review Board Statement
Informed Consent Statement
Data Availability Statement
Acknowledgments
Conflicts of Interest
References
- Amit, I.; Wides, R.; Yarden, Y. Evolvable signaling networks of receptor tyrosine kinases: Relevance of robustness to malignancy and to cancer therapy. Mol. Syst. Biol. 2007, 3, 151. [Google Scholar] [CrossRef] [PubMed]
- Yarden, Y.; Sliwkowski, M.X. Untangling the ErbB signalling network. Nat. Rev. Mol. Cell Biol. 2001, 2, 127–137. [Google Scholar] [CrossRef] [PubMed]
- Slamon, D.J.; Leyland-Jones, B.; Shak, S.; Fuchs, H.; Paton, V.; Bajamonde, A.; Fleming, T.; Eiermann, W.; Wolter, J.; Pegram, M.; et al. Use of chemotherapy plus a monoclonal antibody against HER2 for metastatic breast cancer that overexpresses HER2. N. Engl. J. Med. 2001, 344, 783–792. [Google Scholar] [CrossRef] [PubMed]
- Petrelli, F.; Cabiddu, M.; Cazzaniga, M.E.; Cremonesi, M.; Barni, S. Targeted Therapies for the Treatment of Breast Cancer in the Post-trastuzumab Era. Oncologist 2008, 13, 373–381. [Google Scholar] [CrossRef] [Green Version]
- Sørlie, T. Molecular portraits of breast cancer: Tumour subtypes as distinct disease entities. Eur. J. Cancer 2004, 40, 2667–2675. [Google Scholar] [CrossRef]
- Yarden, Y.; Pines, G. The ERBB network: At last, cancer therapy meets systems biology. Nat. Rev. Cancer 2012, 12, 553–563. [Google Scholar] [CrossRef]
- Roskoski, R. The ErbB/HER family of protein-tyrosine kinases and cancer. Pharmacol. Res. 2014, 79, 34–74. [Google Scholar] [CrossRef]
- Franklin, M.C.; Carey, K.D.; Vajdos, F.F.; Leahy, D.J.; de Vos, A.M.; Sliwkowski, M.X. Insights into ErbB signaling from the structure of the ErbB2-pertuzumab complex. Cancer Cell 2004, 5, 317–328. [Google Scholar] [CrossRef] [Green Version]
- Riese, D.J.; van Raaij, T.M.; Plowman, G.D.; Andrews, G.C.; Stern, D.F. The cellular response to neuregulins is governed by complex interactions of the erbB receptor family. Mol. Cell. Biol. 1995, 15, 5770–5776. [Google Scholar] [CrossRef] [Green Version]
- Zhang, H.; Berezov, A.; Wang, Q.; Zhang, G.; Drebin, J.; Murali, R.; Greene, M.I. ErbB receptors: From oncogenes to targeted cancer therapies. J. Clin. Investig. 2007, 117, 2051–2058. [Google Scholar] [CrossRef] [Green Version]
- Wee, P.; Wang, Z. Epidermal Growth Factor Receptor Cell Proliferation Signaling Pathways. Cancers 2017, 9, 52. [Google Scholar] [CrossRef] [PubMed] [Green Version]
- Roskoski, R. RAF protein-serine/threonine kinases: Structure and regulation. Biochem. Biophys. Res. Commun. 2010, 399, 313–317. [Google Scholar] [CrossRef] [PubMed]
- Roskoski, R. MEK1/2 dual-specificity protein kinases: Structure and regulation. Biochem. Biophys. Res. Commun. 2012, 417, 5–10. [Google Scholar] [CrossRef] [PubMed]
- Roskoski, R. ERK1/2 MAP kinases: Structure, function, and regulation. Pharmacol. Res. 2012, 66, 105–143. [Google Scholar] [CrossRef] [PubMed]
- Hers, I.; Vincent, E.E.; Tavaré, J.M. Akt signalling in health and disease. Cell. Signal. 2011, 23, 1515–1527. [Google Scholar] [CrossRef] [PubMed]
- Croce, C.M.; Zhang, K.; Wei, Y. Announcing Signal Transduction and Targeted Therapy. Signal Transduct. Target. Ther. 2016, 1, 15006. [Google Scholar] [CrossRef] [Green Version]
- Seshacharyulu, P.; Ponnusamy, M.P.; Haridas, D.; Jain, M.; Ganti, A.K.; Batra, S.K. Targeting the EGFR signaling pathway in cancer therapy. Expert Opin. Ther. Targets 2012, 16, 15–31. [Google Scholar] [CrossRef] [Green Version]
- Tebbutt, N.; Pedersen, M.W.; Johns, T.G. Targeting the ERBB family in cancer: Couples therapy. Nat. Rev. Cancer 2013, 13, 663–673. [Google Scholar] [CrossRef]
- Normanno, N.; Bianco, C.; De Luca, A.; Maiello, M.R.; Salomon, D.S. Target-based agents against ErbB receptors and their ligands: A novel approach to cancer treatment. Endocr.-Relat. Cancer 2003, 10, 1–21. [Google Scholar] [CrossRef] [Green Version]
- Mota, J.M.; Collier, K.A.; Barros Costa, R.L.; Taxter, T.; Kalyan, A.; Leite, C.A.; Chae, Y.K.; Giles, F.J.; Carneiro, B.A. A comprehensive review of heregulins, HER3, and HER4 as potential therapeutic targets in cancer. Oncotarget 2017, 8, 89284–89306. [Google Scholar] [CrossRef] [Green Version]
- Jacob, W.; James, I.; Hasmann, M.; Weisser, M. Clinical development of HER3-targeting monoclonal antibodies: Perils and progress. Cancer Treat. Rev. 2018, 68, 111–123. [Google Scholar] [CrossRef] [PubMed]
- Hatakeyama, M.; Kimura, S.; Naka, T.; Kawasaki, T.; Yumoto, N.; Ichikawa, M.; Kim, J.H.; Saito, K.; Saeki, M.; Shirouzu, M.; et al. A computational model on the modulation of mitogen-activated protein kinase (MAPK) and Akt pathways in heregulin-induced ErbB signalling. Biochem. J. 2003, 373, 451–463. [Google Scholar] [CrossRef] [PubMed]
- Shin, S.Y.; Müller, A.K.; Verma, N.; Lev, S.; Nguyen, L.K. Systems modelling of the EGFR-PYK2-c-Met interaction network predicts and prioritizes synergistic drug combinations for triple-negative breast cancer. PLoS Comput. Biol. 2018, 14, e1006192. [Google Scholar] [CrossRef] [PubMed]
- Hass, H.; Masson, K.; Wohlgemuth, S.; Paragas, V.; Allen, J.E.; Sevecka, M.; Pace, E.; Timmer, J.; Stelling, J.; MacBeath, G.; et al. Predicting ligand-dependent tumors from multi-dimensional signaling features. NPJ Syst. Biol. Appl. 2017, 3, 27. [Google Scholar] [CrossRef] [Green Version]
- Faratian, D.; Goltsov, A.; Lebedeva, G.; Sorokin, A.; Moodie, S.; Mullen, P.; Kay, C.; Um, I.H.; Langdon, S.; Goryanin, I.; et al. Systems biology reveals new strategies for personalizing cancer medicine and confirms the role of PTEN in resistance to trastuzumab. Cancer Res. 2009, 69, 6713–6720. [Google Scholar] [CrossRef] [Green Version]
- Kiel, C.; Verschueren, E.; Yang, J.S.; Serrano, L. Integration of protein abundance and structure data reveals competition in the ErbB signaling network. Sci. Signal. 2013, 6, ra109. [Google Scholar] [CrossRef]
- Schoeberl, B.; Eichler-Jonsson, C.; Gilles, E.D.; Müller, G. Computational modeling of the dynamics of the MAP kinase cascade activated by surface and internalized EGF receptors. Nat. Biotechnol. 2002, 20, 370–375. [Google Scholar] [CrossRef]
- Santos, S.D.M.; Verveer, P.J.; Bastiaens, P.I.H. Growth factor-induced MAPK network topology shapes Erk response determining PC-12 cell fate. Nat. Cell Biol. 2007, 9, 324–330. [Google Scholar] [CrossRef]
- Shin, S.Y.; Rath, O.; Choo, S.M.; Fee, F.; McFerran, B.; Kolch, W.; Cho, K.H. Positive- and negative-feedback regulations coordinate the dynamic behavior of the Ras-Raf-MEK-ERK signal transduction pathway. J. Cell Sci. 2009, 122, 425–435. [Google Scholar] [CrossRef] [Green Version]
- Kiel, C.; Serrano, L. Cell type-specific importance of ras-c-raf complex association rate constants for MAPK signaling. Sci. Signal. 2009, 2, ra38. [Google Scholar] [CrossRef] [Green Version]
- Tognetti, M.; Gabor, A.; Yang, M.; Cappelletti, V.; Windhager, J.; Rueda, O.M.; Charmpi, K.; Esmaeilishirazifard, E.; Bruna, A.; de Souza, N.; et al. Deciphering the signaling network of breast cancer improves drug sensitivity prediction. Cell Syst. 2021, 12, 401–418.e12. [Google Scholar] [CrossRef] [PubMed]
- Schoeberl, B.; Pace, E.; Howard, S.; Garantcharova, V.; Kudla, A.; Sorger, P.K.; Nielsen, U.B. A Data-Driven Computational Model of the ErbB Receptor Signaling Network. In Proceedings of the 2006 International Conference of the IEEE Engineering in Medicine and Biology Society, New York, NY, USA, 30 August–3 September 2006; pp. 53–54. [Google Scholar] [CrossRef]
- Birtwistle, M.R.; Hatakeyama, M.; Yumoto, N.; Ogunnaike, B.A.; Hoek, J.B.; Kholodenko, B.N. Ligand-dependent responses of the ErbB signaling network: Experimental and modeling analyses. Mol. Syst. Biol. 2007, 3, 144. [Google Scholar] [CrossRef] [PubMed]
- Imoto, H.; Zhang, S.; Okada, M. A Computational Framework for Prediction and Analysis of Cancer Signaling Dynamics from RNA Sequencing Data—Application to the ErbB Receptor Signaling Pathway. Cancers 2020, 12, 2878. [Google Scholar] [CrossRef] [PubMed]
- Eladdadi, A.; Isaacson, D. A Mathematical Model for the Effects of HER2 Overexpression on Cell Proliferation in Breast Cancer. Bull. Math. Biol. 2008, 70, 1707. [Google Scholar] [CrossRef] [PubMed]
- Schoeberl, B.; Pace, E.A.; Fitzgerald, J.B.; Harms, B.D.; Xu, L.; Nie, L.; Linggi, B.; Kalra, A.; Paragas, V.; Bukhalid, R.; et al. Therapeutically Targeting ErbB3: A Key Node in Ligand-Induced Activation of the ErbB Receptor–PI3K Axis. Sci. Signal. 2009, 2, ra31. [Google Scholar] [CrossRef] [PubMed]
- Imoto, H.; Yamashiro, S.; Okada, M. A text-based computational framework for patient -specific modeling for classification of cancers. iScience 2022, 25, 103944. [Google Scholar] [CrossRef]
- Sonntag, J.; Schlüter, K.; Bernhardt, S.; Korf, U. Subtyping of breast cancer using reverse phase protein arrays. Expert Rev. Proteom. 2014, 11, 757–770. [Google Scholar] [CrossRef]
- Sahin, O.; Löbke, C.; Korf, U.; Appelhans, H.; Sültmann, H.; Poustka, A.; Wiemann, S.; Arlt, D. Combinatorial RNAi for quantitative protein network analysis. Proc. Natl. Acad. Sci. USA 2007, 104, 6579–6584. [Google Scholar] [CrossRef] [Green Version]
- von der Heyde, S.; Sonntag, J.; Kaschek, D.; Bender, C.; Bues, J.; Wachter, A.; Timmer, J.; Korf, U.; Beißbarth, T. RPPanalyzer toolbox: An improved R package for analysis of reverse phase protein array data. BioTechniques 2014, 57, 125–135. [Google Scholar] [CrossRef]
- Kemmer, S.; Bang, S.; Rosenblatt, M.; Timmer, J.; Kaschek, D. BlotIt—Optimal alignment of Western blot and qPCR experiments. bioRxiv 2022. [Google Scholar] [CrossRef]
- Rosenblatt, M.; Timmer, J.; Kaschek, D. Customized Steady-State Constraints for Parameter Estimation in Non-Linear Ordinary Differential Equation Models. Front. Cell Dev. Biol. 2016, 4, 41. [Google Scholar] [CrossRef] [PubMed] [Green Version]
- Raue, A.; Kreutz, C.; Maiwald, T.; Bachmann, J.; Schilling, M.; Klingmüller, U.; Timmer, J. Structural and practical identifiability analysis of partially observed dynamical models by exploiting the profile likelihood. Bioinformatics 2009, 25, 1923–1929. [Google Scholar] [CrossRef] [PubMed] [Green Version]
- Maiwald, T.; Hass, H.; Steiert, B.; Vanlier, J.; Engesser, R.; Raue, A.; Kipkeew, F.; Bock, H.H.; Kaschek, D.; Kreutz, C.; et al. Driving the Model to Its Limit: Profile Likelihood Based Model Reduction. PLoS ONE 2016, 11, e0162366. [Google Scholar] [CrossRef] [Green Version]
- Friedman, J.; Hastie, T.; Tibshirani, R. Regularization Paths for Generalized Linear Models via Coordinate Descent. J. Stat. Softw. 2010, 33, 1–22. [Google Scholar] [CrossRef] [PubMed] [Green Version]
- Nami, B.; Maadi, H.; Wang, Z. The Effects of Pertuzumab and Its Combination with Trastuzumab on HER2 Homodimerization and Phosphorylation. Cancers 2019, 11, 375. [Google Scholar] [CrossRef] [Green Version]
- Nami, B.; Maadi, H.; Wang, Z. Mechanisms Underlying the Action and Synergism of Trastuzumab and Pertuzumab in Targeting HER2-Positive Breast Cancer. Cancers 2018, 10, 342. [Google Scholar] [CrossRef] [Green Version]
- Richard, S.; Selle, F.; Lotz, J.P.; Khalil, A.; Gligorov, J.; Soares, D.G. Pertuzumab and trastuzumab: The rationale way to synergy. An. Acad. Bras. Ciênc. 2016, 88, 565–577. [Google Scholar] [CrossRef] [Green Version]
- Goltsov, A.; Deeni, Y.; Khalil, H.S.; Soininen, T.; Kyriakidis, S.; Hu, H.; Langdon, S.P.; Harrison, D.J.; Bown, J. Systems Analysis of Drug-Induced Receptor Tyrosine Kinase Reprogramming Following Targeted Mono- and Combination Anti-Cancer Therapy. Cells 2014, 3, 563–591. [Google Scholar] [CrossRef]
- Weickhardt, A.J.; Price, T.J.; Chong, G.; Gebski, V.; Pavlakis, N.; Johns, T.G.; Azad, A.; Skrinos, E.; Fluck, K.; Dobrovic, A.; et al. Dual targeting of the epidermal growth factor receptor using the combination of cetuximab and erlotinib: Preclinical evaluation and results of the phase II DUX study in chemotherapy-refractory, advanced colorectal cancer. J. Clin. Oncol. Off. J. Am. Soc. Clin. Oncol. 2012, 30, 1505–1512. [Google Scholar] [CrossRef]
- Steiert, B.; Timmer, J.; Kreutz, C. L1 regularization facilitates detection of cell type-specific parameters in dynamical systems. Bioinformatics 2016, 32, i718–i726. [Google Scholar] [CrossRef] [Green Version]
- Dolejsch, P.; Hass, H.; Timmer, J. Extensions of L1 regularization increase detection specificity for cell-type specific parameters in dynamic models. BMC Bioinform. 2019, 20, 395. [Google Scholar] [CrossRef] [PubMed]
- Zou, H.; Hastie, T. Regularization and variable selection via the elastic net. J. R. Stat. Soc. Ser. B (Stat. Methodol.) 2005, 67, 301–320. [Google Scholar] [CrossRef] [Green Version]
- Niepel, M.; Hafner, M.; Pace, E.A.; Chung, M.; Chai, D.H.; Zhou, L.; Schoeberl, B.; Sorger, P.K. Profiles of Basal and stimulated receptor signaling networks predict drug response in breast cancer lines. Sci. Signal. 2013, 6, ra84. [Google Scholar] [CrossRef] [PubMed] [Green Version]
- Hellyer, N.J.; Kim, M.S.; Koland, J.G. Heregulin-dependent activation of phosphoinositide 3-kinase and Akt via the ErbB2/ErbB3 co-receptor. J. Biol. Chem. 2001, 276, 42153–42161. [Google Scholar] [CrossRef] [Green Version]
- Schulze, W.X.; Deng, L.; Mann, M. Phosphotyrosine interactome of the ErbB-receptor kinase family. Mol. Syst. Biol. 2005, 1, 2005.0008. [Google Scholar] [CrossRef] [Green Version]
- Feinberg, M. Chemical reaction network structure and the stability of complex isothermal reactors—I. The deficiency zero and deficiency one theorems. Chem. Eng. Sci. 1987, 42, 2229–2268. [Google Scholar] [CrossRef]
- Magnuson, B.; Ekim, B.; Fingar, D.C. Regulation and function of ribosomal protein S6 kinase (S6K) within mTOR signalling networks. Biochem. J. 2012, 441, 1–21. [Google Scholar] [CrossRef] [Green Version]
- Citri, A.; Yarden, Y. EGF–ERBB signalling: Towards the systems level. Nat. Rev. Mol. Cell Biol. 2006, 7, 505–516. [Google Scholar] [CrossRef]
- Waterman, H.; Alroy, I.; Strano, S.; Seger, R.; Yarden, Y. The C-terminus of the kinase-defective neuregulin receptor ErbB-3 confers mitogenic superiority and dictates endocytic routing. EMBO J. 1999, 18, 3348–3358. [Google Scholar] [CrossRef] [Green Version]
- Merkle, R.; Steiert, B.; Salopiata, F.; Depner, S.; Raue, A.; Iwamoto, N.; Schelker, M.; Hass, H.; Wäsch, M.; Böhm, M.E.; et al. Identification of Cell Type-Specific Differences in Erythropoietin Receptor Signaling in Primary Erythroid and Lung Cancer Cells. PLoS Comput. Biol. 2016, 12, e1005049. [Google Scholar] [CrossRef] [Green Version]
- Dougherty, M.K.; Müller, J.; Ritt, D.A.; Zhou, M.; Zhou, X.Z.; Copeland, T.D.; Conrads, T.P.; Veenstra, T.D.; Lu, K.P.; Morrison, D.K. Regulation of Raf-1 by direct feedback phosphorylation. Mol. Cell 2005, 17, 215–224. [Google Scholar] [CrossRef] [PubMed]
- Ikediobi, O.N.; Davies, H.; Bignell, G.; Edkins, S.; Stevens, C.; O’Meara, S.; Santarius, T.; Avis, T.; Barthorpe, S.; Brackenbury, L.; et al. Mutation analysis of 24 known cancer genes in the NCI-60 cell line set. Mol. Cancer Ther. 2006, 5, 2606–2612. [Google Scholar] [CrossRef] [PubMed] [Green Version]
- Lavoie, H.; Therrien, M. Regulation of RAF protein kinases in ERK signalling. Nat. Rev. Mol. Cell Biol. 2015, 16, 281–298. [Google Scholar] [CrossRef]
- Yao, Z.; Torres, N.M.; Tao, A.; Gao, Y.; Luo, L.; Li, Q.; de Stanchina, E.; Abdel-Wahab, O.; Solit, D.B.; Poulikakos, P.I.; et al. BRAF Mutants Evade ERK-Dependent Feedback by Different Mechanisms that Determine Their Sensitivity to Pharmacologic Inhibition. Cancer Cell 2015, 28, 370–383. [Google Scholar] [CrossRef] [PubMed] [Green Version]
- Moasser, M.M. The oncogene HER2: Its signaling and transforming functions and its role in human cancer pathogenesis. Oncogene 2007, 26, 6469–6487. [Google Scholar] [CrossRef] [Green Version]
- Hynes, N.E.; Lane, H.A. ERBB receptors and cancer: The complexity of targeted inhibitors. Nat. Reviews. Cancer 2005, 5, 341–354. [Google Scholar] [CrossRef]
- Joy, A.A.; Mackey, J.R. Adjuvant trastuzumab: Progress, controversies, and the steps ahead. Curr. Oncol. 2006, 13, 8–13. [Google Scholar] [CrossRef]
- Adlung, L.; Kar, S.; Wagner, M.C.; She, B.; Chakraborty, S.; Bao, J.; Lattermann, S.; Boerries, M.; Busch, H.; Wuchter, P.; et al. Protein abundance of AKT and ERK pathway components governs cell type-specific regulation of proliferation. Mol. Syst. Biol. 2017, 13, 904. [Google Scholar] [CrossRef]
- Junttila, T.T.; Akita, R.W.; Parsons, K.; Fields, C.; Lewis Phillips, G.D.; Friedman, L.S.; Sampath, D.; Sliwkowski, M.X. Ligand-independent HER2/HER3/PI3K complex is disrupted by trastuzumab and is effectively inhibited by the PI3K inhibitor GDC-0941. Cancer Cell 2009, 15, 429–440. [Google Scholar] [CrossRef] [Green Version]
- Long, R.E.; Knutsen, G.; Robinson, M. Myeloid hyperplasia in the SENCAR mouse: Differentiation from granulocytic leukemia. Environ. Health Perspect. 1986, 68, 117–123. [Google Scholar] [CrossRef]
- Garrett, T.P.J.; McKern, N.M.; Lou, M.; Elleman, T.C.; Adams, T.E.; Lovrecz, G.O.; Zhu, H.J.; Walker, F.; Frenkel, M.J.; Hoyne, P.A.; et al. Crystal structure of a truncated epidermal growth factor receptor extracellular domain bound to transforming growth factor alpha. Cell 2002, 110, 763–773. [Google Scholar] [CrossRef] [Green Version]
- Cho, H.S.; Leahy, D.J. Structure of the extracellular region of HER3 reveals an interdomain tether. Science 2002, 297, 1330–1333. [Google Scholar] [CrossRef] [PubMed]
- Li, S.; Schmitz, K.R.; Jeffrey, P.D.; Wiltzius, J.J.W.; Kussie, P.; Ferguson, K.M. Structural basis for inhibition of the epidermal growth factor receptor by cetuximab. Cancer Cell 2005, 7, 301–311. [Google Scholar] [CrossRef] [PubMed] [Green Version]
- Diwanji, D.; Trenker, R.; Thaker, T.M.; Wang, F.; Agard, D.A.; Verba, K.A.; Jura, N. Structures of the HER2-HER3-NRG1beta complex reveal a dynamic dimer interface. Nature 2021, 600, 339–343. [Google Scholar] [CrossRef] [PubMed]
- Xu, W.; Yuan, X.; Beebe, K.; Xiang, Z.; Neckers, L. Loss of Hsp90 association up-regulates Src-dependent ErbB2 activity. Mol. Cell. Biol. 2007, 27, 220–228. [Google Scholar] [CrossRef] [PubMed] [Green Version]
- Hazan, R.; Margolis, B.; Dombalagian, M.; Ullrich, A.; Zilberstein, A.; Schlessinger, J. Identification of autophosphorylation sites of HER2/neu. Cell Growth Differ. Mol. Biol. J. Am. Assoc. Cancer Res. 1990, 1, 3–7. [Google Scholar]
- Sorkin, A.; Waters, C.; Overholser, K.A.; Carpenter, G. Multiple autophosphorylation site mutations of the epidermal growth factor receptor. Analysis of kinase activity and endocytosis. J. Biol. Chem. 1991, 266, 8355–8362. [Google Scholar] [CrossRef]
- Wills, M.K.B.; Tong, J.; Tremblay, S.L.; Moran, M.F.; Jones, N. The ShcD signaling adaptor facilitates ligand-independent phosphorylation of the EGF receptor. Mol. Biol. Cell 2014, 25, 739–752. [Google Scholar] [CrossRef]
- Dokmanovic, M.; Wu, Y.; Shen, Y.; Chen, J.; Hirsch, D.S.; Wu, W.J. Trastuzumab-induced recruitment of Csk-homologous kinase (CHK) to ErbB2 receptor is associated with ErbB2-Y1248 phosphorylation and ErbB2 degradation to mediate cell growth inhibition. Cancer Biol. Ther. 2014, 15, 1029–1041. [Google Scholar] [CrossRef] [Green Version]
- Khajah, M.A.; Saleh, S.A.; Mathew, P.M.; Luqmani, Y.A. Differential Effect of Growth Factors on Invasion and Proliferation of Endocrine Resistant Breast Cancer Cells. PLoS ONE 2012, 7, e41847. [Google Scholar] [CrossRef]
- Salomon, D.S.; Brandt, R.; Ciardiello, F.; Normanno, N. Epidermal growth factor-related peptides and their receptors in human malignancies. Crit. Rev. Oncol. 1995, 19, 183–232. [Google Scholar] [CrossRef]
- Normanno, N.; Bianco, C.; De Luca, A.; Salomon, D.S. The role of EGF-related peptides in tumor growth. Front. Biosci. J. Virtual Libr. 2001, 6, D685–D707. [Google Scholar] [CrossRef] [PubMed] [Green Version]
- Nickerson, N.K.; Mill, C.P.; Wu, H.J.; Riese, D.J.; Foley, J. Autocrine-derived epidermal growth factor receptor ligands contribute to recruitment of tumor-associated macrophage and growth of basal breast cancer cells in vivo. Oncol. Res. 2013, 20, 303–317. [Google Scholar] [CrossRef] [PubMed] [Green Version]
- Roswall, P.; Bocci, M.; Bartoschek, M.; Li, H.; Kristiansen, G.; Jansson, S.; Lehn, S.; Sjölund, J.; Reid, S.; Larsson, C.; et al. Microenvironmental control of breast cancer subtype elicited through paracrine platelet-derived growth factor-CC signaling. Nat. Med. 2018, 24, 463–473. [Google Scholar] [CrossRef] [PubMed]
- De, P.; Hasmann, M.; Leyland-Jones, B. Molecular determinants of trastuzumab efficacy: What is their clinical relevance? Cancer Treat. Rev. 2013, 39, 925–934. [Google Scholar] [CrossRef] [PubMed]
- Collins, D.M.; O’Donovan, N.; McGowan, P.M.; O’Sullivan, F.; Duffy, M.J.; Crown, J. Trastuzumab induces antibody-dependent cell-mediated cytotoxicity (ADCC) in HER-2-non-amplified breast cancer cell lines. Ann. Oncol. Off. J. Eur. Soc. Med Oncol. 2012, 23, 1788–1795. [Google Scholar] [CrossRef]
- Christopoulos, P.F.; Msaouel, P.; Koutsilieris, M. The role of the insulin-like growth factor-1 system in breast cancer. Mol. Cancer 2015, 14, 43. [Google Scholar] [CrossRef] [Green Version]
- Ho-Yen, C.M.; Jones, J.L.; Kermorgant, S. The clinical and functional significance of c-Met in breast cancer: A review. Breast Cancer Res. BCR 2015, 17, 52. [Google Scholar] [CrossRef] [Green Version]
- Iorns, E.; Turner, N.C.; Elliott, R.; Syed, N.; Garrone, O.; Gasco, M.; Tutt, A.N.J.; Crook, T.; Lord, C.J.; Ashworth, A. Identification of CDK10 as an important determinant of resistance to endocrine therapy for breast cancer. Cancer Cell 2008, 13, 91–104. [Google Scholar] [CrossRef] [Green Version]
- Borgoni, S.; Sofyalı, E.; Soleimani, M.; Wilhelm, H.; Müller-Decker, K.; Will, R.; Noronha, A.; Beumers, L.; Verschure, P.J.; Yarden, Y.; et al. Time-Resolved Profiling Reveals ATF3 as a Novel Mediator of Endocrine Resistance in Breast Cancer. Cancers 2020, 12, 2918. [Google Scholar] [CrossRef]
- Fusco, N.; Malapelle, U.; Fassan, M.; Marchiò, C.; Buglioni, S.; Zupo, S.; Criscitiello, C.; Vigneri, P.; Dei Tos, A.P.; Maiorano, E.; et al. PIK3CA Mutations as a Molecular Target for Hormone Receptor-Positive, HER2-Negative Metastatic Breast Cancer. Front. Oncol. 2021, 11, 644737. [Google Scholar] [CrossRef] [PubMed]
- Tarantino, P.; Hamilton, E.; Tolaney, S.M.; Cortes, J.; Morganti, S.; Ferraro, E.; Marra, A.; Viale, G.; Trapani, D.; Cardoso, F.; et al. HER2-Low Breast Cancer: Pathological and Clinical Landscape. J. Clin. Oncol. Off. J. Am. Soc. Clin. Oncol. 2020, 38, 1951–1962. [Google Scholar] [CrossRef] [PubMed]
- Kaschek, D.; Mader, W.; Fehling-Kaschek, M.; Rosenblatt, M.; Timmer, J. Dynamic Modeling, Parameter Estimation, and Uncertainty Analysis in R. J. Stat. Softw. 2019, 88, 1–32. [Google Scholar] [CrossRef] [Green Version]
- Malik-Sheriff, R.S.; Glont, M.; Nguyen, T.V.N.; Tiwari, K.; Roberts, M.G.; Xavier, A.; Vu, M.T.; Men, J.; Maire, M.; Kananathan, S.; et al. BioModels-15 years of sharing computational models in life science. Nucleic Acids Res. 2020, 48, D407–D415. [Google Scholar] [CrossRef] [Green Version]
- Schmiester, L.; Schälte, Y.; Bergmann, F.T.; Camba, T.; Dudkin, E.; Egert, J.; Fröhlich, F.; Fuhrmann, L.; Hauber, A.L.; Kemmer, S.; et al. PEtab—Interoperable specification of parameter estimation problems in systems biology. PLoS Comput. Biol. 2021, 17, e1008646. [Google Scholar] [CrossRef]


Publisher’s Note: MDPI stays neutral with regard to jurisdictional claims in published maps and institutional affiliations. |
© 2022 by the authors. Licensee MDPI, Basel, Switzerland. This article is an open access article distributed under the terms and conditions of the Creative Commons Attribution (CC BY) license (https://creativecommons.org/licenses/by/4.0/).
Share and Cite
Kemmer, S.; Berdiel-Acer, M.; Reinz, E.; Sonntag, J.; Tarade, N.; Bernhardt, S.; Fehling-Kaschek, M.; Hasmann, M.; Korf, U.; Wiemann, S.; et al. Disentangling ERBB Signaling in Breast Cancer Subtypes—A Model-Based Analysis. Cancers 2022, 14, 2379. https://doi.org/10.3390/cancers14102379
Kemmer S, Berdiel-Acer M, Reinz E, Sonntag J, Tarade N, Bernhardt S, Fehling-Kaschek M, Hasmann M, Korf U, Wiemann S, et al. Disentangling ERBB Signaling in Breast Cancer Subtypes—A Model-Based Analysis. Cancers. 2022; 14(10):2379. https://doi.org/10.3390/cancers14102379
Chicago/Turabian StyleKemmer, Svenja, Mireia Berdiel-Acer, Eileen Reinz, Johanna Sonntag, Nooraldeen Tarade, Stephan Bernhardt, Mirjam Fehling-Kaschek, Max Hasmann, Ulrike Korf, Stefan Wiemann, and et al. 2022. "Disentangling ERBB Signaling in Breast Cancer Subtypes—A Model-Based Analysis" Cancers 14, no. 10: 2379. https://doi.org/10.3390/cancers14102379